a model of data maturity to support predictive analytics ... · a model of data maturity to support...
TRANSCRIPT

A Model of Data Maturity to Support Predictive Analytics,
Part Deux
Dan O’MalleyUniversity of Virginia Health System
5/4/2017

Speaker
Daniel O’Malley, MS
Director, Data Operations
University of Virginia Health System

Conflict of Interest
Daniel O’Malley
Has no real or apparent conflicts of
interest to report.

Agenda
• Introduction
• Problem Statement
• Industry Standards / Current Literature
• Data Team Overview / Background
• University of Virginia’s Data Model and Architectural
Design
• Implications for Practice
• Questions

Learning Objectives
• Describe the data maturity progression that an
organization undergoes as it becomes data-
driven
• List the data architecture activities that support
the data maturity progression journey
• Recognize the various benefits that are
achieved as an organization progresses toward
agile analytics

Introduction
• Use of data within an organization follows a maturity
progression:
• Operational / retrospective -> Strategic / prospective
• Foundational components must be present before
advancing, including:
• Data warehouses / data marts / reporting tables
• Analysis cubes
• Intra-day data extraction
• Advanced data modeling
Problem Statement
The journey toward data use maturity requires expert support
and an advanced data infrastructure that increasingly must deliver real-time analysis.

Operational Use Cases
• Hourly Throughput Dashboard
• Infectious Disease Dashboard
• CEO Daily Volumes Dashboard
• NICU Dashboard
• Decompensating Patient

Operational Use Cases

Industry Standards / Literature
There are many, many maturity models. Just about every
major vendor has a maturity model. Some exemplar
articles include:
• CMMI (Capability Maturity Model Integration) – Carnegie Mellon / CMMI Institute
• Sen, A., Ramamurthy, K., & Sinha, A. P. (2012). https://doi.org/10.1109/TSE.2011.2
• Danciu, I., Cowan, J. D., Basford, M., Wang, X., Saip, A., Osgood, S., … Harris, P. A. (2014). https://doi.org/10.1016/j.jbi.2014.02.003
• Yoo, S., Kim, S., Lee, K.-H., Jeong, C. W., Youn, S. W., Park, K. U., … Hwang, H. (2014). https://doi.org/10.1016/j.ijmedinf.2014.04.001

Data Team Overview / Background
Responsible for the data tier of the organization’s analytics
infrastructure, which includes various data repositories and the
enterprise data warehouse
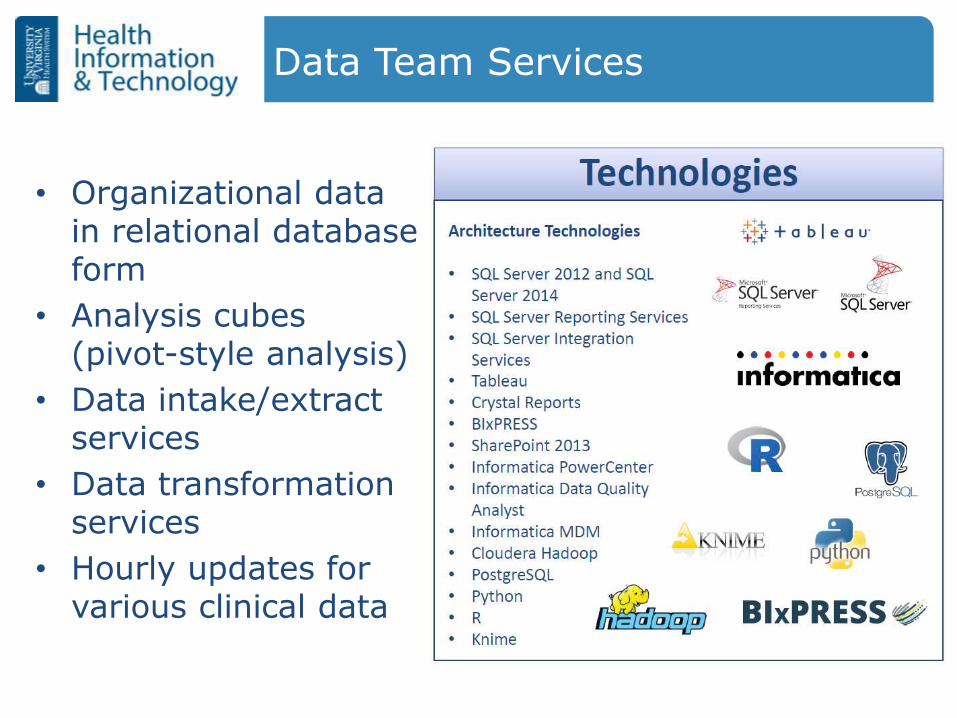
Data Team Services
• Organizational data in relational database form
• Analysis cubes (pivot-style analysis)
• Data intake/extract services
• Data transformation services
• Hourly updates for various clinical data

UVa’s Data Model and Design
• Our model and architecture:
• Developed organically (3 stages of data
tier maturity)
• Based on the realities of our reporting
requests
• Time (latency) is a major dimension /
consideration

UVa’s Data Model and Design
Time, time, time…. (Or, should I say, latency, latency, latency)… Why is it so
important?
• Data has an expiration date
• Clinical environment / urgency
**The architectural design must accommodate and deeply integrate the time
dimension

UVa’s Data Model and Design
• Clinical data
• Financial data
• Various other domains of data
• Various data types and constructs

UVa’s Data Model and Design
• Complex design
• Multiple data models
• Multiple data refresh
latencies
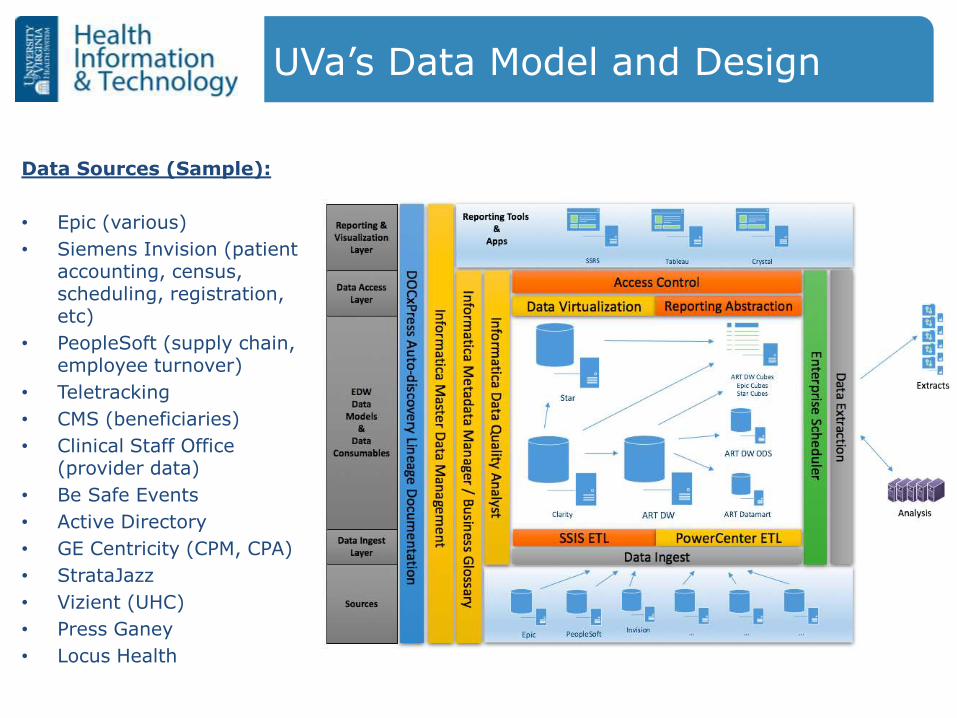
UVa’s Data Model and Design
Data Sources (Sample):
• Epic (various)
• Siemens Invision (patient accounting, census, scheduling, registration, etc)
• PeopleSoft (supply chain, employee turnover)
• Teletracking
• CMS (beneficiaries)
• Clinical Staff Office (provider data)
• Be Safe Events
• Active Directory
• GE Centricity (CPM, CPA)
• StrataJazz
• Vizient (UHC)
• Press Ganey
• Locus Health

UVa’s Data Model and Design
• Multiple refresh rates are
complex to manage, hard to
conceptualize

UVa’s Data Model and Design
• Daily processing increases rapidly
• It is harder today than yesterday
• Complexity increases over time

UVa’s Data Model and Design
• Complex scheduling needs
• Need to monitor key data processing control limits
• Intervene when processes are outside of control limits
• Proactive monitoring

UVa’s Data Model and Design
• Three distinct stages
• Each stage builds upon the previous stages
• Change in focus from past to present to future

UVa’s Data Model and Design
• 600 hours of senior database administrator/data engineering support
• Data model understanding of the business unit or service line
• Reporting tables and/or data mart creation to support required performance
• Analysis cubes that provide drill down and pivot-style interactive analysis

UVa’s Data Model and Design
• 300 hours of senior database administrator/data engineering support
• Creation of a business unit or service line ODS
• Optimization of the data pipeline to support a rapid data refresh rate and the data subset
• The formation of basic data governance processes and management

UVa’s Data Model and Design
• 100 hours of senior database administrator/data engineering support
• Data format and structure changes to support advanced data modeling
• Custom development to support advanced data techniques
• Advanced data governance methodology utilizing MDM software

UVa’s Data Model and Design
• Data maturity progression is cumulative
• Collaborative initiative between customers, data engineering team, and reporting team
***Estimates are only the data engineering team’s effort
Our Successes
• Rapid access to clinical data from electronic health record
• Flexible data tier
• Helped to foster the organization’s shift to data-driven decision-making
• Customer demand

So What? Why is this important?
• Clinicians and leaders need this data and will get it somehow
• Spreadsheets are not your friends
• ‘Analyst’ can have many meanings from department to department
• Unified organizational view?
• Metadata management?
• A reliable data tier is rapidly becoming imperative

Implications - Recommendations
• Focus on the quality of the data pipeline first
• As data becomes more and crucial, users must learn to first trust the data
• Data production pipeline stability
• Accurate data is not useful if the users cannot access it
• Strive for data model extensibility
• Plan for changes to the data architecture—this is one sign of success!

Implications - Recommendations
• Focus on matching the source systems’ data, even if they are wrong!
• The data warehouse should not be the place where ‘dirty’ data is fixed
• Begin profiling your data and tracking it over time.
• Key to understanding your data quality current state and progressing to higher quality data

Implications - Recommendations
• Do the hard work of data modeling first
• Take time to model your data and use cases in order to fully support your customers
• Don’t just create rapidly refreshing copies of source systems
• A system-agnostic data model will save time in the future (e.g., system changes/vendor changes)

Implications - Difficulties
• Victim of our own success?
• Highly dependent on source systems (and their availability / uptime)
• Complex data transformations, with a large number of steps
• Nuanced reporting problems (data mismatch)
• Many of the most important reports need to be ready early in the morning, when there is the least amount of processing capacity/time
