a model of liver regeneration - scientific clearing house
TRANSCRIPT

3926 Biophysical Journal Volume 96 May 2009 3926–3935
A Model of Liver Regeneration
Leon A. Furchtgott,† Carson C. Chow,‡ and Vipul Periwal‡*†Department of Physics, Princeton University, Princeton, New Jersey; and ‡Laboratory of Biological Modeling, National Institute of Diabetes andDigestive and Kidney Diseases, National Institutes of Health, Bethesda, Maryland
ABSTRACT The network of interactions underlying liver regeneration is robust and precise with liver resections resulting incontrolled hyperplasia (cell proliferation) that terminates when the liver regains its lost mass. The interplay of cytokines andgrowth factors responsible for the inception and termination of this hyperplasia is not well understood. A model is developedfor this network of interactions based on the known data of liver resections. This model reproduces the relevant publisheddata on liver regeneration and provides geometric insights into the experimental observations. The predictions of this modelare used to suggest two novel strategies for speeding up liver mass recovery and a strategy for enabling liver mass recoveryin cases where a resection leaves <20% of the liver that would otherwise result in complete loss of liver mass.
INTRODUCTION
The liver’s ability to regenerate has been known since
ancient times and has been the subject of scientific study
since the early 20th century (1). After a partial hepatectomy
(removal of a section of the liver), liver cells reenter the cell
cycle and replicate until the liver recovers its lost mass,
within a precision of 10% (2). Although numerous studies
have investigated the molecular mechanisms of liver regen-
eration, including the roles of cytokines, growth factors,
matrix remodeling, and metabolic signals (3,4), several basic
questions remain. How does the liver integrate signals from
different signaling pathways and from metabolic stresses,
including detoxification functions, in order to control cell
replication? How does liver regeneration stop once the liver
reaches its original mass, and how does the liver avoid an
oscillatory cycle of overgrowth and apoptosis? This article
proposes a simple mathematical model for liver regeneration
to answer these questions.
In a healthy adult liver, only ~1 hepatocyte in 20,000
(0.005%) is in the cell cycle (5). The rest are quiescent, in
the G0 state. After partial hepatectomy, hepatocytes reenter
the cell cycle by going from the G0 state to the G1 phase.
Cells in the early G1 phase progress, driven by growth
factors, through the G1/S restriction point, after which cells
are committed to progress to mitosis, even in the absence of
the G1 growth factors. However, cells in early G1 phase that
have not reached the restriction point can return to quies-
cence in the absence of growth factors (6). Following Fausto
and Riehle (3), we consider three subpopulations of hepato-
cytes in our model: quiescent cells (Q), primed cells (P), and
replicating cells (R).
In the priming phase of liver regeneration, multiple imme-
diate-early genes such as c-fos and c-jun are induced (7).
These immediate-early genes (IE) take liver cells from the
G0 phase to the G1 phase of the cell cycle. The level of
Submitted October 2, 2008, and accepted for publication January 8, 2009.
*Correspondence: [email protected]
Editor: Alexander Mogilner.
� 2009 by the Biophysical Society
0006-3495/09/05/3926/10 $2.00
expression of immediate-early genes, in turn, is controlled
in large part by a network of cytokines (8,9). Levels of tumor
necrosis factor (TNF) increase after partial hepatectomy (10).
TNF binds to its receptor on Kupffer cells, which activates
the transcription factor nuclear factor-kB, which leads to
increased interleukin-6 (IL-6) transcription and production.
IL-6 binds to its receptor on hepatocytes. The receptor inter-
acts with gp130 and activates two Janus kinase (JAK)
proteins. JAK phosphorylates monomeric signal transducer
and activator of transcription 3 (STAT3), which then imme-
diately homodimerizes to the active form (11). JAK also acti-
vates the mitogen-activated protein kinase pathway. STAT3
promotes transcription of many immediate-early genes,
including suppressor of cytokine signaling 3 (SOCS3),
which binds to JAK proteins and blocks further signaling
through competitive inhibition with inactive STAT3 (12).
Thus, the negative feedback mechanism of SOCS3 ensures
an initial spike in transcription, after which quiescent cells
can no longer enter the cell cycle.
Once cells have entered the G1 phase, their progression
through the cell cycle to the proliferating phase is driven
by growth factors (GF). The most important growth factor
for liver regeneration is hepatocyte growth factor (HGF),
which binds to the c-met receptor (13,14). Pro-HGF, an inac-
tive form of HGF, is depleted from the extracellular matrix
during the first three hours after partial hepatectomy, after
which it is produced by nonparenchymal cells (15). Uroki-
nase-type plasminogen activator activates pro-HGF and is
detected within the first 5 min after partial hepatectomy
(16). Other growth factors include epidermal growth factor
(EGF) (17), transforming growth factor a (18), and heparin-
binding EGF-like growth factor (HB-EGF) (19). In the
absence of growth factors, cells return to quiescence. Once
cells are in the replicating phase, the length of the cell cycle
is fairly fixed.
The extracellular matrix (ECM) plays an important role in
the regulation of liver regeneration (20). After partial hepa-
tectomy, the ECM is degraded by matrix metalloproteinases
doi: 10.1016/j.bpj.2009.01.061
Liver Regeneration 3927
(MMP), which are activated by TNF and other cytokines
(21). The ECM is then produced again by nonparenchymal
cells after most hepatocytes have divided. The ECM has
the capacity to anchor growth factors to itself, thus prevent-
ing them from being activated. This constitutes an indirect
inhibition of cell proliferation. In addition, the ECM may
be directly responsible for replicating cells returning to
quiescence through mitoinhibitory signaling in conjunction
with integrins or transforming growth factor b1 (4,20).
The causes of the initial rise in activity of cytokines and
growth factors remains a mystery. The volume of blood in
the portal vein increases threefold after 2/3 partial hepatec-
tomy. It has been suggested that the increase in shear stress
after partial hepatectomy could trigger regeneration by acti-
vating urokinase-type plasminogen activator (22). Fluid
shear stress has also been shown to stimulate mitogen-acti-
vated protein kinases in endothelial cells (23). Portal blood
flow has been proposed as a hepatostat, whereby increases
and decreases in portal pressure would control the stimuli
for liver growth (4). However, blood pressure cannot be
the only factor initiating regeneration, because liver growth
has been stimulated in parabiotic animals; these have a surgi-
cally united circulation, in which the portal pressure in the
animal with the intact liver is not the same as the blood pres-
sure in the animal with the removed liver (24,25).
Another hypothesis is that elements of the innate immune
system are responsible for the start trigger. Increased portal
flow may cause an increase in lipopolysaccharide (LPS),
which is produced in the gut. LPS interacts with the LPS
receptor on Kupffer cells and may stimulate production of
TNF and IL-6 (26).
Increases in the concentration of amino acids in the blood
may also facilitate liver regeneration by upregulating
mammalian-target-of-rapamycin (mTOR) and increasing
protein translation. Amino-acid deprivation and treatment
with rapamycin, an inhibitor of mTOR, have been shown
to inhibit hepatocyte proliferation (27,28), though this inhibi-
tion is not specific to liver regeneration.
Although the exact nature of the start signal is not clear, it
appears that it involves the metabolic load upon the liver,
whether this manifests itself in mechanical stress or increased
concentrations of nutrients and innate immune system compo-
nents or increased detoxification demands. In our model, we
take the trigger for the production of TNF and growth factors
to be the metabolic load (including detoxification) per hepato-
cyte M/N, where M is a constant load that depends on the
entire body’s metabolic needs, and N is the total number of
cells. This supposition entails that larger partial hepatectomies
will result in larger metabolic loads and faster regenerative
responses. This has indeed been observed: the expression of
immediate-early protooncongenes increases with the size of
the partial hepatectomy (except for partial hepatectomies
larger than 90%, which result in apoptosis (29)).
Finally, it has been observed that hepatectomies>75% are
lethal (30). This may be due to excessive detoxification stress
on the remaining hepatocytes, with contributions from an
overincrease in the shear stress and pressure in the portal
vein (31), which may also affect the immune response
through Kupffer cell dysfunction (30).
To better understand liver regeneration, we have developed
a model that considers cells in quiescent, primed, and repli-
cating phases, and in which the crucial quantity is the meta-
bolic load per cell. Our model confirms and explains much
of the liver regeneration behavior that has been observed until
this point. It results in a simple geometric picture from which
we make predictions that suggest strategies for speeding up
liver mass recovery and for enabling liver recovery in cases
where an overly small liver is liable to fail.
METHODS
Liver regeneration is not, strictly speaking, regeneration: The resected
lobe(s) of the liver do not reappear. Instead, the remaining lobe(s) of the liver
grow until the entire liver has a mass equal to the mass of the original liver.
Therefore, our model will assume that the compensatory hyperplasia occurs
homogeneously throughout the remaining lobe(s), a good first approxima-
tion. With this assumption, the equations of the model are ordinary differen-
tial equations.
Cellular equations
The rates of change of cell number are modeled in terms of signaling mole-
cules interacting with cells in each state Q, P, and R. The simplest assump-
tion for these reactions is that they proceed following the law of mass action.
As such, the transition rate between states is proportional to the number
of signaling molecules and to the fraction of cells in the state affected by
the signal. This leads to second-order steps in the transition equations.
Higher-order interactions may also be present involving multiple signaling
molecules binding to a cell in principle, but we found excellent agreement
with experimental observations using just second-order mass action kinetics
for cellular transitions due to signaling events. Such higher-order interac-
tions could arise, for example, from saturation-binding regulated kinetics
when expanded in a perturbation series. However, the agreement we found
with experimental observations using just the lowest second-order form
suggests that the number of receptors is large enough to allow the neglect
of higher-order terms. The signals themselves have nonlinear rates of
increase and decrease governed by Michaelis-Menten dynamics, and are
given in the next subsection.
The equations for different cell types are
d
dtQ ¼ �kQ
��IE�� ½IE�0
�Q þ kR½ECM�R
þ kreqsreqð½GF�ÞP� kapsapðM=NÞQ; (1)
d
dtP ¼ kQ
��IE�� ½IE�0
�Q� kP
��GF�� ½GF�0
�P
� kreqsreqð½GF�ÞP� kapsapðM=NÞP; (2)
d
dtR ¼ kP
��GF�� ½GF�0
�P� kR½ECM�R þ kprolR
� kapsapðM=NÞR; (3)
where [IE] – [IE]0 and [GF] – [GF]0 are the excess levels of immediate-early
genes and growth factors; [ECM] is the size of the extracellular matrix; kQ,
kP, and kR are rates of progression out of Q, P, and R; kprol, kreq, and kap are
Biophysical Journal 96(10) 3926–3935

3928 Furchtgott et al.
the rates of proliferation, requiescence, and apoptosis; sreq and sap are
sigmoidal functions describing the threshold for requiescence and apoptosis;
and N ¼ Q þ P þ R. [IE], [GF], and [ECM] are considered as number of
molecules per cell, normalized to stable state values.
This scheme is a simplification in that we are reducing all of the transitions
between different cellular states to depend on the levels of three elements. In
reality, kQ[IE] is a short-hand notation forP
i kQ,i [IEi]: There are numerous
factors IEi with different coefficients ki, all performing the same function of
priming quiescent cells.
Molecular equations
The main molecular pathways can be represented by the following equa-
tions, which consider seven elements, each of which represents multiple
compounds: TNF, JAK, STAT3, SOCS3, immediate early genes (IE),
growth factors (GF), and ECM. In addition to the relations between
elements, we give each element a half-life k. Several molecular reactions
in these pathways are enzyme-mediated and occur over timescales much
shorter than changes in enzyme concentrations. As such, following the
standard quasi-steady-state approximation, we assume Michaelis-Menten
kinetics for these reactions.
Under normal physiological conditions, there are low constant levels of
each of the seven factors described in Eqs. 4–10. We normalize the number
of molecules to these levels, so that in the stable state, with an intact liver,
each element has a number of 1. To use these units, however, we need to
have constant production or degradation terms k1.k7 in each equation, so
that the time-derivative of each element is 0 under normal conditions. Bio-
logically, these terms simply correspond to homeostatic influxes or outfluxes
of elements in and out of the liver and have nothing to do with the liver
regeneration mechanisms.
TNF, which represents various inflammatory cytokines including TNF and
IL-6, is produced in response to the excess metabolic load. TNF activates the
IL-6 receptor, which interacts with the two gp-130 subunits and activates two
JAK proteins. We represent the entire activated gp130-JAK complex as JAK,
which should not be confused with individual JAK proteins:
d
dt½TNF� ¼ kTNF
M
N� VJAK½TNF��
TNF�þ kJAK
M
� kTNF½TNF� þ k1 ;
(4)
d
dt½JAK� ¼ VJAK½TNF��
TNF�þ kJAK
M
� kJAK½JAK� þ k2 : (5)
Active, homodimeric STAT3 (i.e., STAT3) forms when two monomeric
STAT3s (i.e., proSTAT3) are phosphorylated by the two activated JAK
proteins in the gp130-JAK complex. The two phosphorylated STAT3s then
immediately homodimerize—in fact, the two steps are almost simultaneous
(11). The reaction occurs at a rate VST3 and with Michaelis-Menten constant
kMST3. ProSTAT3 also competes with SOCS3, which raises kM
ST3 by a factor
of 1þ[SOCS3]/KISOCS3, where KI
SOCS3 is the dissociation constant of
SOCS3: KISOCS3 ¼ [SOCS3][JAK] / [SOCS3 $ JAK] at equilibrium (32).
STAT3 activation requires proSTAT3 binding to both JAK proteins, so
SOCS3 binding to only one JAK protein inhibits STAT3 formation. We
assume that the number of molecules of monomeric STAT3 remains constant:
d
dt½STAT3� ¼ VST3½JAK�½proSTAT3�2
½proSTAT3�2þ kST3M
�1 þ ½SOCS3�=kSOCS3
I
�
� VIE½STAT3��STAT3
�þ kIE
M
� VSOCS3½STAT3��STAT3
�þ kSOCS3
M
� kST3½STAT3� þ k3:
(6)
Biophysical Journal 96(10) 3926–3935
STAT3 activates immediate early genes IE and SOCS3, thereby creating
a negative feedback, ensuring a spike of IE:
d
dt½SOCS3� ¼ VSOCS3
½STAT3��STAT3
�þ kSOCS3
M
� kSOCS3½SOCS3� þ k4;
(7)
d
dt½IE� ¼ VIE
½STAT3��STAT3
�þ kIE
M
� kIE½IE� þ k5: (8)
The ECM is degraded by TNF—it is an initial degradation, because levels of
TNF quickly decrease—and is produced at a constant rate k6 per hepatocyte
by nonparenchymal cells:
d
dt½ECM� ¼ �kdeg½TNF�½ECM� � kECM½ECM� þ k6: (9)
Growth factors are produced in response to the excess metabolic load;
they are taken up by the ECM at a rate kup:
d
dt½GF� ¼ kGF
M
N� kup½GF�½ECM� � kGF½GF� þ k7: (10)
A set of parameters for the model, along with references, is found in
Tables 1–3. Parameters were chosen assuming a partial hepatectomy of
2/3 (fraction of liver remaining ¼ 0.32) in the rat. Although the model
does not represent individual molecules but rather groups of molecules
that perform the same function, values that were suggested by the scientific
literature for sample molecules were used as parameters whenever possible.
Equations were integrated using MatLab’s ode15s solver (The Math-
Works, Natick, MA).
RESULTS
Liver regeneration model
Our model considers three populations of cells: quiescent (Q),
primed (P), and replicating (R). Only cells in the R phase can
proliferate. We take the rate of transition of Q cells to P cells to
be proportional to the level of expression of immediate-early
genes (IE). These in turn are controlled by a network of cyto-
kines triggered by TNF, itself produced proportionally to the
metabolic load per cell M/N. The rate of transfer of cells from
the P phase to the R phase is proportional to the concentration
of growth factors (GF), which are also produced proportion-
ally to the metabolic load per cell. In the absence of growth
factors, cells return from the P phase to the Q phase at a
constant requiescence rate. R cells have a constant replicating
term. The rate of transition from R to Q is proportional to the
density of the ECM, which is degraded by TNF. Growth
factors are inactivated by the ECM. We also include an
apoptosis term in our equations for Q, P, and R cells that is
activated by excess metabolic stress per cell.
The model is concerned with the interplay between large
groups of factors (growth factors and cytokines), as opposed
to the actions of particular factors. Of the many experiments
involving knockout mice and rats, only a single factor, hepa-
tocyte growth factor (HGF), has been found to be essential to
liver regeneration (14). Most knockout trials show only a delay
in regeneration (20), suggesting that multiple pathways often

Liver Regeneration 3929
perform a similar function. Although the model considers the
number of molecules per cell of seven factors in addition to the
levels of the three cell types, these numbers should be taken to
represent large groups of factors as opposed to specific factors.
For example, k[GF] should be taken as a short-hand forPi ki[GFi]: each individual growth factor has its own number
of molecules and its own rate coefficient.
The full details of the model can be found in Methods. The
model parameters were chosen based on the known phenom-
enology of 2/3 liver resections.
Fig. 1 is a schematic of the interactions included in the
model.
Liver regeneration profiles
The modeled responses of the liver after partial hepatecto-
mies of 85%, 68%, 45%, and 25% are shown in Fig. 2.
TABLE 1 Model parameters 1
Comment/Reference
N Fraction of liver mass. N ¼ 1
for the intact liver.
M 16.8 Metabolic load.
kTNF 1.5 TNF production. Changes
in TNF protein levels have
not been detected after partial
hepatectomy (see (39) and
references within). An increase
of z20-fold has been measured
after liver injury (40). The entire
priming phase ends 5–6 h
after partial hepatectomy (12).
kTNF 9 � 10�1 TNF mRNA has a half-life of 45 min
after stimulation with LPS (41).
VJAK 2 � 104 JAK activation.
kMJAK 1 � 104
kJAK 4 � 10�1 JAK degradation based on
Siewert et al. (42).
[proSTAT3] 2 Concentration of monomeric STAT3.
VST3 7.5 � 102 STAT3 levels increase 30-fold after
2/3 partial hepatectomy (43). STAT3
degradation based on Siewert et al. (42).
kMST3 4 � 10�1
kST3 1 � 10�1
VSOCS3 2.4 � 104 SOCS3 is induced 40-fold after
2/3 partial hepatectomy (12). SOCS3
degradation based on Siewert et al. (42).
kMSOCS3 7 � 10�4
kSOCS3 4 � 10�1
kISOCS3 1.5 � 10�2 SOCS3 inhibition constant.
VIE 2.5 � 102 Typical IE gene expression
levels increase 20- to 50-fold (7).
c-fos mRNA has a very
short half-life (<10 min) (44).
kMIE 18
kIE 5
kdeg 7 ECM degradation by
TNF-activated MMPs.
kECM 33 ECM degradation.
Units: time in hours, numbers normalized to stable-state numbers, cell
populations as fractions of normal liver size.
The model successfully reproduces the significant features
of liver regeneration after a 2/3 partial hepatectomy (Fig. 2 B).
In addition, the model correctly predicts liver regeneration
behavior after other degrees of partial hepatectomy. Partial
hepatectomies >75% (Fig. 2 A) result in liver failure, as
described in Panis et al. (30). Partial hepatectomies between
40% and 70% (Fig. 2 C) have a fairly rapid regenerative
response, with a well-defined peak in proliferative activity,
as found by Bucher and Swaffield (33). Partial hepatectomies
<40% (Fig. 2 D) have a much slower regenerative response,
with a low, fairly constant level proliferative activity
TABLE 2 Model parameters 2
Comment/Reference
kGF 1.13 � 10�1 GF production, degradation, and uptake
of GF by the ECM. After 2/3 partial
hepatectomy, HGF increases 20-fold,
peaking at 12 h; other growth factors
increase less and peak at 24 h (18,19,45).
kGF 2.3 � 10�1
kup 6 � 10�2
kQ 7 � 10�3 >90% of cells enter the cell cycle
after 2/3 partial hepatectomy (46).
kP 4.4 � 10�3 The number of cells changes as described
in Brues et al. (38); in particular, after 2/3
partial hepatectomy, the number of cells
doubles within three days. The original
mass is fully recovered after 7–10 days.
kR 5.4 � 10�2
kprol 2.0 � 10�2 The length of the mitotic cycle
is between 30 and 40 h (47).
kreq 1 � 10�1 Requiescence rate. Without growth
factors, primed cells return quickly
to quiescence between 24 and 48 h
after administration of TNF (48).
qreq 8 sreqð½GF�Þ ¼ 0:5
�1þ tanh
�qreq�½GF�
breq
��.
Increasing qreq leads to earlier requiescence
and slower growth and vice versa. Values
of qreq between 5 and 12 give reasonable
behavior.
breq 3
kap 1 � 10�2 Apoptosis rate. Liver failure occurs within
48 h of massive hepatectomy (49).
qap 9 � 10�3 sapðM=NÞ ¼ 0:5�
1þ tanh�
qap�N=Mbap
��. A
75% partial hepatectomy should not
lead to liver failure, although larger
ones should (30).
bap 4.5 � 10�3
Units: time in hours, numbers normalized to stable-state numbers, cell
populations as fractions of normal liver size.
TABLE 3 Model parameters 3
k1 �22.30
k2 �1.60
k3 2.39 � 104
k4 2.40 � 104
k5 �8.16
k6 40
k7 �1.60
Units: time in hours, numbers normalized to stable-state numbers, cell
populations as fractions of normal liver size.
Biophysical Journal 96(10) 3926–3935

3930 Furchtgott et al.
throughout the response (33). Regenerative growth is signif-
icantly impaired (19). Finally, for partial hepatectomies
<10%, there is an extremely minute regenerative response;
for a 5% hepatectomy, the total number of cells only increases
by 0.5% after 300 h (data not shown). This corresponds to
what MacDonald et al. (34) describe as ‘‘a threshold amount
of liver, of ~9–12%, which must be removed to elicit a statis-
tically significant response in DNA synthesis.’’ The model
thus agrees with the different regimes of liver regeneration
that have previously been described.
Fig. 3 shows the time required to recover half of the lost
mass as a function of the fraction of liver remaining after
partial hepatectomy. The different regimes described in
Fig. 2 are readily recognizable. Partial hepatectomies leaving
<25% lead to liver failure and those leaving between 25 and
60% have a fairly short time of regeneration. Hepatectomies
removing <40% have a much longer time of regeneration,
and those leaving >80% have very little growth even after
long periods of time.
Mutant analysis
Table 4 shows the half-regeneration times for different
mutants of the liver regeneration model. Since liver regenera-
tion is a complex process, with multiple equivalent pathways,
experiments that knock out one particular gene only succeed,
FIGURE 1 Schematic of liver regeneration model. The
left side shows molecular interactions, whereas the right
side represents the cellular kinetics. Molecular interactions:
TNF is produced by Kupffer cells in response to the
increased metabolic load and leads to the activation of
IL-6. IL-6 binds to its receptor on hepatocytes and activates
JAK. JAK phosphorylates the transcription factor STAT3,
which dimerizes and induces the transcription of multiple
immediate-early genes (IE), as well as SOCS3, which binds
to JAK and inhibits STAT3 phosphorylation. TNF degrades
the extracellular matrix (ECM), which is produced by stel-
late cells. Growth factors GF are also produced in response
to the metabolic load (HGF is produced primarily by stellate
cells). The ECM binds and inactivates growth factors.
Cellular kinetics: Quiescent cells Q are taken to the primed
state P through the action of IE. Primed cells can either prog-
ress to the replicating state R or return to the quiescent state.
Replicating cells proliferate at a constant rate and return to
the quiescent state through the action of the ECM.
A
C
B
D
FIGURE 2 Liver regeneration after varying degrees of
partial hepatectomy. The diagonal, cross-hatched, and
blue solid areas represent quiescent, primed, and repli-
cating cells, respectively.
Biophysical Journal 96(10) 3926–3935

Liver Regeneration 3931
in general, in slowing the liver regeneration process. We
can simulate knock-out experiments or overstimulation
experiments by varying the kinetic parameters of the model.
Here, we either multiply or divide parameters by a factor
of two.
Decreasing the rate of production of STAT3 and GF
lengthens the regeneration time, confirming knockout exper-
iments that suggest that these elements are crucial for liver
regeneration (13,35). Decreasing the rate at which TNF-acti-
vated MMPs degrade the ECM also delays regeneration, as
shown previously in Issa et al. (36).
The model also confirms the importance of the metabolic
load. Increasing the metabolic load M by 25% without partial
hepatectomy induces a liver growth of 10% within 300 h; for
an increase of 50%, the liver grows by 25%. Similarly, Mead
et al. have observed (37) that protein-deprived rats that are
refed amino acids undergo a burst in hepatic DNA activity,
without undergoing partial hepatectomy. On the other hand,
small increases in the metabolic load do not change the liver
size significantly: a 10% increase only results in 1% liver
growth after 300 h.
FIGURE 3 Regeneration time per hepatocyte. Time required to recover
half of lost mass as a function of the fraction of liver remaining after partial
hepatectomy. Fractions <25% resulted in liver failure; those >80% did not
recover half of the lost mass within 500 h (z3 weeks).
TABLE 4 Half-regeneration times for selected mutants after
2/3 partial hepatectomy
Mutant type
Half-regeneration
time (h) Comment/Reference
Regular model 70.0 This article.
1/2 VST3 78.9 STAT3 knockouts have
diminished DNA synthesis
and induction of IE genes (35).
1/2 kGF 95.4 Met (HGF-receptor) knockouts
have increased mortality
and liver failure (13).
1/2 kdeg 80.7 Mice with collagenase-resistant
collagen have impaired recovery
to CCl4 damage (36).
Model sensitivity
Although we modeled cellular apoptosis and requiescence
using hyperbolic tangent functions, any other sigmoidal
function with the same mean and width gives similar results.
Substituting the hyperbolic tangent function with the Gom-
pertz function, the error function, or the functions sðxÞ ¼xn=
ffiffiffiffiffiffiffiffiffiffiffiffiffiffiffix2n þ 1p
ðn ¼ 1; 3; 5Þ, did not change our results.
We performed a sensitivity analysis on the mean and width
of sigmoidal functions qreq, breq, qap, and bap, and on the
cell-cycle parameters kQ, kP, and kR. We considered the cell
populations as a function of time for four resections with initial
fractions 0.15, 0.32, 0.55, and 0.75, as in Fig. 2. We chose 20
time points; at each we calculated the sum of the squares of the
difference among the values of Q, P, and R evaluated at the
vector of model parameter values x0 and the vector of the eval-
uated values x. Our cost function C(x) is this quantity summed
over the 20 time points and over the four resections:
CðxÞ ¼Xresect
Xt
�QðxÞ � Qðx0ÞÞ2 þ ðPðxÞ
� Pðx0ÞÞ2þðRðxÞ � Rðx0ÞÞ2: (11)
The parameter ranges can be approximated by the diagonal
entries of the inverse of the Hessian of C(x), evaluated at
x0. The parameter ranges, normalized to the model parameter
values, are shown in Table 5. The cell-cycle parameters have
sensitivities of ~1%, while the sigmoid function parameters
have sensitivities between 10 and 150%. The fact that the
parameters associated with the sigmoidal functions have
wide latitudes whereas the cellular rate constants are well
determined is consistent with the precise sigmoidal func-
tional form being unimportant for our conclusions.
Geometric interpretation
The dynamics observed in the liver regeneration model can
be more easily understood in terms of a geometric picture
in the two-dimensional phase plane involving R and Q cells.
We can motivate this picture by observing a projection of the
full dynamics onto the Q–R plane as shown in Fig. 4 and
considering a systematic reduction of the full system while
preserving the geometric structure. In the Q–R projection
there seem to be attracting fixed points located near Q ¼ 1,
R ¼ 0 and R ¼ 0, Q ¼ 0, with a separatrix between them.
In a reduced description, continuity of the trajectories would
require that there be an unstable fixed point, whose stable
manifold would correspond to the separatrix. The fact that
TABLE 5 Parameter ranges normalized to model values
kQ 0.0118
kP 0.0091
kR 0.0245
qreq 0.4606
breq 1.5697
qap 0.5445
bap 0.1020
Biophysical Journal 96(10) 3926–3935

3932 Furchtgott et al.
a range of liver resting states are possible implies that there
exists a line attractor along the Q axis (i.e., attracting
invariant one-dimensional manifold).
We can observe these features by performing a systematic
reduction of the dynamics as is often done in excitable
membrane dynamics. These approximations are intended to
only preserve the geometric properties of the vector field gov-
erning the dynamics. We first assume that all the dynamical
equations other than those for Q and R (i.e., P, ECM, GF, IE,
and intracellular mediators) are much faster, and can thus be
presumed to be quasistationary. We then observe that, at rest,
almost all cells are in state Q, so we can replace N by Q. We
can then express all the quasistationary variables as functions
of Q, resulting in a two-dimensional autonomous dynamical
system for Q and R. The resulting equations will have the form
d
dtQ ¼ jðQ;RÞ; (12)
d
dtR ¼ fðQ;RÞ; (13)
where j and f are fairly complicated functions of Q and R.
However, these functions can be simplified considerably and
still preserve the main geometric structure in the phase-plane.
We propose that the following system captures the main
features of the liver regeneration model,
d
dtQ ¼ kQðR� f ðQÞÞ; (14)
d
dtR ¼ cf ðQÞQ� R; (15)
where f(x) is any decreasing sigmoidal function, and k and
c are free parameters. The nullclines, given by _Q ¼ 0 and
FIGURE 4 Q–R plane projection of sample liver regeneration trajectories.
The dark solid and dotted lines represent the Q and R nullclines, respec-
tively. The smooth nullclines are approximated by piecewise linear interpo-
lation from turning points of selected trajectories. The solid and dotted
arrows show the direction of the vector field explicitly in each region.
Biophysical Journal 96(10) 3926–3935
_R ¼ 0, are shown in Fig. 5. The Q-nullcline is composed
of two disjoint curves. One is given by Q ¼ 0 and the other
is given by R¼ f(Q). The R-nullcline is given by R¼ cf(Q)Q.
The intersections of the nullclines of Pediaditakis et al.
(15) give the invariant sets of the phase plane. Both null-
clines converge toward zero for large Q, defining an
invariant manifold along the Q axis or line attractor, which
is attracting in the R direction but marginally stable along
Q. Thus, the liver can exist at a number of sizes. There is
a stable fixed point at the origin and a saddle point for
R and Q > 0. Trajectories below the Q-nullcline will flow
toward the left and those above will flow to the right. Simul-
taneously, trajectories below the R-nullcline will flow
upwards while those above will flow downwards. The stable
manifold of the saddle point defines the separatrix between
the basins of attraction of the origin (no recovery) and the
line attractor (full recovery). From these properties, the fate
of all initial conditions can be understood.
Trajectories with initial conditions for Q values below the
line attractor (but not too low) will increase in R and decrease
in Q until they cross the Q-nullcline, from which they will then
increase in Q. When the liver trajectory crosses the
R nullcline, R will begin to decrease and return to the liver
to the line attractor. The continuity of the trajectory in the
phase plane implies that trajectories cannot cross, so this
implies that the more Q is reduced initially, the faster R will
rise and the further out in Q the trajectory will terminate.
Hence, small reductions will always result with smaller livers
than large reductions (provided the reduction is not so large as
to cross the separatrix). If the initial reduction in Q takes it
below the separatrix, then the trajectory will cross the Rnullcline before the Q nullcline, causing R to decrease and
thus, the liver trajectory will end up at the origin (obviously
the animal would die before the liver shrank to zero size).
FIGURE 5 Q–R plane of reduced model, with f(x) ¼ 1 þ tanh(10(0.65 –
x)), k ¼ 0.2, c ¼ 4.

Liver Regeneration 3933
The geometric picture can provide the intuition to design
interventions for liver recovery. For example, the model
suggests that if any intervention could move the location of
the unstable fixed point and hence the separatrix, then it
may be possible to save a damaged liver that might otherwise
not recover. Lowering the Q-nullcline and/or raising the
R-nullclines would decrease the threshold for nonrecoverable
excision. These possibilities are explored in the following
section.
Predictions
In addition to matching several experimental results, the
model makes predictions for future experiments. These
predictions stem from the geometric picture of liver regener-
ation and involve moving the starting point of the liver
regeneration to locations that are not on the Q axis or moving
the location of the unstable fixed point.
First, the model gives striking results for multiple-resec-
tion experiments: counterintuitively, multiple resections
can result in faster growth. For example, if, 48 h after a
45% partial hepatectomy, a liver is again resected so as to re-
turn to 55% of its normal weight, the liver recovers 25%
faster than it would have if the excess growth had not been
removed. The total recovery time is shortened because of
the fast recovery after the second resection. The recovery
after the second resection is faster than the one after the
first—even though they both start with the same number of
cells—because the second recovery begins with large popu-
lations of replicating and primed cells, as well as with higher
numbers per cell of IE and GF. This headstart results in an
extremely rapid regeneration, which more than compensates
for the initial wasted 48 h. Fig. 6 shows the recovery time as
FIGURE 6 Recovery times for double hepatectomies: normalized total
time of recovery as a function of the interval between hepatectomies (in
hours). The time of recovery, defined as the time to reach 90% of normal
size, is normalized to the recovery time for a single hepatectomy. The second
hepatectomy consists of reducing the liver size to the size after the first hepa-
tectomy; it affects all cell types equally. The 45% repeated hepatectomy
results in a significant reduction in recovery time over a single hepatectomy.
a function of the interval between successive partial hepatec-
tomies, for various degrees of partial hepatectomy. The
second resection in a repeated resection experiment must
be physiologically feasible in terms of the lobular structure
of the remaining liver, since liver regeneration does not
resurrect the resected lobe(s). Repeated resections may be
best tested in a parabiotic experiment, in which a second
resection is performed on the other animal in a parabiotic
pair of animals without multiple resections on the animal
that undergoes the first resection.
Secondly, the model predicts that increasing the metabolic
load before partial hepatectomy will lead to a faster recovery.
For example, doubling the metabolic load 48 h before 75%
partial hepatectomy (Fig. 7) leads to a complete and rapid
recovery, as compared to an extremely slow recovery under
regular conditions (Fig. 1 D). This is because the increased
metabolic load leads to increases in primed and proliferating
cells, which places the system in a different part of the phase
space in which it recovers much faster. Increasing the meta-
bolic load before partial hepatectomy, through increased diet
or even perhaps controlled toxification, should lead to more
rapid recoveries in experimental settings.
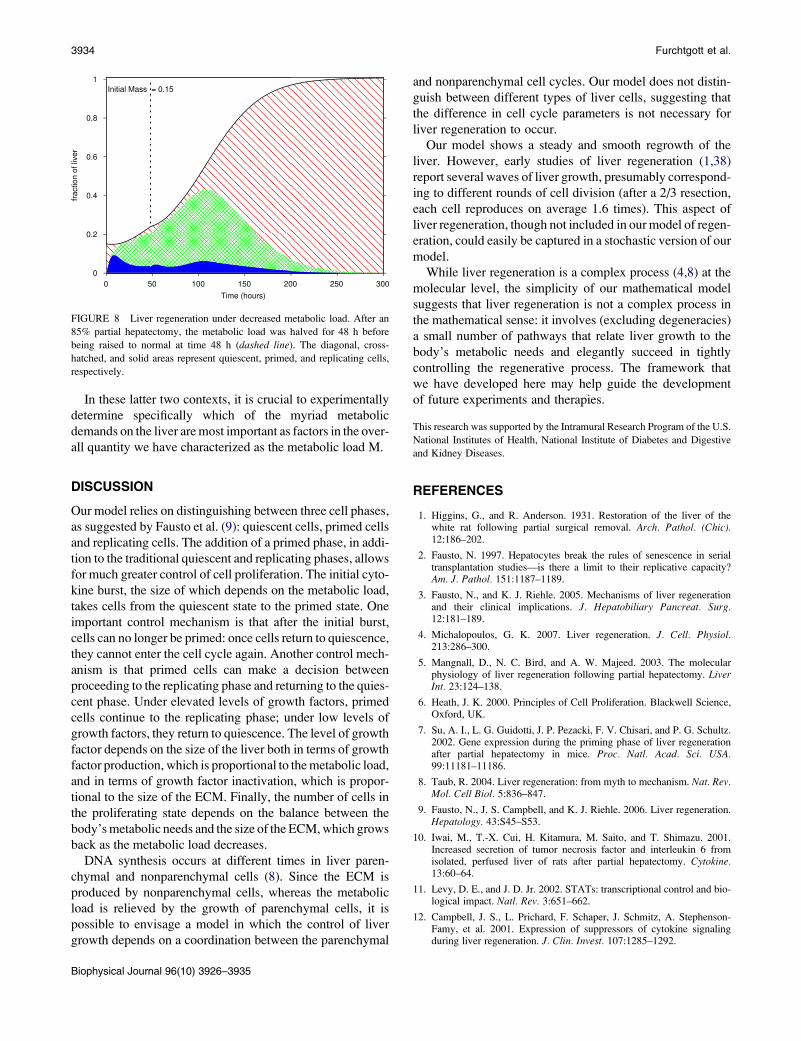
Finally, the model proposes a way to salvage livers that
are too small to perform basic functions and are liable to
failure. Decreasing the metabolic load M will decrease the
metabolic load per cell M/N so that the liver is not in the
apoptotic range. The liver can then grow sufficiently so
that it can survive under a regular metabolic load. Halving
the metabolic load for 48 h after 85% partial hepatectomy
successfully brought the liver to full recovery (Fig. 8).
Experimentally, decreasing the metabolic load through star-
vation and detoxification should help prevent liver failure in
cases of overly small livers.
FIGURE 7 Liver regeneration in response to increased metabolic load fol-
lowed by partial hepatectomy. The metabolic load was doubled for 48 h
before partial hepatectomy and was normal after partial hepatectomy. The
75% partial hepatectomy at time 0 affects all cell types equally. The diag-
onal, cross-hatched, and solid areas represent quiescent, primed, and repli-
cating cells, respectively.
Biophysical Journal 96(10) 3926–3935
3934 Furchtgott et al.
In these latter two contexts, it is crucial to experimentally
determine specifically which of the myriad metabolic
demands on the liver are most important as factors in the over-
all quantity we have characterized as the metabolic load M.
DISCUSSION
Our model relies on distinguishing between three cell phases,
as suggested by Fausto et al. (9): quiescent cells, primed cells
and replicating cells. The addition of a primed phase, in addi-
tion to the traditional quiescent and replicating phases, allows
for much greater control of cell proliferation. The initial cyto-
kine burst, the size of which depends on the metabolic load,
takes cells from the quiescent state to the primed state. One
important control mechanism is that after the initial burst,
cells can no longer be primed: once cells return to quiescence,
they cannot enter the cell cycle again. Another control mech-
anism is that primed cells can make a decision between
proceeding to the replicating phase and returning to the quies-
cent phase. Under elevated levels of growth factors, primed
cells continue to the replicating phase; under low levels of
growth factors, they return to quiescence. The level of growth
factor depends on the size of the liver both in terms of growth
factor production, which is proportional to the metabolic load,
and in terms of growth factor inactivation, which is propor-
tional to the size of the ECM. Finally, the number of cells in
the proliferating state depends on the balance between the
body’s metabolic needs and the size of the ECM, which grows
back as the metabolic load decreases.
DNA synthesis occurs at different times in liver paren-
chymal and nonparenchymal cells (8). Since the ECM is
produced by nonparenchymal cells, whereas the metabolic
load is relieved by the growth of parenchymal cells, it is
possible to envisage a model in which the control of liver
growth depends on a coordination between the parenchymal
FIGURE 8 Liver regeneration under decreased metabolic load. After an
85% partial hepatectomy, the metabolic load was halved for 48 h before
being raised to normal at time 48 h (dashed line). The diagonal, cross-
hatched, and solid areas represent quiescent, primed, and replicating cells,
respectively.
Biophysical Journal 96(10) 3926–3935
and nonparenchymal cell cycles. Our model does not distin-
guish between different types of liver cells, suggesting that
the difference in cell cycle parameters is not necessary for
liver regeneration to occur.
Our model shows a steady and smooth regrowth of the
liver. However, early studies of liver regeneration (1,38)
report several waves of liver growth, presumably correspond-
ing to different rounds of cell division (after a 2/3 resection,
each cell reproduces on average 1.6 times). This aspect of
liver regeneration, though not included in our model of regen-
eration, could easily be captured in a stochastic version of our
model.
While liver regeneration is a complex process (4,8) at the
molecular level, the simplicity of our mathematical model
suggests that liver regeneration is not a complex process in
the mathematical sense: it involves (excluding degeneracies)
a small number of pathways that relate liver growth to the
body’s metabolic needs and elegantly succeed in tightly
controlling the regenerative process. The framework that
we have developed here may help guide the development
of future experiments and therapies.
This research was supported by the Intramural Research Program of the U.S.
National Institutes of Health, National Institute of Diabetes and Digestive
and Kidney Diseases.
REFERENCES
1. Higgins, G., and R. Anderson. 1931. Restoration of the liver of thewhite rat following partial surgical removal. Arch. Pathol. (Chic).12:186–202.
2. Fausto, N. 1997. Hepatocytes break the rules of senescence in serialtransplantation studies—is there a limit to their replicative capacity?Am. J. Pathol. 151:1187–1189.
3. Fausto, N., and K. J. Riehle. 2005. Mechanisms of liver regenerationand their clinical implications. J. Hepatobiliary Pancreat. Surg.12:181–189.
4. Michalopoulos, G. K. 2007. Liver regeneration. J. Cell. Physiol.213:286–300.
5. Mangnall, D., N. C. Bird, and A. W. Majeed. 2003. The molecularphysiology of liver regeneration following partial hepatectomy. LiverInt. 23:124–138.
6. Heath, J. K. 2000. Principles of Cell Proliferation. Blackwell Science,Oxford, UK.
7. Su, A. I., L. G. Guidotti, J. P. Pezacki, F. V. Chisari, and P. G. Schultz.2002. Gene expression during the priming phase of liver regenerationafter partial hepatectomy in mice. Proc. Natl. Acad. Sci. USA.99:11181–11186.
8. Taub, R. 2004. Liver regeneration: from myth to mechanism. Nat. Rev.Mol. Cell Biol. 5:836–847.
9. Fausto, N., J. S. Campbell, and K. J. Riehle. 2006. Liver regeneration.Hepatology. 43:S45–S53.
10. Iwai, M., T.-X. Cui, H. Kitamura, M. Saito, and T. Shimazu. 2001.Increased secretion of tumor necrosis factor and interleukin 6 fromisolated, perfused liver of rats after partial hepatectomy. Cytokine.13:60–64.
11. Levy, D. E., and J. D. Jr. 2002. STATs: transcriptional control and bio-logical impact. Natl. Rev. 3:651–662.
12. Campbell, J. S., L. Prichard, F. Schaper, J. Schmitz, A. Stephenson-Famy, et al. 2001. Expression of suppressors of cytokine signalingduring liver regeneration. J. Clin. Invest. 107:1285–1292.

Liver Regeneration 3935
13. Huh, C.-G., V. M. Factor, A. Sanchez, K. Uchida, E. A. Conner, et al.2004. Hepatocyte growth factor/c-met signaling pathway is required forefficient liver regeneration and repair. Proc. Natl. Acad. Sci. USA.101:4477–4482.
14. Schmidt, C., F. Bladt, S. Goedecke, V. Brinkmann, W. Zschiesche, et al.1995. Scatter factor/hepatocyte growth factor is essential for liver devel-opment. Nature. 373:699–702.
15. Pediaditakis, P., J. C. Lopez-Talavera, B. Petersen, S. P. S. Monga, andG. K. Michalopoulos. 2001. The processing and utilization of hepato-cyte growth factor/scatter factor following partial hepatectomy in therat. Hepatology. 34:688–693.
16. Mars, W. M., M.-L. Liu, R. P. Kitson, R. H. Goldfarb, M. K. Gabauer,et al. 1995. Immediate early detection of urokinase receptor after partialhepatectomy and its implications for initiation of liver regeneration.Hepatology. 21:1695–1701.
17. Olsen, P. S., S. Boesby, P. Kirkegaard, K. Therkelsen, T. Almdal, et al.1988. Influence of epidermal growth factor on liver regeneration afterpartial hepatectomy in rats. Hepatology. 8:992–996.
18. Mead, J. E., and N. Fausto. 1989. Transforming growth factor-a may bea physiological regulator of liver regeneration by means of an autocrinemechanism. Proc. Natl. Acad. Sci. USA. 86:1558–1562.
19. Mitchell, C., M. Nivison, L. F. Jackson, R. Fox, D. C. Lee, et al. 2005.Heparin-binding epidermal growth factor-like growth factor links hepa-tocyte priming with cell cycle progression during liver regeneration. J.Biol. Chem. 280:2562–2568.
20. Mohammed, F. F., and R. Khokha. 2005. Thinking outside the cell:proteases regulate hepatocyte division. Trends Cell Biol. 15:555–563.
21. Serandour, A., P. Loyer, D. Garnier, B. Courselaud, N. Theret, et al.2005. TNF-a-mediated extracellular matrix remodeling is required formultiple division cycles in rat hepatocytes. Hepatology. 41:478–486.
22. Sokabe, T., K. Yamamoto, N. Ohura, H. Nakatsuka, K. Qin, et al. 2004.Differential regulation of urokinase-type plasminogen activator expres-sion by fluid shear stress in human coronary artery endothelial cells. Am.J. Physiol. Heart Circ. Physiol. 287:H2027–H2034.
23. Tseng, H., T. E. Peterson, and B. C. Berk. 1995. Fluid shear stress stim-ulates mitogen-activated protein kinase in endothelial cells. Circ. Res.77:869–878.
24. Moolten, F. L., and N. L. R. Bucher. 1967. Regeneration of rat liver:transfer of humoral agent by cross circulation. Science. 158:272–274.
25. Fisher, B., P. Szuch, M. Levine, and E. R. Fisher. 1971. A portal bloodfactor as the humoral agent in liver regeneration. Science. 171:575–577.
26. Cornell, R. P. 1985. Gut-derived endotoxin elicits hepatotrophic factorsecretion for liver regeneration. Am. J. Physiol. 249:R551–R562.
27. Nelsen, C. J., D. G. Rickheim, M. M. Tucker, L. K. Hansen, and J. H.Albrecht. 2003. Evidence that cyclin D1 mediates both growth andproliferation downstream of TOR in hepatocytes. J. Biol. Chem.278:3656–3663.
28. Nelsen, C. J., D. G. Rickheim, M. M. Tucker, T. J. McKenzie, L. K.Hansen, et al. 2003. Amino acids regulate hepatocyte proliferationthrough modulation of cyclin D1 expression. J. Biol. Chem.278:25853–25858.
29. Moser, M., Y. Gong, M. Zhang, J. Johnston, J. Lipschitz, et al. 2001.Immediate-early protooncogene expression and liver function followingvarious extents of partial hepatectomy in the rat. Dig. Dis. Sci. 46:907–914.
30. Panis, Y., D. M. McMullan, and J. C. Emond. 1997. Progressivenecrosis after hepatectomy and the pathophysiology of liver failure aftermassive resection. Surgery. 121:142–149.
31. Sato, Y., S. Koyama, K. Tsukada, and K. Hatakeyama. 1997. Acuteportal hypertension reflecting shear stress as a trigger of liver regenera-tion following partial hepatectomy. Surg. Today. 27:518–526.
32. Berg, J. M., J. L. Tymoczko, and L. Stryer. 2007. Chapter 8. InBiochemistry, 6th Ed. W.H. Freeman, New York.
33. Bucher, N. L., and M. N. Swaffield. 1964. The rate of incorporationof labeled thymidine into the deoxyribonucleic acid of regeneratingrat liver in relation to the amount of liver excised. Cancer Res.24:1611–1625.
34. MacDonald, R. A., A. E. Rogers, and G. Pechet. 1962. Regeneration ofthe liver: relation of regenerative response to size of partial hepatec-tomy. Lab. Invest. 11:544–548.
35. Li, W., X. Liang, C. Kellendonk, V. Poli, and R. Taub. 2002. STAT3contributes to the mitogenic response of hepatocytes during liver regen-eration. J. Biol. Chem. 277:28411–28417.
36. Issa, R., X. Zhou, N. Trim, H. Millward-Sadler, S. Krane, et al. 2003.Mutation in collagen-I that confers resistance to the action of collage-nase results in failure of recovery from CCl4-induced liver fibrosis,persistence of activated hepatic stellate cells, and diminished hepatocyteregeneration. FASEB J. 17:4749–4759.
37. Mead, J. E., L. Braun, D. A. Martin, and N. Fausto. 1990. Induction ofreplicative competence (‘‘priming’’) in normal liver. Cancer Res.50:7023–7030.
38. Brues, A. M., D. R. Drury, and M. C. Brues. 1936. A quantitative studyof cell growth in regenerating liver. Arch. Pathol. (Chic). 22:658–673.
39. Campbell, J. S., K. J. Riehle, J. T. Brooling, R. L. Bauer, C. Mitchell,et al. 2006. Proinflammatory cytokine production in liver regenerationis Myd88-dependent, but independent of Cd14, Tlr2, and Tlr4. J. Immu-nol. 176:2522–2528.
40. Klein, C., T. Wustefeld, U. Assmus, T. Roskams, S. Rose-John, et al.2005. The IL-6gp130STAT3 pathway in hepatocytes triggers liverprotection in T-cell mediated liver injury. J. Clin. Invest. 115:860–869.
41. Gao, J. J., Q. Xue, C. J. Papasian, and D. C. Morrison. 2001. BacterialDNA and lipopolysaccharide induce synergistic production of TNF-athrough a post-transcriptional mechanism. J. Immunol. 166:6860–6877.
42. Siewert, E., W. Muller-Esterl, R. Starr, P. C. Heinrich, and F. Schaper.1999. Different protein turnover of interleukin-6-type cytokinesignaling components. Eur. J. Biochem. 265:251–257.
43. Cressman, D. E., R. H. Diamond, and R. Taub. 1995. Rapid activationof the Stat3 transcription complex in liver regeneration. Hepatology.21:1443–1449.
44. Rahmsdorf, H. J., A. Schonthal, P. Angel, M. Litfin, U. Ruther, et al.1987. Posttranscriptional regulation of c-fos mRNA expression. NucleicAcids Res. 15:1643–1659.
45. Zargenar, R., M. C. DeFrances, D. P. Kost, P. Lindroos, andG. K. Michalopoulos. 1991. Expression of hepatocyte growth factormRNA in regenerating rat liver after partial hepatectomy. Biochem. Bi-ophys. Res. Commun. 177:559–565.
46. Stocker, E., and W.-D. Heine. 1971. Regeneration of liver parenchymaunder normal and pathological conditions. Beitr. Pathol. 144:400–408.
47. Alison, M. R. 1986. Regulation of hepatic growth. Physiol. Rev.66:499–541.
48. Webber, E. M., J. Bruix, R. H. Pierce, and N. Fausto. 1998. Tumornecrosis factor primes hepatocytes for DNA replication in the rat. Hep-atology. 28:1226–1234.
49. Emond, J., M. Capron-Laudereau, F. Meriggi, J. Bernuau, M. Reynes,et al. 1989. Extent of hepatectomy in the rat. Eur. Surg. Res. 21:251–259.
Biophysical Journal 96(10) 3926–3935