a model of the escape of sclerotinia sclerotiorum ... · ecological modelling 150 (2002) 83–105 a...
TRANSCRIPT
Ecological Modelling 150 (2002) 83–105
A model of the escape of Sclerotinia sclerotiorum ascosporesfrom pasture
Meindert D. de Jong a, Graeme W. Bourdot b,*, James Powell c,Jan Goudriaan d
a Biological Farming Systems, Wageningen Uni�ersity, Marijkeweg 22, 6709 PG Wageningen, The Netherlandsb AgResearch Limited, Canterbury Agriculture and Science Centre, P.O. Box 60, Lincoln 8152, New Zealand
c Department Mathematics and Statistics, Utah State Uni�ersity, Logan, UT 84322-3900, USAd Plant Production Group, Wageningen Uni�ersity, P.O. Box 430, 6700 AK Wageningen, The Netherlands
Received 4 May 2001; received in revised form 9 October 2001; accepted 28 October 2001
Abstract
A multi-layer physical model, SPORESIM-1D, based on the gradient transfer theory (K-theory) of turbulent dispersal(analogous with the molecular diffusion of gasses) is described for the transport of Sclerotinia sclerotiorum ascosporeswithin and above a grass canopy following their release from apothecia at ground level. The ‘steady-state’ diffusionequation is solved numerically and the spore escape fraction is estimated. SPORESIM-1D’s context is the risk analysisof S. sclerotiorum used as a mycoherbicide to control Cirsium ar�ense in pasture. In validation tests SPORESIM-1D wasinternally consistent and produced a vertical wind speed profile similar to that measured in a grassland. In furthervalidation tests, measured vertical profiles of atmospheric concentrations of Lycopodium cla�atum spores in a wheatcrop, and Venturia inaequalis spores in an apple orchard and in a grassland, were closely approximated by the model,as was measured data on the concentration of S. sclerotiorum ascospores deposited downwind of a small area sourcein a grassland. Escape fractions for grassland predicted by SPORESIM-1D, were 50% lower than predicted by both aLagrangian model (Plant Disease 82 (1998) 838) and a one-layer version of SPORESIM-1D, SPORESIM-1L, indicatingthat the vertical compartmentalisation in SPORESIM-1D, allowing wind speed and pasture leaf area index (LAI) tovary with height, results in a more realistic estimate of the escape fraction. Simulations using SPORESIM-1D revealedan increase in the escape fraction with increasing wind speed, and an order-of-magnitude fall with increases in LAIfrom values typical of a closely grazed sheep pasture (ca. 2) to those of more laxly grazed cattle pastures and intactgrassland (ca. 7). This result implies that any additional risk of disease in a susceptible crop growing downwind ofa pasture treated with a S. sclerotiorum mycoherbicide may be reduced by grazing management. Reduction in the riskof sclerotinia rot in kiwifruit (Actinidia deliciosa) vines, and in apple scab disease in apple trees, caused by V.inaequalis, appears possible by maintaining a dense grass under-storey. A simple empirical model for spore escapewith one parameter and two variables (LAI and wind speed) derived from the mechanistic model provided a gooddescription (r2=0.998) of simulated escape fraction. Combined with information on release rates of S. sclerotiorumspores at a biocontrol site, this model will enable a times-series analysis of spore emission, and coupled with a
www.elsevier.com/locate/ecolmodel
* Corresponding author. Tel.: +64-3983-3973; fax: +64-3983-3946.E-mail address: [email protected] (G.W. Bourdot).
0304-3800/02/$ - see front matter © 2002 Published by Elsevier Science Ireland Ltd.
PII: S0 304 -3800 (01 )00462 -8
M.D. de Jong et al. / Ecological Modelling 150 (2002) 83–10584
Gaussian plume model, prediction of minimum isolation distances between a biocontrol site and a susceptible crop.© 2002 Published by Elsevier Science Ireland Ltd.
Keywords: Cirsium ar�ense ; Sclerotinia sclerotiorum ; Venturia inaequalis ; Lycopodium cla�atum ; Spore dispersal; Pasture; Biologicalcontrol; Risk analysis; Weed
1. Introduction
The Ascomycete, Sclerotinia sclerotiorum, haspotential as a mycoherbicide for the control ofCirsium ar�ense (L.) Scop., and other weeds inpastures in New Zealand (Bourdot et al., 1995;Bourdot and Harvey, 1996). However, this fungalpathogen has a very wide host range includingmany economically important crops (Pennycook,1989) and the artificially increased inoculum intreated pastures may increase the disease risk insusceptible crops downwind of the biocontrol site(Bourdot et al., 2000). Quantification of this riskis necessary for an informed judgement about thesafety and management of this form of weedcontrol.
Sclerotia deposited in the pasture at a biocon-trol site over-winter in the soil (Bourdot et al.,2000) and form apothecia in the spring releasingascospores into the air at the base of the pasture(Bourdot et al., 2001). A fraction of these sporesmay escape the pasture and be dispersed beyondthe biocontrol site on air currents, thereby addingto the natural background levels of S. sclerotio-rum spores in the neighbourhood of susceptiblecrops. Using exponential decay models describingthe gradient in the measured density of ascosporesdeposited downwind of pastures treated with S.sclerotiorum, Bourdot et al. (2001) derived asafety zone of 8 m. The general applicability ofthis safety zone is, however, questionable becausethese empirical models provide no informationabout how spore liberation, transport and deposi-tion is influenced by environmental conditions. Ingeneral these processes are influenced particularlyby wind and air turbulence (McCartney and Fitt,1985) as well as density of the vegetation. de Jonget al. (1999) have outlined an alternative, mecha-nistic approach employing a Gaussian plumemodel for dispersal that uses as input the emissionrate of spores from a pasture (or ‘source
strength’), the product of the release rate of sporesfrom the apothecia, a process quantified empiri-cally by Bourdot et al. (2001) and the ‘escapefraction’.
The escape fraction (Gregory, 1961) cannot bemeasured directly (Aylor and Taylor, 1983; Aylorand Ferrandino, 1985) but may be evaluatedgiven a mechanistic understanding of the interact-ing processes that control the movement of sporeswithin a vegetation canopy. An existing statisticalmodel of spore release from apothecia, the ‘vol-cano-model’ (Kohli et al., 1995), is not appropri-ate for this purpose. A physical mathematicalmodel of spore dispersal in and above a vegeta-tion canopy based on the physics of air movementis required. To this end we have adapted anexisting model of the transport of Chondrostereumpurpureum basidiospores in a forest (de Jong etal., 1991) to simulate the transport of the as-cospores of S. sclerotiorum within a grass canopy.The principles of this model have been widelyaccepted by the scientific community (de Jong,1992; Teng and Yang, 1993; Sawyer et al., 1994;Shaw, 1994; Barlow, 1999; Evans, 2000). Oursimulation model (SPORESIM-1D) uses conceptsfrom models of spore transport in a wheat crop(Rijsdijk and Rappoldt, 1979) and in plantcanopies in general (Legg, 1983; Legg and Bain-bridge, 1978; Raupach, 1989; Davis and Mona-han, 1991; Flesch and Wilson, 1992; Yao et al.,1997; Aylor, 1999). It also includes ideas frommodels for barley (Legg and Powell, 1979; Aylor,1982) and rice (Park and Kim, 1995), and ele-ments from models of pollen transport in the airinside a forest (Di-Giovanni et al., 1989) and ofspore dispersal via rain-splash (Pielaat et al.,1998). It uses numerical methods for the simula-tion of spore dispersal (Yang et al., 1998).
SPORESIM-1D may be considered as a second-generation model after Legg and Powell (1979)for three reasons. Firstly, it uses the micro-

M.D. de Jong et al. / Ecological Modelling 150 (2002) 83–105 85
weather formula of Goudriaan (1977) in order tocalculate the wind and turbulence profile in agrass sward from a known wind speed at a refer-ence height above the pasture. Secondly, an ele-gant and quick numerical method is used forsolving the finite difference equations (de Jong etal., 1991). Thirdly, the vegetation canopy (pasturecontaining grasses and clovers) is divided verti-cally into many horizontal layers. This modifica-tion of the ‘one-layer’ model SPORESIM-1L, usedin de Jong et al. (1999), allows the vertical profileof pasture leaf area density to be taken intoaccount when calculating the deposition of sporesonto foliage due to turbulent impaction. InSPORESIM-1D, impaction is adequately treated andthe spore source can be vertically shifted, makingit a very flexible tool that has relevance for a widerange of dispersal phenonema in addition to theescape of S. sclerotiorum spores from a pasture.
In this paper, we describe three versions ofSPORESIM-1D that we validate according todefined performance criteria, comparing simulatedand measured data on the dispersal of the as-cospores of Venturia inaequalis and S. sclerotio-rum, and the spores of Lycopodium cla�atum. Wealso compare SPORESIM-1D with another sporetransport model and derive a mechanisticallybased expression that gives the escape fraction asa simple function of wind speed and pasture leafarea per unit ground surface area (leaf area index(LAI)), providing a simple basis for calculatingthe emission rate of ascospores from a modelpasture.
SPORESIM-1D is written in Visual FORTRAN(Version 6), and is operational and available onrequest from the senior author. The source listingsare in de Jong et al. (2002).
2. Methods
2.1. Notation and model �ersions
Three versions of the model SPORESIM-1D vary-ing in dimensionality (vertical and downwind di-rections) and discretisation (horizontal layers) areconsidered in this paper. The simplest version ofthe model is SPORESIM-1L. It is a one-dimensional
one-layer model that describes the vertical flux ofspores within and outside an area source ofspores. The second version is SPORESIM-1D, also aone-dimensional model for an area source ofspores, but partitioned vertically (with height, z)into many horizontal layers. Both versions aresuitable for numerical evaluation and estimate thefraction of spores escaping vertically from a grass-land canopy (the escape fraction, Ev). The thirdversion of the model, SPORESIM-2D, evaluatesspore concentration in two dimensions, heightabove ground (z) and distance downwind of thesource (x), and is used for simulation of a linesource of spores.
The descriptions and units for the parametersand the variables used in SPORESIM-1L,SPORESIM-1D and SPORESIM-2D are in Table 1.Parameter values are shown in Table 2. Otherdetails of the models are introduced as they arediscussed in the succeeding sections.
2.2. The partial differential equation for sporedispersal
Within a pasture undergoing biological controlof thistles, the concentration of airborne S. sclero-tiorum ascospores, C, depends on air currents(wind speed), deposition (onto plant and soil sur-faces), and sedimentation (falling by gravity instill air). McCartney and Fitt (1985) extensivelydescribe the diffusion equation for these pro-cesses, in which the turbulent dispersal of air-borne particles is based on an analogy with themolecular diffusion of gasses (gradient transfer orK-theory). Assuming that release of ascosporesfrom apothecia occurs continuously at a constantrate, C reaches a steady-state in seconds or less.Ascospore concentration, C, is then in equilibriumwith input of ascospores from apothecia on onehand, and losses by vertical transport, by sedi-mentation, and by deposition on the other. Thesteady-state diffusion equation for a pasture con-sidered as a single layer and assuming zero con-centration of spores in the external air, is:
u�C�x
=Rspor�(z−zr)+�
�z�
K(z)�C�zn
+�s
�C�z
−�dAdC (1)

M.D. de Jong et al. / Ecological Modelling 150 (2002) 83–10586
with boundary conditions
C(x=0,z)=0 and�C�z
(x,z=0)=0.
Here, u is the wind speed within the layer (m s−1),C is the spore concentration (spores m−3), xl isthe downwind length of the pasture (m), Rspor isthe release rate of ascospores per unit ground area(ascospores m−2 s−1) at a reference height (zr)above ground level, K is the turbulent diffusioncoefficient (m2 s−1), z is the height (vertical di-mension within layer (m)), �s is the sedimentationvelocity (m s−1), �d is the deposition velocity(m s−1), and Ad is the deposition-area density(m2 m−3). The value of parameter Ad was approx-
imated using the LAI (leaf area per unit groundarea) of the pasture as discussed in Section 3.5.
2.3. Deri�ation of a discrete model
To define a discretised version of Eq. (1) suit-able for numerical evaluation, consider a spatialdiscretisation with constant spacing:
xn=n�x, xo=0, xN=xl
zi= i�z, zo=0, zI=h,
and define
Ci,n=C�
zi+�z2
,xn+�x2�
.
Table 1Notation list for parameters and variables used in SPORESIM-1L, SPORESIM-1D, and SPORESIM-2D
Units DescriptionSymbol
downwind length of a layer in the modelm�xm�y cross-wind length of a layer in the model
�z height of a layer in the modelmAd deposition-area densitym2 m−3
spore concentrationspores m−3CCn spore concentration in nth layer in modelspores m−3
–Dleaf fraction of spores deposited on leavesfraction of spores deposited on soil–Dsoil
–Eh fraction of spores escaping horizontallyEi efficiency of impaction on leaf surfaces–
–Ev fraction of spores escaping verticallym s−2g acceleration due to gravitymh pasture height (above which spores are released)
turbulence intensity–iwm2 s−1K Eddy diffusivity of spores in the pasture–k Karman constant
LAI Pasture leaf area indexm2 m−2
Q emission rate of spores from pasture canopyspores s−1
r exchange resistances m−1
Rspor spores m−3 s−1 sporulation rateStk – Stokes’ numberu wind speed in and above the pasturem s−1
u* m s−1 friction velocityun m s−1 wind speed in the nth layer in the model
wind speed at reference height above the pasturem s−1ur
m s−1uz wind speed at height z in the pasturedeposition velocity of sporesm s−1�d
�s sedimentation velocity of sporesm s−1
mw leaf widthmx horizontal downwind distance within pasture
length of pasturexl mvertical distance within pasturez m

M.D. de Jong et al. / Ecological Modelling 150 (2002) 83–105 87
Table 2Parameter values and constants used in SPORESIM-1L,SPORESIM-1D, and SPORESIM-2D
ValueSymbol Description
k Von Karman constant 0.35 [−]0.01 mw leaf width0.6 [−]turbulence intensityiw0.002 m s−1�s sedimentation velocity2–7 [−]leaf area indexLAI
deposition velocity�d 0.01 m s−1
0.25 mpasture heighthascospore release rate of sourceRspor 102 m−2 s−1
downwind length of biocontrolxl 100 msite
9.8 m s−2acceleration due to gravitygL �1.0 [−]numerical stability
This amounts to a second order (in z) implicitdiscretisation of Eq. (1). The first two terms on theleft hand side describe the horizontal loss from thecell and flux into the cell, respectively. Values ofCi,n are determined from upwind spore inputs byinverting a tri-diagonal matrix using the Gauss–Jordan elimination procedure (Waggoner et al.,1969; Ward et al., 1989). With this method, thesteady-state concentrations for each layer can befound very rapidly. Let Kmax denote the maximumeddy diffusivity. Provided
Kmax�xu�z2 �
12
this approach is stable (DuChateau and Zach-mann, 1986). Since the crop is much smaller in thevertical direction than the horizontal, the verticaldiscretisation is correspondingly small, allowing arelatively coarse discretisation in the downwinddirection.
In fact, it is often useful to use only a singlecolumn of vertical layers (that is, �x=xl), corre-sponding to horizontal integration across the en-tire crop. In this case, since we assume nohorizontal flux of spore into the crop from the left,the discrete model becomes
u�zxl
Ci�Rspor,i−�z�dAdCi+�s(Ci+1−Ci)
+K(zi+1/2)�C�z
(zi+1/2)
−K(zi−1/2)�C�z
(zi−1/2), (2)
with
�C�z
(zi+1/2)=Ci+1−Ci
�z.
2.4. Implementation of the discrete model
To allow for the considerable vertical gradientin spore concentration that may exist, the singlelayer model, SPORESIM-1L, was extended to manythin layers in SPORESIM-1D (Fig. 1). The bottomlayer only contained spore-releasing apothecia,and so the term Rspor,i was set to zero for all otherlayers. Wind speed and the turbulent diffusion
Integrating Eq. (1) in the box defined by [xn,xn+1]× [zi,zi+1] and taking Ci,n to be the spatial averageof the concentration over the box gives
u�z�x
(Ci,n−Ci,n−1)
�Rspor,i−�z�dAdCi,n+�s(Ci+1,n−Ci,n)
+K(zi+1/2)�C�z
(zi+1/2)−K(zi−1/2)�C�z
(zi−1/2).
The approximation is correct to error terms oforder �x and �z2 assuming that the terms corre-sponding to vertical diffusive flux (the last twoterms on the right hand side) are evaluated withcomparable accuracy. The discrete terms Rspor,i areeither Rspor (for the first grid box, correspondingto the spore source), or zero (for all layers above).Applying a centred discrete approximation for thevertical flux terms and taking K(zi+1/2) to beevaluated at the boundary between cells gives adiscrete equation
u�z�x
(Ci,n−Ci,n−1)
�Rspor,i−�z�dAdCi,n+�s(Ci+1,n−Ci,n)
+K(zi+1/2)Ci+1,n−Ci,n
�z
−K(zi−1/2)Ci,n−Ci−1,n
�z.
M.D. de Jong et al. / Ecological Modelling 150 (2002) 83–10588
coefficient for each layer were calculated from thewind speed ur at a reference height above the crop(Goudriaan, 1977). The velocities of depositionand sedimentation were based on theoretical con-siderations and existing data. The elliptical as-cospores of S. sclerotiorum measure 9–13 by4–6.5 �m (Dennis, 1968). They have a theoreticalsedimentation velocity (i.e. their rate of fall in stillair due to gravity according to Stokes’ Law, cf.Gregory (1961)), �s of 0.002 m s−1 based on Mc-Cartney and Fitt (1985). Deposition on surfacessuch as leaves and stems is defined here as turbu-lent impaction and occurs at a theoretical veloc-ity, �d of 0.01 m s−1 based on Fig. 9 in
Chamberlain (1975), Fig. 1 in Bache (1981) andFig. 7 in Slinn (1982). In testing the model weused data on the dispersion of V. inaequalis andL. cla�atum spores in addition to data from S.sclerotiorum. Ascospores of V. inaequalis haveabout the same dimensions as S. sclerotiorumascospores, and hence the same �s and �d. Thetheoretical sedimentation velocity, �s, of L. cla�a-tum spores is 0.0197 m s−1.
The assumption of a continuous release of S.sclerotiorum ascospores, explosively ejected fromthe apothecia to a height of several centimetresand often in clumps of two or four (Ingold, 1971),seems reasonable. While on occasions of still-air
Fig. 1. SPORESIM-1D, a multi-layer model for the transport of Sclerotinia sclerotiorum ascospores within, and escape from, a pasturesward. The air within and above the pasture, to a reference height of 1.5 m for wind speed, is divided into many layers. Ascosporesare released by apothecia in the bottom layer. The fraction escaping (above layer 20) is a function of turbulence, wind-speed (u),and the rate of deposition onto soil and plant surfaces (�d); the latter a function of pasture leaf area index (LAI) that varies verticallywithin the pasture.
M.D. de Jong et al. / Ecological Modelling 150 (2002) 83–105 89
conditions large numbers of spores may be re-leased simultaneously by ‘puffing’ (Hartill andUnderhill, 1976), release occurs continuously un-der the windy spring-time conditions prevailingin pastures in Canterbury, New Zealand(Bourdot et al., 2001).
Wind, u, and turbulence, K, are calculatedfrom one wind speed at a reference height abovethe crop using a micro-weather simulator (Gou-driaan, 1977; Stigter et al., 1977). The verticaldistribution of LAI in the pasture was takenfrom Fig. 1 in Nassiri et al. (1996). The bottom-line predictions from the model are phrased interms of the fraction of spores, released at thereference height, zr, which escape from the crop.The vertical escape fraction, Ev, is defined bythe vertical flux of spores through a surface atthe top of the crop at z=h, divided by the totalspore production. Thus
Ev=
� xl
0
�−K
�C�z
−�sC��z=h
dx
(xlRspor).
The horizontal escape fraction, Eh, relates to thenumber of spores being conducted downwindand escaping through a surface located at thedownwind edge of the crop at x=xl. This gives
Eh=
� h
0
�u
�C�x��x=xl
dz
(xlRspor).
The total escape fraction is then defined as E=Ev+Eh.
In SPORESIM-1D the per-cell vertical escapefraction, Ev, from layer n into layer n+1 at aparticular height, z, is defined as
Ev=� Cn
rn+1
−Cn+1
rn
n�z
where �z is the difference in height between twolayers (zn+1−zn), i.e. the thickness of a layer.Cn is the concentration of spores in the nthlayer in the model and r is the resistance toexchange of spores between layers (s m−1). Ev
may be used to estimate the rate of emission of
spores from a biocontrol site, thus providing theinput term Q, for a long-distance dispersalmodel such as the Gaussian Plume model (Er-brink, 1995).
The per-cell horizontal escape fraction, Eh, isdefined as
Eh=�Cn×un
xl
nwhere un is the wind speed in layer n. Eh is usedin transforming the one-dimensional (areasource) model SPORESIM-1D into a two-dimen-sional (line source) model, SPORESIM-2D, to de-scribe the downwind dispersal of spores (Section3.4.1).
2.5. Verification and �alidation procedures
The purpose of SPORESIM-1D is to provide agood description of spore dispersal phenomenain a pasture, so that an accurate estimate of thefraction of spores escaping above the pasturecanopy can be obtained. Our basic assumptionis that if the model gives a good prediction ofspore concentrations in the air above and down-wind of spore sources, then we suppose that italso gives a reliable estimate of the escape frac-tion.
The context in which SPORESIM-1D is to beused is a risk analysis of the biocontrol of thepasture weed, C. ar�ense, using the fungus S.sclerotiorum as a mycoherbicide. For this reasonvalidation was considered an essential require-ment (Rykiel, 1996), and the key performancecriteria SPORESIM-1D must meet to be acceptablefor use are:1. The model is verifiably correct mechanically
and logically.2. The model correctly simulates wind speed in a
pasture; wind is the driving force in the model.3. Model estimates of escape fraction are not
unduly affected by wind gustiness.4. Modelled spore concentrations are in close
agreement with measured spore concentrationsin field experiments and the general behaviourof the escape fraction is similar to that in anexisting model.

M.D. de Jong et al. / Ecological Modelling 150 (2002) 83–10590
3. Verification and validation results
3.1. Verification
The internal validity of SPORESIM-1D was testedusing the guidelines in Wagenmakers (1984), set-ting �s and �d to zero, r to100 and xl to 106. Thisresulted in a linear profile of spore concentrationversus height (Fig. 2). Beginning at the top layer(layer 20), above which ‘escape’ occurs inSPORESIM-1D, spore concentration (spores m−3)declined linearly (by 10 spores m−3 per layer) asis to be expected from theoretical considerationswhen the pasture area has an almost infinitelength and there is neither deposition nor sedi-mentation. The consistent occurrence during allsimulations of the condition,
Eh+Ev+Dleaf+Dsoil=1.0
where Eh and Ev are as defined above and Dleaf
and Dsoil are the proportions of spores depositedon foliage and soil, verifies that the computerprogramme is internally valid and accounts for allspores generated under all test conditions (SeeFig. 9 for an example).
A sensitivity analysis of SPORESIM-1D was con-ducted as outlined by Wagenmakers (1984) andde Jong (1988) with respect to model structure(model reaction to different equations for thesame physical processes) and model parameters(model reaction to changes in parameter values).
3.2. Wind speed profile in pasture-comparison ofmodel output with field data
The movement of air within a canopy plays animportant role in the dispersal of spores (Leggand Bainbridge, 1978; McCartney, 1994), andwind speed is particularly important (Leffelaar,1993). Consequently, our escape model must sim-ulate wind speed adequately. The vertical profileof wind speed in SPORESIM-1D (and in SPORESIM-2D) is calculated from measured wind speed at areference height, h=1.0 m according to the equa-tions in Goudriaan’s micro-weather simulator(Goudriaan, 1977). Aylor et al. (1993) measuredwind speed at several heights in and above a grasscanopy of Festuca arundinacea using sensitive cup
Fig. 2. Internal validity of the one-dimensional modelSPORESIM-1D is demonstrated by the expected linear relation-ship between the simulated density of spores and height aboveground, z. Points on the graph are layers in the model.Exchange resistance in all layers was set at r=100 s m−1, with�s=0 and �d=0.
anemometers above the canopy and vertically de-ployed hot wire anemometers below the canopy.The measured wind speeds from Fig. 4 in Aylor etal. (1993), averaged for each of nine sets of mea-surements, were compared with wind speeds simu-lated by SPORESIM-1D. Canopy parameters(LAI=4.7 and h=0.28m) in Aylor et al. (1993)were incorporated in the simulation model andthe parameter for turbulence intensity (iw=0.6),was selected by calibration whereby its value wasadjusted to maximise the agreement between thewindspeeds from the model and the mean datavalues in Aylor et al. (1993).
Field data and model data match reasonablywell (Fig. 3). Both modelled and measured verti-cal profiles of mean horizontal ‘cup’ wind speed,u, expressed as a ratio with friction velocity, (u/u*) increased exponentially with relative height(z/h) within the canopy (z/h�1.0) and logarith-mically with height above the canopy.
3.3. Wind gustiness and spore escape
Wind speed u, is a constant in SPORESIM-1D
(and in the other versions of the model), but in

M.D. de Jong et al. / Ecological Modelling 150 (2002) 83–105 91
reality is highly variable in time. The distributionof hourly mean and gust wind speeds from theBroadfields weather station in Canterbury, NewZealand, measured in spring 1996 illustrate thistime-dependence of u. Hourly mean wind speedsvaried from 0 to 17.3 m s−1 over 2 184 h ofmeasurement with a mean of 4.2 m s−1 whilemaximum hourly gusts varied in speed from 4 to24.7 m s−1 over 2117 h of measurement (Table 3).
To investigate the consequences for the escapefraction of ignoring wind gusts, a sensitivity anal-ysis was conducted using SPORESIM-1D in whichthe escape fraction, Ev, for a time period duringwhich gusty conditions persisted, was comparedwith escape when the wind speed was steady andequal to the mean wind speed for the time inter-val. To simulate escape during a period of gustyconditions, the time period was arbitrarily dividedinto three fractions of different duration (0.89,0.10 and 0.01). These time fractions were periodsof ‘steady wind’, moderate gusts’ and ‘heavygusts’, respectively. The periods of moderate and
Table 3Wind speed statistics for Canterbury, New Zealand for theperiod 1 September–30 November (spring) for 1996
Wind speed class Frequency (h)interval (m s−1)
Hourly mean Maximum gust
19 405442 123
4 4415956 392518
4048 28929210 1852082412
8 15214116 67
2418 1020 4
22 40024 1
26 0 12117a2184Total hours
Maximum hourly mean wind speed (17.3 m s−1)Mean wind speed (4.2 m s−1)Maximum gust speed (24.7 m s−1)Mean gust speed (7.0 m s−1)
Data are from Broadfields weather station H32642 in Canter-bury and were recorded on an hourly basis.
a Gusts not recorded for 67 consecutive hours (2200 hours21 Sept.–1600 hours 24 Sept.).
Fig. 3. Comparison of the vertical profile of windspeed:friction velocity ratio, u/u*, as measured in a Festucaarundinacea grassland Connecticut, USA (means for each ofnine sets of data from Fig. 4 in Aylor et al., 1993) (�), withsimulated data using the one-dimensional model SPORESIM-1D
(�—�). The vertical axis gives height on a relative scale asdistance above ground, z, divided by the height, h, of thegrassland canopy.
heavy gusts were assigned wind speeds of 7 and24.7 m s−1 (mean and maximum gust speeds inspring 1996 in Canterbury (Table 3)). The ‘mean’wind speed for the time period was set equal to4.2 m s−1 (the mean hourly wind speed for thespring of 1996 (Table 3)) and, as a consequence ofthis, the wind speed for the 0.89 ‘steady’ fractionof the time period was required to be 3.7 m s−1.SPORESIM-1D, with LAI=0 to 10, was used tosimulate escape for each of the three wind speedsrepresenting the steady, moderate gust and heavygust fractions of the time period, and for themean wind speed. The escape fraction for thegusty period was estimated as the sum of theescape fractions for each of the three time frac-tions after scaling them by their respective frac-tions of time.
The results for the sensitivity analysis using anLAI of 5 are in Table 4. They suggest that during

M.D. de Jong et al. / Ecological Modelling 150 (2002) 83–10592
a period of intermittent gusty wind conditions, theescape fraction may be the same as that during aperiod when the wind speed is steady at the meanwind speed for the gusty period. The same resultwas obtained for LAI values up to eight, while atLAI values of 9 and 10 escape was 2 and 6%greater under the gusty conditions (data notgiven). These results imply that the higher thewind speed, the less rapidly escape increases withincreasing wind speed, and that overall, gustywind conditions have little influence on the escapefraction. However, gusty winds could cause differ-ential spore release (from apothecia) and deposi-tion rates and result in entrainment of spores inlarge eddies. This could alter the escape fractionand is not accounted for in the above sensitivityanalysis using a steady-state model. Thus it iswith some degree of uncertainty that we concludethat SPORESIM-1D gives realistic estimates of theescape fraction during gusty wind conditions.
3.4. Comparison of simulated data fromSPORESIM-1D and SPORESIM-2D with measureddata
Three independent sets of spore data measured
under field conditions were compared with dataproduced by simulations using SPORESIM-1D andSPORESIM-2D. The procedures used and the re-sults of the comparisons are discussed in the nextthree sections. The value of the parameter, Rspor,the driving force in SPORESIM-1D (and SPORESIM-2D), was not available in two of the field data sets.In these cases the value of Rspor was estimated byadjusting it to maximise agreement, judged visu-ally, between the model output and the data set; a‘calibration’ procedure often used to estimate oth-erwise unknown parameter values in ecologicalmodels (Rykiel, 1996).
3.4.1. Artificial line source of Lycopodiumcla�atum spores with known release rate
The measured data used in this comparisonwith model-generated data consisted of aerial con-centrations of L. cla�atum spores at seven heightsand at distances of 2 and 4 m downwind of anartificial line source (with a release height of 0.4m) within a 0.8 m tall wheat crop in Connecticut,USA, in 1986 (Table IV, Aylor and Ferrandino,1989). The spores were released at a constant ratefrom artificial sources. The concentration of thespores was measured with rotorods (RotorodSampler, Sampling Technologies Inc., Min-netonka, MN, USA) placed at four heights abovethe canopy (0.85, 1.10, 1.35 and 1.60 m above theground) and with small suction traps at twoheights inside the canopy (0.26 and 0.58 m); con-centrations near the ground (0.03 m) were mea-sured from deposits on glass microscope slidesplaced on the ground.
In order to compare the performance ofSPORESIM-1D against these data, it was convertedfrom its one-dimensional form (in which x and yare considered to be infinitely large and 0�z�infinity), to the two-dimensional form, SPORESIM-2D, (where only y is considered to be infinitelylarge and 0�z� infinity and 0�x� infinity) ca-pable of simulating spore dispersal (to a height, z,of 2.0 m) for a distance, x, of 5 m downwind of aline source. This version of the model consisted of20 horizontal layers each of 10 adjacent squarecells that were 0.5 m wide (�y)×0.5 m long(�x)×0.1 m thick (�z); a cell size resulting in an
Table 4Analysis of the effect of wind gusts on the proportion ofspores escaping vertically from a grass canopy usingSPORESIM-1D
u (m s−1) EvaWind gust Proportion of
timespecification
Steady 0.0880.893.70.1710.10Moderate gusts 7.0b
Heavy gusts 0.0124.7b 0.3910.100cCombined
conditions0.1044.2b 1.0Mean
a The values of Ev for ‘steady’, ‘moderate’, ‘heavy’ and‘mean’ values of u were calculated by SPORESIM-1D withLAI=5.
b Wind speeds for ‘moderate’ and ‘heavy’ gusts were setequal to the mean and maximum wind gust speeds for Canter-bury in spring 1996 (Table 3) and the speed of the ‘steady’wind was a consequence of setting the ‘mean’ wind speed to4.2 (from Table 3) [4.2= (0.89×3.7)+(0.1×7)+(0.01×24.7)].
c The overall escape fraction was calculated as Ev= (0.89×0.088)+(0.1×0.171)+(0.01×0.391).

M.D. de Jong et al. / Ecological Modelling 150 (2002) 83–105 93
Fig. 4. Comparison of the aerial concentration, C, of artifi-cially released spores of Lycopodium cla�atum measured in awheat crop in Connecticut, USA, in 1986 (from Table IV,Aylor and Ferrandino, 1989) (�) with simulated data usingthe two-dimensional line source version of the model,SPORESIM-2D (�—�).
3.4.2. Natural area sources of Venturia inaequalisspores
The ascospores of V. inaequalis, the fungus thatcauses apple scab disease in apple trees (Aylor,1998), are similar in density and size (6×13 �m)to those of S. sclerotiorum, 9–13 by 4–6.5 �m(Dennis, 1968), and may be considered analoguesof the latter with respect to dispersal. Their aerialconcentration at different heights above sourceshas been measured in a variety of dispersal exper-iments. During the course of our model validationstudy, we compared simulated data fromSPORESIM-1D with various sets of measured datapublished by Aylor (1995) and by Aylor and Qiu(1996). SPORESIM-1D, calibrated for the particulardata sets by adjusting the value of Rspor, providedreasonably good predictions of the vertical varia-tion in the measured spore concentrations. Here,we have selected two particular data sets as exam-ples to illustrate the level of agreement betweensimulated and measured data.
3.4.2.1. Apple orchard. Our first example uses thespore concentration data, C (ascospores m−3), forV. inaequalis presented in Fig. 3 in Aylor (1995)measured at six heights above the ground (0.15,0.30, 0.50, 0.80, 1.50, 3.0 m) on the 101st day of1993 in an orchard of dwarf apple trees in Mt.Carmel, Connecticut, USA. The ascospore sourcewas the grassed areas of land (grass height, h=0.1–0.25 m) between the trees that had been‘seeded’ uniformly with apple leaves containingscab lesions: ascospores were released into the airfrom asci on the pseudothecia contained in thelesions. The concentration of the ascospores in theair above the source was measured with rotorodsamplers for 2 h starting after rain began. Theone-dimensional area source version of the model,SPORESIM-1D, was used with parameter values(grass LAI, u) taken from measurements made inthe orchard by Aylor (1995). The release rate ofthe ascospores in the orchard was not known andthe value of this parameter, Rspor, was estimatedby calibration using the six spore concentrationdata values from Aylor (1995).
The spore concentration, C, simulated bySPORESIM-1D, behaved in a similar manner to theobserved C, declining rapidly with increasing
acceptable numerical stability value of L�12(DuChateau and Zachmann, 1986). The firstcolumn of 20 cells represented the source in whichthe release of spores occurred at a height, z, of0.4–0.5 m (i.e. in the fifth layer of the model) andthe release rate, Rspor, was taken from Aylor andFerrandino (1989). In the other 49 cells (thosedownwind of the source) Rspor was set to zero.The horizontal escape of spores from each columnof 20 cells, Eh, provided the spore input to succes-sive cells downwind. For this simulation, LAI, uand �s were also taken from Aylor and Fer-randino (1989).
The simulated data for spore concentration ateach of the seven heights above ground at 3 mdownwind of the source were in very good agree-ment with the mean of the measured concentra-tions at 2 and 4 m (Fig. 4). Since SPORESIM-2D
modelled the measured spore concentrations inthe wheat crop with a high degree of precision, wecan assume that it, and its one-dimensional form,SPORESIM-1D, adequately model both the hori-zontal and vertical escape fractions, Eh and Ev.

M.D. de Jong et al. / Ecological Modelling 150 (2002) 83–10594
height above the ground (Fig. 5a). While themodel simulated the data from the experimentwell below a height of 0.5 m and at heights above2 m, it over-estimated the observed values of C atintermediate heights. It seems probable that thiswas a consequence of SPORESIM-1D not account-ing for the presence of the trees. The ‘absence’ oftrees in the model could have resulted in incor-rectly modelled vertical wind speed profile and alower than expected rate of spore deposition, thusa higher than expected concentration of spores inthe air.
3.4.2.2. Grass field. Our second example uses thespore concentration data, C (ascospores m−3), forV. inaequalis presented in Fig. 6 A in Aylor andQiu (1996) measured on the 119th day of 1993 ina 0.5 ha field of ‘mixed fescue and orchardgrasses’ in Mt. Carmel, Connecticut, USA. Theheight, h, of the top of the grass ranged from 0.06m at the beginning of the season to about 0.25 mat the end of the season. The ascospore sourcecomprised of scabbed apple leaves spread over a30 m×30 m area in the middle of the field. Theconcentration of the ascospores in the air abovethe source was measured with a vertical array ofrotorod samplers (at heights, z, above ground of0.15, 0.30, 0.50, 0.80, 1.50, 3.0 m) placed near the
centre of the field and operated for 2 h followingthe start of rain. The one-dimensional area sourceversion of the model, SPORESIM-1D was used withparameter values (grass LAI, u) taken from mea-surements made in the grass field by Aylor andQiu (1996). The spore release rate, Rspor, was notmeasured in the grassland and this parameter wasestimated in a model calibration procedure inwhich the vertical profile of C produced bySPORESIM-1D was scaled until the modelled valuesof C were in good agreement, as judged by visualcomparison, with the six measured values of C inAylor and Qiu (1996). This resulted in an Rspor
value of 0.44×10⁵ ascospores m−2 s−1; a rate ofspore release of the same order-of-magnitude asthat estimated by Aylor and Qiu (1996) using the‘integrated horizontal flux’ and the ‘laboratoryspore tower’ methods.
The modelled vertical concentration profile inthe grass field was very similar to the measuredconcentration profile from near ground level to aheight, z, of 1.5 m (Fig. 5b). The generally lowervalues of the simulated data probably reflect un-der-estimation of the spore release rate, Rspor,during model calibration. Nevertheless, the resultindicates that SPORESIM-1D is a valid model forestimating the vertical concentration of sporeswithin and above a grass community, and hence
Fig. 5. Comparison of simulated aerial concentrations of the ascospores of Venturia inaequalis using the one-dimensional,ground-level area-source version of the model SPORESIM-1D (�—�), with concentrations measured (�) in (a) an apple orchard inConnecticut, USA (data from Aylor, 1995) and in (b) a fescue grassland (data from Aylor and Qiu, 1996).

M.D. de Jong et al. / Ecological Modelling 150 (2002) 83–105 95
Fig. 6. Measured and modelled dispersal of S. sclerotiorum ascospores within and downwind of a 14 m diameter patch of C. ar�ense(−14 to 0 m on bottom axis) treated previously with a S. sclerotiorum mycoherbicide in Canterbury. In (a): (— ) steady-stateatmospheric concentration, C, of spores at height, z, of 0.6 m predicted by the two-dimensional version of the model, SPORESIM-2D;(�) measured concentration, C, of 85 spores m−3 (from Table 2, Bourdot et al., 2001) used to calibrate the model; (+ ) halfdistance, d1/2. In (b): (�) measured spore deposition (weighted mean over 9 days) during the interval 1000–1400 h, back-trans-formed from Fig. 3, Bourdot et al. (2001); (�) measured deposition for the day when C of 85 was determined (two extreme valuesof C (6531 at x of −3.5 m and 6216 at x of 0.0 m) are not shown); (— ) deposition predicted by SPORESIM-2D.
also for estimating the fraction of spores thatescape from the pasture.
3.4.3. Biocontrol source of Sclerotiniasclerotiorum spores in a pasture
Spore deposition data from Experiment 3 inBourdot et al. (2001) was utilised as an indepen-dent test of SPORESIM-1D. The data from thisexperiment consisted of the average density of S.sclerotiorum ascospores deposited on a selectiveagar in Petri dishes placed in lines radiating 19.2m downwind of a circular 14 m diameter patch ofC. ar�ense in the centre of an irrigated sheep-grazed pasture. The spores were collected between1000 and 1400 h on nine days in the spring/earlysummer (Sept., Oct., Nov., Dec.) of 1997 and theC. ar�ense patch had been treated in the spring of1994 and 1995 with high doses of a mycoherbicidepreparation based on S. sclerotiorum. A substan-tial soil-borne sclerotium population, and hencealso, a large apothecium population, were as-sumed to exist within the C. ar�ense patch. Thedeposition data are given as ascospores depositedper m2 per hour in Bourdot et al. (2001) Fig. 3.Additionally, the average density of the as-
cospores in the air at a height 600 mm at thedownwind edge of the ascospore source on one ofthe nine days, 27 Nov. 1997, was found to be 85m−3 using a Burkard High Throughput ‘Jet’Spore Sampler and the selective agar (Table 2 ofBourdot et al., 2001).
In order to compare the performance of themodel against these deposition data, it was con-verted to its two-dimensional form, SPORESIM-2D,capable of simulating dispersal, within (to aheight of 1.6 m), and downwind (for 19.2 m) of a14 m diameter spore source. This version of themodel consisted of 32 horizontal layers each of340 adjacent square cells each 0.1 m wide (�y)×0.1 m long (�x)×0.05 thick (�z); this cell sizegave an acceptable numerical stability value ofL�1 (DuChateau and Zachmann, 1986). Thefirst 140 of the cells represented the 14 m diameterspore source in which the release rate of spores,Rspor, (in the bottom layer) was greater than zero;in the other 200 cells (those downwind of thesource) Rspor=0. The horizontal escape of sporesfrom each column of 32 cells, Eh, provided thespore input to successive cells downwind. For thissimulation pasture height, h, was 0.25 m, wind

M.D. de Jong et al. / Ecological Modelling 150 (2002) 83–10596
speed, u, was 3.9 m s−1 (mean wind speed mea-sured for 27 Nov. 1997; Table 2, Bourdot et al.(2001)) and pasture LAI, was 2.0, a value typicalfor sheep pasture in Canterbury (Fig. 8). Otherparameter values were set as in Table 2.
The model was calibrated by varying the valueof Rspor until a value of C of 85 spores m−3 wasobtained at a height, z, of 0.6 m in cell 140representing the downwind edge of the 14 m sporesource being simulated where the single data valueof 85 spores m−3 had been measured.
The value of Rspor estimated by this calibrationprocedure was 255 spores m−2 ground surfaces−1; a value that is biologically reasonable in apasture treated twice with high doses of S. sclero-tiorum as we now illustrate. Rspor (spores m−2 soilsurface), may be given by
Rspor=S×A× f
where S is the density of sclerotia (c m−2) in thesoil in the autumn preceding the spring-summerseason when they will produce apothecia in thebase of the pasture (Bourdot et al., 2001), A is thesize of the sporulating apothecial disc surface(mm2 sclerotium−1) and f is the rate of dischargeof ascospores from the apothecia (sporesmm−2 disc surface s−1). Taking the measureddaily mean value of f of 0.08242 for a frost-freeday and the November value for A of 2 fromFigs. 9 and 5, respectively, in Bourdot et al.(2001), an Rspor of 255 in November requires anautumnal sclerotium density, S, of 1547 sclerotiam−2. While 1547 sclerotia m−2 is above theupper limit of 360 sclerotia m−2 estimated for asingle application of S. sclerotiorum to C. ar�ense-infested pasture (Bourdot et al., 2000), such ahigh density might be expected from the multiplehigh dose applications made to the C. ar�ensepatch modelled here.
The spore concentrations, C, at steady-statecalculated for each of the 340 cells at height, z, of0.6 m, is shown in Fig. 6a. The spore concentra-tion, C, which is 85 spores m−3 at the downwindedge of the source, increases to a maximum of88.2 spores m−3 at 0.8 m downwind. The ‘halfdistance’ for S. sclerotiorum of 8.6 m is in goodagreement with the dhalf of 9 m measured for theascospores of Pyrenopeziza brassicae (McCartney,
1994). This similarity is explained by P. brassicaespores being of similar size and thus similar set-tling velocity (�s 0.1 cm s−1, Lacey et al. (1987)),to those of S. sclerotiorum.
Using the simulated values of C, the depositionof spores onto Petri dishes on the ground(spores m−2 h−1) was calculated for the 340 bot-tom cells in the model as
Deposition=C1×T×�s
�z
where C1 is the spore concentration in the bottomcells, T is the deposition interval (602 s), �s is 0.002m s−1, and the thickness of the cells, �z, in thebottom layer is 0.05 m. The model was in gener-ally good agreement with the field deposition datafor 27 Nov. 1997, the day for which the modelwas calibrated with a measured value of C and u.Although, under-estimating four very high deposi-tion data values near the source’s downwind edge,it did mimic the relatively high measured deposi-tion within the spore source and the steep gradi-ent in deposition downwind of the edge of thesource (Fig. 6b). By contrast, the model generallyover-estimated the deposition data averaged overnine days of measurement. This suggests that thevalue of C=85 for the downwind edge of thespore source used to calibrate the model wasunrepresentatively high; this is supported by thelower values for C measured on other days in theexperiment conducted by Bourdot et al. (2001).
Overall, it appears that SPORESIM-1D, modifiedto allow downwind dispersal, adequately predictsspore deposition gradients and atmospheric con-centrations over short distances downwind of aground-level source. We may assume then, that italso provides realistic estimates of the spore es-cape fraction, Ev.
3.5. Comparison of SPORESIM-1D with alternati�emodels
The purpose of SPORESIM-1D is to predict thefraction of spores that will escape a pasturecanopy under varying environmental conditions.The escape fraction, E, cannot be easily measuredand there is therefore no data with which theescape fractions predicted by SPORESIM-1D can be
M.D. de Jong et al. / Ecological Modelling 150 (2002) 83–105 97
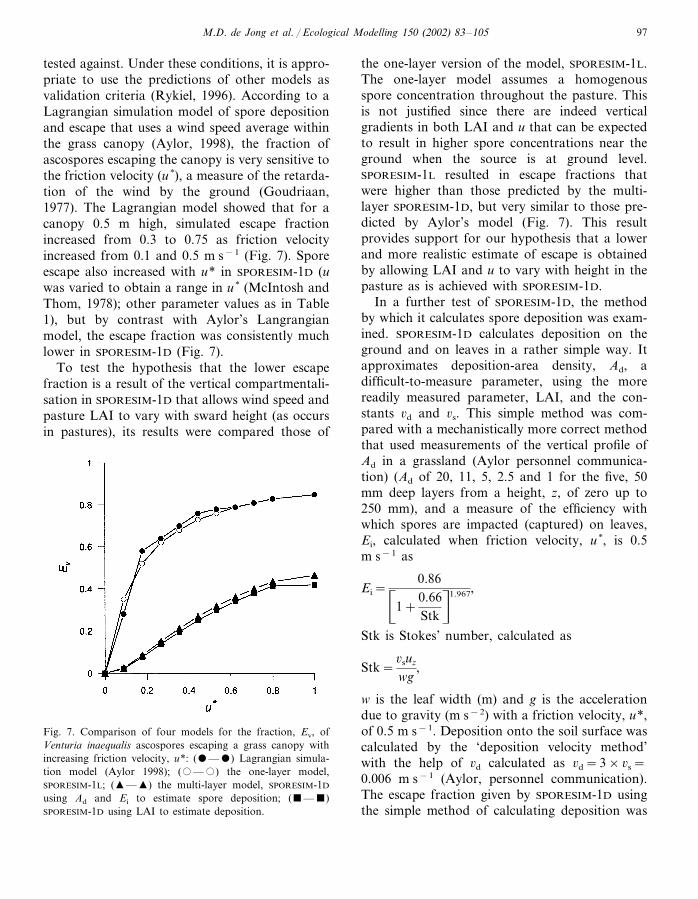
tested against. Under these conditions, it is appro-priate to use the predictions of other models asvalidation criteria (Rykiel, 1996). According to aLagrangian simulation model of spore depositionand escape that uses a wind speed average withinthe grass canopy (Aylor, 1998), the fraction ofascospores escaping the canopy is very sensitive tothe friction velocity (u*), a measure of the retarda-tion of the wind by the ground (Goudriaan,1977). The Lagrangian model showed that for acanopy 0.5 m high, simulated escape fractionincreased from 0.3 to 0.75 as friction velocityincreased from 0.1 and 0.5 m s−1 (Fig. 7). Sporeescape also increased with u* in SPORESIM-1D (uwas varied to obtain a range in u* (McIntosh andThom, 1978); other parameter values as in Table1), but by contrast with Aylor’s Langrangianmodel, the escape fraction was consistently muchlower in SPORESIM-1D (Fig. 7).
To test the hypothesis that the lower escapefraction is a result of the vertical compartmentali-sation in SPORESIM-1D that allows wind speed andpasture LAI to vary with sward height (as occursin pastures), its results were compared those of
the one-layer version of the model, SPORESIM-1L.The one-layer model assumes a homogenousspore concentration throughout the pasture. Thisis not justified since there are indeed verticalgradients in both LAI and u that can be expectedto result in higher spore concentrations near theground when the source is at ground level.SPORESIM-1L resulted in escape fractions thatwere higher than those predicted by the multi-layer SPORESIM-1D, but very similar to those pre-dicted by Aylor’s model (Fig. 7). This resultprovides support for our hypothesis that a lowerand more realistic estimate of escape is obtainedby allowing LAI and u to vary with height in thepasture as is achieved with SPORESIM-1D.
In a further test of SPORESIM-1D, the methodby which it calculates spore deposition was exam-ined. SPORESIM-1D calculates deposition on theground and on leaves in a rather simple way. Itapproximates deposition-area density, Ad, adifficult-to-measure parameter, using the morereadily measured parameter, LAI, and the con-stants �d and �s. This simple method was com-pared with a mechanistically more correct methodthat used measurements of the vertical profile ofAd in a grassland (Aylor personnel communica-tion) (Ad of 20, 11, 5, 2.5 and 1 for the five, 50mm deep layers from a height, z, of zero up to250 mm), and a measure of the efficiency withwhich spores are impacted (captured) on leaves,Ei, calculated when friction velocity, u*, is 0.5m s−1 as
Ei=0.86�
1+0.66Stk
n1.967,
Stk is Stokes’ number, calculated as
Stk=�suz
wg,
w is the leaf width (m) and g is the accelerationdue to gravity (m s−2) with a friction velocity, u*,of 0.5 m s−1. Deposition onto the soil surface wascalculated by the ‘deposition velocity method’with the help of �d calculated as �d=3×�s=0.006 m s−1 (Aylor, personnel communication).The escape fraction given by SPORESIM-1D usingthe simple method of calculating deposition was
Fig. 7. Comparison of four models for the fraction, Ev, ofVenturia inaequalis ascospores escaping a grass canopy withincreasing friction velocity, u*: (�—�) Lagrangian simula-tion model (Aylor 1998); (�—�) the one-layer model,SPORESIM-1L; (�—�) the multi-layer model, SPORESIM-1D
using Ad and Ei to estimate spore deposition; (�—�)SPORESIM-1D using LAI to estimate deposition.

M.D. de Jong et al. / Ecological Modelling 150 (2002) 83–10598
Fig. 8. The progression of LAI of pastures rotationally grazedby either sheep (�----�) or dairy cattle (�—�) in Canter-bury, New Zealand from 11 September 1996 until 16 January1997. For sheep pasture, the fitted linear regression is LAI=3.38–0.0124t (R2=0.747) and for dairy pasture LAI=5.24–0.0081t (R2=0.885) where t is days after 31 August 1996.
agement, we can expect that there will also bedifferences in the escape fraction between thesesystems.
Before using SPORESIM-1D to determine the ex-tent to which pasture grazing management willinfluence the escape of S. sclerotiorum ascosporesfollowing an earlier weed biocontrol application,knowledge of the LAI of such pastures is neces-sary. To this end the seasonal patterns in the LAIof pastures on dairy and sheep farms in Canter-bury, New Zealand, were measured during thespring and summer of 1996–1997; the periodwhen sporulation of S. sclerotiorum occurs inpasture (Bourdot et al., 2001). Ten fields undergrazing on each of ten dairy and ten sheep farmswere selected at random from the area of theCanterbury Plains delineated by the topographicalmap (NZMS 1 S83 (BURNHAM) scale 1:63 360).On each of four occasions (11–13/9/96, 9–11/10/96, 28–29/11/96 and 15–16/1/97) in each of thetwenty fields, six quadrat areas, 150 mm×150mm, were positioned ca. 10 m apart along adiagonally positioned transect line. The pastureplants in each quadrat were removed by cutting atthe soil surface and the sample was weighed. Thesurface area of the plants in a sub-sample fromeach sample was measured with a planimeter,scaled up by weight to the area sampled, anddivided by the quadrat area to calculate the pas-ture LAI.
Linear regressions of LAI against time showeda tendency for LAI to decline during the season inboth the sheep and dairy pastures (Fig. 8). Theoverall mean for the LAI of sheep-grazed pasturewas 2.8, but individual fields varied from 0.2 to6.3. By contrast the overall mean for the LAI ofcattle-grazed pasture was 4.9 with individual fieldsvarying from 1.7 to 9.4.
To model the effect of variation in pasture LAIon the escape of ascospores from pasture,SPORESIM-1D was parameterised using values ofLAI of 2–7, encompassing the range of the meansof the measured LAI values (Fig. 8). Otherparameter values used were windspeed, ur, of 3m s−1 and pasture height, h, of 0.25 m. Withthese parameter settings wind speed near theground (layer 1 of the model) declined from 0.38m s−1 at an LAI value of 2 to a very low speed of
equal to the escape fraction given by SPORESIM-1D using the more complex method of calculatingdeposition (Fig. 7). Thus, we conclude that thesimple method for deposition using the readilymeasured parameter, LAI, in conjunction withand �d, is satisfactory.
4. Simulating escape of Sclerotinia sclerotiorumascospores from pasture under different grazingmanagement regimes
The validation tests in Sections 3.1 and 3.5indicate that SPORESIM-1D is an acceptable modelfor estimating the fraction of spores escaping agrass canopy. Thus, we can use it with someconfidence to investigate how pasture manage-ment may influence the escape of ascospores pro-duced at the base of a pasture following theapplication of S. sclerotiorum as a weed biocon-trol agent. Since spores are removed from the airinside a pasture by impaction onto plant surfacesand the size of this surface will vary greatlybetween types of grazing systems and their man-
M.D. de Jong et al. / Ecological Modelling 150 (2002) 83–105 99
0.05 m s−1 when LAI was 7. Exchange resistance,r, increased from 5.5 to 77.6 s m−1 and the con-
centration of ascospores, C, in the bottom layerincreased 1.61 fold, from 1952 to 3144spores m−3, as LAI increased from 2 to 7. Thefraction of ascospores escaping vertically from themodel pasture declined by an order-of-magnitudeas LAI increased from 2 to 7 as a result ofincreasing deposition of spores on the pastureplant surfaces and on the ground (Fig. 9). Theseresults imply that under the wind speed conditionstypical of Canterbury, the fraction of ascosporesescaping a pasture where the biocontrol agent hasbeen used will be substantially lower when cattlerather than sheep are being grazed. Additionallythe results reveal a potential for limiting sporeescape by reducing the frequency and/or intensityof grazing to maintain a high pasture LAI fromlate September until mid November in the yearafter S. sclerotiorum has been applied; the periodwithin which sporulation occurs in Canterburypastures (Bourdot et al., 2001).
In a further simulation using SPORESIM-1D weinvestigated the interacting effects of wind speedand pasture density management on the escapefraction, Ev, by varying wind speed, u, (from 0.1to 7 m s−1; representative of commonly occurringhourly mean values in Canterbury; Table 3), andLAI (2, 5 and 7; representing sheep-grazed, cattle-grazed and non-grazed pasture, respectively). Inthis simulation an escape height, h, of 1.5 m waschosen, resulting in slightly reduced escape frac-tions compared to the previous analysis where theescape height was 0.25 m. Escape heights greaterthan 1 m are required for generating valid point-source spore emission rates as input for a Gaus-sian model (Erbrink, 1995) an intendedelaboration of the current study to evaluate long-distance dispersal and minimum isolation dis-tances (de Jong et al., 1999). The simulated data(symbols in Fig. 10) reveal that spore escapeincreases with wind speed and that escape is re-duced by increasing pasture LAI over the range ofwind speeds tested. It is also evident that theproportional reduction in escape with increasingpasture LAI is greater the lower the wind speed(i.e. the spore trapping effect of pasture vegetationappears to be greatest at low wind speeds). Forexample, at a wind speed, u, of 2 m s−1, the
Fig. 9. The effect of pasture LAI on the fraction of sporesescaping vertically above the pasture (Ev) (�—�), depositingon pasture plant surfaces (Dleaf) (�—�), and depositing onthe soil (Dsoil) (�—�) as determined using SPORESIM-1D.The sum of all fractions (excluding Eh) given as × — × .
Fig. 10. The effect of wind speed, u, on the fraction of spores,Ev, escaping vertically from a pasture for LAI values of 2 (�),5 (�) and 7 (�) representing sheep-grazed, cattle-grazed andun-grazed pastures, respectively, as simulated by the one-di-mensional area-source version of the model, SPORESIM-1D.Curves are fitted values using Eq. (8).

M.D. de Jong et al. / Ecological Modelling 150 (2002) 83–105100
escape fraction when LAI is 5 is only 7% of thatwhen LAI is 2, but when u is 7 m s−1 the escapefraction when LAI is 5 is 39% of that when LAIis 2.
5. A simple model for escape fraction as afunction of wind speed and pasture LAI
The escape fraction data generated bySPORESIM-1D (symbols in Fig. 10) indicate thatthere is a relationship between Ev and u and LAI.A simple description of this relationship would bea useful tool for calculating the escape fractionand hence the emission rate, Q, of a biocontrolsite for input into the Gaussian Plume model. Wederive an expression for this relationship below.
5.1. Steady-state spore dispersal and the �erticaleigenfunction
To derive a simple formula relating escape frac-tion, in-crop deposition, wind speed and diffusiv-ity we return to Eq. (1) and make the furtherassumption that all parameters are spatially in-variant. If the downwind length of the crop, xl, islarge, then it is reasonable to assume that themajority of the spore concentration downwind isat a ‘steady-state;’ that is
�C�x
=0 for large x.
Let C=F(z/h) denote this steady vertical eigen-function. Written in terms of F, Eq. (1) becomes
1h2 F�−
�s
hKF �−
�dAd
KF= −
Rspor
K�(z), (3)
where h is the height of the pasture canopy.Consider the time scale of spore deposition withinthe crop as compared with the time scale ofsettling. On the one hand, the time scale forsettling within the crop can be estimated by
tsettling�h�s
.
The time scale of deposition, by contrast, scales as
tdeposition�1
�dAd
.
If we assume that tdeposition� tsettling then we candeduce that
�s
h��dAd.
Consequently the second term on the left handside of Eq. (3) can be neglected, giving a reducedequation for the vertical eigenfunction:
F�−�dAd
Kh2F=F�−�2h2F= −
Rspor
Kh2�(z/h).
(4)
Eq. (4) can be solved directly
F�z
h�
=Rspor
K�e−�h(z/h)
=Rspor
�K�dAd
exp�
−h��dAd
Kzhn
Using C(z)=F(z/h) gives
Csteady=Rspor
�K�dAd
exp�
−��dAd
Kzn
(5)
which is an approximation for the verticaleigenfunction.
5.2. Escape fraction for the steady-state
The escape fraction, Ev, can be defined as theratio of spores outside the crop and the totalnumber of spores. On a per-time basis this is theratio of the rate of spore escape and the rate ofspore release, and since the rate of spore escape isthe rate of release (xlRspor) less the rate of deposi-tion within the crop, we may write
Ev=xlRspor−Rate of deposition
xlRspor
.
The rate of spore deposition within the crop canbe written
Rate of deposition=�dAd� h
0
� L
0
C dx dz.
Using Eq. (5) to approximate the integral on theright hand side, we get
M.D. de Jong et al. / Ecological Modelling 150 (2002) 83–105 101
Rate of deposition=�dAdL� h
0
Rspor
K�e−�z dz
=xlRspor�
1−exp�
−h��dAd
Kn�
.
Substituting this into the expression for Ev gives
Ev=xlRspor−xlRspor
�1−exp
�−h
��dAd
Kn�
xlRspor
=exp�
−h��dAd
Kn
. (6)
5.3. Escape fraction, leaf area and wind speed
It remains to determine how the escape fractiondepends on crop LAI and wind speed. If the eddydiffusivity varies directly with wind speed andinversely with the average vertical density ofleaves, the diffusivity becomes
K=�u
Ad
=�uh
LAI.
We have assumed that the average vertical leafdensity can be written Ad=LAI/h. Using theseassumptions the escape fraction (6) becomes
Ev=exp −h��dLAIh
�uhLAI
=exp�
−LAI� �d
�un
.
(7)
This provides a relatively simple, mechanisticallyderived model for escape fraction in terms of LAI,crop height and wind speed.
5.4. Fitting the model to data
To test the goodness-of-fit of Eq. (7), a version,
Ev=exp�
−bLAI
�u
n, (8)
was fitted to the escape fraction data generated bythe simulation model SPORESIM-1D in Section 4(Fig. 10). A nonlinear least-squares proceduregave a ‘best’ value of b=0.934�0.013 for a 95%confidence interval. Letting b=0.934 gave a corre-
lation coefficient r2=0.998, meaning that at least99% of the variance was described by the model.The goodness-of-fit of the simple model Eq. (8), isillustrated in Fig. 10 where the model is plottedalong with the simulated escape fraction data.
6. General discussion and conclusions
In this paper, we have described SPORESIM-1D,a simulation model for the dispersal of the as-cospores of S. sclerotiorum within and above (es-caping) a grass canopy based on the gradienttransfer theory (K-theory) of turbulent dispersal(McCartney and Fitt, 1985). This mechanisticmodel includes the effects of wind, turbulence anddeposition and is intended as a tool to assist ourunderstanding and management of the non-targetcrop disease risk that may be associated with theuse of S. sclerotiorum as a mycoherbicide for thecontrol of C. ar�ense in pastures in New Zealand(de Jong et al., 1999). It also provides generalinsights into the mechanisms of spread in thispathogen, and thus satisfies some of the deficiencyin our knowledge of S. sclerotiorum outlined byWegulo et al. (1999). The model’s context ordomain (Rykiel, 1996) is therefore the risk analysisof weed biocontrol. Its specific purpose is to deter-mine the fraction of S. sclerotiorum ascosporesreleased into the air at the base of a pasture thatescape from the canopy under a range of windspeeds and pasture cover densities typical of graz-ing lands. Given the biological risk analysis andmanagement context of this model, its validation(acceptability for its intended purpose) was con-sidered essential. To this end we have conductedvarious comparisons of data simulated bySPORESIM-1D (and two other versions of themodel) with field data (Figs. 3–6) and with othermodels (Fig. 7), and these have provided convinc-ing evidence that SPORESIM-1D is indeed a validmodel for calculating the fraction S. sclerotiorumspores that escape a pasture canopy.
Understanding the behaviour of the ‘escapefraction’ enables us to conduct two key compo-nents of a thorough risk analysis. One of these isto determine the extent that grazing management,by controlling the leaf area density of the pasture
��
�
�
�
��
�
�
�
M.D. de Jong et al. / Ecological Modelling 150 (2002) 83–105102
in which the S. sclerotiorum ascospores are beingreleased, may influence the deposition of as-cospores on the leaves of pasture plants and hencealso the escape fraction. We have used SPORESIM-1D for this purpose and have found that theescape fraction is reduced an order-of-magnitudeas the pasture LAI is increased from a value of 2,typical of rotationally grazed sheep pastures inCanterbury, New Zealand, to 7, a value typical ofnon-grazed pasture (Fig. 9). This result leads totwo conclusions. Firstly, the escape of S. sclerot-iorum ascospores, and hence the risk of additionaldisease in susceptible non-target crops plantedbeyond a mycoherbicide-treated pasture, will besubstantially lower if the pasture is either notgrazed or grazed by dairy cattle rather than bysheep during the spring period when ascosporesare being formed. Secondly, the intensity andtiming of grazing in the year following the use ofS. sclerotiorum in a pasture will have a pro-nounced influence on the numbers of ascosporesescaping, and hence also on the risk of additionaldisease in non-target crops beyond the biocontrolsite. Since sporulation in S. sclerotiorum in non-ir-rigated pasture in Canterbury is confined almostentirely to the three-month period from mid Sep-tember to mid November (Bourdot et al., 2001),stopping grazing during that period, or grazingmoderately, will significantly reduce the numbersof ascospores available for dispersal from thebiocontrol site.
The other essential component of a risk analysisis the definition of a ‘minimum isolation distance’(safety zone) for growing susceptible crops (deJong et al., 1999). The product of the escapefraction and the rate of release of the S. sclerotio-rum ascospores from apothecia at the base of apasture is the emission rate of the ascosporesource at the biocontrol site. This emission ratemay be used as the source term, Q, in a Gaussianplume model (McCartney and Fitt, 1985) to de-termine the concentration of these ‘additional’ascospores at distances beyond the source. Usinga time series approach in which Q is calculated ona small time step (hourly) for the period of theyear when ascospores are formed (1 Septemberuntil 30 November in pasture in Canterbury, NewZealand (Bourdot et al., 2001)), the average con-
centration of ascospores dispersed beyond thebiocontrol site may be obtained for a particularset of time-varying environmental conditions (in-cluding pasture LAI as affected by phenologicaland managerial processes). By comparison withmeasured or modelled concentrations of ‘natu-rally occurring’ S. sclerotiorum ascospores, asafety zone may be determined (de Jong et al.,1999). To facilitate such an analysis, it is desirableto have a simple yet adequate model for theescape fraction rather than a complex simulationmodel; a point of view expressed also by McCart-ney and Fitt (1985) in respect to developing gen-eral models of disease development for diseaseforecasting. To this end we have derived fromK-theory a simple one-parameter model that givesthe escape fraction as a function of pasture LAIand wind speed (Eq. (8)). This model provided agood-fit to escape data simulated by SPORESIM-1D
for a wide range of wind speed and pasture LAI(Fig. 10), indicating that it would provide accept-able estimates of the escape fraction for a timeseries analysis leading to the definition of a safetyzone. Such an analysis will be the subject of afurther contribution on the risk analysis of S.sclerotiorum as a mycoherbicide for pasture weedcontrol.
While the primary context of SPORESIM-1D isthe risk analysis of S. sclerotiorum used as amycoherbicide for controlling a C. ar�ense in pas-tures, the model’s context may also be consideredto include the management of sclerotinia blossomand fruit rot caused by S. sclerotiorum in kiwifruitvines (Actinidia deliciosa (A. Chev.) Liang et A.R.Ferg. [Syn. A. chinensis Planchon]). The incidenceof this disease in kiwifruit vines in New Zealandhas been observed to be lower in orchards under‘organic’ management than under conventional‘Kiwigreen’ management. It has been suggestedthat this may, in part, be a consequence of the tall(up to 1.0 m) within row herb lay composed of awide variety of plant species that is usuallypresent in organic orchards. By contrast, in con-ventional kiwifruit orchards, either a bare strip ismaintained by herbicide under T-bar vine supportsystems, or a very low (ca. 10 cm) grass sward ismaintained under a pergola system. The tall un-der-storey vegetation in organic kiwifruit orchards

M.D. de Jong et al. / Ecological Modelling 150 (2002) 83–105 103
is adopted primarily to promote high populationsof insect predator species and plant beneficialorganisms. However, it has been speculated itmay also be preventing the escape of S. sclerotio-rum ascospores from near ground level to thekiwifruit flowers in the canopy in the spring,thereby reducing disease incidence (Elmer person-nel communication). The results of our simula-tions with SPORESIM-1D where LAI has beenvaried support this hypothesis (Fig. 9). SPORESIM-1D thus provides an explanation for the observedreductions in disease in organic kiwifruit. Experi-mental manipulation of under-storey vegetation inkiwifruit orchards could be conducted to provideempirical data to test this hypothesis.
The context of SPORESIM-1D also includes man-agement of apple scab disease in apple treescaused by the ascomycete, V. inaequalis. Like S.sclerotiorum, this fungus also releases ascospores(of similar density to those of S. sclerotiorum)into the air at ground level and they must escapethe vegetation layer beneath the apple trees toinfect the apple fruit (Aylor, 1998). SPORESIM-1D
suggests that the incidence of apple scab diseasewill be reduced by the maintenance of a densevegetation canopy beneath the trees in an appleorchard. This hypothesis is being tested in fieldresearch programmes conducted by the Depart-ment of Biological Farming Systems of Wagenin-gen University in collaboration with the DutchFruit Growing Experiment Station in Randwijk,and in an organic apple orchard at the LincolnUniversity Biological Husbandry Unit, Canter-bury, New Zealand.
The maintenance of a dense vegetation cover tominimise the escape of the ascospores of both S.sclerotiorum and V. inaequalis may have addi-tional effects. For example, in the case of the useof S. sclerotiorum in pastures to control C. ar-�ense, the reduction in ascospore escape inSPORESIM-1D coincides with a higher depositionof ascospores near the base of the pasture. Thismay potentially promote new infections in theyear after application of the mycoherbicide (whensporulation occurs), enhancing the level of biolog-ical control. Another possible effect of high pas-ture cover densities could be a reduction in thenumbers of ascospores released by apothecium
populations as a result of low-light levels atground level. Low-light levels inhibit apothecialinitial development in the sclerotia of S. sclerotio-rum (Letham, 1975; Thaning and Nilsson, 2000)and ascospore liberation is also inhibited underdark conditions (Hartill, 1980). While these low-light-induced effects of high pasture cover maycancel out any enhancement of weed biocontrolresulting from a greater fraction of spores beingdeposited in the pasture, they would reduce therate of release of ascospores per unit pasturesurface, thereby lowering the emission rate of thebiocontrol site; an effect additional to that result-ing from the reduction in the escape fraction.Similarly, in V. inaequalis ascospores are releasedin fewer numbers under dark conditions (Brook,1969), again implying reductions in the emissionrate from a vegetation canopy in addition toreductions mediated by the lowered escape frac-tion.
Acknowledgements
We thank D.E. Aylor, Department of PlantPathology and Ecology, Connecticut AgriculturalUniversity, USA, for helpful suggestions duringthe development of SPORESIM-1D. We also thankP. Elmer, HortResearch, Ruakura Research Cen-tre, Hamilton, New Zealand; Professor R. Rab-binge, Plant Production Group, WageningenUniversity, Wageningen, The Netherlands; E.Chang, Naval Research Laboratory, WashingtonDC, USA; J.C. Zadoks, Emeritus Professor ofPhytopathology, Wageningen University, Wa-geningen, the Netherlands; W. van der Werf,Crop Weed Ecology Group, Department PlantSciences, Wageningen University, Wageningen,The Netherlands and D. Saville, G. Hurrell, S.Lamoureaux and Aaron Knight, AgResearch,Lincoln, New Zealand. The authors are gratefulto the following organisations for providing fundsfor this study: the Foundation for Research Sci-ence and Technology, New Zealand; StichtingJohanna Westerdijkfonds, Utrecht University,Utrecht, the Netherlands; Stichting’Fonds Land-bouw Export-Bureau 1916/1918’, WageningenUniversity, Wageningen, The Netherlands. We
M.D. de Jong et al. / Ecological Modelling 150 (2002) 83–105104
would also like to thank the US National ScienceFoundation for a grant supporting JP for researchvisits to Wageningen University in theNetherlands.
References
Aylor, D.E., 1982. Modeling spore dispersal in a barley crop.Agricultural Meteorology 26, 215–219.
Aylor, D.E., 1995. Vertical variation of aerial concentration ofVenturia inaequalis ascospores in an apple orchard. Phyto-pathology 85, 175–181.
Aylor, D.E., 1998. The aerobiology of apple scab. PlantDisease 82, 838–849.
Aylor, D.E., 1999. Biophysical scaling and the passive disper-sal of fungus spores: relationship to integrated pest man-agement strategies. Agricultural and Forest Meteorology97, 275–292.
Aylor, D.E., Ferrandino, F.J., 1985. Escape of Urediniosporesof Uromyces phaseoli from a Bean Field Canopy. Phyto-pathology 75, 1232–1235.
Aylor, D.E., Ferrandino, F.J., 1989. Dispersion of sporesreleased from an elevated line source within a wheatcanopy. Boundary-Layer Meteorology 46, 251–273.
Aylor, D.E., Qiu, J., 1996. Micrometeorological determinationof release rate of Venturia inaequalis ascospores from aground-level source during rain. Agricultural and ForestMeteorology 81, 157–178.
Aylor, D.E., Taylor, G.S., 1983. Escape of Peronosporatabacina spores from a field of diseased tobacco plants.Phytopathology 73, 525–529.
Aylor, D.E., Wang, Y., Miller, D.E., 1993. Intermittent windclose to the ground within a grass canopy. Boundary-LayerMeteorology 66, 427–448.
Bache, D.H., 1981. Analysing particulate dispersion to plantcanopies. Atmospheric Environment 15, 1759–1761.
Barlow, N.D., 1999. Theoretical approaches in biological con-trol. In: Hawkins, B.A., Cornell, H.V. (Eds.), Models inBiological Control: a Field Guide. Cambridge UniversityPress, Cambridge, pp. 43–68.
Bourdot, G.W., Harvey, I.C., 1996. The potential of thefungus Sclerotinia sclerotiorum as a biological herbicide forcontrolling thistles in pasture. Plant Protection Quarterly11, 259–262.
Bourdot, G.W., Harvey, I.C., Hurrell, G.A., Saville, D.J.,1995. Demographic and biomass production consequencesof inudative treatment of Cirsium ar�ense with Sclerotiniasclerotiorum. Biocontrol Science and Technology 5, 11–25.
Bourdot, G.W., Hurrell, G.A., Saville, D.J., de Jong, M.D.,2000. Risk analysis of Sclerotinia sclerotiorum for biologi-cal control of Cirsium ar�ense in pasture: sclerotium sur-vival. Biocontrol Science and Technology 10, 411–425.
Bourdot, G.W., Hurrell, G.A., Saville, D.J., de Jong, M.D.,2001. Risk analysis of Sclerotinia sclerotiorum for biologi-cal control of Cirsium ar�ense in pasture: ascospore disper-sal. Biocontrol Science and Technology 11, 121–142.
Brook, P.S., 1969. Stimulation of ascospore release in Venturiainaequalis by far red light. Nature 222 (April 26), 390–392.
Chamberlain, A.C., 1975. The movement of particles in plantcommunities. In: Monteith, J.L. (Ed.), Principles. In: Vege-tation and the Atmosphere, vol. 1. Academic Press, Lon-don, pp. 155–203.
Davis, J.M., Monahan, J.F., 1991. Climatology or air parceltrajectories related to the atmospheric transport of Per-onospora tabacina. Plant Disease 75, 706–711.
Dennis, R.W.G., 1968. British Ascomycetes. J. Cramer, Ger-many, 455pp.
Di-Giovanni, F., Becket, P.M., Flenley, J.R., 1989. Modellingof dispersion and deposition of tree pollen within a forestcanopy. Grana 28, 129–139.
DuChateau, P., Zachmann, D.W., 1986. Theory and Problemsin Partial Difference Equations. McGraw-Hill, New York,241pp.
Erbrink, J.J., 1995. Use of boundary-layer meteorologicalparameters in the Gaussian model ‘STACKS’. Boundary-Layer Meteorology 9431, 1–25.
Evans, H., 2000. Evaluating plant pathogens for biologicalcontrol of weeds: An alternative view of pest risk assess-ment. Australasian Plant Pathology 29, 1–14.
Flesch, T.K., Wilson, J.D., 1992. A two-dimensional trajec-tory-simulation model for non-Gaussian inhomogenousturbulence within plant canopies. Boundary-Layer Meteo-rology 61, 349–374.
Goudriaan, J., 1977. Crop Meteorology: a Simulation Study.Pudoc, Wageningen, 249pp.
Gregory, P.H., 1961. The Microbiology of the Atmosphere.Leonard Hill, London, 252pp.
Hartill, W.F.T., 1980. Aerobiology of Sclerotinia sclerotiorumand Botrytis cinerea spores in New Zealand tobacco crops.New Zealand Journal of Agricultural Research 23, 259–262.
Hartill, W.F.T., Underhill, A.P., 1976. Puffing’ in Sclerotiniasclerotiorum and S. minor. New Zealand Journal Botany14, 355–358.
Ingold, C.T., 1971. Fungal Spores. Their Liberation and Dis-persal. Clarendon Press, Oxford, 302pp.
de Jong, M.D., 1988. PhD thesis, Wageningen University,138pp.
de Jong, M.D., 1992. Risk assessment for the application ofbiological control of a forest weed by a common plantpathogenic fungus. Risk Analysis 12, 465–466.
de Jong, M.D., Wagenmakers, P.S., Goudriaan, J., 1991.Modelling the escape of Chondrostereum purpureum sporesfrom a larch forest with biological control of Prunusserotina. Netherlands Journal of Plant Pathology 97, 55–61.
de Jong, M.D., Aylor, D.E., Bourdot, G.W., 1999. A method-ology for risk analysis of plurivorous fungi in biologicalweed control: Sclerotinia sclerotiorum as a model. BioCon-trol 43, 397–419.
de Jong. M.D., Bourdot, G.W., Hurrell, G.A., Erbrink, J.,2002. Software for simulation of ascospore dispersal inSclerotinia sclerotiorum within and outside a grassland
M.D. de Jong et al. / Ecological Modelling 150 (2002) 83–105 105
after biological control of creeping thistle (Cirsium ar-�ense), in preparation.
Kohli, Y., Brunner, L.J., Yoell, H., Milgroom, M.G., Ander-son, J.B., Morrall, R.A.A., Kohn, L.M., 1995. Clonaldispersal and spatial mixing in populations of the plantpathogenic fungus, Sclerotinia sclerotiorum. MolecularEcology 4, 69–77.
Lacey, M.E., Rawlinson, C.J., McCartney, H.A., 1987. Firstrecord of the natural occurrence in England of the tele-omorph of Pyrenoziza brassicae on oilseed rape. Transac-tions of the British Mycological Society 89, 135–140.
Leffelaar, P.A., 1993. Basic elements of dynamic simulation.In: Leffelaar, P.A. (Ed.), On Systems Analysis and Simula-tion of Ecological Processes with Examples in CSMP andFORTRAN. Kluwer, Dordrecht, The Netherlands, p. 294(see pp. 11–27).
Legg, B.J., 1983. Movement of plant pathogens in the cropcanopy. Philosophical Transactions of the Royal Society,London B 302, 559–574.
Legg, B.J., Bainbridge, A., 1978. Air movement within a crop:spore dispersal and deposition. In: Scott, P.R. (Ed.), PlantDisease Epideimiology. Blackwell Scientific Publications,Oxford, UK, pp. 103–110.
Legg, B.J., Powell, F.A., 1979. Spore dispersal in a barleycrop: a mathematical model. Agricultural Meteorology 20,47–67.
Letham, D.B., 1975. Stimulation by light of apothecial initialdevelopment of Sclerotinia sclerotiorum. Transactions ofthe British Mycological Society 65, 333–335.
McCartney, H.A., 1994. Dispersal of spores and pollen fromcrops. Grana 33, 76–80.
McCartney, H.A., Fitt, B.D.L., 1985. Construction of disper-sal models. Advances in Plant Pathology 3, 107–143.
McIntosh, D.H., Thom, A.S., 1978. Essentials of Meteorol-ogy. Wykeham, London, 240pp.
Nassiri, M., Elgersma, A., Lantinga, E.A., 1996. Verticaldistribution of leaf area, dry matter and radiation ingrass-clover mixtures. In: Parente, G., Frame, J., Orsi, S.(Eds.), Grassland and Land use systems 16th EGF Meet-ing, pp. 269–274.
Park, E.W., Kim, K.R., 1995. Rice blast forecasting systembased on near real-time microclimate data. Phytopathology85, 1172 (abstract).
Pennycook, S.R., 1989. Plant diseases recorded in NewZealand. Plant Diseases Division. DSIR, Auckland.
Pielaat, A., Madden, L.V., Gort, G., 1998. Spores splashingunder different environmental conditions: a modelling ap-proach. Phytopathology 88, 1131–1140.
Raupach, M.R., 1989. Applying Lagrangian fluid mechanicsto infer scalar source distributions from concentration
profiles in plant canopies. Agricultural and Forest Meteo-rology 47, 85–108.
Rijsdijk, F.C., Rappoldt, K., 1979. A Model of Spore Disper-sal inside and above Canopies. Proc. 1st Int. Conf. onAerobiology, 1978, pp. 407–410.
Rykiel, E.J., 1996. Testing ecological models: the meaning ofvalidation. Ecological Modelling 90, 229–244.
Sawyer, A.J., Griggs, M.H., Wayne, R., 1994. Dimensions,density, and settling velocity of Entomophtoraleanconidia— implications for aerial dissemination of spores.Journal Invertebrate Pathology 63, 43–55.
Shaw, M.W., 1994. Modeling stochastic processes in plantpathology. Annual Review Phytopathology 32, 523–544.
Slinn, W.G.N., 1982. Predictions for particle deposition tovegetative surfaces. Atmospheric Environment 16, 1785–1794.
Stigter, C.J., Goudriaan, J., Bottemanne, F.A., Birnie, J.,Lengkeek, J.G., Sibma, L., 1977. Experimental evaluationof a crop climate simulation model for Indian Corn (Zeamays L.). Agricultural Meteorology 18, 163–186.
Teng, P.S., Yang, X.B., 1993. Biological impact and riskassessment in plant pathology. Annual Review of Phyto-pathology 31, 495–521.
Thaning, C., Nilsson, H.E., 2000. A narrow range of wave-lengths active in regulating apothecial development in Scle-rotinia sclerotiorum. Journal of Phytopathology 184,627–631.
Wagenmakers, P.S., 1984. MSc thesis, Department of Theoret-ical Production Ecology, Wageningen University, 58pp.
Waggoner, P.E., Furnival, G.M., Reifsnyder, W.E., 1969.Simulation of the microclimate in a forest. Forestry Sci-ence 15, 37–45.
Ward, S.A., Wagenmakers, P.S., Rabbinge, R., 1989. Disper-sal and dispersion in space. In: Rabbinge, R., Ward, S.A.,van Laar, H.H. (Eds.), Simulation and System Manage-ment in Crop Protection. PUDOC, Wageningen, pp. 99–118.
Wegulo, S.N., Sun, P., Martinson, C.A., Yang, X.B., 1999.Spread of Sclerotinia stem rot of soybean from area andpoint sources of apothecial inoculum. Canadian Journal ofPlant Science 80, 389–402.
Yang, Y., Wilson, L.T., Makela, M.E., Marchetti, M.A., 1998.Accuracy of numerical methods for solving the advection–diffusion equation as applied to spore and insect dispersal.Ecological Modelling 109, 1–24.
Yao, C., Arya, S.P.S., Davis, J.M., Main, C.E., 1997. Anumerical model of transport and diffusion of Peronosporatabacina spores in the evolving atmospheric boundarylayer. Atmospheric Environment 31, 1709–1714.