a model to construct time series international input...
TRANSCRIPT

1
A Model to Construct Time Series International Input-output (IIO) Database
Zhi Wang
United States International Trade Commission*
*The views expressed in this presentation are solely those of the presenter. It is not meant to represent in anyway the views of the U.S. International Trade Commission or any of its individual Commissioners.
.

2
Presentation Outline
• Objective and Motivations
• Basic Ideas of the adjustment framework
• Model Specification
• Data Sources to Test the Model
• Preliminary Test Results
• Problems and Future Work

3
Objectives
• Develop a formal model integrating individual countries’ input-output tables with bilateral trade statistics to estimate an consistent annual inter-country input-output (ICIO) account for the world.
• Implement and test the model with real world data from 1995 to 2007. IO data from OECD and national sources, National accounts and trade in goods from UN, trade in services from IMF and OECD.
4
Motivation Facilitate the research and analysis of global value chain
and Dynamic AGE modeling
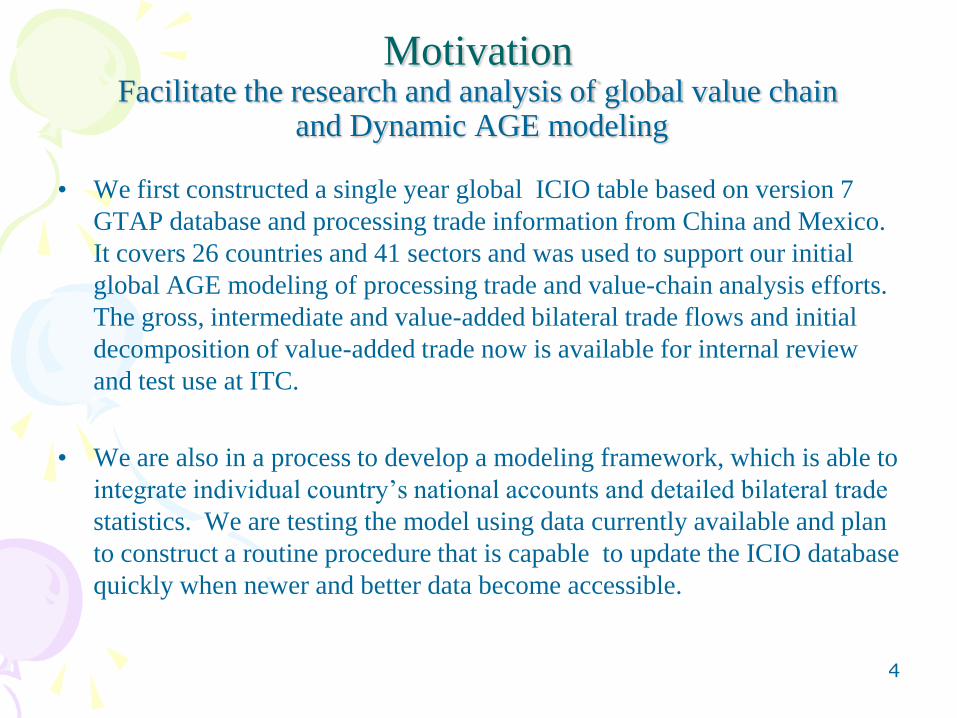
• We first constructed a single year global ICIO table based on version 7
GTAP database and processing trade information from China and Mexico.
It covers 26 countries and 41 sectors and was used to support our initial
global AGE modeling of processing trade and value-chain analysis efforts.
The gross, intermediate and value-added bilateral trade flows and initial
decomposition of value-added trade now is available for internal review
and test use at ITC.
• We are also in a process to develop a modeling framework, which is able to
integrate individual country’s national accounts and detailed bilateral trade
statistics. We are testing the model using data currently available and plan
to construct a routine procedure that is capable to update the ICIO database
quickly when newer and better data become accessible.

5
Basic Ideas of the Procedure
• Initial estimates of the same economic
variables from different sources
• A set of well defined consistency conditions
and other constraints
• Reliability information on the initial
estimates

6
Problems of Proportional Adjustment in National Income Account
Components of U.S. GDP, 2002, Billion U.S. Dollars
GDI Components Value
Value
Share
Adjustment
by proportion CV
Compensation of employees 5977.4 0.575 32.97 0.95
Indirect businesss tax and nontax liability 800.4 0.077 4.41 2.31
Private consumption of fixed capital 1163.9 0.112 6.42 3.56
Nonfarm proprietors' income 743.7 0.072 4.10 3.74
Net interest 684.2 0.066 3.77 5.86
Corporate profits 787.4 0.076 4.34 8.35
Businesss transfer payments 44.1 0.004 0.24 19.86
Rental income of persons 142.4 0.014 0.79 23.45
Subsidies 32.5 0.003 0.18 26.51
Farm proprietors' income 12.9 0.001 0.07 48.89
Sum 10388.9 1 57.30
Gross domestic product 10446.2
Difference 57.3

7
Country
China
reported
Exports to
Partners
Hong Kong
domestic
exports to
partner
China re-
exports to
partner via
Hong Kong
Partners
imports
from China
and Hong
Kong
Statistical
discrepancy %
Malta 273 5 20 92 -200.4
Russia 9,102 119 361 4,744 -110.4
Korea 27,810 2,111 2,832 32,853 -1.8
Japan 73,222 4,268 11,977 94,911 3.4
Problems of Proportional Adjustment in International Trade Statistics
China & Hong Kong reported exports and partner reported imports, 2004, Million Dollars

8
A Three-Stage Optimization Procedure (1)
Decompose the adjustment process into three Stages
• Model structure determined by available statistics
• Make full use of all available information
• Reduce model dimension
• First Stage:
– Reconcile total merchandise and service trade statistics
with each country’s reported total export to and import
from the world
– Constraint: global export supply plus international
transportation margin equals global import demand for
each goods and service group.
9
A Three-Stage Optimization Procedure (2)
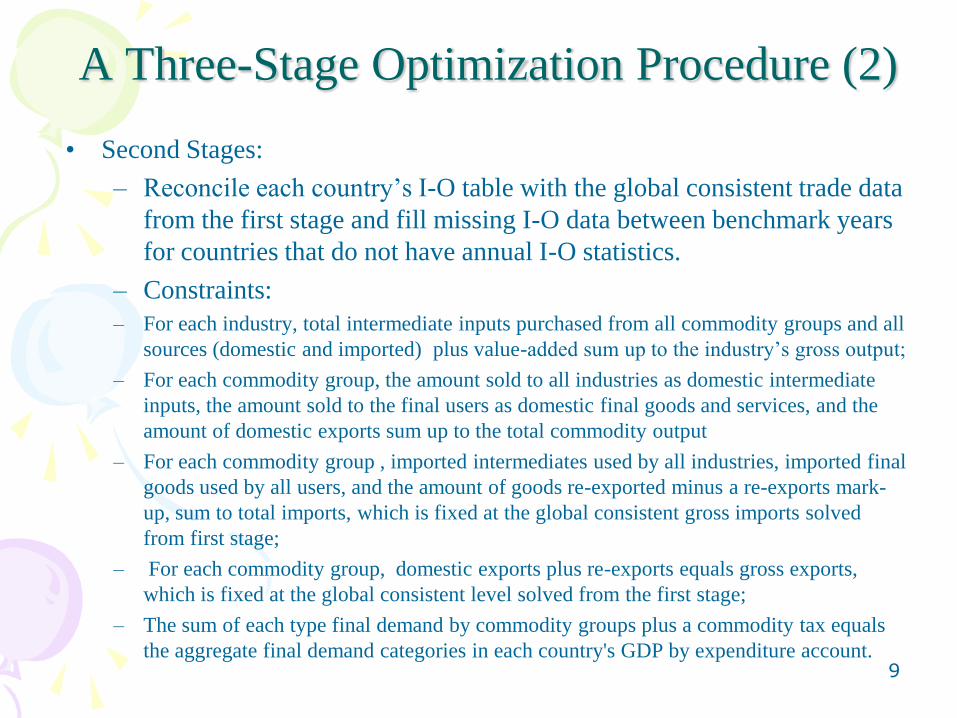
• Second Stages:
– Reconcile each country’s I-O table with the global consistent trade data
from the first stage and fill missing I-O data between benchmark years
for countries that do not have annual I-O statistics.
– Constraints:
– For each industry, total intermediate inputs purchased from all commodity groups and all
sources (domestic and imported) plus value-added sum up to the industry’s gross output;
– For each commodity group, the amount sold to all industries as domestic intermediate
inputs, the amount sold to the final users as domestic final goods and services, and the
amount of domestic exports sum up to the total commodity output
– For each commodity group , imported intermediates used by all industries, imported final
goods used by all users, and the amount of goods re-exported minus a re-exports mark-
up, sum to total imports, which is fixed at the global consistent gross imports solved
from first stage;
– For each commodity group, domestic exports plus re-exports equals gross exports,
which is fixed at the global consistent level solved from the first stage;
– The sum of each type final demand by commodity groups plus a commodity tax equals
the aggregate final demand categories in each country's GDP by expenditure account.

10
A Three-Stage Optimization Procedure (3)
• Third Stage: Integrate individual country’s I-O statistics with
international bilateral trade statistics to produce a consistent
annual global inter-country input-output table (ICIO)
– Allocate each country’s total export and imports in every commodity
group into its trading partners based on UN COMTRADE
(merchandise trade) and OECD (Services) bilateral trade data.
– Allocate of each commodity group into to intermediate and final uses is
based on the UN BEC method.
– Each country’s total exports and imports from the world from the first
stage as controls
– Bilateral flows at each trade route are controlled in the interval between
mirrored trade statistics (both partner reported data) or with minimum
deviation

11
Why BEC is Better than Proportional Assumption
Intermediates as % of U.S. Imported Electronic Machinery, 2004
0 10 20 30 40 50 60 70 80 90 100
JapanEFTA
Australia & New ZealandEU 15
CanadaHong Kong
KoreaTaiwan
Viet NamThailand
ChinaIndonesiaMalaysia
Rest of east asiaPhilippines
IndiaSouth Asia
BrazilMexicoEU 12
REST OF THE WORLDSouth Africa
Russian FederationRest of America
World (BEC)
Proportion method
Percent of total imports
Proportion methods
assumes the
intermediate share in
US import use table
(54.2%) is the same for
all imports sources
BEC is able to roughly identify the product
composition difference of each source based on 6-
digit HS trade data.

12
What BEC Can Help and What It Can’t
• Intermediate goods identified from gross trade flows are the
row sum of each block matrix Ars in the IO coefficient matrix A.
• End use classification such as BEC can help improve the
accuracy of IO coefficients in IRIO table by giving better row
total control for each block matrix in A.
• To allocate intermediate inputs to each industry after they enter
the importing country, we still rely on proportion assumptions,
which may distort the value-added distribution at industry level
computed from IRIO table. More reliable data collected by
national and international agencies are needed to overcome this
limitation.

13
Reliability of Reported Trade Statistics
• Mirror trade statistics are the major data
source to estimate the reliability weights
• Econometric analysis of discrepancies
between the two reported trade data of
the same trade flows provide estimates of
data reliability

14
Auto regression with dummy variables
aV
eV i
it )1()(
)( 2
Dbbeae it
k
t
n
k
k
iiitiit
1
0
1
e: mirror trade statistics discrepancies
b: symmetric bias
D: dummy variables. Represent events have a
significant impact on the reporting practice in
the two reporting countries
the variance:
15
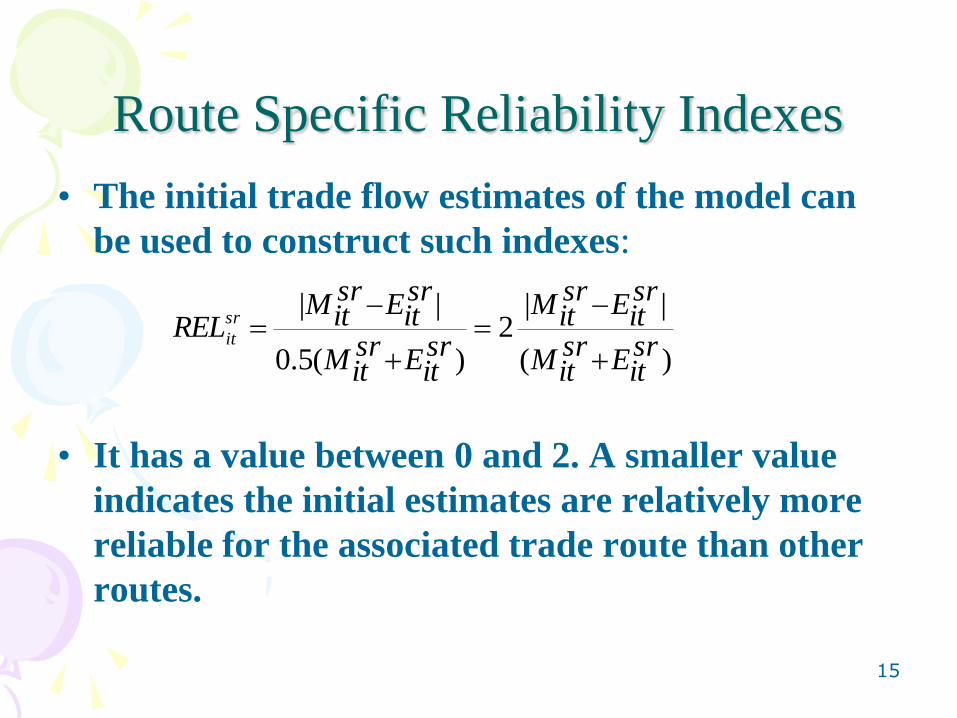
Route Specific Reliability Indexes
• The initial trade flow estimates of the model can
be used to construct such indexes:
• It has a value between 0 and 2. A smaller value
indicates the initial estimates are relatively more
reliable for the associated trade route than other
routes.
)(
||2
)(5.0
||
sritEsr
itM
sritEsr
itM
sritEsr
itM
sritEsr
itM RELsr
it

16
Reporter Specific Reliability Indexes
• It is the share of accurately reported trade in total trade
(less than 20 percent discrepancies in mirrored data)
• All bilateral trade data in the world need to be used to
construct the reporter specific reliability indexes
• It has a value between 0 and 1. A large value indicates the
initial estimates reported by the country are relatively more
reliable for its reported exports or imports than other reporters
• The weights in the objective function of the model can be
assigned by multiplying one minus the indexes by their
corresponding initial values

17
The Adjustment Problems
Adjust a given set of initial trade and IO statistics
according to an objective function to satisfy
accounting and consistence constraints. Such as
g
rr
t
r
r
t
r
tn
i iti
itit
g
rr
t
r
r
t
r
tg
ss
t
s
s
t
s
t
n
ir
it
r
i
r
it
r
it
g
=1r
g
s
n
is
it
s
i
s
it
s
it
CIFRIM
CIFCIF
CIFRIM
CIFCIF
WTMRIM
WTMWTM+
WTXRIX
WTXWTX
WMRIM
WMWM
WXRIX
WXWX
1
2
1
2
1
2
1
2
1
2
1 1
2
)1(
)0(
0)1(
)0(
)0)1(
)0(
0)1(
)0((100
0)1(
)0(
0)1(
)0(
= SMin

18
Theoretical Properties• By imposing valid binding constraints, the optimization procedure
will definitely improve, or at least not worsen, the initial statistics estimates.
• In all but the trivial case, posterior estimates derived from entropy or quadratic loss function will always be closer to the unknown, true values than the associated initial statistics(Harrigan,1990)
• Statistical interpretations underlying the model differ when different reliability weights are used
• The choice of weights in the objective function has a large impact on the estimation results. The model uses these weights to determine by how much an initial estimate may be changed. The larger the weights, the smaller its contribution to the objective function, and hence the lesser the penalty for each adjusted variable to move away from its initial value (only the relative, not the absolute size of the weights affects the solution).

19
Why Adjusted Estimates are Better?
• D0: Initial estimates
• W variance matrix of initial estimates ,
• A coefficient matrix of all linear constraints AD* = 0
• The BLUE :
• D* will never be worse than D0 with equal or smaller
variance
])([ 1* AAWAWAID TT
AWAWAWAWWAAWAWAI 11 )(])([*)( TTTTDVar

20
Empirical Advantages• Completeness
– Complete use of all information from official statistics
• Flexibility– Additional constraints can be easily imposed to allow, for example,
upper and lower bonds to be placed on unknown elements (this is very common in mirrored trade statistics), or inequality conditions to be added. It is also very flexible regarding to the required known information and allows missing data in certain block of the I-O matrix, as long as the sum of the elements within the block is known.
• Incorporation of data reliabilities in a systemic way– Using properly selected reliability weights, the optimal solution yields
estimates deviate less from the initial estimates with higher degrees of reliability than for those with lower degrees of reliability. The reliability weights can be put into an array that has the same dimension and structure as the initial estimates. Therefore, considerable amount of information regarding to the quality of the initial statistics could be incorporated into the data reconciliation process.

21
Data Source (1)Trade Data
• There were significant differences in values among different
sources (UN National Accounts, UNCTAD, IMF’s IFS and
BOP database, WITS- COMTRADE, and the OECD trade
statistic)
• We use country total gross exports to and imports from the
world from the UN National Account Estimates as aggregate
controls
• WITS-COMTRADE for country sector total and detailed
bilateral merchandise trade (aggregate from HS-6)
• IMF BOP for country sector total and OECD statistics for
detailed bilateral services trade.
• All trade data are from 1995-2007

Total World Trade from UN National Account is Very Close to Data Reported by Other Sources
22

Total Service Trade from UN National Account is Very Close to Data Reported by Other Sources
23
24
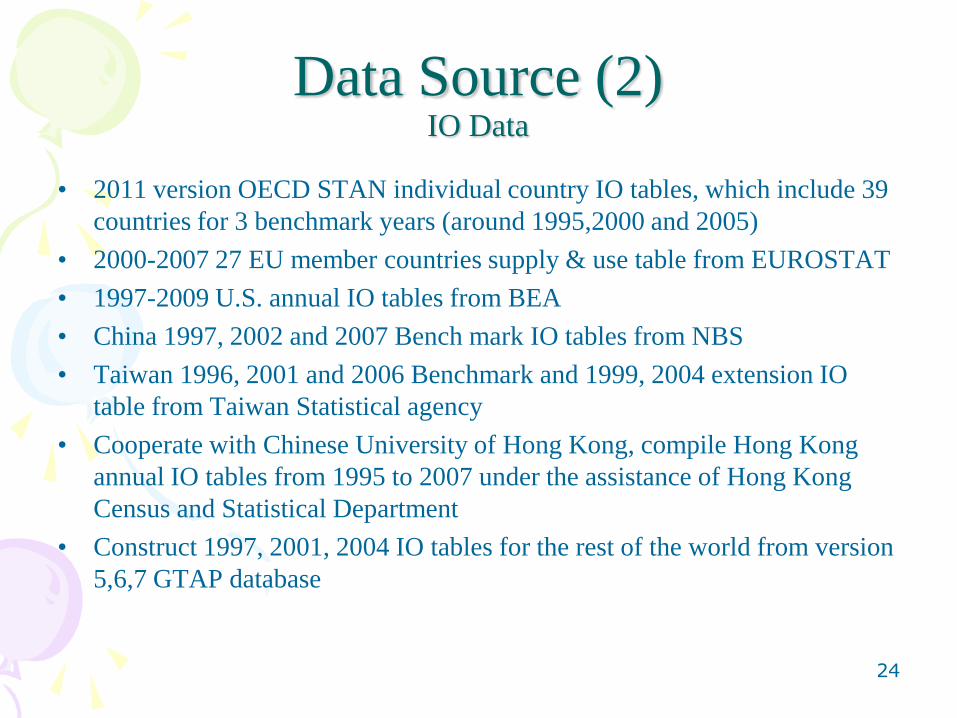
Data Source (2)IO Data
• 2011 version OECD STAN individual country IO tables, which include 39
countries for 3 benchmark years (around 1995,2000 and 2005)
• 2000-2007 27 EU member countries supply & use table from EUROSTAT
• 1997-2009 U.S. annual IO tables from BEA
• China 1997, 2002 and 2007 Bench mark IO tables from NBS
• Taiwan 1996, 2001 and 2006 Benchmark and 1999, 2004 extension IO
table from Taiwan Statistical agency
• Cooperate with Chinese University of Hong Kong, compile Hong Kong
annual IO tables from 1995 to 2007 under the assistance of Hong Kong
Census and Statistical Department
• Construct 1997, 2001, 2004 IO tables for the rest of the world from version
5,6,7 GTAP database

25
Mean Absolute Percentage Adjustment
• Measurement of adjustment from official
statistics: only the proportionate deviation and
not the absolute deviation that matters
rt
g
=1r=t
rtrt
g
=1r=1tC
X
|XX | 100
= MAPA
0
0
2008
1995
2008
995

26
Reporter Reliability and Mean Absolute Percentage Adjustment of UN country total
goods exports, 1995 -2007
More reliable data get less adjustment

27
Reporter Reliability and Mean Absolute Percentage Adjustment of UN country total
goods imports, 1995 -2007

28
0
0.1
0.2
0.3
0.4
0.5
0.6
0.7
0.8
0.9
0
5
10
15
20
25
30
35
40
I21 I5
I20
I15
I16
I17 I8 I1 I4
I13 I2
I12
I11
I18
I10 I9 I6
I14 I3 I7
I19
Reli
ab
ilit
y
Perc
en
tage
Reporter Reliability and Mean Absolute Percentage
Adjustment of World Goods Export by sectors
1995-2007
%expadj RIX-total
Sector adjustments impact by both the initial
discrepancies and data reliability
29
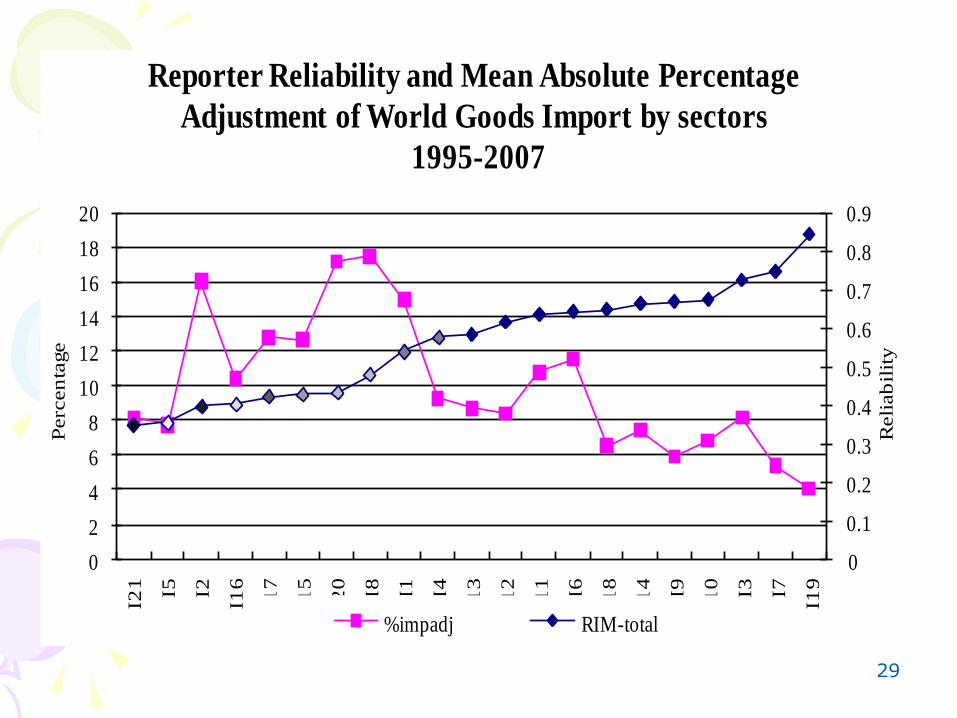
0
0.1
0.2
0.3
0.4
0.5
0.6
0.7
0.8
0.9
0
2
4
6
8
10
12
14
16
18
20
I21 I5 I2
I16
I17
I15
I20 I8 I1 I4
I13
I12
I11 I6
I18
I14 I9
I10 I3 I7
I19
Reli
ab
ilit
y
Perc
en
tage
Reporter Reliability and Mean Absolute Percentage
Adjustment of World Goods Import by sectors
1995-2007
%impadj RIM-total

30
Route Reliability and Mean Absolute Percentage Adjustment of U.S. Bilateral
Goods Trade, 1995 -2006
Bilateral adjustments impact by both the initial
discrepancies and data reliability
31
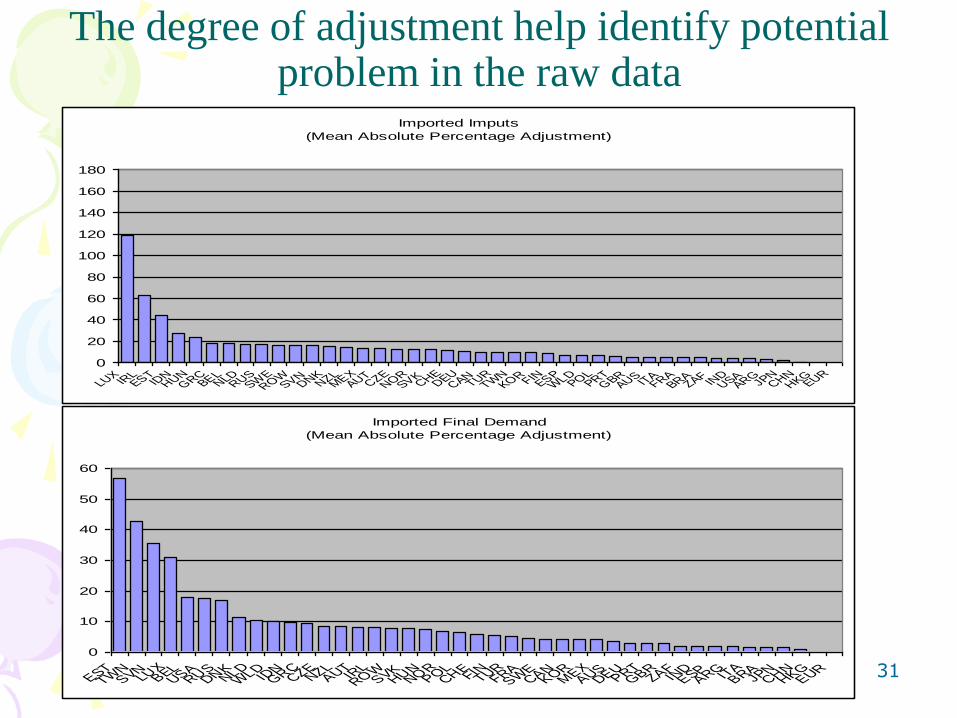
The degree of adjustment help identify potential problem in the raw data
Imported Imputs
(Mean Absolute Percentage Adjustment)
0
20
40
60
80
100
120
140
160
180
LUXIR
LEST
IDNHUN
GRCBEL
NLDRUS
SWEROW
SVNDNK
NZLMEX
AUTCZE
NORSVK
CHEDEU
CANTUR
TWNKORFIN
ESPW
LDPOL
PRTGBR
AUS ITAFRA
BRAZAF
INDUSA
ARGJPN
CHNHKG
EUR
Imported Final Demand
(Mean Absolute Percentage Adjustment)
0
10
20
30
40
50
60
ESTTW
NSVN
LUXBEL
USARUS
DNKNLD
WLD
IDNGRC
CZENZL
AUTIR
LROW
SVKHUN
NORPOL
CHEFIN
TURFRA
SWECAN
KORMEX
AUSDEU
PRTGBR
ZAFIN
DESP
ARGITABRA
JPNCHN
HKGEUR

32
Conclusions
• We developed a three-stage mathematical programming model to reconcile detailed bilateral goods and services trade statistics with individual country’s input-output tables to produce an integrate ICIO database for the world.
• We document the major data sources for such data reconciliation excise and their pro and cons.
• Test the model using real world data, preliminary results are encouraging and show that the model is feasible and may have great potential in the estimation of an integrated global ICIO account.

33
Unsolved Issues and Future Work
The model is still in its early stage of development, there are many issues remain to be solved
• Symmetric IO tables or supply and use tables?
• More or less industry and commodity groups?
• Reliability index for service trade and IO statistics
• Re-exports and re-exports-make-ups
• Purchases on the domestic territory by non-residents
and direct purchases abroad by residents

Why Supply and Use tables are Better?
• Easy benchmark to National Accounts statistics
• Has both industry and commodity dimension that
consistent to the UN standard of system of national
account
• More close to actual data collected by NSI and avoid
errors inherent in the assumptions imposed when
transferring SUTs to symmetric IO tables
• NSI put major part of their resources into compiling
national account statistics to obtain better GDP
estimates 34
