a model to estimate personnel requirements at an...
TRANSCRIPT

Defence Research andDevelopment Canada
Recherche et developpementpour la defense Canada
A model to estimate personnel requirements at an evacuationcentre during a non-combatant evacuation
Jean-Denis CaronBohdan L. KaluznyCanadian Joint Operations Command OR&A TeamDRDC – Centre for Operational Research and Analysis
Defence Research and Development Canada
Scientific ReportDRDC-RDDC-2015-R152August 2015


A model to estimate personnel requirements at anevacuation centre during a non-combatant evacuation
Jean-Denis CaronBohdan L. KaluznyCanadian Joint Operations Command OR&A TeamDRDC – Centre for Operational Research and Analysis
Defence Research and Development CanadaScientific ReportDRDC-RDDC-2015-R152August 2015

© Her Majesty the Queen in Right of Canada, as represented by the Minister of National Defence,2015
© Sa Majesté la Reine (en droit du Canada), telle que représentée par le ministre de la Défensenationale, 2015

Abstract
In 2014, the Canadian Joint Operational Command Operational Research and AnalysisTeam initiated the development of an analysis toolset to support non-combatant evacuationplanning within the Department of National Defence and the Department of Foreign Affairs,Trade and Development (DFATD). This report documents one of the tools designed tosimulate the processes at one of the key component of the evacuation chain: the EvacuationCentre (EC). The main utility of the tool is to provide a means to estimate the number ofstaff members required at an EC during an evacuation given various planning assumptions.
A typical EC structure is modeled, consisting of four main stations: Screen, Triage, Processingand Register. The model is implemented as a discrete-event simulation built in MathWorksSimEventsr with a graphical user interface in Microsoft Excel used to capture the inputsrequired by the discrete-event simulation. This report details the model developed, includingassumptions considered and the main inputs and outputs. A realistic scenario is used todemonstrate the model’s capabilities and benefits.
Significance for defence and security
The Government of Canada bears a fundamental responsibility for the safety and well-being of all Canadians. The DFATD assumes this responsibility for Canadians living andtraveling abroad. Estimating the required workforce at an EC is a challenging task forDFATD. DFATD has relied on lessons learned and planners’s experience gained over theyears through exercises and executions, however no specific guidance or reference documentsexist. The EC model developed provides a means to estimate the number of staff membersrequired at an EC during an evacuation given various planning assumptions. The model canbe used to identify the main bottlenecks and inefficiencies, and to address various “what-if”type questions. In particular, the model can provide answers to questions such as:
1. How much time is required to service a given number of Canadian or Eligible Persons(CEPs) with a particular workforce (number of staff members and their allocation)?
2. What workforce is required to service a number of CEPs in a day?
3. What throughput (i.e. CEPs per hour) can be achieved given a particular workforce?
DRDC-RDDC-2015-R152 i

Résumé
En 2014, l’équipe d’analyse et de recherche opérationnelle du Commandement des opérationsinterarmées du Canada a entamé l’élaboration d’une boîte à outils d’analyse afin d’appuyerla planification des opérations d’évacuation de non-combattants au sein du ministère de laDéfense nationale et du ministère des Affaires étrangères, du Commerce et du Développement(MAECD). Le rapport présente un des outils conçus pour simuler les processus d’un deséléments clés de la chaîne d’évacuation : le centre d’évacuation. L’utilité principale de l’outilest de permettre d’estimer le nombre de membres du personnel nécessaire à un centred’évacuation, selon diverses hypothèses de planification.
Une structure typique d’un centre d’évacuation est modélisée en quatre principales étapes :ciblage, triage, traitement et enregistrement. Le modèle est une simulation à événementsdiscrets développée en MathWorks SimEventsr avec une interface utilisateur graphique enMicrosoft Excel utilisée pour saisir les données nécessaires à la simulation. Le rapport décriten détail le modèle conçu, y compris les hypothèses considérées et les principaux intrants etextrants. Un scénario réaliste sert à démontrer les capacités et les avantages du modèle.
Importance pour la défense et la sécurité
Le gouvernement du Canada est tenu d’assurer la sécurité et le bien-être de tous les Canadiens.Le MAECD assume cette responsabilité pour les Canadiens vivant et voyageant à l’étranger.Il est difficile pour le MAECD d’estimer l’effectif nécessaire dans un centre d’évacuation. Leministère dépend des leçons retenues et de l’expérience des planificateurs acquise au fil desans lors d’exercices et de vraies évacuations. Aucun document de référence ou guide n’existe.Le modèle d’un centre d’évacuation présenté dans ce rapport permet d’estimer le nombrede membres du personnel nécessaire à un centre d’évacuation, selon diverses hypothèses deplanification. Le modèle peut servir à cerner les principaux problèmes et les inefficacités dansle système, en plus de traiter les diverses questions de type “what-if”. Plus particulièrement,le modèle peut répondre aux questions suivantes :
1. Combien de temps est requis pour traiter un certain nombre d’évacués selon un effectifparticulier (nombre de membres du personnel et leur allocation) ?
2. Combien de membres du personnel sont nécessaires pour traiter un certain nombred’évacués dans une journée ?
3. Quel est nombre d’évacués qui peuvent être traités par heure en fonction d’un certaineffectif de personnel ?
ii DRDC-RDDC-2015-R152
Acknowledgements
The authors would like acknowledge the support received from Brittany Blackstone andStéphanie Bédard, both from the Department of Foreign Affairs, Trade and Development.Their inputs were instrumental in developing a realistic evacuation centre model and indefining the baseline scenario used to demonstrate the capabilities of the model.
DRDC-RDDC-2015-R152 iii

This page intentionally left blank.
iv DRDC-RDDC-2015-R152
Table of contents
Abstract . . . . . . . . . . . . . . . . . . . . . . . . . . . . . . . . . . . . . . . . . . . i
Significance for defence and security . . . . . . . . . . . . . . . . . . . . . . . . . . . i
Résumé . . . . . . . . . . . . . . . . . . . . . . . . . . . . . . . . . . . . . . . . . . . ii
Importance pour la défense et la sécurité . . . . . . . . . . . . . . . . . . . . . . . . ii
Acknowledgements . . . . . . . . . . . . . . . . . . . . . . . . . . . . . . . . . . . . . iii
Table of contents . . . . . . . . . . . . . . . . . . . . . . . . . . . . . . . . . . . . . . v
List of figures . . . . . . . . . . . . . . . . . . . . . . . . . . . . . . . . . . . . . . . . vii
List of tables . . . . . . . . . . . . . . . . . . . . . . . . . . . . . . . . . . . . . . . . ix
1 Introduction . . . . . . . . . . . . . . . . . . . . . . . . . . . . . . . . . . . . . . 1
1.1 Background . . . . . . . . . . . . . . . . . . . . . . . . . . . . . . . . . . . 1
1.2 Overview of non-combatant evacuation operations . . . . . . . . . . . . . . 1
1.3 Operational research and analysis to support NEO planning . . . . . . . . 2
1.4 Issue . . . . . . . . . . . . . . . . . . . . . . . . . . . . . . . . . . . . . . . 2
1.5 Objective and scope . . . . . . . . . . . . . . . . . . . . . . . . . . . . . . . 3
1.6 Related work . . . . . . . . . . . . . . . . . . . . . . . . . . . . . . . . . . . 3
1.7 Structure of the report . . . . . . . . . . . . . . . . . . . . . . . . . . . . . 4
2 Overview of an evacuation centre . . . . . . . . . . . . . . . . . . . . . . . . . . 5
2.1 What is an evacuation centre? . . . . . . . . . . . . . . . . . . . . . . . . . 5
2.2 Structure of an evacuation centre . . . . . . . . . . . . . . . . . . . . . . . 5
3 Methodology . . . . . . . . . . . . . . . . . . . . . . . . . . . . . . . . . . . . . . 7
3.1 Overview of the model . . . . . . . . . . . . . . . . . . . . . . . . . . . . . 7
3.2 Modeling entities as families versus individual CEP . . . . . . . . . . . . . 7
3.3 Evacuees’ eligibility . . . . . . . . . . . . . . . . . . . . . . . . . . . . . . . 8
3.4 Estimated service times at each station . . . . . . . . . . . . . . . . . . . . 9
DRDC-RDDC-2015-R152 v

3.5 Number of families, arrival time and distribution . . . . . . . . . . . . . . 10
3.6 Model inputs . . . . . . . . . . . . . . . . . . . . . . . . . . . . . . . . . . . 10
3.7 Key model outputs . . . . . . . . . . . . . . . . . . . . . . . . . . . . . . . 13
3.8 How the model works . . . . . . . . . . . . . . . . . . . . . . . . . . . . . 13
3.9 Limitations . . . . . . . . . . . . . . . . . . . . . . . . . . . . . . . . . . . 14
4 Application and example results . . . . . . . . . . . . . . . . . . . . . . . . . . . 15
4.1 Notations . . . . . . . . . . . . . . . . . . . . . . . . . . . . . . . . . . . . . 15
4.2 Scenario #1 – Baseline . . . . . . . . . . . . . . . . . . . . . . . . . . . . . 15
4.3 Scenario #2 – Optimal allocation of 19 staff members . . . . . . . . . . . . 19
4.4 Scenario #3 – Impact of adding more staff members . . . . . . . . . . . . . 22
4.5 Discussion . . . . . . . . . . . . . . . . . . . . . . . . . . . . . . . . . . . . 24
5 Summary and Future Work . . . . . . . . . . . . . . . . . . . . . . . . . . . . . . 25
References . . . . . . . . . . . . . . . . . . . . . . . . . . . . . . . . . . . . . . . . . . 26
Annex A: Evacuation centre model in SimEvents . . . . . . . . . . . . . . . . . . . 29
A.1 Discrete-event simulation . . . . . . . . . . . . . . . . . . . . . . . . 29
A.2 MATLAB script . . . . . . . . . . . . . . . . . . . . . . . . . . . . . 33
Annex B: Number of replications to ensure statistical significance . . . . . . . . . . 35
List of acronyms and notations . . . . . . . . . . . . . . . . . . . . . . . . . . . . . . 40
vi DRDC-RDDC-2015-R152

List of figures
Figure 1: Elements in non-combatant evacuation operation process. . . . . . . . . 2
Figure 2: Structure and stations of an evacuation centre. . . . . . . . . . . . . . . 6
Figure 3: Type of CEPs arrival. . . . . . . . . . . . . . . . . . . . . . . . . . . . . 11
Figure 4: Screenshot of graphical user interface. . . . . . . . . . . . . . . . . . . . 12
Figure 5: Example of multiple workforces considerations in the model. . . . . . . 12
Figure 6: Interpretation of TSE. . . . . . . . . . . . . . . . . . . . . . . . . . . . 16
Figure 7: Average utilization of staff members at each station. . . . . . . . . . . . 17
Figure 8: Hourly utilization of staff per station – Baseline scenario. . . . . . . . . 18
Figure 9: Hourly utilization of staff per station – Efficient allocation of 19 staff. . 21
Figure 10: TSE as a function of the number of staff members. . . . . . . . . . . . 22
Figure 11: Hourly utilization of staff per station – Optimal allocation of 24 staff. . 23
Figure A.1: Structure of the SimEvents model. . . . . . . . . . . . . . . . . . . . . . 29
Figure A.2: Level 0 in SimEvents model. . . . . . . . . . . . . . . . . . . . . . . . . 29
Figure A.3: Level 1 – Evacuation centre block in SimEvents. . . . . . . . . . . . . . 30
Figure A.4: Screen block in SimEvents. . . . . . . . . . . . . . . . . . . . . . . . . . 30
Figure A.5: Triage block in SimEvents. . . . . . . . . . . . . . . . . . . . . . . . . . 31
Figure A.6: Processing block in SimEvents. . . . . . . . . . . . . . . . . . . . . . . . 31
Figure A.7: Register block in SimEvents. . . . . . . . . . . . . . . . . . . . . . . . . 31
Figure A.8: Set attributes block in SimEvents. . . . . . . . . . . . . . . . . . . . . . 32
Figure A.9: Output data block in SimEvents. . . . . . . . . . . . . . . . . . . . . . 32
Figure A.10: Pseudo code representation of the MATLAB script. . . . . . . . . . . . 33
Figure B.1: Distribution of the 10,000 TSE values. . . . . . . . . . . . . . . . . . . 36
Figure B.2: Expected relative error on the TSE as a function of the number ofreplications. . . . . . . . . . . . . . . . . . . . . . . . . . . . . . . . . . 37
DRDC-RDDC-2015-R152 vii

Figure B.3: Expected relative error on the utilization rate as a function of thenumber of replications. . . . . . . . . . . . . . . . . . . . . . . . . . . . 39
viii DRDC-RDDC-2015-R152
List of tables
Table 1: Distribution of household size in Canada. . . . . . . . . . . . . . . . . . 8
Table 2: Distribution of evacuees’ eligibility. . . . . . . . . . . . . . . . . . . . . 8
Table 3: Estimated service time (in minutes) at each station. . . . . . . . . . . . 9
Table 4: Illustration of service time. . . . . . . . . . . . . . . . . . . . . . . . . . 9
Table 5: Summary of the baseline scenario. . . . . . . . . . . . . . . . . . . . . . 16
Table 6: Average waiting time in the queue per family at each station (hours). . 18
Table 7: Subset of the list of 816 potential ways to allocate 19 staff members atthe four stations. . . . . . . . . . . . . . . . . . . . . . . . . . . . . . . 19
Table 8: Summary for the best ways to allocate of 19 staff. . . . . . . . . . . . . 20
Table 9: Optimal allocation of 19 to 29 staff members. . . . . . . . . . . . . . . 23
Table B.1: Estimated values of θ and S02 for the utilization rates. . . . . . . . . . 38
DRDC-RDDC-2015-R152 ix

This page intentionally left blank.
x DRDC-RDDC-2015-R152

1 Introduction
1.1 Background
The Government of Canada (GoC) bears a fundamental responsibility for the safety andwell being of all Canadians [1]. The Department of Foreign Affairs, Trade and Development(DFATD) assumes this responsibility for Canadians living and traveling abroad—of whichthere were an estimated 2.8 million in 2006 [2]. This responsibility includes planningfor, leading and coordinating Non-Combatant Evacuation Operations (NEOs) that mayresult from a deteriorating situation in an affected nation where the safety of Canadians isthreatened.1 NEOs are formally defined by the North Atlantic Treaty Organization (NATO)as “operations conducted to relocate designated non-combatants threatened in a foreigncountry to a place of safety” [3].
NEOs can be extremely complex; often being conducted in a hostile environment, dealingwith multiple uncertainties, and requiring whole of government expertise and coordinationacross multiple areas. Cooperation between friendly countries is very important but alsoincreases the complexity as each nation evacuates its citizens from the affected region whilecompeting for the same support and resources. For example, the 2006 NEO in Lebanonexhibited the full spectrum of complexities where approximately 50 countries were evacuatingtheir citizens from threatening circumstances to a safe location [4]. The Lebanon crisis isthe largest-scale NEO in Canadian history where an estimated 13,000 Canadian or EligiblePersons (CEPs)2 were evacuated during the operation [5]. Given its complex nature, strategicand comprehensive planning, and preparation are key to a successful NEO.
1.2 Overview of non-combatant evacuation operations
An overview of the NEO process as described in the Canadian Joint Doctrine Manual [1] isprovided in Figure 1. Typically, the CEPs, whom are distributed in the various populationareas of the affected nation, make their own way to an Assembly Point (AP). The APsserve as meeting points while the CEPs await transport, organized by the Canadian Office,to an Evacuation Centre (EC). CEPs may also proceed directly to an EC.
The EC is the main processing facility, where basic screenings are conducted and detailedprocessing takes place. The screening confirms the identities and eligibility of the personsseeking evacuation. The transport of CEPs from ECs to Safe Havens (SHs) is arranged bythe GoC, typically using commercial or military sealift or airlift assets. At the SH, CEPsare safe from threat and await onward movement to a Repatriation Site (RS) or back to1 During a NEO, DFATD may be supported by other departments and organizations including, but notlimited to, the Department of National Defence (DND), the Canadian Security Intelligence Service (CSIS),Citizenship and Immigration Canada (CIC) and the Royal Canadian Mounted Police (RCMP).2 CEPs are “Canadian citizens (civilian but also military personnel classified as non-combatant and non-essential), categories of persons holding legal status in Canada (ranging from landed immigrants to variousvisa holders) as specified by the Canadian Government, and designated third-country nationals and [hostnation] persons as specified by the Canadian Government, deemed to be eligible applicants for evacuation” [1].
DRDC-RDDC-2015-R152 1

Canadian or Eligible Persons (CEPs) distributed
in the Population Areas (PAs)
Assembly Points (APs)
Evacuation Centres
(ECs)
Safe Havens
(SHs)
Repatriation Sites (RSs)
Area of Danger Safe Area
Figure 1: Non-combatant evacuation process.
the affected nation once the situation stabilizes.3 The RS refers to a place of safety wherethe CEPs exit the evacuation chain and are no longer dependent on diplomatic or militaryassistance.
1.3 Operational research and analysis to support NEO planning
Operational Research and Analysis (OR&A), and in particular Modeling and Simulation(M&S), is an area from which NEO planning can greatly benefit. In 2014, the CanadianJoint Operational Command (CJOC) OR&A Team initiated the development of an analysistoolset to support NEO planners within DND and DFATD. The toolset is referred to asthe Simulation Tool for Optimizing Non-Combatant Evacuation (STONE).4
Details on the STONE can be found in References [6, 7]. In a nutshell, the STONE isdesigned to simulate and optimize the movement of CEPs over time during a NEO givenvarious planning factors. It focuses on the movement of CEPs from APs to ECs to SHs andthe related transportation resources required for that movement. It can help to determinethe best allocation and utilization of transportation resources and estimate evacuation time.
1.4 Issue
The STONE provides an indication as to how many CEPs are expected at each site, but itdoes not provide insight into how many staff members are required to process the CEPs at thesites. Apart from factoring a fixed processing time at the ECs, the STONE does not modelinternal procedural details of CEPs at each EC. The sites are modeled as “black boxes”,i.e. they are viewed solely in terms of theirs inputs and outputs without any knowledge ofits internal workings [8].3 Generally, this final movement of CEPs would be their own means because the policy is to take the CEPsto the nearest SH.4 Both the STONE development and the work presented in this report are part of the Operational andStrategic Research and Analysis Support to CJOC Project of the Assistant Deputy Minister Science andTechnology (ADM(S&T)) Force Employment portfolio.
2 DRDC-RDDC-2015-R152

In November 2014, the CJOC OR&A Team presented the STONE to DFATD policy advisorsand emergency planning officers [9]. A need was identified at that meeting for the developmentof a tool to model an EC in greater detail (with sub-processes) in order to facilitate answeringquestions regarding the number of staff required at an EC during a NEO. Estimating therequired workforce at an EC is a challenging task for DFATD. There is no specific guidanceor reference documents; DFATD relies on lessons learned and planners’s experience gainedover the years through NEO exercises and executions.
1.5 Objective and scope
The objective of this report is to document a tool designed to simulate the processes atthe key component of the evacuation chain: the EC. The primary utility of the tool is toprovide a means to estimate the number of staff members required at an EC during anevacuation given various planning assumptions, in particular, to answer questions such as:
1. How much time is required to service a given number of CEPs with a particularworkforce (number of staff members and their allocation)?
2. What workforce is required to service a number of CEPs in a day?
3. What throughput (i.e. CEPs per hour) can be achieved given a particular workforce?
During an evacuation, most of the DFATD staff involved is employed at ECs. Therefore,the focus of the model is strictly on the processes to be conducted at an EC—the other sites(i.e. APs and SHs) are not in the scope of this project. A plausible EC structure is modeled,which consists of four main stations: Screen, Triage, Processing and Register.
1.6 Related work
Although military and foreign affairs departments have been planning non-combatantevacuations for many years, few scientific papers related to this topic (M&S of an EC)have been published. A related study plan initiated within the Ministère de la Défense(France) was identified. The Centre de doctrine d’emploi des forces Division simulationet recherche opérationelle (DSRO) planned the development of successive modeling andanalysis to optimize the deployment and operation of NEO in support of the Commandmentde la force logistique terrestre. Initial modeling efforts were to focus on the flow of CEPsthrough evacuation centres [10]. It was anticipated that the tool developed would benefitplanning requirements for lodging, food, and transportation out of the evacuation centres.No published follow-up to the proposed DSRO modeling plans was found.
In the United States, the Center for Army Analysis (CAA) developed a methodology toanalyze NEOs that is used to evaluate various courses of action and support decision making[11, 12]. One of CAA’s models includes modeling of an evacuation control centre (theequivalent of an EC in United States NEO doctrine) using discrete-event simulation. Itfocusses on two types of resources: 1) transporters for the movement of evacuees to, withinand out of the evacuation control centre, and 2) the NEO Tracking System, a machine used
DRDC-RDDC-2015-R152 3
to track evacuees throughout the evacuation process and to construct flights manifests [12].The model was not designed to evaluate the staffing requirement for evacuation controlcentres.
The Air Force Institute of Technology (AFIT), a graduate school for the United StatesArmed Forces, created a simulation tool that models evacuation control centre operations andvaries key inputs and parameters to uncover the underlying elements that drive evacuationcontrol centre output and performance [13]. The main utility of AFIT’s model is to compareefficiencies of different staff manning structures. There are similarities between the objectiveof AFIT’s model and the work presented in this paper. Both aim to help determiningstaff required at an EC. The AFIT’s model considers parameters such as total number ofevacuees, arrival distribution of evacuees at the evacuation control centre and processingtime at each station. Two papers on the subject were also published later by the AFIT[14, 15], both serving as a continuation and a complement of the original work [13].
Every country employs different plans and procedures, so it structures its ECs differentlyduring an evacuation—different number of stations that the evacuees have to go through,variation in the types and qualification of the staff, etc. Because of the differences, even ifthe CAA or the AFIT models were made available, it would not be possible to apply themdirectly to the Canadian context. This paper proposed a new model that uses analogousconcepts and ideas to the models developed by both CAA and the AFIT. The similaritiesbetween the new model and the existing ones will be presented and discussed throughoutthe report.
1.7 Structure of the report
This report contains five sections and two annexes. Following this introductory section,Section 2 provides a description of a typical EC, its structure and components, and the mainfactors to consider. Section 3 presents an overview of the tool that was developed, includingthe discrete-event simulation itself, a description of the Graphical User Interface (GUI),and its main inputs and outputs. In Section 4, the capabilities of the model and typesof questions it can address are presented using three different scenarios. Conclusions andproposed areas for future work are summarized in Section 5. Annex A contains additionalimplementation details and is included for completeness. Annex B provides a discussion onthe number of replications required with the model to ensure that the results produced bythe simulation are statistically significant.
4 DRDC-RDDC-2015-R152

2 Overview of an evacuation centre
This section provides a generic definition of an EC and an overview of its structure. Adescription of the stations that the CEPs have to go through at an EC is also given. Thesection also provides a brief discussion of discrete-event simulation and how this modelingtechnique can be used to inform decision making.
2.1 What is an evacuation centre?
As shown in Figure 1, an EC is one of the main components in the non-combatant evacuationprocess. According to DND doctrine [1], an EC is the main processing facility, where basicscreenings are conducted and detailed processing takes place. Is also acts as an AP forevacuees proceeding directly to it from their place of residence. ECs are secure sites andare likely to be located at, or in proximity to, an airport, a sea port or a beach site. Thescreening and processing that occur at the ECs intend to admit to or eliminate from theevacuation chain each person wanting to leave the affected nation. The identities of thepersons are confirmed and security checks are performed to identify who may pose a dangerto evacuees or supporting personnel. Although not a standard part of the process, medicalchecks may also be conducted when a CEP is visibility sick or if there is a known outbreakof a worrisome illness in the area. If eligible, the CEPs are then registered and prioritizedfor transportation outside the affected nation—arranged by the GoC, and typically usingcommercial or military sealift or airlift assets.
2.2 Structure of an evacuation centre
The geography of the affected nation, the threat environment, and the political context atthe time of evacuation make every instance unique. That is to say that the structure of anEC, and the number of stations required to service the CEPs are likely to vary from oneevacuation to another. It is difficult to develop a “one size fits all” model that can representany EC. The goal is to model a plausible EC structure, one that is deemed reasonable andprobable in the event of an evacuation.
For the purpose of this work, the EC structure and stations illustrated in Figure 2 areconsidered. This high-level view was produced in consultation with DFATD, and is basedon detailed diagrams found in [16, 17]. The four stations are as follows:
1. Screen – Upon entry into the EC, evacuees deposit their bags at the luggage area.Embassy staff ensure that the evacuees do not exceed the baggage restrictions. Evacueesare then provided with information forms to be completed before the triage. Initialsecurity screening also takes place before the evacuees proceed to triage.
2. Triage – Evacuees’ documents and information forms are reviewed to determine theireligibility. CEPs with valid documents are directed to the registration area. Thoserequiring travel documents or Consular assistance proceed to the processing stage.Finally, persons who are deemed ineligible are escorted to the exit.
DRDC-RDDC-2015-R152 5

1. SCREEN Luggage drop-off and initial security screening of evacuees arriving at the Evacuation Centre
T
P
A B
C
3. PROCESSING Persons requiring documentation are directed to the processing site
2. TRIAGE Triage of evacuees as follows: (A) eligible and documented; (B) eligible requiring documents; or (C) not eligible
e
cuees
4. REGISTER Once deemed eligible, evacuees proceed to registration.
Figure 2: Structure and stations of an evacuation centre.
3. Processing – CEPs undergo additional security screening and proceed to Immigrationor Consular sections for assistance. Provision of travel documents for CEPs fromConsular and Immigration personnel occurs in the processing area. Once obtained,CEPs are directed to the registration station.
4. Register – CEPs with valid travel documents hand over their information form. Theinformation is entered into the master registration list and each CEP is assigned anumber to complete the registration.
Once registered, the CEPs will either board GoC provided buses which will transport themto a shelter or depart the EC to private accommodations where they await further evacuationinstructions (e.g. departure vessel location and time). Once evacuation instructions aretransmitted to the CEPs, they will return to the EC staging area where they will be enteredon the manifest. Finally, they will move to the embarkation site and board transportationto a SH.
The current version of the model only covers the stations shown in Figure 2 (Screen, Triage,Processing and Register). This decision was made in order to focus on the area where moreConsular personnel are required. The transportation aspects after the CEPs registrationcan be analyzed using a complimentary tool—the STONE [6, 7].
6 DRDC-RDDC-2015-R152

3 Methodology
3.1 Overview of the model
A discrete-event simulation was built in MathWorks SimEventsr [18] modeling the fourstations of an EC and the flow of CEPs between them.
In general terms, simulation is the imitation of the operation of a real-world process orsystem over time [19]. More specifically, a discrete-event simulation can be defined as theflow over time of an entity through a system while competing with other entities for limitedresources throughout an entity’s lifecycle in the system [20]. Discrete-event simulation iswell-suited to model the processing of CEPs at an EC. The discrete-event simulation systemcan be seen as the interacting and interdependent four stations depicted in Figure 2, whichform the basis of an EC. The CEPs, the system entities, are processed at the four stations(Screen, Triage, Processing and Register) by the Consular personnel available, the systemresources. In this context, the system life-cycle of a CEP corresponds to the time betweenarrival at the EC and leaving the system, either as a registered CEP or as an ineligibleperson.
The main elements of the model, the inputs and the outputs are explained in the remainderof this section. Annex A provides details on the implementation of the discrete-eventsimulation model
3.2 Modeling entities as families versus individual CEP
In a discrete-event simulation, entities are the objects that flow through the system. In anEC, the first instinct is to assume that the entities should be individual CEPs. However,during an evacuation, CEPs are typically traveling as families and stay together throughoutthe evacuation process. To add realism in the simulation model, the entities in the modelshould therefore be families as opposed to individual evacuees. For example, if a child doesnot have a passport but is eligible for an evacuation, he would go through the Processingstation to get his passport and the whole family would go with him—the child would notbe sent by himself. Similarly, if the child waits in the queue, then the whole family waitsin the queue as well. In this case the time spent at the Processing station by the family isadjusted to factor in that only a subset of the family requires paperwork.
Instead of creating entities as individuals, the entities generated are families with an attributerepresenting the size of the family, i.e. the number of members (e.g. a family of four composedof two adults and two children). To estimate the family size, a random variable is sampledfrom a distribution defined by user-input. For example, Table 1 lists data correspondingto the distribution (in percentages) of household size extracted from Statistics Canada’s2011 population census [21]. If that distribution was inputed, approximately 34.1% of thefamilies arriving at an EC would be couples. If available, the distribution could be adjustedto reflect the CEPs in the affected nation.
DRDC-RDDC-2015-R152 7

Table 1: Distribution of household size in Canada (Source: Statistics Canada, census ofpopulation 2011 [21]).
Number ofmembers Probability
1 27.6%2 34.1%3 15.6%4 14.3%
5 or more 8.4%
Average per family: 2.4 members
3.3 Evacuees’ eligibility
Eligibility of evacuees is also an important factor to consider. Eligibility refers to whether thepeople arriving at the EC are entitled to be evacuated and if they have proper documentation(e.g. a valid passport). Depending on their eligibility, the people are directed to theappropriate station within the EC. For example, as shown in Figure 2, not all evacuees wouldgo through the Processing station—only those eligible who require additional documentation(Type B). The evacuees’ eligibility distribution may vary from one scenario to another. Forinstance, if an evacuation is the result of a natural disaster, the number of evacuees whodo not have proper documentation, and therefore who need to go through the Processingstation, may be greater than in other situations. During the evacuation conducted in Haiti in2010, approximately 4,000 prisoners escaped and were able to mingle within the population[22]. Some of them tried to take advantage of the crisis to evacuate the country even if theywere not eligible. In such a case, the proportion of “not eligible” people would be higher.
Table 2 shows estimated probabilities of CEPs that are (A) eligible and documented, (B)eligible requiring documents, and (C) not eligible. The values were provided by DFATDand are deemed to be representative of a typical scenario [23]. In the model, they are notfixed, they can be modified depending on the scenario of interest.
Table 2: Distribution of evacuees’ eligibility.
Type Description ProbabilityA Eligible with documentation 67.0%B Eligible requiring documentation 32.0%C Ineligible 1.0%
When an entity is created in the simulation, a random variable drawn from the distributionas per Table 2 is used to assign an eligibility attribute. In the simulation this attributedetermines whether the family proceeds directly to the Register station, to the Processingstation, or exits the EC if not eligible.
8 DRDC-RDDC-2015-R152

3.4 Estimated service times at each station
The times required to service the CEPs at each individual station is an important aspectin the model. Such data is not typically collected by DFATD. In the absence of empiricaldata, triangular distributions are commonly used to estimate such times. Subject-matterexperts are asked to provide estimates in the form of most likely, minimum and maximumvalues. Table 3 shows minimum, maximum and most likely times (in minutes) to service aCEP at the Screen, Triage, Processing and Register stations. These values were provided byDFATD planners [23]. For instance, in most cases, the time needed to service a CEP at theTriage station is 5 minutes but it can take as much as 10 minutes and as little as 2 minutes.
Table 3: Estimated service time (in minutes) at each station.
Triangular distributionStation Minimum Maximum Most likelyScreen 2 10 5Triage 2 10 5Processing 30 60 40Register 1 3 2
In the simulation, random variables drawn from the triangular distributions presented inTable 3 are used to estimate the time required for each CEP to be serviced at the EC.As discussed earlier, the entities in the simulation are families and not individual CEPs,therefore the times for each CEP have to be aggregated to determine how much time thefamily as a whole spends at the EC. To illustrate this concept, consider the example shownin Table 4. In this example, the family has three members, all eligible (i.e. of Types A or B),but member 2 needs documentation (Type B who has to go through the Processing station).
Table 4: Illustration of service time.
Service time (in minutes)Family Member Eligibility Screen Triage Processing Register
1 1 A 2 3 – 31 2 B 3 4 45 21 3 A 4 5 – 1
In the example shown in Table 4, the total time spend at the EC by family 1, excluding thetime waiting in queues, is 72 minutes. This is calculated as follows:
Time at Time at Time at Time atScreen Triage Processing Register
(2+3+4) + (3+4+5) + 45 + (3+2+1)9 + 12 + 45 + 6 = 72 minutes
The times for family members are drawn as independent variables, whereas in real life theywould likely not be independent, i.e., family members are likely to be of the same eligibility
DRDC-RDDC-2015-R152 9

and factors resulting in long times for one are likely to apply to the others. However, theindependence assumption was deemed by DFATD planners to be reasonable and results insimpler model parameters.
3.5 Number of families, arrival time and distribution
The total number of families to be serviced during a day at the EC, their arrival timeinterval and distribution have an impact on the staff required at the EC. In most situations,the DFATD has an idea of the total number of CEPs that are expected to be evacuatedand the desired evacuation timeline. For instance, if there is a total of 1,200 CEPs to beevacuated in five days, then one can expect an average of 240 CEPs per day arriving at theEC. Since the model deals with families and not individual CEPs, the number of CEPs canbe converted to number of families using the estimated family size (see last row in Table 1).In this example, the estimated number of families to service in one day would be 100: 240CEPs divided by 2.4 CEPs per family.
The time at which the CEPs are expected to arrive at the EC is also important. In thesimulation, a time interval must be given to model the arrival of CEPs. Continuing with theexample of the previous paragraph, if the 100 families are expected to arrive between 0700and 1900, then assuming an “orderly fashion” arrival (i.e. constant rate throughout day),approximately 8.3 families are expected every hour: 100 CEPs divided by 12 hours. In thesimulation, the family inter-arrival times are randomly generated based on the expectednumber of families arrivals per hour using a Poisson distribution, with a mean λ, where λ isthe number of families expected in that hour.5 In the example λ = 8.3.
As discussed in [13], planners typically uses constant average arrival rate of evacuees at theEC, i.e. “orderly fashion”. However, two other types of arrival are considered in the model:“mad rush”, where evacuees show up earlier in the day, and “wait and see”, which assumesthat evacuees wait until later in the day to get to the EC. The three types of arrival for a12-hour time period are illustrated in Figure 3.6
3.6 Model inputs
A GUI was developed to capture the inputs required by the discrete-event simulation. TheGUI, illustrated in Figure 4, was developed in Microsoft Excel. It is used to input scenarioparameters and the planning assumptions.
The user must specify the information discussed in Subsections 3.2 to 3.5: informationabout family size distribution, evacuees’ eligibility distribution, the triangular distributionsrepresenting the estimated service times at each station, the expected number of families, the5 If for every t > 0 the number of arrivals in the time interval [0, t] follows a Poisson distribution with meanλt, then the sequence of inter-arrival times are independent and identically distributed exponential randomvariables having mean 1/λ. In the example above, t = 1 (one hour) and λ = 8.3 (number of families in onehour).6 Beta distributions with α = 2 and β = 3 for “mad rush” and α = 3 and β = 2 for “wait and see” were usedto estimate the arrival types shown in Figures 3a and 3b.
10 DRDC-RDDC-2015-R152

0%
2%
4%
6%
8%
10%
12%
14%
16%
1 2 3 4 5 6 7 8 9 10 11 12
Perc
enta
te o
f C
EPs
arri
vin
g
Hour
0%
2%
4%
6%
8%
10%
12%
14%
16%
1 2 3 4 5 6 7 8 9 10 11 12
Perc
enta
te o
f C
EPs
arri
vin
g
Hour
16%a) Mad rush b) Wait and see
0%
2%
4%
6%
8%
10%
12%
14%
16%
1 2 3 4 5 6 7 8 9 10 11 12
Perc
enta
te o
f C
EPs
arri
vin
g
Hour
c) OrderlyFigure 3: Type of CEPs arrival.
arrival type (“Orderly”, ”Mad rush” or “Wait and see”), and the desired hours of operation(e.g. between 0 and 12). The user must also enter the number of replications to be executed.In this example, the value is set to 30 replications. The duration (in hours) represents thetime when the simulation stops if all the entities have not yet been serviced.
Finally, details on the EC staffing must also be entered. This is done by specifying thenumber of staff at each station as shown in Figure 4. In this case, the workforce to beanalyzed consists of 19 staff members—4, 3, 9 and 3 are allocated at the Screen, Triage,Processing and Register stations, respectively.
It is also possible to consider a range of staff members at each station by specifying theminimum and maximum numbers, and the desired increment. This is illustrated in Figure 5.In this case, all potential combination workforces of 1 to 3 staff members at each station wouldbe considered. In total, there would be a total of 81 workforces considered, i.e. 3×3×3×3.For this example, 30 replications would be run with the model for each of the 81 potentialworkforces.
DRDC-RDDC-2015-R152 11

Figure 4: Screenshot of graphical user interface created in Microsoft Excel.
Figure 5: Example of multiple workforces considerations in the model.
12 DRDC-RDDC-2015-R152

3.7 Key model outputs
In nearly all real world systems there is variability that may be introduced from varioussources. For an EC, there are several sources, but the ones considered in our model arethose discussed previously in this section. When simulation is used to model a system,the typical way to deal with variability (or randomness) is to execute the simulation anumber of times while drawing different random variables from the input distributions. Anindividual execution of the simulation is called a replication. Results for each replicationare stored. Once all replications are completed, the results are used to compute metricsfor evaluating the performance of the system. In this case, the evaluation criterion is theability of the workforce to deal with the scenario, defined by a set of input parameters. Forexample, would a workforce of 12 staff be sufficient to service 500 CEPs in 10 hours giventhe family size distribution, eligibility distribution and service times shown in Tables 1, 2and 3, respectively? Performance and efficiency can be measured in terms of time to processall the CEPs, queue size, waiting time at each station, etc.
The main outputs of the model presented in this report are the following:
• Average time to completely service all evacuees. The average time to completelyservice all evacuees, denoted TSE, represents the total estimated time to completelyservice all the entities (i.e. the families of evacuees) during a simulated day;
• Staff member average utilization at each station. The average utilization of astaff member at each station is denoted US , UT , UP , and UR for the Screen, Triage,Processing, and Register stations respectively. The global average utilization of a staffmember is denoted U . Utilization indicates the percentage of time that staff membersare busy; and
• Average time in queue spent by a family at each station. The average timespent by a family at each station is denoted TQS , TQT , TQP , and TQR for the Screen,Triage, Processing, and Register stations respectively. The total average time spent bya family at the EC is TQ.
Details on how these main outputs are calculated and how they can be interpreted areprovided in Section 4 and in Annex B.
3.8 How the model works
A MATLAB script drives the discrete-event simulation. Pseudo code of the script is presentedin Figure A.10 of Annex A. The input parameters are first read from the GUI, includingthe number of replications R. Variables are initialized to store results, given the numberof replications and the number of workforces to analyze. This also includes setting theinitial seed used to generate the random numbers so that each simulation run is unique andindependent.
For each replication the family inter-arrival times are randomly generated based on theexpected number of families and on the hours of operations. These are stored as a number
DRDC-RDDC-2015-R152 13

sequence in a vector in the MATLAB workspace. Other vectors in MATLAB, such as familysize and eligibility, are also created to be used in the discrete-event simulation.
As the simulation runs, data are displayed iteratively (histograms, charts, average wait time,queue size as a function of time, etc.) and stored in MATLAB variables for post-processinganalysis. The simulation stops when all the families have been serviced or when the maximumduration is reached.
3.9 Limitations
There are limitations of the EC model presented. The geography of the affected nation, thethreat environment, and the political context at the time a NEO is triggered make everyinstance unique. It is difficult to develop a “one size fits all” model that can represent anyEC. The goal is to model a plausible EC structure, one that is deemed reasonable andprobable in the event of situation necessitating a NEO.
The structure of an EC, and the number of stations required to service the CEPs may varyfrom one evacuation to another. A major limitation of the model presented is that thestructure and stations of an evacuation centre, as depicted in Figure 2, are fixed. If thenumber or nature of the stations changes from an evacuation to another or as an evacuationprogresses, the model would not be applicable.
The EC model assumes that the staff assigned to a station remain at the station for theentire duration. In the model, staff cannot move from one station to another during the day,although further efficiencies may be gained that way in real life. Also, the model does notconsider staff shifts or rest breaks—it does not build optimal schedules, but rather determinesthe optimal allocation to stations based on the overall duration. However, if the requiredstaff allocation to man each station is determined using the model, it is straightforward toestimate the additional staff required to account for other factors like breaks and lunch time.For example, if 20 staff members are required during the day and each of them needs a30-minute break and a 1-hour lunch period, then an extra 30 work hours is required, whichessentially corresponds to another 3 staff members.
14 DRDC-RDDC-2015-R152

4 Application and example results
The objective of this section is to demonstrate the capabilities of the model and the types ofquestions that it can address. Simulation results for four different scenarios are presented.An analysis of the results is also included.
4.1 Notations
For simplicity, the following notation is used throughout the section:
< nS −nT −nP −nR >
It refers to a workforce of N staff members, where N = nS +nT +nP +nR, and nS , nT ,nP and nR represent the number of staff allocated the Screen, Triage, Processing andRegister stations, respectively. For example, < 2−3−4−5 > represents a workforceof 14 staff consisting of 2, 3, 4 and 5 staff members on the ground performing thetasks at the Screen, Triage, Processing and Register stations, respectively.
4.2 Scenario #1 – Baseline
The first scenario analyzed is the baseline scenario discussed in Section 2 and summarizedin Table 5. While Table 5 spells out the main input parameters associated with the baselinescenario, it does not prescribe a number of staff for each station. The baseline scenario’sworkforce estimate should be large enough to service all the CEPs in a reasonable amountof time, given all the planning assumptions. In this case, ≃ 715 CEPs are expected to arrivebetween 0700 and 1900 each day.
As discussed in the introduction, estimating the required workforce is a challenging task.There is no specific guidance or reference documents—instead, DFATD relies on planners’sexperience gained over the years through NEO exercises and executions. For this analysis,DFATD was asked to provide an estimation of the workforce that would be used in asituation similar to the baseline scenario [23]. Their recommendation was the following:
< 4−3−9−3 >, a workforce of 19 staff members—4, 3, 9 and 3 at the Screen,Triage, Processing and Register stations, respectively.
The model was used to evaluate the efficiency of this workforce. In other words, how wella workforce of < 4 − 3 − 9 − 3 > would perform with the current planning assumptions?30 replications7 of the model were executed, resulting in an average time to completelyservice all CEPs, noted TSE, of 23.74 hours.
The interpretation of the TSE is illustrated in Figure 6. In this case, families of CEPsfirst arrive at the EC at 0700 and move through the four stations of the system. When7 Discussion on variability and the number of replications to ensure statistical validity is included in Annex B.It provides a justification as to why conducting 30 replications should be enough to have an acceptable levelof confidence in the estimated T SE (or any other estimates).
DRDC-RDDC-2015-R152 15

Table 5: Summary of the baseline scenario.Distribution of private households
Number ofmembers Distribution
1 27.6%2 34.1%3 15.6%4 14.3%
5 or more 8.4% Average per family: 2.4 members
Service time (in minutes)
Station Minimum Maximum Most likelyScreen 2 10 5Triage 2 10 5Processing 30 60 40Register 1 3 2
Eligibility
Type Description DistributionA Eligible with documentation 67.0%B Eligible requiring documentation 32.0%C Ineligible 1.0%
Number of CEPs to evacuate
Number: � 715 CEPs (� 295 families)Time: Between 0700 and 1900Arrival type: Orderly fashion
First family arrives at EC
Expected time at which all families
are serviced
TSE = 23.74 hours
Time
Desired hours of operation at EC
Earliest possible time at which all families
Last family arrive at EC
can be serviced
Figure 6: Interpretation of TSE.
a family gets to a station, if all the staff members are busy with others, it joins a queueand waits its turn until a staff member becomes available. If the size of the workforce andthe allocation is appropriate, the size of the queues and the times families spent in themshould be minimal. The last family during a day is expected to arrive at around at 1900. Anefficient workforce allocation would allow the last family arriving at the EC to be completely
16 DRDC-RDDC-2015-R152

serviced as close to 1900 as possible. In such a case, the desired hours of operations wouldbe respected, i.e. between 0700 and 1900 (represented by the blue shaded area in Figure 6).However, since the last family may arrive at 1859 and has to go through the four stations,the earliest possible time when the family can be completely serviced approaches 13 hours8
(green arrow in the Figure 6). A TSE value of 23.74 hours indicates that in order to serviceall CEPs, some stations at the EC would have to be manned until almost 0700 on the nextday, i.e. nearly around the clock. It shows that the workforce of < 4 − 3 − 9 − 3 > is notviable.
Bottlenecks
The model outputs can be used to identify the bottlenecks in the system, i.e. what are theelements that create the inefficiencies? Figure 7 depicts the average staff member utilizationat each station over the 23.74 hours. The four average utilization times, noted US , UT ,UP are UR, are 70.7%, 94.2%, 55.1%, and 32.6% for the Screen, Triage, Processing andRegister stations, respectively. It shows that the three staff members at the Register stationare only busy approximately 1/3 of the time, suggesting that there might be too manypersonnel assigned at that station. On the other hand, the figure indicates that the threestaff members at the Triage station are busy most of the time.
70.7%
94.2%
55.1%
32.6%
0%
20%
40%
60%
80%
100%
Screen Triage Processing Register
Ave
rage
uti
lizat
ion
rat
e
Stations
Figure 7: Average utilization of staff members at each station.
Table 9 presents the average time in queue for the families at each station, denoted TQS ,TQT , TQP and TQR. Values of nearly zero for TQP and TQR indicate that no queues arebuilding up at the Processing and Triage stations, meaning that as soon as a family arrivesat one of these two stations, they are immediately taken care of. The TQS and TQT valuessuggest the that manning level at the Screen and Triage is insufficient.
Figure 7 presented average utilizations of staff at each station but these numbers can also8 This is an estimated value which corresponds to 12 hours (i.e. 1900–0700) plus ≃ 57 minutes. The 57minutes value represents the sum of the mean service times at each station. This is assuming that the familyhad one of its members eligible, but requiring documentation.
DRDC-RDDC-2015-R152 17

Table 6: Average waiting time in the queue per family at each station (hours).
Station Time (in hours)
Screen TQS 2.6Triage TQT 2.7Processing TQP ≃ 0Register TQR ≃ 0
be broken down by hours. Figure 8 depicts the estimated hourly utilization of staff membersby station. The red line represents the last family of CEPs arriving at the evacuation centre
Ho
url
y u
tiliz
atio
n
0.0
0.5
1.0
0.0
0.5
1.0
0.0
0.5
1.0
0700 1000 1300 1600 1900 2200 0100 0400 0700
Time
0.0
0.5
1.0
0700 1000 1300 1600 1900 2200 0100 0400 0700Time
Screen = 70.7%
Triage = 94.2%
Process = 55.1%
Register = 32.6%
US
UT
UP
UR
Figure 8: Hourly utilization of staff per station – Baseline scenario of 19 staff members,< 4−3−9−3 >.
and the green line represents the time when all CEPs at the EC have been serviced. Itshows that, although the staff at the Screen station are busy on average 70.7% of the time,in reality, they are busy almost 100% of the time for the first 17 hours. After that, theyhave no families to service. This suggests that they are not enough to sustain the rate atwhich families of CEPs arrive at the EC. The figure also illustrates the fact that the staff
18 DRDC-RDDC-2015-R152

members at the Processing and Register stations are never fully utilized, indicating thattheir numbers can probably be reduced and personnel moved to the other two stations.
4.3 Scenario #2 – Optimal allocation of 19 staff members
Figures 7 and 8, and Table 9 show that the proposed workforce of < 4−3−9−3 > is notoptimal. Using the parameters of the baseline scenario, the model was run to identify moreefficient ways to allocate the 19 staff members. In other words, can we do better with thesame number of personnel?
There are 816 ways to allocate 19 staff members at the four stations; a subset of the list isshown in Table 7. A simulation (30 replications) of each workforce combination listed inTable 7 was executed, computing the TSE for each workforce allocation. The results weresorted and are summarized in Table 8.
Table 7: Subset of the list of 816 potential ways to allocate 19 staff members atthe four stations.
Number of staffWorkforce Screen Triage Processing Register Total
(nS) (nT ) (nP ) (nR) (N)
1 < 1−1−1−16 > 1 1 1 16 192 < 1−1−2−15 > 1 1 2 15 193 < 1−1−3−14 > 1 1 3 14 19... ... ... ... ... ... ...
395 < 4−3−9−3 > 4 3 9 3 19... ... ... ... ... ... ...
814 < 15−1−2−1 > 15 1 2 1 19815 < 15−2−1−1 > 15 2 1 1 19816 < 16−1−1−1 > 16 1 1 1 19
The exact TSE values are not that important—they serve to rank and compare the variousworkforce allocations with each other. The worst workforce of 19 staff members was includedin the table (last row) to provide a full range of the potential TSE values. In this case,the workforce consisting of < 8 − 8 − 1 − 2 > provides a TSE value of more than 5 days(i.e. ≃ 124.77 hours), which is clearly too large. Such a high value is the result of too manystaff members at the Screen and Triage stations and not enough at the Processing.
On the other hand, the results show that the best allocation of 19 staff members is< 5−5−7−2 >, with an estimated TSE of 17.94 hours. This represents an improvementof nearly 6 hours versus the suggested workforce (grey-shaded row in Table 7). It meansthat in order to totally service all the families arriving during the day, some staff wouldhave to extend their work hours until almost 2400.
DRDC-RDDC-2015-R152 19

Table
8:Summ
aryfor
thebest
ways
toallocate
of19staff.
Num
berof
staffA
verageutilization
Average
time
inQ
ueueR
ankScreen
Triage
Processing
Register
TS
EU
SU
TU
PU
RU
TQ
ST
QT
TQ
PT
QR
15
57
217.94
73.5%73.2%
91.7%63.0%
79.0%0.9
0.11.5
≃0
25
48
218.30
73.3%91.5%
80.6%63.1%
79.1%1.0
1.60.1
≃0
34
49
218.40
90.6%90.7%
71.5%62.6%
78.6%2.6
0.2≃
0≃
04
45
82
18.4391.4%
73.1%79.9%
63.5%78.8%
2.6≃
00.1
≃0
54
48
318.87
89.9%90.4%
80.8%41.8%
78.6%2.7
0.20.1
≃0
64
67
218.93
89.0%59.4%
90.4%61.9%
77.3%2.7
≃0
0.4≃
07
64
72
18.9458.9%
88.4%90.4%
61.4%77.0%
0.22.2
0.5≃
08
44
74
19.1788.6%
88.8%88.1%
30.6%76.3%
2.70.2
0.3≃
09
45
73
19.1989.6%
71.3%89.0%
41.1%76.9%
2.9≃
00.4
≃0
105
47
319.22
70.9%88.9%
90.5%41.1%
77.2%1.1
1.60.4
≃0
114
66
320.69
79.5%52.8%
93.0%36.5%
68.5%2.5
≃0
1.5≃
012
56
62
20.7864.4%
53.7%93.7%
55.8%69.4%
1.1≃
02.9
≃0
135
56
321.11
63.0%63.0%
94.2%36.2%
68.6%0.9
0.12.9
≃0
146
56
221.27
53.0%63.8%
94.1%54.9%
69.0%0.3
0.83.1
≃0
154
76
221.28
78.4%44.6%
93.7%54.1%
68.2%2.6
≃0
1.6≃
016
74
62
21.3945.6%
79.8%93.9%
55.3%69.1%
0.12.6
1.5≃
017
45
64
21.4079.4%
63.6%93.7%
27.5%68.8%
2.7≃
01.5
≃0
186
46
321.53
52.2%78.4%
93.8%36.1%
68.3%0.3
2.41.6
≃0
194
46
521.59
78.1%78.4%
93.2%21.6%
68.1%2.6
0.21.4
≃0
205
46
421.63
64.2%80.2%
93.9%27.8%
69.3%1.2
1.61.5
≃0
.... ..
......
.... ..
. .....
......
.... ..
......
...32
43
93
23.7470.7%
94.2%55.1%
32.6%61.0%
2.62.7
≃0
≃0
. ... ..
......
.... ..
. .....
......
.... ..
......
......
. .....
......
. ... ..
......
......
. .....
......
8168
81
2124.77
7.0%7.0%
99.5%9.7%
12.1%≃
0≃
055.8
≃0
→A verages
were
computed
basedon
30replications.
20 DRDC-RDDC-2015-R152

The model results suggested that significant improvement can be made, without adding anynew personnel, by simply reallocating the staff in a more efficient way. Table 8 also showshowever that there is still room for improvement. For example, at the Processing station,the average waiting time in the queue (TQP ) for the optimal workforce allocation is 1.5hour and the average utilization of staff members (UP ) is 91.7%. This suggests that thenumber of staff at that station is probably not enough.
Figure 9 depicts the estimated hourly utilization rate of the personnel at each station for thebest 19 staff members workforce consisting of < 5 − 5 − 7 − 2 >. The green and the red linesrepresent the last families arriving at the EC and the time when all families are completedserviced (TSE = 17.94 hours), respectively. The average utilization at the Screen and Triageare approximately 73%. The figure reveals that the staff at these two stations are in realitybusy almost 100% for the first 12 or 13 hours, and then do not have any family to service.In reality, the TSE could probably be reduced a bit if staff was moved from a station toanother (e.g. from Screen to Process at 2000), but this is not possible in the current versionof the model.
Ho
url
y u
tiliz
atio
n
0.0
0.5
1.0
0.0
0.5
1.0
0.0
0.5
1.0
0700 1000 1300 1600 1900 2200 0100 0400 0700
Time
0.0
0.5
1.0
0700 1000 1300 1600 1900 2200 0100 0400 0700Time
Screen = 73.5%
Triage = 73.2%
Process = 91.7%
Register = 63.0%
US
UT
UP
UR
Figure 9: Hourly utilization of staff per station – Best allocation of 19 staff members< 5−5−7−2 >.
DRDC-RDDC-2015-R152 21

As illustrated in Figure 6, with the current planning assumptions, the earliest possible timeat which all families can be serviced is about 13 hours. Given that the best TSE valueobtained with a workforce of 19 staff members is about 18 hours, it implies that lower TSEvalues may be expected if more staff members were available. In the next subsection theimpact on adding more staff members is examined.
4.4 Scenario #3 – Impact of adding more staff members
Figure 10 presents the best estimated TSE as a function of the number of staff members asdetermined using the model. The value used for a workforce of 19 staff members (first pointin the figure) is one obtained with the optimal workforce, i.e. < 5−5−7−2 >. The graphshows that with the addition of one more staff member (N = 20), the TSE is reduced bymore than 1 hour. Similar reductions in the TSE values are observed until N = 24, at whichpoint, diminishing returns are noticeable. For N ≥ 24, the TSE values approach 13 hours,which represents the earliest estimated time when all the families can be completely servicedas discussed on Page 17. Note that the TSE slightly increases from N = 25 to N = 26. Thiswould likely not occur if a larger number of replications would have been performed.
11
12
13
14
15
16
17
18
18 20 22 24 26 28 30
TSE
(in
ho
urs
)
Number of staff members (N)
Figure 10: TSE as a function of the number of staff members.
The details on optimal workforce shown in Figure 10 are included in Table 9. For N = 24,the workload if each staff members appears to be well balanced with average utilization ateach station ranging between 81% and 85%. The table shows that the gain in adding morestaff after 24 is negligible in terms of improving the TSE, the benefits are essentially madein the reduction the utilization of the staff. For example, the difference in TSE betweenN = 24 and N = 29 is only about 35 minutes but the overall utilization drops by about 10%.
Figure 11 shows the estimated hourly utilization of the staff members at each station forthe workforce < 6−6−10−2 >, the best allocation of 24 staff members. It demonstrateshow the staff members are better utilized, compared to the same graphs created for otherworkforces shown in Figures 8 and 9. In the figure, one can see that there is no downtime,the staff members being almost equally employed during the whole day.
22 DRDC-RDDC-2015-R152

Table 9: Optimal allocation of 19 to 29 staff members.Number of staff Average utilization
N Screen Triage Processing Register TSE US UT UP UR U
19 5 5 7 2 17.94 73.5% 73.2% 91.7% 63.0% 79.0%20 5 5 8 2 16.69 82.5% 82.3% 90.2% 71.1% 84.4%21 5 5 9 2 15.58 87.5% 87.5% 84.9% 75.3% 85.3%22 5 6 9 2 15.34 87.8% 73.4% 86.1% 75.9% 82.1%23 6 6 9 2 14.55 75.5% 75.5% 88.0% 78.4% 80.7%24 6 6 10 2 13.88 81.2% 81.1% 84.7% 84.0% 82.9%25 6 6 11 2 13.58 80.5% 80.7% 79.0% 83.3% 80.1%26 6 6 11 3 13.67 82.1% 82.3% 78.9% 56.8% 77.9%27 6 7 11 3 13.63 81.8% 70.1% 78.4% 56.6% 74.6%28 7 7 11 3 13.32 72.6% 72.5% 82.2% 58.5% 74.8%29 7 7 12 3 13.23 72.5% 72.7% 73.4% 58.5% 71.5%
→ Averages were computed based from 30 replications.
Ho
url
y u
tiliz
atio
n
0.0
0.5
1.0
0.0
0.5
1.0
0.0
0.5
1.0
0700 1000 1300 1600 1900 2200 0100 0400 0700
Time
0.0
0.5
1.0
0700 1000 1300 1600 1900 2200 0100 0400 0700Time
Screen = 81.8%
Triage = 83.0%
Process = 86.1%
Register = 87.4%
US
UT
UP
UR
Figure 11: Hourly utilization of staff per station – Best allocation of 24 staff members,< 6−6−10−2 >.
DRDC-RDDC-2015-R152 23

4.5 Discussion
In this section, examples of the model being used to evaluate the efficiency of various staffsize and assignment were presented. The model was used to evaluate the efficiency of abaseline workforce recommended by DFATD based on planning experience. The baselineworkforce was determined not to be viable, and the model was subsequently used to identifyand examine bottlenecks in the system; the average hourly utilization rates of staff membersat each station were examined. The EC model was then used to determine better staffallocations, finding significant improvements in total processing time. In doing so, the modelgenerated possible workforce allocation solution sets and ranked them in terms of total time.Finally, the model was used to determine the benefit of incrementally adding more staff,and optimally allocate them, to the stations.
An aspect that has not been discussed is model validation, i.e. the process of ensuringthat the model and its associated data represent the real-world system with sufficientaccuracy. Historical data are often used for model validation. In this context, it meanstesting the model with data from past evacuations—how many evacuees were processed atthe evacuation centre, how many staff members (and work hours) were available, how longdid it take, etc. Such data were not available during the model development as it has notbeen historically collected by DFATD. If such data became available in the future, theycould be used to validate the model’s behavior and to improve its accuracy.
24 DRDC-RDDC-2015-R152

5 Summary and Future Work
The CJOC OR&A Team is developing an analysis toolset to support NEO planners withinDND and DFATD. The toolset is referred to as the STONE. When presenting the STONEto policy advisors and emergency planning officers within DFATD [9], an action itemidentified was the development of a tool to model an EC in greater detail. Estimating therequired workforce at an EC is a challenging task for DFATD. There is no specific guidanceor reference documents; DFATD has relied on lessons learned and planners’s experiencegained over the years through NEO exercises and executions.
In response, this report documented a tool designed to simulate the processes at the keycomponent of the evacuation chain: the EC. The capabilities of the model and the typesof question that it can address were demonstrated on realistic scenarios. In particular,application of the model was shown to answer questions such as:
1. how much time is required to service a given number of CEPs with a particularworkforce (number of staff members and their allocation)?
2. what workforce is required to service a number of CEPs in a day?
3. what throughput (i.e. CEPs per hour) can be achieved given a particular workforce?
On-going work includes the application of the EC model to high-risk missions identifiedby DFATD, increasing the fidelity of selected Consular plans. Future work includes theintegration of the EC model into the STONE, and contribution to a NATO Science andTechnology Organization (STO) Systems Analysis and Studies (SAS) technical activity onthe collaboration of OR&A support to NEO.
Finally, the model uses several input parameters that are estimated by the Subject-matterexperts. A way that the model can be improved is by using more accurate input parameters.This can be done by collecting data during exercises or real life evacuations. For example,observing the time taken to service the CEPs at each station in order to develop bettertime distributions, or capturing throughout the evacuation the proportion of CEPs who areeligible (with and without proper documentation) or not eligible.
DRDC-RDDC-2015-R152 25

References
[1] Department of National Defence (2003), Joint Doctrine Manual on Non-CombatantEvacuation Operations, B-GJ-005-307/FP-050.
[2] Asia Pacific Foundation of Canada (2011), Canadians Abroad: Canada’s GlobalAsset (online), www.asiapacific.ca/sites/default/files/canadians_abroad_final.pdf (Accessed: 29 September 2014).
[3] North Atlantic Treaty Organization Standardization Agency (2013), AlliedAdministrative Publication-06, NATO Glossary of Terms and Definitions.
[4] WorldReach Market Research Series (2007), Lebanon Evacuation Summary(online), http://worldreach.com/wp-content/themes/world-reach/_resources/_pdf/worldreach_market_research_series_lebanon_evacuation_summary3.pdf(Accessed: 14 August 2015).
[5] CBC News (2006), Evacuation Timeline: The Biggest Rescue in Canadian History(online), www.cbc.ca/news2/background/middleeast-crisis/evac_timeline.html(Accessed: 14 August 2015).
[6] Caron, J.-D. and Kaluzny, B. (2015), Optimization of Evacuation Time and ResourceUtilization for Non-Combatant Evacuation Operations, submitted to Lecture Notes inManagement Science (2015) Vol. 7, Proceedings of the 7th International Conference onApplied Operational Research (ICAOR’15).
[7] Caron, J.-D. and Kaluzny, B. (2015), Simulation tool for optimizing non-combatantevacuation (STONE): Optimization of evacuation time and resource utilization, (DRDC-RDDC-2015-R074) DRDC – Centre for Operational Research and Analysis.
[8] Arsham, H. (2013), Glossary / Technology Online (online), http://technology.tki.org.nz/Glossary (Accessed: 14 May 2015).
[9] Caron, J. D. and Kaluzny, B. (2014), Simulation Tool for Optimizing Non-CombatantEvacuation (STONE) – An Overview (MS Powerpoint presentation).
[10] Bougeret, LCol P. (2009), La recherche opérationnelle au service de l’évacuation deressortissants, Doctrine—Revue détudes générales, 16, 69–71.
[11] Murphy, P. (2012), Noncombatant Evacuation Operations: Analysis and ModelingMethods, Center for Army Analysis, 17th US/Canada OR Symposium, Ottawa, Canada.
[12] Kuchel, D. (2013), Analyzing Noncombatant Evacuation Operations Using DiscreteEvent Simulation, Center for Army Analysis, Proceedings of the 2013 Winter SimulationConference.
[13] Olsen, Maj C.M. (USAF) (2007), Simulation Study of Evacuation Control CenterOperations Analysis, Graduate Research Paper, AFIT/IOA/ENS/11-04, Departmentof Operational Sciences, Air Force Institute of Technology.
26 DRDC-RDDC-2015-R152

[14] Gregg, Maj A.N. (USAF) (2010), Optimizing Crisis Action Planning inthe Noncombatant Evacuation Operation Setting, Graduate Research Paper,AFIT/IOA/ENS/10-02, Department of Operational Sciences, Air Force Institute ofTechnology.
[15] Scheer, Maj M.A. (USAF) (2011), Noncombatant Evacuation Operations in USEUCOM,Graduate Research Paper, AFIT/IOA/ENS/11-05, Department of Operational Sciences,Air Force Institute of Technology.
[16] Blackstone, B. (DFATD), Evacuation Process Infographic, email to J.-D. Caron,8 December 2014.
[17] Department of Foreign Affairs, Trade and Development (DFATD) (2014), EvacuationPlan – Lebanon (DRAFT Version 10).
[18] MATLAB (2014), version 8.4.0 (R2014b), Natick, Massachusetts: The MathWorks Inc.
[19] Banks, J., Carson, J., Nelson, B., and Nicol, D. (2001), Discrete-Event SystemSimulation, Prentice Hall.
[20] Chang, J. F. (2006), Business Process Management Systems: Strategy andImplementation, Auercach Publications.
[21] Statistics Canada (2013), Distribution (in percentage) of private householdsby household size, Canada, 1961 to 2011 (online), www12.statcan.gc.ca/census-recensement/2011/as-sa/98-312-x/2011003/fig/desc/desc3_1-4-eng.cfm (Accessed:11 February 2015).
[22] CBC News (2010), Haiti Earthquake News: Main Prison Destroyed, 4,000 PrisonersEscape (online), http://www.cbsnews.com/8301-504083_162-6100169-504083.html(Accessed: 14 August 2015).
[23] Blackstone, B., and Bedard, S. (DFATD), Answers to Questions about Model Inputs,email to J.-D. Caron, 13 February 2015.
[24] Leung, G. (2013), Reengineering Primary Health Care for Information andCommunication Technology, Thesis – Master of Science in Engineering Management,University of Alberta.
[25] Arsham, H. (2013) Systems Simulation: The Shortest Route to Applications (online),http://home.ubalt.edu/ntsbarsh/simulation/sim.htm (Accessed: 19 February 2015).
[26] Whitt, W. (1991), The efficiency of one long run versus independent replications insteady-state simulation, Management Science, 37(6), 645–666.
DRDC-RDDC-2015-R152 27

This page intentionally left blank.
28 DRDC-RDDC-2015-R152

Annex A: Evacuation centre model in SimEvents
This annex provides information about the implementation of the model. It shall be notedthat not all the details are included in this annex, but it should give an idea on how it wasimplemented. It is expected that the reader has basic knowledge of discrete-event simulation,SimEvents and MATLAB.
A.1 Discrete-event simulation
The model was built in SimEventsr, a discrete-event simulation engine, part of MATLAB,and created by MathWorks. Specifically, it is a toolbox within Simulink. The structure ofthe model is depicted in Figure A.1. There are three different levels: Level 0 (“ECv1”),Level 1 (“EC”) and Level 2 (“Screen”, “Triage”, “Processing”, “Register”, “Output Data”and “Set Attributes”).
Figure A.1: Structure of the SimEvents model.
The top level is shown in Figure A.2. The entities are created using the “Entity Generator”block ( ) based on the arrival distribution a priori calculated in a MATLAB script. Oncecreated, the entities are passed to the “EC” block, then disposed of using the “Entity Sink”block ( ). In all the figures shown in this annex, blue blocks represent blocks that arefurther decomposed into sub-blocks (i.e. sub-processes), orange blocks are “Signal Scope”blocks which plot data on the screen when the simulation runs, and green blocks are “DiscreteEvent Signal to Workspace” blocks, used to write data to a structure or an array in theMATLAB workspace.
Figure A.2: Level 0 in SimEvents model.
DRDC-RDDC-2015-R152 29
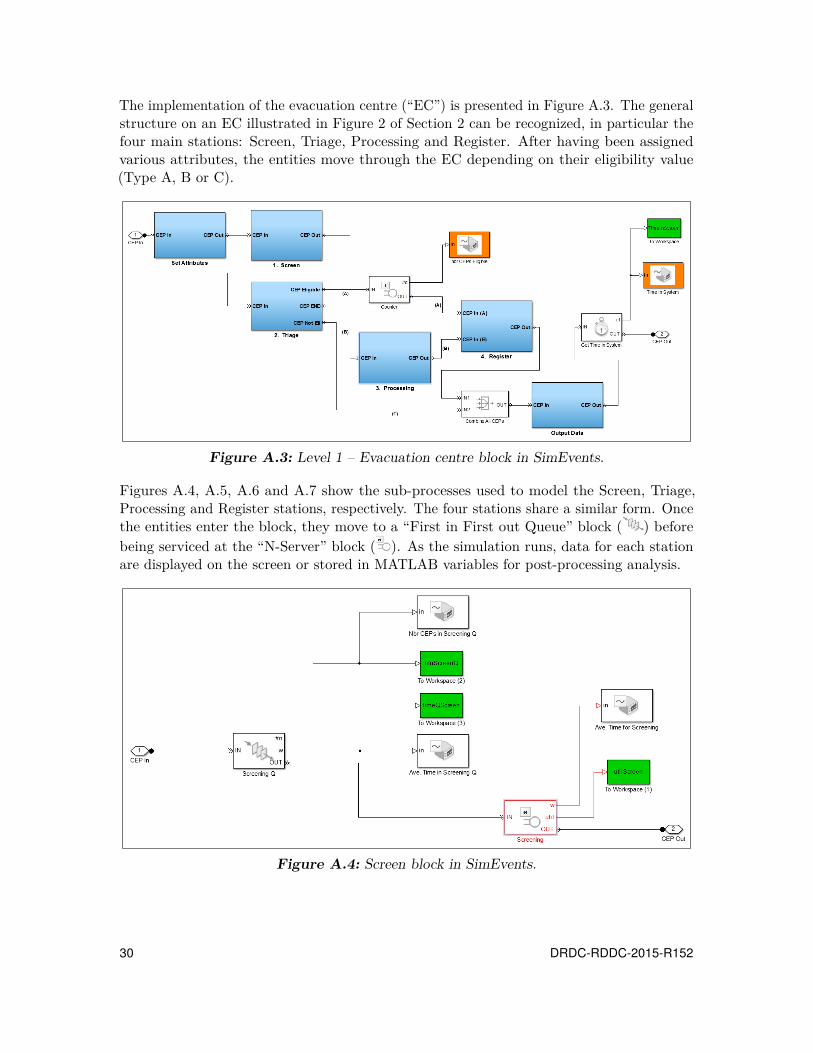
The implementation of the evacuation centre (“EC”) is presented in Figure A.3. The generalstructure on an EC illustrated in Figure 2 of Section 2 can be recognized, in particular thefour main stations: Screen, Triage, Processing and Register. After having been assignedvarious attributes, the entities move through the EC depending on their eligibility value(Type A, B or C).
Figure A.3: Level 1 – Evacuation centre block in SimEvents.
Figures A.4, A.5, A.6 and A.7 show the sub-processes used to model the Screen, Triage,Processing and Register stations, respectively. The four stations share a similar form. Oncethe entities enter the block, they move to a “First in First out Queue” block ( ) beforebeing serviced at the “N-Server” block ( ). As the simulation runs, data for each stationare displayed on the screen or stored in MATLAB variables for post-processing analysis.
Figure A.4: Screen block in SimEvents.
30 DRDC-RDDC-2015-R152

Figure A.5: Triage block in SimEvents.
Figure A.6: Processing block in SimEvents.
Figure A.7: Register block in SimEvents.
DRDC-RDDC-2015-R152 31

Figures A.8 and A.9 contain the last two main blocks in the model, i.e. “Set Attributes” and“Output Data”. In “Set Attributes”, the values of the attributes for each entity come from“Event-Based Sequence” blocks ( ), i.e. sequences of number from column vectors in theMATLAB workspace calculated by a script executed before the simulation is run. Theseattributes are used at various stages in the simulation. For instance, “GroupEligibility”determines whether an entity, once completed with the Triage station, goes to “Register”(Type A), “Processing” (Type B) and exit the EC (Type C).
Figure A.8: Set attributes block in SimEvents.
In the “Output Data” block, data are extracted using a series of “Get Attribute” blocks ( )and outputed to variables in the MATLAB workspace (via the green blocks).
Figure A.9: Output data block in SimEvents.
32 DRDC-RDDC-2015-R152

A.2 MATLAB script
As discussed in Section 3, a MATLAB script serves as the main driver for the simulationmodel. Pseudo code of the script is presented in Figure A.10. The structure of the scriptis similar to the one presented [24]. A narrative description of the script can be found inSubsection 3.8.
For w = 1 to W (for each workforce)
End
Compute stats for workforce w
Start
Read input data from the Excel GUI
Initialize variables to store results
For r = 1 to R (for each replication)
Calculate families intergeneration time
Set family attributes size, eligibility and
times at each station
Save and display results
Run the simulation (SimEvents)
Set the number of servers based on
workforce w
Figure A.10: Pseudo code representation of the MATLAB script.
DRDC-RDDC-2015-R152 33

This page intentionally left blank.
34 DRDC-RDDC-2015-R152

Annex B: Number of replications to ensure statisticalsignificance
This annex includes a discussion on the number of replications required to ensure thatthe results produced by the simulation are statistical significant. A minimum number of30 replications was used to compute the results shown in Section 4. This annex providesevidence justifying why 30 replications was chosen.
When using a discrete-event simulation, the typical way to deal with randomness (orstochasticity) in the results, given the same input data, is to execute the simulation anumber of times, and to take the average of the measures of interest. An individualexecution of the simulation is called a replication. For the model presented in this report,the main measure of interest is the Time to completely Service all Evacuees (TSE), whichrepresents the total estimated time to completely service all the entities (i.e. the familiesof evacuees) generated during a replication. When R replications are executed, an averageTSE, noted TSE, is calculated as follows:
TSE =
Rr=1
TSEr
R
where, TSEr represents the TSE computed during replication r.
One of the most important questions to answer with discrete-event simulation is “Howmany replications have to be run in order to obtain statistically valid results?”. In otherwords, what is the number of replications required to achieve a level of confidence in theestimated TSE (or any other estimates) that is acceptable, and whose value is drivenby something other than mere randomness. In the model presented in this report, therandomness is introduced by a number of factors described in Sections 2 and 3, whichinclude the distribution of the family size, the evacuees’ eligibility, the number of evacuees,the arrival distribution, the service time at each station, etc.
The greater the number of replications, the greater is confidence in the results. Ideally, a verylarge number of replications would be conducted when analyzing a specific scenario. However,in some cases it is not possible, in particular, when the simulation time for one replicationis too large, or when the number of scenarios to be evaluated is too great. Such highvalues limit the number of replications that can reasonably be executed with the resourcesavailable. For the evacuation centre model, the time for one replication with 300 entities, isapproximately 3.2 seconds on an Intel(R) Core(TM) i5-2450M CPU (2.50GHz).9 It meansthat when analyzing a single scenario, a large number of replications can be done. Forexample, 10,000 replications would take about 9 hours.
The issue with the number of replications is more apparent when a large number of scenarioshave to be compared with each other. For instance, in Section 4, the problem of finding the9 All subsequent references to computational time are relative to this CPU.
DRDC-RDDC-2015-R152 35

best configuration of 19 staff to be allocated at the four stations (Screen, Triage, Processingand Register) is analyzed. As discussed in that section, there is a total of 816 ways to allocate19 staff at four locations; a subset of the list is shown in Table 7 on page 19. It means thata TSE value must be calculated for each configuration in order to do a comparison andto make a decision as to what configuration is the most desirable. If 10,000 replicationsof the 816 configurations were performed, it would take months of computing time on asimilar-powered computer. The next subsection describes the approach used to determinea lower, but yet large enough, number of replications required to generate statisticallysignificant estimates.
Method for estimating the number of replications
The method used in this report to estimate the number of replications is called independentreplications [25, 26]. Using mathematical notations, the question to answer can be expressedas follows: “How many replications R of the model should be executed if one wants toestimate TSE based on a set of replication-specific TSE values, with an acceptable expectedrelative error ε at a high probability of 1 − α. The method that was applied involves thefollowing steps.
1. Set the value of α for the confidence interval, i.e. the 100(1−α/2)%. In this analysisα = 0.10.
2. Execute the simulation a total of R0 times, each replication using a different randomnumber stream and independently chosen initial conditions, which includes the casethat all replications have identical initial conditions. In this case, 10,000 replications(R0 = 10,000) were executed. The histogram of the TSE (i.e. TSE1, TSE2, ...,TSE10,000) obtained for each replication is shown in Figure B.1.
0
200
400
600
800
17 18 19 20 21 22 23 24 25 26 27 28 29
Nu
mb
er o
f re
plic
atio
ns
TSE values
ϴ = 23.86 S0
2= 2.28
Figure B.1: Distribution of the 10,000 TSE values.
36 DRDC-RDDC-2015-R152

3. Estimate the sample mean θ using the following equation:
θ = 1R0
R0r=1
TSEr = 110,000
10,000r=1
TSEr = TSE ≈ 23.86.
4. Calculate S02 as follows:
S02 =
R0r=1
(TSEr − θ)2
R0 −1 =10,000r=1
(TSEr −TSE)2
10,000−1 ≈ 2.28.
5. Assume that if θ and S02 are valid for R = 10,000, therefore θ and S0
2 are also goodestimates of the average and the variance for other values of R. Calculate the expectedrelative error εR as a function of R, using the following equation:
εR =
tα/2,R−1S0√R
θ.
Note that when R is greater than 30, the value of tα/2,R−1 is replaced by zα/2 , takenfrom the normal distribution table. In this case α = 0.10, therefore zα/2 = z0.05 = 1.64.
6. Plot the expected relative error (εR) as a function of the number of replications (R).The expected relative error based on the θ and S0
2 obtained from the 10,000 initialreplications is shown in Figure B.2.
0%
2%
4%
6%
8%
10%
12%
14%
0 10 20 30 40 50 60 70 80 90 100
Exp
ecte
d r
elat
ive
erro
r
Number of replications
Figure B.2: Expected relative error on the TSO as a function of the number of replications.
7. Finally, decide how many runs to execute based on the relative error that can betolerated.
DRDC-RDDC-2015-R152 37

Figure B.2 should be read as follows: if for instance, 90 replications are executed, theuser can expect, 90 percent (corresponding to 100(1 − α/2)%) of the time, an error ofapproximately ±1 percent of the estimated TSE. As expected, the error diminishes asthe number of replications increases. The relative error decreases rapidly until R equalsapproximately 20; at that point, diminishing returns are noticeable. For this work, thethreshold on the relative error was set to 2%, represented by the red dashed-line in Figure B.2.This means that in order to meet this threshold, a minimum of 30 replications should beexecuted with the model.
Other measures
The number of replications may vary depending on the measure of interest. The variability inother measures may be affected more or less by the randomness in the model. Consequently,in order to confirm the minimum number of replications (i.e. 30), the methodology presentedabove was applied to other measures used to analyze the results in Section 4. That is, theaverage utilization rates of the personnel at each station, noted US , UT , UP and UR forScreen, Triage, Processing and Register, respectively.
Similarly, 10,000 replications of the model were executed with the input parameters of thebaseline scenario. The values of θ were estimated with US , UT , UP and UR. The S0
2 valueswere calculated as per Step 4 above. The values obtained for θ and S0
2 are summarized inTable B.1.
Table B.1: Estimated values of θ and S02 for the utilization rates.
Station θ S02
Screen 0.9418 4.370E-05Triage 0.7053 1.557E-04Processing 0.5466 6.846E-04Register 0.3256 2.125E-05
The expected relative errors calculated for the utilization rates (US , UT , UP and UR) areshown in Figure B.3. The red dashed-line represents the acceptable relative error of 2%. Inall four cases, at R = 30 (the grey vertical lines), the expected relative error is less than 2%providing an indication that 30 replications is sufficient to obtain statistically significantestimates of the utilization rates.
The method explained in this annex provides an idea of the kind of error that can beexpected as a function of the number of replications executed. Based on the results shown,conducting a minimum of 30 replications with the simulation described in this report isdeemed large enough to generate statistically valid estimates.
38 DRDC-RDDC-2015-R152

0.0%
0.5%
1.0%
1.5%
2.0%
0 10 20 30 40 50 60 70 80 90 100
Exp
ecte
d r
elat
ive
erro
r
Number of replications
0.0%
1.0%
2.0%
3.0%
4.0%
0 10 20 30 40 50 60 70 80 90 100
Exp
ecte
d r
elat
ive
erro
r
Number of replications
a) Screen b) Triage
0.0%
2.0%
4.0%
6.0%
8.0%
10.0%
0 10 20 30 40 50 60 70 80 90 100
Exp
ecte
d r
elat
ive
erro
r
Number of replications
0.0%
0.5%
1.0%
1.5%
2.0%
2.5%
3.0%
0 10 20 30 40 50 60 70 80 90 100Ex
pec
ted
rel
ativ
e er
ror
Number of replications
c) Processing d) Register
Figure B.3: Expected relative error on the utilization rate as a function of the number of replications.
DRDC-RDDC-2015-R152 39

List of acronyms and notations
ADM(S&T) Assistant Deputy Minister Science and Technology
AFIT Air Force Institute of Technology
AP Assembly Point
CAA Center for Army Analysis
CEP Canadian or Eligible Person
CIC Citizenship and Immigration Canada
CJOC Canadian Joint Operational Command
CSIS Canadian Security Intelligence Service
DFATD Department of Foreign Affairs, Trade and Development
DND Department of National Defence
DSRO Division simulation et recherche opérationelle
EC Evacuation Centre
GoC Government of Canada
GUI Graphical User Interface
M&S Modeling and Simulation
NATO North Atlantic Treaty Organization
NEO Non-Combatant Evacuation Operation
OR&A Operational Research and Analysis
RCMP Royal Canadian Mounted Police
RS Repatriation Site
SAS Systems Analysis and Studies
SH Safe Haven
STO Science and Technology Organization
STONE Simulation Tool for Optimizing Non-Combatant Evacuation
TSE Time to completely Service all Evacuees
40 DRDC-RDDC-2015-R152

DOCUMENT CONTROL DATA(Security markings for the title, abstract and indexing annotation must be entered when the document is Classified or Protected.)
1. ORIGINATOR (The name and address of the organization preparingthe document. Organizations for whom the document was prepared,e.g. Centre sponsoring a contractor’s report, or tasking agency, areentered in section 8.)
DRDC – Centre for Operational Research andAnalysisDept. of National Defence, MGen G. R. PearkesBldg., 101 Colonel By Drive, 6CBS, OttawaON K1A 0K2, Canada
2a. SECURITY MARKING (Overall security marking ofthe document, including supplemental markings ifapplicable.)
UNCLASSIFIED
2b. CONTROLLED GOODS
(NON-CONTROLLED GOODS)DMC AREVIEW: GCEC DECEMBER 2012
3. TITLE (The complete document title as indicated on the title page. Its classification should be indicated by the appropriateabbreviation (S, C or U) in parentheses after the title.)
A model to estimate personnel requirements at an evacuation centre during a non-combatantevacuation
4. AUTHORS (Last name, followed by initials – ranks, titles, etc. not to be used.)
Caron, J.-D.; Kaluzny, B. L.
5. DATE OF PUBLICATION (Month and year of publication ofdocument.)
August 2015
6a. NO. OF PAGES (Totalcontaining information.Include Annexes,Appendices, etc.)
54
6b. NO. OF REFS (Totalcited in document.)
26
7. DESCRIPTIVE NOTES (The category of the document, e.g. technical report, technical note or memorandum. If appropriate, enterthe type of report, e.g. interim, progress, summary, annual or final. Give the inclusive dates when a specific reporting period iscovered.)
Scientific Report
8. SPONSORING ACTIVITY (The name of the department project office or laboratory sponsoring the research and development –include address.)
DRDC – Centre for Operational Research and AnalysisDept. of National Defence, MGen G. R. Pearkes Bldg., 101 Colonel By Drive, 6CBS, OttawaON K1A 0K2, Canada
9a. PROJECT OR GRANT NO. (If appropriate, the applicableresearch and development project or grant number underwhich the document was written. Please specify whetherproject or grant.)
FE1-06ac
9b. CONTRACT NO. (If appropriate, the applicable number underwhich the document was written.)
10a. ORIGINATOR’S DOCUMENT NUMBER (The officialdocument number by which the document is identified by theoriginating activity. This number must be unique to thisdocument.)
DRDC-RDDC-2015-R152
10b. OTHER DOCUMENT NO(s). (Any other numbers which maybe assigned this document either by the originator or by thesponsor.)
11. DOCUMENT AVAILABILITY (Any limitations on further dissemination of the document, other than those imposed by securityclassification.)
Unlimited
12. DOCUMENT ANNOUNCEMENT (Any limitation to the bibliographic announcement of this document. This will normally correspondto the Document Availability (11). However, where further distribution (beyond the audience specified in (11)) is possible, a widerannouncement audience may be selected.)
Unlimited

13. ABSTRACT (A brief and factual summary of the document. It may also appear elsewhere in the body of the document itself. It is highlydesirable that the abstract of classified documents be unclassified. Each paragraph of the abstract shall begin with an indication of thesecurity classification of the information in the paragraph (unless the document itself is unclassified) represented as (S), (C), or (U). It isnot necessary to include here abstracts in both official languages unless the text is bilingual.)
In 2014, the Canadian Joint Operational Command Operational Research and Analysis Teaminitiated the development of an analysis toolset to support non-combatant evacuation planningwithin the Department of National Defence and the DFATD. This report documents one of thetools designed to simulate the processes at one of the key component of the evacuation chain:the EC. The main utility of the tool is to provide a means to estimate the number of staff membersrequired at an EC during an evacuation given various planning assumptions.
A typical EC structure is modeled, consisting of four main stations: Screen, Triage, Processingand Register. The model is implemented as a discrete-event simulation built in MathWorksSimEventsr with a graphical user interface in Microsoft Excel used to capture the inputs requiredby the discrete-event simulation. This report details the model developed, including assumptionsconsidered and the main inputs and outputs. A realistic scenario is used to demonstrate themodel’s capabilities and benefits.
En 2014, l’équipe d’analyse et de recherche opérationnelle du Commandement des opérationsinterarmées du Canada a entamé l’élaboration d’une boîte à outils d’analyse afin d’appuyer laplanification des opérations d’évacuation de non-combattants au sein du ministère de la Défensenationale et du ministère des Affaires étrangères, du Commerce et du Développement (MAECD).Le rapport présente un des outils conçus pour simuler les processus d’un des éléments clésde la chaîne d’évacuation : le centre d’évacuation. L’utilité principale de l’outil est de permettred’estimer le nombre de membres du personnel nécessaire à un centre d’évacuation, selondiverses hypothèses de planification.
Une structure typique d’un centre d’évacuation est modélisée en quatre principales étapes :ciblage, triage, traitement et enregistrement. Le modèle est une simulation à événements discretsdéveloppée en MathWorks SimEventsr avec une interface utilisateur graphique en MicrosoftExcel utilisée pour saisir les données nécessaires à la simulation. Le rapport décrit en détail lemodèle conçu, y compris les hypothèses considérées et les principaux intrants et extrants. Unscénario réaliste sert à démontrer les capacités et les avantages du modèle.
14. KEYWORDS, DESCRIPTORS or IDENTIFIERS (Technically meaningful terms or short phrases that characterize a document and couldbe helpful in cataloguing the document. They should be selected so that no security classification is required. Identifiers, such asequipment model designation, trade name, military project code name, geographic location may also be included. If possible keywordsshould be selected from a published thesaurus. e.g. Thesaurus of Engineering and Scientific Terms (TEST) and that thesaurus identified.If it is not possible to select indexing terms which are Unclassified, the classification of each should be indicated as with the title.)
Non-Combatant; NEO; Simulation; Discrete-Event; Operations; Matlab; SimEvents; StaffAllocation


www.drdc-rddc.gc.ca