a modified tracer-gas-concentration decay method for ...yanchen/paper/2014-3.pdf · a modified...
TRANSCRIPT

1
A Modified Tracer-Gas-Concentration Decay Method for Ventilation Rate
Measurements in Large, Long, and Narrow Spaces
Jiangyue Chaoa, Xuan Mua, Yu Xuea, Fei Lia, Weijuan Lia, Chao-Hsin Linb, Jingjing Peia,*, Qingyan Chena, c
aSchool of Environmental Science and Engineering, Tianjin University, Tianjin 300072, China bEnvironmental Control Systems, Boeing Commercial Airplanes, Everett, WA 98203, USA
cSchool of Mechanical Engineering, Purdue University, West Lafayette, IN 47907, USA
*Corresponding author: [email protected]
Abstract
Ventilation is essential to the health and comfort of occupants in enclosed spaces. However, it is difficult to accurately measure the ventilation rates in large, long, and narrow spaces such as aircraft cabins and train compartments. This study proposed a modified tracer-gas-concentration decay method that combined the multi-zone technique and genetic algorithm to determine ventilation rate in such spaces. To validate the proposed method, the investigation utilized both the modified decay method and the traditional decay method to numerically measure the ventilation rate in an MD-82 aircraft cabin by Computational Fluid Dynamics (CFD) technique. The results showed that the modified tracer-gas-concentration decay method can significantly improve the accuracy and reliability of the ventilation rate measurements in such a large, long, and narrow space. The modified tracer-gas-concentration decay method was also used to experimentally measure the ventilation rate in an actual MD-82 aircraft cabin. Although no exact ventilation rate could be measured, compared with the traditional tracer-gas-concentration decay method, the ventilation rate determined by the modified method was much closer to that obtained by the constant tracer-gas-concentration method, which is considered to be the most accurate measurement. .
Keywords: CFD; Genetic algorithms; Multi-zone; Aircraft cabin
Introduction
Determination of ventilation rates in large spaces using nonintrusive method has always been very challenging. In many cases, intrusive methods, such as direct measurement of airflow rate from an air supply system, are not practically feasible as the system must remain completely sealed and openings cannot be drilled in the duct. A typical nonintrusive method for measuring ventilation rate is tracer-gas technique [1], which can be further classified into three categories: constant injection method, concentration decay method, and constant concentration method [2].
In constant injection method, tracer gas is injected continuously at the same release rate into
Chao, J., Mu, X., Xue, Y., Li, F., Li, W., Lin, C.-H., Pei, J., and Chen, Q. 2014. “A modified tracer-gas-concentration decay method for ventilation rate measurements in large, long, and narrow spaces,” Indoor and Built Environment, 23, 1012-1020.
2
an enclosed space. The ventilation rate in this space can be easily determined by using the inlet and outlet tracer-gas concentration as well as the tracer-gas injection rate. However, this method can be costly, as the injection may need to be maintained for a long period of time to achieve a stable condition. Shinohara et al. [3] modified this method to a low-cost and easy-to-use one to measure the effective air exchange rate in a three-room house, and the results were consistent with those obtained by the CO2-concentration decay method. However, this method requires a large amount of tracer-gas doses. In constant concentration method, the tracer-gas supply rate is adjusted and measured in order to maintain a constant concentration, but this method requires expensive equipment and technical support as the supply rate need to be feed-back controlled and adjusted automatically [4]. Chao et al. [5] utilized both the constant concentration and concentration decay methods to evaluate the air exchange performance in an office space with mechanical ventilation system and a residential apartment with natural ventilation. The results obtained by the constant concentration method were consistent with those obtained by the widely-adopted concentration decay method. In concentration decay method, tracer gas is injected into a space until a desired concentration is reached. Injection is then stopped, and the concentration decay of the tracer gas in the space is continuously measured. The measured concentration decay curve can be used to calculate the ventilation rate [6]. The concentration decay method requires the least amount of tracer gas and relatively simple equipment, making it the most widely used method [7]. However, all the methods require that the tracer-gas concentration in the space be as uniform as possible for accurate measurement of the ventilation rate [2]. Many approaches have been used to achieve the well-mixed therefore uniform condition [8, 9].
For large, long, and narrow spaces, such as an aircraft cabin, it is difficult to determine the ventilation rate accurately. This is because a uniform distribution of tracer-gas concentration in the long cabin is difficult to achieve unless the tracer gas is injected in multiple locations and the injection rate can be adjusted to maintain a constant concentration. Thus, it is essential to develop a low-cost method that can be used by non-experts for measuring the ventilation rate in large, long, and narrow space without excessive use of multiple point injection and complex mixing approach. This investigation has attempted to address this issue by modifying the traditional tracer-gas-concentration decay method with a multi-zone model and genetic algorithm.
Method description
The basic idea was to divide a large, long, and narrow space into multiple zones with imaginary borders. When tracer gas is injected into such a space at a limited number of locations, its concentration in each zone can be considered quasi-uniform. If the tracer-gas concentration varies significantly from zone to zone, auxiliary equipment, such as fans, may be used in the space to increase mixing and achieve a more uniform concentration distribution. The sum of the ventilation rates measured in each zone is then the total ventilation rate for the entire space.
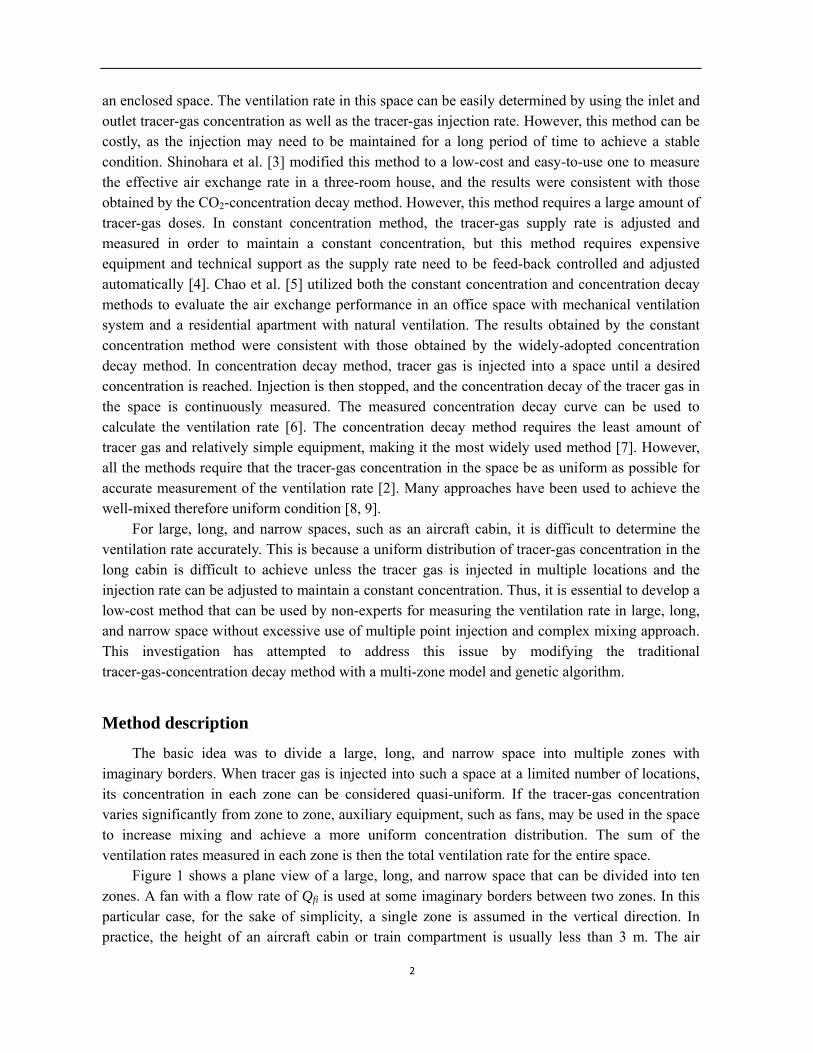
Figure 1 shows a plane view of a large, long, and narrow space that can be divided into ten zones. A fan with a flow rate of Qfi is used at some imaginary borders between two zones. In this particular case, for the sake of simplicity, a single zone is assumed in the vertical direction. In practice, the height of an aircraft cabin or train compartment is usually less than 3 m. The air

3
change rate in a cabin is typically around 20-30 ACH so strong mixing is normally present in airliner cabins. Therefore, good mixing occurs in the vertical direction, and a single zone in this direction is sufficient. In addition, since the space is narrow, mixing at a cross section should be sufficiently good. For each zone, Qin,i is the supply air rate, Qout,i is the exhaust air rate, and Qi, Qfi, and Q’fi are the air exchange rates between zones as indicated in Figure 1. In a completely sealed space,ΣQout,i is the ventilation rate of the space, which is the same as the sum of the air supply rate to each zone: ∑ , ∑ , (1)
Fig.1 Schematic of a large, long, and narrow space divided into multiple zones with fans at the
longitudinal borders between zones ( for fan and for airflow direction) If a tracer gas is injected into a zone of the space, its concentration in this zone can be
calculated by the following conservation equation with the assumption of uniform tracer-gas concentration in the zone:
C
V QCd
mdt
(2)
where V is the zone volume, C the tracer-gas concentration, Q the ventilation rate to the zone, andm the injection rate of the tracer gas. In the tracer-gas-concentration decay method, the tracer gas
will decay due to ventilation after injection into the space is stopped. Furthermore, if we assume that the reverse flow is negligible compared with the flow created
by a fan, means 0, and the air exchange between two zones in a cross section is sufficiently
small (Qi=0, i= 1,…, 6), the conservation equation for the tracer-gas concentration in Zone 1 can be expressed as:

4
, 0
(3) Similar equations can be found for Zones 5, 6, and 10. The conservation equation for Zone 2 has a different form:
, 0
(4) Similar equations can be written for Zones 3, 4, 7, 8, and 9. By combining Eqs. (3) and (4) for all the zones, one have the following equation:
⋯
, , ⋯ ,
(5) Typically, one would use the same type of fans throughout the space. Therefore, one could assume:
⋯ (6)
The conservation equation for the tracer-gas concentration in each zone can be integrated to yield:
, , 0
(7) When i=10, subscript i+1 is 1.
Although there are 20 unknown parameters (Qout,1, …, Qout,10, Qf,1,…,Qf,10), we have only 11 equations (Eq. (7) for each zone and Eq. (5)). However, one could vary Qf,i over a small range in order to determine Qout,i from Eq. (7) while satisfying Eq. (5). This investigation used a genetic algorithm to perform the task [10]. As a gradient-free method, the genetic algorithm is capable of dealing with nonlinear and multi-solution problems, and it can achieve global optimal results with less computing time compared with other methods [11]. The genetic algorithm uses evolution operations to transform a population of data objects into a new population with higher average fitness values [12]. Our study used fitness defined as a variation of Eq. (5).

5
Fitness , ∑ ∑ , ∑ ∑⋯
, ∑ ∑1
(8)
The genetic algorithm works according to a flowchart as shown in Figure 2. A set of variables, Qf,i in this case, formed individuals. Each individual will determine the value of Qout,i based on Eq. (7). A group of randomly generate individuals was set as an initial population and will be evaluated by their fitness values. If the fitness value of any individual cannot satisfy the optimization criterion, evolution operations will work on this population by selection, crossover and mutation whose definitions can be found in reference [13]. The selection chooses a collection of individuals with higher fitness value from the current population for crossover and mutation. Crossover of individuals slightly changes the variable value of Qf,i so that the optimal individual is quickly found in a small search range. Mutation of individuals dramatically changes the variable value of Qf,i to find optimal individuals in a new search range. When all individuals in the population satisfy the termination criterion, the optimal individual will be the result to determine ΣQout,i. This approach successfully meets our needs. This is a modified tracer-gas-concentration decay method that combines a multizone model and the genetic algorithm.

6
Fig. 2 Genetic algorithm flowchart
Method validation
Ideally, the modified method described above would be validated for a large, long, and narrow space by injecting tracer gas and measuring the tracer-gas-concentration decay in each imaginary zone. The total ventilation rate measured through the air supply system would then be used to validate ∑Q calculated by the above method. Unfortunately, we did not find such experimental data of measured total ventilation rate for validating our model through literature search. We did perform experimental measurements of ventilation rate in the economy-class cabin of an actual MD-82 cabin. However, the experimental data was not very accurate. The results may not be conclusive. To remedy the problem, we also used Computational Fluid Dynamics (CFD) to simulate airflow and tracer-gas concentration in a numerical MD-82 aircraft cabin. Zhang et al. [14] recommended CFD as an alternative of experimental measurements as it has been maturely developed and validated for trusted results. The following sub-sections will discuss the validation of the modified tracer-gas model by numerical CFD and experimental data in an MD-82 aircraft cabin.
Mutation
Initial population
Individual: (Q
f,1,Q
f,2,…,Q
f,10)
Multiple individuals
Evaluate fitness value of each
individual
Termination criterion satisfied?
No Selection
Crossover
New population
Yes
Optimal population
Maximum fitness
Optimal individual
Ventilation rate (ΣQ
out,i)
(Qout,1
,Qout,2
,…,
Qout,10
)

7
Validation of the modified tracer-gas decay method in a numerical MD-82 aircraft cabin
This investigation first numerically simulated the air flow in an un-occupied economy-class MD-82 aircraft cabin, as shown in Figure 3. A commercial CFD solver, FLUENT (version 12.1) [15], with the RNG k-ε model was used to solve the turbulence flow. Furthermore, the simulation adopted the SIMPLE algorithm to couple the pressure and momentum equations, and the PRESTO! scheme was used for pressure discretization [15].
Fig. 3 The simulated unoccupied, economy-class MD-82 airplane cabin
In the CFD simulation, the inlet velocity from the air supply diffusers on both longitudinal
sides of the ceiling was set to be 0.346 m/s or a ventilation rate was set to be 0.9833 m3/s. The flow rate used was obtained by measurement in actual MD-82 plane. In the simulation, tracer gas was set to be released at four locations (P1, P2, P3, and P4) in the cabin at a flow rate of 1.12×10⁻⁴ kg/s. Eight fans (the red round plates shown in Figure 3) were set in the numerical cabin to enhance the mixing of the tracer gas with the surrounding air. The eight fans were simulated by a velocity of 2 m/s with flow direction indicated by the green arrows shown in Figure 3. Isothermal assumption was applied during the simulation.
The CFD model used a hybrid grid scheme with a tetrahedral grid for the main flow domain and a hexahedral grid for the momentum sources and inlet areas. All the cells throughout the domain were converted into polyhedral cells, producing a total cell number of two million. The simulation required 11,300 iterations to obtain a converged air flow solution first. The tracer gas was then released numerically until a steady concentration was reached. Then, the tracer-gas injection was stopped, and the air flow simulation was resumed to simulate the decay of the tracer-gas concentration. Thus, the CFD simulation can generate tracer-gas concentration decay in any location of the cabin for use in the modified concentration decay method to determine the ventilation rate.
The validation of the modified concentration decay method used two sets of sampling data to

8
investigate the effect of the number of sampling point. Set 1 contained concentration decay data at Points 3, 5, 7, and 10 to represent the concentration for the four zones with the dashed lines as borders in Figure 4. Set 2 used the data at Points 1 to 10 from the ten zones enclosed by solid lines in Figure 4. These data sampling points provided the tracer-gas concentration at the outlet of each zone that best represent the average concentration in the zone.
Fig. 4 Sampling locations near air exhausts at floor level in the numerical MD-82 cabin
The tracer-gas concentration in these zones was then used in the modified concentration decay
method to determine the ventilation rate. For traditional tracer-gas concentration decay method, the averaged concentration sampled in all the zones (Point 1 -10) was used in Eq. (1). Figure 5 shows the ventilation rates obtained by the modified concentration decay method with 4 (point 3, 5, 7, 10) and 10 (point 1-10) points data respectively. The ventilation rate obtained by the traditional concentration decay method was also plotted in the figure for comparison. With four zones, the traditional method overestimated the ventilation rate by 33%, while the modified method deviated from the actual ventilation rate by only 7%. When the number of zones increased to ten, the estimation accuracy was further improved. The traditional tracer-gas-concentration decay method produced acceptable results, with an error of about 10%. The modified method performed even better, with a negligible error of 4%.
Fig. 5 Comparison of the ventilation rate by the modified and traditional concentration decay method with different zones/sampling points
9
Validation of the modified tracer-gas decay method in an actual MD-82 aircraft cabin
It should be sufficient to validate the modified concentration decay method by using the CFD
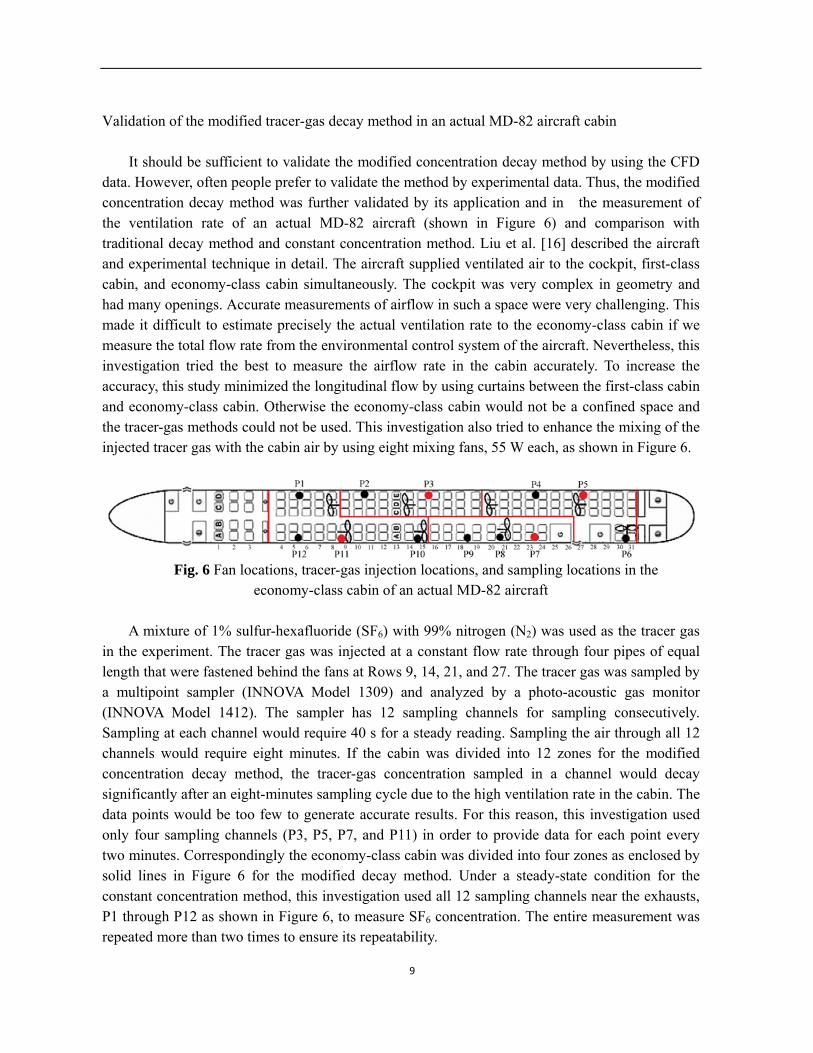
data. However, often people prefer to validate the method by experimental data. Thus, the modified concentration decay method was further validated by its application and in the measurement of the ventilation rate of an actual MD-82 aircraft (shown in Figure 6) and comparison with traditional decay method and constant concentration method. Liu et al. [16] described the aircraft and experimental technique in detail. The aircraft supplied ventilated air to the cockpit, first-class cabin, and economy-class cabin simultaneously. The cockpit was very complex in geometry and had many openings. Accurate measurements of airflow in such a space were very challenging. This made it difficult to estimate precisely the actual ventilation rate to the economy-class cabin if we measure the total flow rate from the environmental control system of the aircraft. Nevertheless, this investigation tried the best to measure the airflow rate in the cabin accurately. To increase the accuracy, this study minimized the longitudinal flow by using curtains between the first-class cabin and economy-class cabin. Otherwise the economy-class cabin would not be a confined space and the tracer-gas methods could not be used. This investigation also tried to enhance the mixing of the injected tracer gas with the cabin air by using eight mixing fans, 55 W each, as shown in Figure 6.
Fig. 6 Fan locations, tracer-gas injection locations, and sampling locations in the
economy-class cabin of an actual MD-82 aircraft A mixture of 1% sulfur-hexafluoride (SF6) with 99% nitrogen (N2) was used as the tracer gas
in the experiment. The tracer gas was injected at a constant flow rate through four pipes of equal length that were fastened behind the fans at Rows 9, 14, 21, and 27. The tracer gas was sampled by a multipoint sampler (INNOVA Model 1309) and analyzed by a photo-acoustic gas monitor (INNOVA Model 1412). The sampler has 12 sampling channels for sampling consecutively. Sampling at each channel would require 40 s for a steady reading. Sampling the air through all 12 channels would require eight minutes. If the cabin was divided into 12 zones for the modified concentration decay method, the tracer-gas concentration sampled in a channel would decay significantly after an eight-minutes sampling cycle due to the high ventilation rate in the cabin. The data points would be too few to generate accurate results. For this reason, this investigation used only four sampling channels (P3, P5, P7, and P11) in order to provide data for each point every two minutes. Correspondingly the economy-class cabin was divided into four zones as enclosed by solid lines in Figure 6 for the modified decay method. Under a steady-state condition for the constant concentration method, this investigation used all 12 sampling channels near the exhausts, P1 through P12 as shown in Figure 6, to measure SF6 concentration. The entire measurement was repeated more than two times to ensure its repeatability.

10
Figure 7 shows the concentration profiles of the 12 sampling points during three repeated measurements. After SF6 was injected for 10 minutes, the concentration reached steady state. Even with eight mixing fans , the data shows that the concentration distribution in the cabin was not uniform. However, the average SF6 concentration from the 12 sampling points can be used as the mean concentration in the constant concentration method.
Fig. 7 Tracer-gas (SF6) concentration at 12 sampling points in an economy-class cabin under
steady-state conditions from three repeat measurements
Experimental data collection for the concentration decay method began immediately after SF6 injection was stopped. Figure 8 shows the concentration decay profiles at the four sampling points during three repeated measurements. The SF6 concentration decayed exponentially to zero in 13 minutes. The data can be used to determine the ventilation rate with the modified concentration decay method by curve fitting.

11
Fig. 8 Tracer-gas (SF6) concentration at four sampling points in an economy-class cabin with the decay method from three repeat measurements
Table 1 compares the ventilation rates obtained by the three tracer-gas methods. As discussed
above, it is difficult determine the exact ventilation rate supplied to the economy-class cabin. However, we could assume that the ventilation rate obtained by the constant concentration method is the most accurate by comparing the principle of the three methods: it does not have the measurement errors in the decay methods due to transient decay of the tracer-gas concentration. Therefore the ventilation rate obtained by the constant concentration method can be used as the reference. The comparison showed that the modified concentration decay method measured a 5-10% lower ventilation rate, which is acceptable for most engineering applications. The traditional concentration decay method underestimated the ventilation rate even further, but not to the extent of that simulated by numerical method as shown in Figure 5. The discrepancies in ventilation rate between the constant concentration method and the concentration decay methods can be attributed to the non-uniform tracer-gas concentration distribution in such a large, long, and narrow space. Nevertheless, the modified concentration decay method can improve the accuracy of the traditional concentration decay method.
Tab.1 Measured ventilation rate for an MD-82 aircraft cabin (m3/s)
Experiment No.
Constant concentration
method
Modified concentration decay method
Traditional concentration decay method
1 0.918 0.805 0.799 2 0.938 0.908 0.811 3 0.949 0.900 0.839
For the experiment conducted in the MD-82 cabin, the modified concentration decay method

12
required SF6 injection for 10 minutes to reach a desired concentration level, and the entire measurement took 30 minutes. While the constant concentration method required injection of SF6 for 40 minutes continuously. The modified concentration decay method measures ventilation rate faster and uses 75% less SF6 gas.
Nevertheless, the concentration decay methods may produce errors in the measurement of ventilation rate. For example, with the air sampler and analyzer used in this study, one could measure a maximum of four points with a sampling interval of 2 minutes during the decay process. Since the total decay took approximately 13 minutes, six data points per zone can be obtained for curve fitting. However, In such a long space, four zones may not be sufficient because the tracer-gas concentration in each zone may not be uniform. To improve accuracy, the number of zones should be increased.
Conclusions
This investigation proposed a modified tracer-gas-concentration decay method for measuring the ventilation rate in large, long, and narrow spaces. Compared with the traditional tracer-gas-concentration decay method, the modified method divides the space into multi-zones. The mass conservation is solved by a multi-zone model, and the air flow was optimized through a genetic algorithm. The modified method also encourages the use of mixing fans in the space to achieve a more uniform distribution of tracer-gas concentration.
The modified concentration decay method was validated by its application in the numerical measurement of the ventilation rate of a MD-82 aircraft. The numerical simulation was conducted through CFD method, which can provide a detailed tracer-gas-concentration distribution versus time and a known ventilation rate. The study found that the traditional concentration decay method with four-points-averaged concentration overestimated the ventilation rate by 33%, while the modified concentration decay method with four zones overestimated by 7%.With 10 sampling points in the economy class cabin, means 10 zones for the modified method, the traditional and modified tracer-gas-concentration decay methods would overestimate the ventilation rate by 10% and 4%, respectively.
This study also applied the modified tracer-gas concentration method, the traditional tracer-gas concentration method, and the constant tracer-gas concentration method to experimentally measure the ventilation rate in the economy-class cabin of an actual MD-82 aircraft. Compare with the ventilation rate measured by constant concentration method, which is regarded as the most accurate one, the modified method measured 5-10% lower ventilation rate. The traditional concentration method underestimated the ventilation rate even further. Therefore, the modified tracer-gas decay method was proved to be more accurate than the traditional concentration decay method.
Acknowledgement
The research presented in this paper was supported financially by the National Basic Research Program of China (the 973 Program) through Grant No. 2012CB720100.

13
References
[1] Cheong KW: Airflow measurements for balancing of air distribution systems —tracer-gas technique as an alternative?: Building and Environment 2001; 36(8): 955–964.
[2] Etheridge D, Sandberg M: Building ventilation: Theory and measurement. Chichester, John Wiley and Sons, 1996.
[3] Shinohara N, Kataoka T, Takamine K, Butsugan M, Nishijima H, Gamo M: Modified perfluorocarbon tracer method for measuring effective multizone air exchange rates: International Journal of Environment Research and Public Health 2010; 7(9): 3348-3358.
[4] ISO16000-8: Determination of local mean age of air in buildings for characterizing ventilation conditions; in: International Standards for Business, Government and Society. Switzerland, Geneva, 2007.
[5] Chao CY, Wan MP, Law AK: Ventilation performance measurement using constant concentration dosing strategy: Building and Environment 2004; 39(11): 1277-1288.
[6] Daghigh R, Adam NM, Sahari BB: Ventilation parameters and thermal comfort of naturally and mechanically ventilated offices: Indoor and Built Environment 2009; 18(2): 113-122.
[7] Okuyama H, Onishi Y: Uncertainty analysis and optimum concentration decay term for air exchange rate measurements: Estimation methods for effective volume and infiltration rate: Building and Environment 2012; 49: 182-192.
[8] Loomans MGLC, van Houdt W, Lemaire AD, Hensen JLM: Performance assessment of an operating theatre design using CFD simulation and tracer gas measurements: Indoor and Built Environment 2008; 17(4): 299-312.
[9] Tung TCW, Burnett J: Radon measurement protocol for residences with different ventilation rates: Indoor and Built Environment 2004; 13(2): 133-138.
[10] Wetter M, Wright J: Comparison of a generalized pattern search and a genetic algorithm optimization method; in: Augenbroe G, HensenJ (eds): Proceedings of the Eighth IBPSA Conference, vol. III. Netherlands, Eindhoven, 2003, pp 1401–1408.
[11] Sakamoto Y, Nagaiwa A, Kobayasi S, Shinozaki T: An optimization method of district heating and cooling plant operation based on genetic algorithm: ASHRAE Transactions1999; 105(2): 104-115.
[12] Koza, JR: Genetic programming: on the programming of computers by means of natural selection. Cambridge, The MIT Press, 1992.
[13] Marco N, Désidéri JA, Lanteri S: Multi-objective optimization in CFD by genetic algorithms. Sofia Antipolis, INRIA, 1999.
[14] Zhang Z, Zhang W, Zhai Z, Chen Q: Evaluation of various turbulence models in predicting airflow and turbulence in enclosed environments by CFD: Part2-comparison with experimental data from literature: HVAC&R Research 2007; 13(6): 871-886.
[15] Ansys Fluent: Ansys Fluent 12.0 User’s Guide. Pennsylvania, AnsysInc, 2009. [16] Liu W, Wen J, Chao J, Yin W, Shen S, Lai D, Lin C-H, Liu J, Sun H, Chen Q: Accurate and
high-resolution boundary conditions and flow fields in the first-class cabin of an MD-82 commercial airliner: Atmospheric Environment 2012; 56:33-44.