a multi-dimensional assessment of ecosystems and...
TRANSCRIPT

1
A Multi-dimensional Assessment of Ecosystems and Ecosystem Services at Inle Lake, Myanmar
ICIMOD Working Paper 2017/17
Support to Rural Livelihoods and Climate Change Adaptation in the Himalayas (Himalica)

2
About ICIMODThe International Centre for Integrated Mountain Development, ICIMOD, is a regional knowledge development and learning
centre serving the eight regional member countries of the Hindu Kush Himalaya – Afghanistan, Bangladesh, Bhutan,
China, India, Myanmar, Nepal, and Pakistan – and based in Kathmandu, Nepal. Globalisation and climate change have
an increasing influence on the stability of fragile mountain ecosystems and the livelihoods of mountain people. ICIMOD
aims to assist mountain people to understand these changes, adapt to them, and make the most of new opportunities,
while addressing upstream-downstream issues. We support regional transboundary programmes through partnership with
regional partner institutions, facilitate the exchange of experience, and serve as a regional knowledge hub. We strengthen
networking among regional and global centres of excellence. Overall, we are working to develop an economically and
environmentally sound mountain ecosystem to improve the living standards of mountain populations and to sustain vital
ecosystem services for the billions of people living downstream – now, and for the future.
ICIMOD gratefully acknowledges the support of its core donors: the Governments of Afghanistan,
Australia, Austria, Bangladesh, Bhutan, China, India, Myanmar, Nepal, Norway, Pakistan,
Switzerland, and the United Kingdom.
Contact person: Nakul Chettri, [email protected]
About MONRECMinistry of Natural Resources and Environmental Conservation (MONREC), Myanmar, aims to conserve and protect natural resources of the country, to extract and utilize the country’s natural resources in a sustainable manner so that they can be inherited, and transferred from one generation to another, and to create harmony of environmental conservation and implementation of development projects in a balanced manner.
MONREC is comprised of two sectors: Mining and Environment & Forestry. The latter division oversees six separate institutions devoted to various natural resource concerns of the country.• Forest Department (FD) is responsible for protection and conservation of biodiversity and sustainable management of
the forest resources of the country, • Myanmar Timber Enterprise (MTE) is responsible for timber harvesting, milling, and downstream processing and
marketing of forest products.• Dry Zone Greening Department (DZGD) is responsible for reforestation of degraded forest lands, protection and
conservation of remaining natural forests, and restoration of the environment in the dry zones of the Central Myanmar.• Environmental Conservation Department (ECD) is responsible for the effective implementation of environmental
conservation and management.• Survey Department (SD) is responsible for producing topographical maps and project maps for the country. • The University of Forestry is responsible for providing students with academic principles and application methods in
forest science and for nurturing competent forestry professionals today and in the future.
The long-term goals of MONREC include three primary forestry sector reforms:1. To stop timber harvesting in 2016-2017 across the country;2. To stop timber harvesting in Bago Yoma Region (area of 1.5 million ha) for 10 years starting in 2016-17; and 3. To prevent the export of the confiscated timber, and prioritize biodiversity conservation throughout the country.

i
A Multi-dimensional Assessment of Ecosystems and Ecosystem Services at Inle Lake, Myanmar
International Centre for Integrated Mountain Development, Kathmandu, Nepal and
Forest Department, Ministry of Natural Resources and Environmental Conservation, Myanmar
July 2017
ICIMOD Working Paper 2017/17

ii
Copyright © 2017
International Centre for Integrated Mountain Development (ICIMOD)
All rights reserved, published 2017
Published by
International Centre for Integrated Mountain Development
GPO Box 3226, Kathmandu, Nepal
ISBN 978 92 9115 514 9 (printed) 978 92 9115 515 6 (electronic)
Production Team
Sushan Sellars-Shrestha (Consultant editors)
Christopher Butler (Editor)
Dharma R Maharjan (Layout and design)
Asha Kaji Thaku (Editorial assistant)
Photos: Nakul Chettri and Seema Karki
Printed and bound in Nepal byQuality Printers (Pvt.) Ltd., Kathmandu, Nepal
Reproduction
This publication may be reproduced in whole or in part and in any form for educational or non-profit purposes without special permission from the copyright holder, provided acknowledgement of the source is made. ICIMOD would appreciate receiving a copy of any publication that uses this publication as a source. No use of this publication may be made for resale or for any other commercial purpose whatsoever without prior permission in writing from ICIMOD.
The views and interpretations in this publication are those of the author(s). They are not attributable to ICIMOD and do not imply the expression of any opinion concerning the legal status of any country, territory, city or area of its authorities, or concerning the delimitation of its frontiers or boundaries, or the endorsement of any product.
Note
This publication is available in electronic form at www.icimod.org/himaldoc
Citation: ICIMOD and MONREC (2017) A multi-dimensional assessment of ecosystems and ecosystem services at Inle Lake, Myanmar. ICIMOD Working Paper 2017/17. Kathmandu: ICIMOD

iii
Contents
Contributors ivAcknowledgements vAcronyms and Abbreviations viExecutive Summary vii
Introduction 1 Research Objectives 2 Study Area 3
Research Framework and Methodology 5 Research Framework 5 Methodology 5
Results and Discussion 8 Socioeconomic Profile 8 State of the Ecosystems 11 Perceived Change in the Major Ecosystems 13 Land Use Land Cover Change 15 Ecosystem Services Assessment 17
Conclusion and Recommendations 29
References 31

iv
Contributors
Overall research designNakul Chettri, Kamal Aryal, Kabir Uddin, Pratikshya Kandel, Seema Karki and Bikash Sharma (ICIMOD) Sein Tun and Win Maung Aye (Forest Department, Myanmar)
CompilationSeema Karki, Aye Myat Thandar, Kabir Uddin, Sein Tun, Win Maung Aye, Kamal Aryal, Pratikshya Kandel, Bikash Sharma and Nakul Chettri
Ecosystem assessmentAye Myat Thandar, Seema Karki, Kamal Aryal, Bikash Sharma and Nakul Chettri (ICIMOD) Sein Tun and Win Maung Aye (Forest Department, Myanmar)
Livelihood assessmentAye Myat Thandar, Bikash Sharma, Kamal Aryal, Seema Karki, and Pratikshya Kandel (ICIMOD) Sein Tun and Win Maung Aye (Forest Department, Myanmar)
Geospatial analysisKabir Uddin, Seema Karki and Nakul Chettri (ICIMOD)

v
AcknowledgementsWe would like to express our gratitude to Dr David Molden, Director General of ICIMOD, for his inspiration and for providing the required facilities to conduct this assessment. We are also thankful to U Win Nang Thaw, Director, Nature and Wildlife Conservation Division, Forest Department, Ministry of Natural Resources and Environmental Conservation (MONREC) , Myanmar for his encouragement and support during the field work. We would like to thank the Inle Lake Wildlife Sanctuary Staff for their support and input. We express our sincere thanks to all of the local communities who help the survey team and took part in the interviews.
This publication was possible as a result of the untiring efforts of the team of professionals from ICIMOD and the Nature and Wildlife Conservation Division, Forest Department, Ministry of Natural Resources and Environmental Conservation, Myanmar as indicated in the contributor’s section. In addition, we acknowledge the financial support provided for this study by the European Union through the Himalica programme. We are also indebted to Dr Dhrupad Choudhury, Dr Surendra Raj Joshi, and Dr Abid Hussain of ICIMOD for their guidance and encouragements.
This document is prepared under the Support to Rural Livelihoods and Climate Change Adaptation in the Himalaya (Himalica) Programme (ASIE/2012/292-464) funded by the European Union.
We would also like to thank Dr Christopher Butler and Dr Philippus Wester for their valuable review and suggestions to strengthen the publication. Warm thanks goes to the editorial team Susan Sellars-Shrestha and Merrill Feitell (consultant editors) for bringing the manuscript to its present form. Thanks goes to Dharma Maharjan and Asha Kaji Thaku for their hard work in laying out the manuscript and for editorial assistance.

vi
Acronyms and AbbreviationsCR critically endangered
ha hectare
HH household
Himalica Rural Livelihoods and Climate Change Adaptation in the Himalaya
ICIMOD International Centre for Integrated Mountain Development
IUCN International Union for Conservation of Nature
km kilometre
km2 square kilometre
LULCC land use land cover change
MONREC Ministry of Natural Resources and Environmental Conservation
mm millimetre
NGOs non-governmental organizations
USD United States dollars
VU vulnerable
WCS wetland conservation strategy
WTP willingness to pay
Conversion factors:
Area conversion: 1 ha = 2.471 acre
Currency: 1 USD = 900 kyats (June 2015)

vii
Executive Summary One of the world’s Global 200 ecoregions and a freshwater biodiversity hotspot, Inle Lake is the in the top 10 most popular tourism destinations in Myanmar. The lake was formed 1.5 million years ago and is the second largest lake in Myanmar after Indawgyi. It is also a major source of hydropower for southern Myanmar. The remnant elongated lake is aligned on a north-south axis. Although the documentation of the flora and fauna of Inle Lake is limited, there are a number of records available from the early 20th Century and research interest has increased in the lake in recent years. The diverse fauna that inhabit the lake and its surrounding include species that are listed as critically endangered, vulnerable, or nearly threatened by the International Union for Conservation of Nature (IUCN). Many of the species of mammals and endemic fishes that inhabit the lake are listed in the IUCN red List. The lake is famous for its floating gardens, which are based on hydroponic cultivation. Plants from the families Gramineae and Cyperaceae, form tightly interwoven beds of running stems, roots, rhizomes, and hair-like roots, creating water mattresses that contain large blocks of rich organic soil. Major crops like tomatoes and beans are grown here hydroponically. The lake also supports livelihoods of fishermen (famous for their one-leg rowing technique), as well as numerous local businesses including tourism and agriculture.
These unique attributes and the favourable tourism policy promoted by the Government in 1996, have made Inle Lake a recognized hub for ecotourism. Every year, Inle receives a large number of visitors from different parts of Myanmar and the world. However, the lake is facing human induced degradation and the size of the wetland has been dramatically reduced over the past few decades. The increasing rate of lake degradation has increased the livelihood vulnerability of communities living in or near it.
Thus, to articulate communities’ perception of changes in the lake and the status of the ecosystem goods and services they are receiving, the International Centre for Integrated Mountain Development (ICIMOD), together with the Ministry of Natural Resources and Environmental Conservation, Myanmar, conducted an ecosystem services assessment, under the Rural Livelihoods and Climate Change Adaptation in the Himalaya (Himalica) initiative. Himalica is aimed at supporting poor and vulnerable mountain communities in the Hindu Kush Himalaya to mitigate and adapt to climate change impacts through collaborative action research and pilot activities in Myanmar.
The assessment was conducted in three village tracts, namely: Kyaung Taung (mountain area), Zay Gon (market area), and Kyar Taw (floating garden). These villages lie in and at the periphery of Inle Lake, near Nyaung Shwe Township in Shan State of Myanmar. The results from this study are expected to support future research, conservation, and development activities in Inle Lake. This report presents a synthesis of the findings, based on extensive literature review and analysis; land use land cover change (LULCC) analysis, participatory rural appraisal, and a household survey carried out in the three villages. A synopsis of the findings is presented below.
Socioeconomic Profile
For the study, 178 households were surveyed in three study sites: a floating garden (Kyar Taw village), mountain area (Kyaung Taung village), and market area (Zay Gon village). A sample group consisted of 56% men and 44% women. Family size in the three sites ranged from 1–8, with an average size of 4. Six cultural groups are represented: Taung Yo, Intha, Burma, Shan, Danu, and Pao, although all of the people living in the mountain village of Kyaung Taung are Taung Yo. Nearly all (about 98%) of the people living in the floating garden are Intha, which is the indigenous cultural group living in the lake area.
Agriculture, forestry, and fishing are the largest contributors to Myanmar’s economy. In the study area, local livelihoods are based on a combination of farming, wage labour, ecotourism, and small business. The main crops are tomato and paddy in the floating garden; cane, paddy, garlic, maize, and cauliflower in market area; and paddy, sesame pigeon pea and banana in the mountain area. As large number of tourists visit the floating gardens of Inle Lake, there is high consumption of meat and the demand is fulfilled by livestock rearing. Livestock include cows, buffalo, pigs, chicken, and fish. Stall feeding and open grazing (including a combination of both) are practised by the communities. Average annual income is more than USD 1,000 for 57% of the household with

viii
variations between the sites. The main sources of drinking water are springs, bores/wells, and wetlands. The average demand for drinking water is from 15–23 litres per day per household.
Importance of Ecosystem Services and Dependencies
Irrespective of their dependence on the three main ecosystems (forest, agro-ecosystems, and wetlands/freshwater), communities cite these ecosystems as very important. Although only 24% of households reported being dependent on forests for their sustenance livelihoods, 56% described the forest ecosystem as very important. Community forest law in the study area, which imposes restrictions on use and limits users’ rights, might have lowered the community’s dependency on forest.
About 78% of the households in the mountain area are dependent on agricultural production for their livelihood, compared to households in the floating garden (38%) and market area (28%). Floating garden communities gave agro-ecosystems more importance than communities in the other two sites. It appears that the mountain area is the major supplier of the agriculture products to the market as well as floating gardens.
For 74% of the households in the floating garden the importance they give to wetlands/freshwater ecosystems is proportional to their dependence on it. Dependencies on the lake include for hydroponic cultivation as well as for the need to maintain certain water level for rowing boats for transportation and to clean the lake.
Land Use Land Cover Change
Inle Lake experienced major land use land cover changes (LULCC) from 1989–2014. Cropland in particular has invaded more of the lake area. Cropland area has increased from 60.67% in 2000 to 64.53% in 2014. Wetland has been reduced dramatically, from 3.01% in 1989 to only 0.94% in 2014. The other significant change is a initial increase in forest cover by 23 km2 during 1989 to 2000 and sharp reduction by 115 km2 during 2001 to 2014.
Community Perceptions of Drivers on Change and Their Impact
Around 95% of households said that the forest ecosystem has decreased over the last 10 years. Communities claim that almost no forest is left in the Kyaung Taung village; this also corresponds with Forest Department Statistics of 1998, which state that out of 343,587 km2 of natural forests, 37.4% has been deforested. Fuelwood extraction, illegal logging, charcoal making, shifting cultivation, the extension of agricultural land, population growth (with repercussions for demand for fuelwood), and infrastructure development are primary contributors to forest degradation.
An elasticity between increases and decreases in the agro-ecosystem is due to forest land, which has been converted into agricultural land. Such activities in relation to population growth demand more land and irrigated water for farming. This ultimately leads to less availability of water for irrigation resulting to less productivity.
About 63% of the households experienced a huge reduction in the availability of freshwater ecosystem goods and services. Lwin and Sharma (2012) have identified five major issues that have reduced water availability and water quality in the Inle lake area: 1) houses built inside the lake with poor sanitation and improper management of waste, 2) livestock breeding as a source of garbage and sewage, 3) industries which directly or indirectly discharge waste and effluent into the lake, 4) shrinkage of open lake water area, deforestation, and 5) intense agricultural practices in the catchment, which have added silt and nutrients to the shallow lake.
Ecosystem Services Assessment
Based on the survey results, the communities obtain 19 provisioning services from forests, 15 from agro-ecosystems, 6 from freshwater, and 12 from wetlands. Similarly, households identified 15 regulating, 4 supporting, and 6 cultural services from forest, agro, freshwater, and wetland ecosystems respectively. Despite increased deforestation and degradation, forests still supply fuelwood to mountain areas. Floating garden communities are distant forest users. Only 7% of the households in the floating garden and 8% in the market area consume fuelwood from the forest. It

ix
was also observed that the floating garden and market area communities derive some forest products, they require, from agro-ecosystems and the wetland ecosystem. The agro-ecosystem seems very productive in mountain areas, with 93% of households cultivating vegetables and 87% cultivating paddy. The market area study site is also on the higher side for vegetable production. On the other hand, the freshwater ecosystem contributes to drinking water supply (93%), water for bathing (61%), water for irrigation (6%), and sand/boulder (3%) collection.
Socio-cultural Value of Ecosystems and Their Services
From the forest ecosystem households perceive the following species as carrying high socio-cultural value: teak (Tectona grandis), bamboo species (Bambusa polymorpha; Dendrocalmus strictus), Indian English gurjuntree (Dipterocarpus tuberculatus), pine tree (Pinus spp.), gangaw tree (Mesua ferrea), yinma (Chukrasia tabularis), Burma cedar (Cedrela toona), eucalyptus spp. from. These forest products are mainly used for construction purposes. D. tuberculatus is listed as a threatened species on IUCN’s red list. Wetlands and freshwater are home to numerous crabs, birds, and fishes, among other species. About 40% of the households mentioned crabs as very important, as they are used in the Intha’s festival. One of the bird species is also considered valuable as symbolic of Inle Lake’s beauty. The community living around the lake mentioned this species as having socio-ecological value and wished to see these birds protected from extinction. Swamp eel (Chaudhuria caudate), which are exported to China, are important to the economic wellbeing of households and carry high social value. About 79% of the households said that the famous pagodas of Paung Daw Oo Pagoda and Alo Daw Pauk Pagoda carry high cultural value and must be visited once a year.
Willingness to Pay
About 96% of the households surveyed said that they are willing to pay (in cash or kind) for a fully managed ecosystem, if they are ensured a flow of ecosystem goods and services on a continuous basis. The amount households were willing to pay ranges from USD 5 to USD 20 per year per household; if in kind, households said they would devote 12 to 36 days of labour per year.
Livelihood Vulnerability Assessment
On average, 65% of households have enough food sufficient for a year. Around 25 household reported experiencing food deficits with food sufficient for less than 3 months a year. Among the three study sites, the mountain area was more food secure, with 98% of households having adequate food for more than a year. Illness, accident, death of a household member, and degradation of natural resources are the major vulnerability indicators.
Long-term Changes in Wellbeing Indicators
Over the past decade, the study area has experienced changes in socioeconomic wellbeing indicators. Unlike other South Asian countries the study area has no out migration. This has two major impacts: firstly, more job opportunities are created and there is a high demand for labour. This has a direct influence on the purchasing power of individuals. Secondly, the study area does not receive any remittances. An increase in the number of health clinics has improved health condition, however, services are limited. Additional improved social indicators include an increase in availability public transportation, improved communication facilities (especially mobile phones), improved food security, and improved decision-making approaches. Conversely, forest cover, access to forests, the availability/quality of water, and soil fertility have deteriorated.


1
IntroductionOne of the world’s Global 200 ecoregions (Olson and Dinerstein 1998) and a freshwater biodiversity hotspot (Groombridge and Jenkins 1998), Inle Lake is the 10th most popular tourism destination in Myanmar (MoHT 2013; Thaw 2001). Although documentation of the flora and fauna of Inle is limited, the lake has been explored by many researchers, as early as the early 20th Century (Annandale 1918a, b, c; Kemp 1918, Stephenson 1918; Oka 1922; Thant 1968). The research and documentation has increased in recent decades (Bruneau and Bernot, 1972; Oo 1995; Su and Jassby 2000; Furuichi 2005; Furuichi and Wasson 2011; Htwe et al. 2015). The lake is inhabited by diverse fauna, some of which are listed by International Union for Conservation of Nature (IUCN) as critically endangered, vulnerable, or nearly threatened species (Kottelat and Witte 1999; Platt and Rainwater 2004). Many of the mammals and endemic fishes that inhabit the lake are listed in the IUCN Red List (Ng et al. 1999; Roberts 1986). More interestingly, the lake is famous for its water gardens, which are based on hydroponic cultivation (Akaishi et al. 2006). These tightly interwoven beds of running stems, roots, rhizomes, and hair-like roots of the families Gramineae and Cyperaceaa form water mattresses that contain large blocks of rich organic soil (Myint and Maung 2000, Than 2007). Major crops like tomatoes and beans are grown here hydroponically. The lake also supports livelihood of fishermen (famous for their one-leg rowing technique) and numerous other businesses including tourism and agriculture.
Formed more than 1.5 million years ago (Bertrand and Rangin, 2003), Inle Lake is a remnant lake from a much more extensive series of lakes, which included the former Heho Lake upstream (Okamoto 2012). As indicated by the earlier records, the lake has provided tangible and intangible ecosystem services to the communities living on Inle Lake and its periphery (Ma 1996). The Millennium Ecosystem Assessment (MA 2003) categorizes these tangible and intangible ecosystem services as provisioning, supporting, regulating, and cultural services. The elongated shape of the lake is approximately aligned on a north-south axis, and the north and south ends taper to a relatively narrow breadth (Su and Jassby 2000). This elongated alignment of the lake regulates the flow and supports the natural filtration of the water, providing freshwater as one of its provisioning services (Thaw 1998). It is the second-largest lake in Myanmar, lying at an average altitude of 880 meters above sea level (Su and Jassby 2000; Turner et al. 2000; Butkus and Myint 2001; Akaishi et al. 2006), and it is a major source of hydroelectric power for southern Myanmar (Su and Jassby 2000).
Designated as a the freshwater biodiversity hotspot, it has 53 bird species and 36 fish species, including 16 endemic species, 4 threatened bird species, and 5 threatened mammal species (Ma 1996; Lwin and Sharma 2012). Home to worldwide threatened species like the white-rumped vulture (Gyps bengalensis), greater spotted eagle (Clanga clanga), pallid harrier (Circus macrourus), bare’s pochard (Aythya baeri), sarus crane (Grus antigone), and ferruginous pochard (Aythya nyroca) (Su and Jassby 2000), the lake is a large bird sanctuary, an important breeding ground for fishes, and a nesting and breeding habitat for birds and amphibians (Ma 1967; Thant 1968; Kottelat 1986; Clarke 1999; Su and Jassby 2000). It hosts Red Data Book listed mammals and endemic fishes (Butkus and Myint 2001), luxuriant submerged plants, and floating leafed macro-phytes on the surface covering much of the lake (Akaishi et al. 2006). Thus, the Inle lake is the repository of biodiversity with a productive ecosystem essential for the sustenance of infinite species including human being.
Although being one of the most important freshwater ecosystems of Myanmar, it is not free from anthropogenic pressure. The local communities living in the area are highly dependent on the lake ecosystem and its services (Ma 1996). In recent years, the lake has witnessed an increase in tourism pressure, bringing additional management challenges to the sanctuary (Sett and Liu 2014). Due to various drivers of change, the water surface area of the lake has shrunk (Sidle et al. 2007); with noticeable pollution (Ma 1996) and sedimentation (Su and Jassby 2000). The intensive cropping practices in the surrounding catchments have also changed the forest cover and other land cover types; agricultural land and floating gardens have significantly increased (Thiha 2001; Htwe et al. 2015). However, there is a lack of understanding of the root causes driving change and the impacts on the ecosystems of the sanctuary. This joint publication, based on both primary and secondary information, is an attempt to fill this gap and provide comprehensive understanding as discussed in the following sections.

2
Research Objectives
Myanmar in general is poorly researched country compared to other countries in the eastern Himalaya. However, as understanding the linkages between ecosystems services (ES) and human wellbeing is emerging as a global priority, it is also becoming a priority research area in Myanmar (Cardinale et al. 2011; Chaudhary et al. 2015). Ecosystem services are also considered products of coupled and nested socio-ecological systems and they should be measured in the complex context of those socio-ecological systems (Fisher et al. 2009; Millennium Ecosystem Assessment 2005; Reyers et al. 2013). Although there is an explicit focus on steering human behaviour toward a more sustainable path, the ES concept has, to date, largely come from the ecological and economic sciences (Balvanera et al. 2006; Mace et al. 2011; Bateman et al. 2013) and lacked integration with the broader social science literature about people’s choices and behaviour (Bryan et al. 2010; Milner-Gulland 2012). In response, the Millennium Ecosystem Assessment (2005) endorsed an ES approach that explicitly recognizes the benefits people gain from nature. By describing how nature benefits people, the ES approach aims to align environmental sustainability with human wellbeing, thus building support for conservation and sustainable resource management (Daw et al. 2011; Hicks et al. 2015). ES also depend on the interactions with and feedback from multiple social and ecological factors (Scholes et al. 2013). However, understanding of the linkages between ecological and social sciences is limited (Castro et al. 2014). Therefore, ES assessments and the sustainable management of ES require an understanding of both supply and demand, considering the qualities, quantities, spatial scales, and dynamics forming a bridge between ecological and social systems (Nahlik et al. 2012).
With this rationale, the International Centre for Integrated Mountain Development (ICIMOD), an intergovernmental regional knowledge-enabling centre with support from MoNREC conducted an ‘Ecosystem Services Assessment’ under its Rural Livelihoods and Climate Change Adaptation in the Himalaya (Himalica) project in Inle Lake, Myanmar. The Himalica initiative is aimed at supporting poor and vulnerable mountain communities in the Hindu Kush Himalaya to mitigate and adapt to climate change impacts through collaborative action, research, and pilot
3
activities in Myanmar. This research is expected to help build the capacity of institutions working on resilience to climate-induced vulnerability, which will subsequently improve the livelihoods of mountain communities in the Hindu Kush Himalaya. Adaptive capacity can only be attained when the value of the ecosystem services provided by mountain communities to those downstream is understood, recognized, and maintained.
Thus, the findings of this study are expected to support the management of the Inle Lake conservation area, which aims to develop good practices for supporting the livelihoods of the communities in the area through integrated natural resource management. The field work was carried out in consultation with and support from the Forest Department under the MONREC. Given the objective to understand the state and dynamics of the ecosystems in the area, the specific objectives of the study were to:
� Assess the major ecosystems and examine people’s dependency on the goods and services derived from these ecosystems;
� Assess the perception of the communities, how they value these ecosystems and their services; � Detect the spatio-temporal changes in ecosystem services over the time using remote sensing and geographic
information system (GIS) tools; � Assess communities’ coping strategies to drivers of change affecting these ecosystem services; � Recommend strategies for mainstreaming knowledge into conservation and adaptation planning and
development efforts to help maintain the carrying capacity of these ecosystem goods and services; and � Foster cooperation, partnerships, and networking among the different stakeholders through cross learning and
the sharing of issues and underlying solutions.
Study Area
Inle Lake is situated on the Shan plateau and the lake basin is part of the Shwenyaung rift valley. The north and south parts of the basin are relatively flat, whereas mountain ranges lie to the east and west of the lake (Figure 1). The eastern part of the basin accounts for only 10% of the catchment area, the western part 53%, and the northern part the remaining 37% (Ma 1996). A total of 17 streams cut through the mountains and flow into the lake from the east, 12 from the west, but only 1 from the north, the Nanlit Chaung. This river flows by the main town of Nyaungshwe, about 2 km from the lake itself, and has only one outlet, the Nam Pilu (Su and Jassby 2000). The study area (Figure 1) is the catchment of Nyaungshwe watershed. Over 200 villages surround the lake in the immediate watershed (Butkus and Myint 2001). The watershed serves the Nyaungshwe Township (Akaishi et al. 2006; Lwin and Sharma 2012).
To address the objectives, three representative sites were identified in the watershed for study: Kyar Taw village (a floating garden), Kyaung Taung village (in the mountain area), and Zay Gon village (in the market area) (see Figure 1). There are around 527 houses in study area (Table 1). Floating gardens, which were introduced in the early 1960s, consist of large blocks of organic rich soil of low bulk and density on which major crops like tomatoes, beans, and potatoes are grown (Sidle et al. 2007). Around 173 households live in the Kyar Taw floating garden. The houses are built on water and people perform their daily activities on the floating garden. Their livelihood mainly depends on fishing and the cultivation of tomatoes, beans, and potatoes. Because of its unique characteristics, Inle Lake has been promoted by the government’s tourism policy since 1996 (Butkus and Myint 2001) and is recognized as a major tourist hub (MoHT 2013). In recent years, increased tourism has influenced the livelihood of the floating garden. This has also led to an increase in the number of hotels surrounding Inle Lake. Thus, provisioning services (freshwater, fisheries, and floating garden farming) and ecotourism are the major ecosystem services provided by Inle Lake to the people living in this floating garden.
The market area is inhabited by around 168 households. The livelihood of the people living in this area depends largely on the trading of agricultural produce, forest products, and livestock. The population includes local traders who bring vegetables and other commodities either from their own land/villages or who supply those services from other villages. The consumers are the inhabitants of the floating garden and its surroundings. Since the people in market area mostly rely on distant ecosystem goods and services, changes in the flow of ecosystem goods and services in other villages may affect the market scenario and impact the livelihood of the people in the market area. Boats are the only means of transportation on the Lake.

4
Around 186 households live in the mountain area and are mostly engaged in agricultural farming and livestock rearing. The main source of energy is fuelwood, hence, people in the mountain area rely heavily on the forest ecosystem. In addition, the forest provides grazing and fodder for livestock. With no access to irrigation facilities (as the area lies upstream from Inle Lake), rain-fed cultivation is dominant. Some of the households sell their agricultural products to downstream communities in the market area and floating garden, and sometimes they take their products up to Heho market (the capital of the state).
Figure 1: Map showing the Inle Lake conservation area, Shan state, Myanmar

5
Research Framework and Methodology
Research Framework
Modelling, qualitative, and quantitative analytical approaches are being widely used to understand and describe the stocks, demands, and flows of ecosystem services on different spatial and temporal scales (DeGroot et al. 2010; Müller et al. 2010). Such approaches provide insight into the actual supply of ecosystem services based on biodiversity and ecological functions (Balvanera et al. 2006). These elements, in combination with information and data on ecosystem service use pattern (demand), their actual rates of consumption, and how these components are inter-connected (flows and trade-offs), form the basis of a full ecosystem service analysis (Castro et al. 2014). Moreover, in recent years, ecosystem services have been strongly linked with conservation and poverty alleviation (Castro et al. 2014; Fisher et al. 2014). Considering these recent developments, an ‘Ecosystem Services Cascade’ framework (Figure 2) was adopted, which enabled the study to rationalize the strong linkage and importance of ecosystem services to people’s livelihoods through ecosystem services provision supporting human wellbeing.
Methodology
The assessment consists of both primary and secondary data including a household survey, geospatial analysis, participatory rural appraisal tools including, focus group discussions, resource mapping, transect walks, and a
Figure 2: A conceptual research framework for ecosystem assessment linked to impact pathways
Source: Modified from DeGroot et al., 2010 and Müller et al., 2010
Management of Socioecological System
Management of socioecological system
Human wellbeing
Biophysical structure or process• Major ecosystems• Dominant vegetation• Phytodiversity• Biodiversity• State of key species
Functions*
• Nutrient flow• Water flow• Productivity• Pollination• Habitat
Value• Social• Ecological• Economic• Tradeoff
options (e.g., REDD+, PES)
Benefits• Economic
development• Health• Recreational• Environmental
Provisioning
Supporting
Regulating
Culture
Knowledge enhancement, capacity development policy briefs and mainstreaming mechanisms
RESEARCH FRAMEWORK

6
review of the relevant literature. To identify the spatio-temporal changes in the ecosystems and its services, land use land cover change (LULCC) analysis was performed. The results derived from the LULCC were then compared with the results of the household survey. A combined map of LULCC and data from the household survey was then made for the periods 1989–2000 and 2000–2014.
Household surveyA systemic stratified sampling approach was used for the household survey. Stratification was done according to the origin of the wetland as upstream, middle stream, or downstream. Following the stratification, based on the livelihood and community dependency on services derived from ecosystem, three study sites were selected: the floating garden of Kyar Taw (latitude 20.4493°; longitude 96.9146°), the market area of Zay Gon (latitude 20.4657°; longitude 96.9038°), and the mountain area of Kyaung Taung (latitude 20.6568°; longitude 96.8636°). These sites are comprised of 173, 168, and 186 households, respectively. About 33% of total households (178 households) were selected for the household survey. The sampling size for the household survey is presented in Table 1.
Pre-orientation on questionnaire survey
The enumerators and researchers engaged in the study were invited to an orientation training (theory and field exercises) prior to the survey. The training consisted of a one-day theory session covering the objective of the study, the ecosystem and its services, and how to apply participatory rural appraisal tools, followed by field exercises to pre-test the questionnaire (Chettri et al. 2014; Karki et al. 2014). The questionnaires were designed based on the framework and the objectives set for this assessment following Castro et al. (2014). The enumerators and researchers pre tested it in the study sites to contextualize the local needs.
Land use land cover change (LULCC) analysis For the LULCC analysis, efforts were made to map the study area using three different time series images from 1989, 2000, and 2014 (Table 2). The idea was to detect the change in, and status of, land use cover and the changes that have taken place, particularly in forested and agricultural land, over the period using both GIS and RS data. Subsequently, an attempt was made to project the use of the identified ecosystem services in the area over the same period. Medium spatial resolution satellite images from Landsat were used from 1989, 2000, and 2014 and further rectified using Google eye images from 2014 to generate the land cover maps. The land use categorization was defined using the standard land cover protocol. The land cover information derived consisted of pre-processing and classification using object-based algorithms.
In this study, Landsat 30 m spatial resolution (185 x 185 km swath) ortho-rectified and cloud free thematic mapper (TM) and Landsat 8 images were used for land cover mapping and change detection between 1989, 2000, and 2014. All images were downloaded from the United States Geological Survey (USGS) archived data portal. The shuttle radar topography mission (SRTM) one arc second (30 m) digital elevation model (DEM) with add on products such as slope and aspect, was used for the topographic information as well as identification and mapping difference in land cover classes. Base layers with district, physiographic and settlement points in geographic information system (GIS) format were used both as baseline information for the maps and land cover extraction and analysis.
Land cover maps for 1989, 2000, and 2014 were prepared from analysis of the Landsat TM, ETM+, and Landsat 8 images using geographic object-based image analysis (GEOBIA). The detailed methodology used to prepare the
Table 1: Description of sampling area for household survey
Upstreammountain area
Middle streammarket area
Downstreamfloating garden
Total
Village track Lat Maung Kwe Nan Pan Nan Pan –
Village name Kyaung Taung Zay Gon Kyar Taw –
Total households 186 168 173 527
Sample size 58 60 60 178
Table 2: Landsat satellite imagery data source for three different time series
Satellite Sensor Row Path Year
Landsat
Landsat 8
138 41
2014
TM 2000
TM 1989

7
land cover maps is described in (Uddin et al., 2015). Briefly, eCognition Developer software was used to divide the image into segments. A multi-resolution segmentation algorithm was applied in which homogeneous areas resulted in larger objects and heterogeneous areas in smaller ones. Information on the spectral values of image layers, vegetation indices Normalized Difference Vegetation Index (NDVI), and a land water mask was used in the analysis. Six land cover classes were mapped for the comparison and further analysis on ecosystem service.
Following Chaudhary et al. (2016) in ArcGIS environment, the land cover was analysed and interconnected based on the sum scores for provisioning, regulating, supporting, and cultural services. Values were obtained from the SPSS data generated after the completion of the household survey, in which the households shared their routine resource dependency on, and usage of, the various services drawn from the different ecosystems. A hierarchical classification scheme was used with six major land classes. The results derived from the LULCC were then integrated with the results of the household survey.
Data analysis The surveyed questionnaires were coded, cross-checked, and cleaned where necessary. Household survey data were entered into a data-entry mask designed using the SPSS Statistics software package 16.0 version. After entering the data, plausibility checks were performed to control entry errors and inconsistencies. Analysis was carried out using the basic descriptive statistics, cross tabulation, and comparison of means. Considering the limitations on methodological approach and objective of the study, the economic valuation for ecosystems services could not be assessed. However, information derived from participatory rural appraisal and HH survey results estimated a requirement of 10 - 23 litres of drinking water per household per day (excluding livestock). Thus, using direct cost, an annual economic value of freshwater for surveyed households were estimate and through willingness to pay method other values were extrapolated following Sharma et al. (2015).

8
Results and Discussion
Socioeconomic Profile
In total, 178 households were surveyed: 58 in the floating garden, 60 in the market area, and 60 in the mountain area. Of the survey participants, 56% were male and 44% were female. The average family size in the three sites was 4 (ranging from 1 to 8). The floating garden and market area had the same average family size, but the average family size in the mountain area was three. Among the six different castes (Taung Yo, Intha, Burma, Shan, Danu, and Pao), 100% of the mountain communities are Taung Yo; 98% of the people in the floating garden are Intha (which denotes people living in the lake), and the market area consisted of Intha (47%), Burma (45%), and a small number of Shan, Danu, and Pao ethnic groups.
There is a 49% literacy rate in the study area population (Table 3). Considering the primary education the mountain area has the highest literacy rate (10%). Among three sites, the young age group from the floating garden and the mountain area dominated the primary education pyramid. The market area is occupied by more educated secondary (7%) and graduate (3%) communities compared to the mountain area. The accessibility, education infrastructure and the financial sources through business could be the reason for high level of education in the market area. The major religion in Myanmar is Buddhism (Bischoff 1995) and 89% of the population are Buddhist (Hadden 2008). Hence, monastery education is also common in the study area with 10% of the surveyed population reporting a monastery education.
Livelihood practices Agriculture, forestry, and fishing are the largest contributors to Burma’s economy (Hadden 2008). In the study area, local livelihoods are based on a combination of farming, wage labour/petty business, ecotourism (hotel business, tours, boat driving), and small shops (Figure 3). In the mountain area, wage labour (45%) and farming (42%) are the primary contributors to livelihood. As the market area and floating garden are trading and ecotourism zones, petty business (25% in the market area and 14% in floating garden) remain dominant in these areas (Figure 3).
Inle Lake is an integral part of the local community’s livelihood, as it is dependent on fisheries and floating garden hydroponics agriculture (Su and Jassby 2000; Butkus and Myint 2001; Than 2007). Since the Government of Myanmar’s drive to promote tourism in 1996 (Butkus and Myint 2001), the lake has become a major tourist hub. The area has also experienced the construction of infrastructure (e.g. hotels, roads, flights) which has led to increased tourism (Thin 2014). Other income sources contributed 22% to total household income and include: owning a hotel, wholesale trading/shopkeeping, boat driving, fishing, and tour guiding. It is remarkable that only five percent of the households are salaried employees. It is also of note that only a few households in the floating garden area cited fishery work as their occupation. Households explained that the decreasing number of
Table 3: Literacy rate in three sites
Level of education Floating garden
Market area
Mountain area
Total %
Primary 9 4 10 24
Secondary 5 7 0 12
Graduate 1 3 0 3
Monastery education 1 7 2 10
Total 16 21 12 49
0
5
10
15
20
25
30
35
40
45
50
Wag
ela
bour
Stud
ying
Sala
ried
empl
oyee
Petty
busi
ness HH
activ
ity
Fish
ery
Farm
ing
Oth
ers
Hou
seho
lds
perc
ent
Floating garden Market area Mountain area
Figure 3: Main livelihood sources reported by households

9
fish in Inle Lake has caused them to move into other occupations.
The people around Inle Lake live off the lowland paddy fields and floating gardens (farming) while the inhabitants of the mountain range practice on-land cultivation and rotational upland farming along the steep slopes on both sides of the lake. Rain-fed, fallow land, floating garden, and home garden cultivation prevail in the surveyed area. In the mountain area, 96% of the land falls under less than 2 ha of rainfed fallow category, whereas market area and floating garden is dominated by fallow land category. Myanmar’s economic development is based on agriculture (Hossain and Marlar 1995) and, despite strategies adopted by the Ministry of Agriculture and Irrigation to increase crop production through the construction of dams and expansion of irrigational canals (MAS 1997), Myanmar has showed only a modest increase in irrigated arable land (Garcia et al. 2000; Egashira and Than 2006). Since then, irrigation facilities do not seem to have improved much in Myanmar. About 5% of the households surveyed in the floating garden area own less than 2 ha of land. In addition, 57% of households in the floating garden area and 50% in the market area farm on fallow land. Home gardening is also practised in the mountain area, but not in the other two study sites (Figure 4). Vegetables are grown for home consumption and as a cash crop sold in the markets of Heho or Nyaung Shwe (Khaing 2014). During the household survey in the mountain area, dry land and rainwater tanks were observed, which indicates that mountain communities receive limited rainwater.
Paddy, sesame, pigeon pea, tomato, cane, garlic, maize, and cauliflower are major crops cultivated in the study sites. Tomato and paddy are mainly grown in the floating garden area, with aquaculture being practised to a lesser extent. In the early 1990s, the transition to a market economy expanded tomato cultivation in the floating garden area (Okamoto 2012). Tomato is now the primary cash crop produced by the floating gardens (Su and Jassby 2000). Although the market area is mainly a trading zone, sugarcane, paddy, garlic, maize, and cauliflower are grown here either to sell or for personal consumption. In the mountain area, paddy, sesame, pigeon pea, and banana are the main crops cultivated (Table 4).
On average, 51% of households rear livestock. However, the number of households rearing livestock varies: 62% in the floating garden area; 50% in the mountain area; and 40% in the market area (Figure 5). The high consumption of meat products could be the reason for the high percentage of households rearing livestock in the floating garden area. The floating garden site has a diverse array of livestock, including cattle, pigs, and poultry. In all three sites, pigs were the most common type of livestock kept though they vary between the studies areas with the highest observed in floating garden with 39% of the total recorded (Table 5). Not surprisingly, the floating garden area had the highest number of households keeping fish and there was no significant change compared to five years ago. In the mountain area, the number of households keeping
0 20 40 60 80 100 120
Floatinggarden
Marketarea
Mountainarea
Land holding %
Stud
y ar
ea
Home garden < 2 ha
Floating garden < 2 ha
Rainfed fallow land 2-5 haRainfed fallow land < 2 ha
Fallow land 2-5 haFallow land < 2 ha
Figure 4: Agricultural land types
Table 4: List of major agricultural products in each of the study areas
Floating garden
Market area Mountain area
Major crop
Tomato Cane Paddy
Paddy Paddy Sesame
Garlic Pigeon pea
Maize Banana
Cauliflower
62
40
50 51
0
10
20
30
40
50
60
70
Floating garden Market area Mountain area Total
Figure 5: Percentage of households rearing livestock

10
cattle has dropped in the past five years, however, the number of buffalo rearing households has increased (by 14%) in the same period. The number of households keeping pigs has also increased in both mountain and market areas (Table 5). The main reasons cited for these changes in livestock is both through sale (reduced number) or breeding (increased number). Disease or climate-induced stress were not factors in changes in livestock rearing.
All of the households in the floating garden area and the market area practise stall feeding. In the mountain area, most households (67%) practise both stall feeding and open grazing. Only 13% of households in the mountain area practise open grazing (Figure 6). Cattle and buffalo are usually fed by open grazing, whereas pigs, poultry, and fish are stall fed.
Income distribution On average, 57% of households in the study sites have annual income of more than USD 1,000 (74%, 70%, and 28% in the floating garden, market area, and mountain area, respectively). In addition, 67% of households have annual income of USD 501–1,000, which is the lowest annual income for households in the floating garden (reported by 26%).
Only 8% of households in market area and 5% of households in the mountain area reported earning less than USD 500 per annum (Table 6).
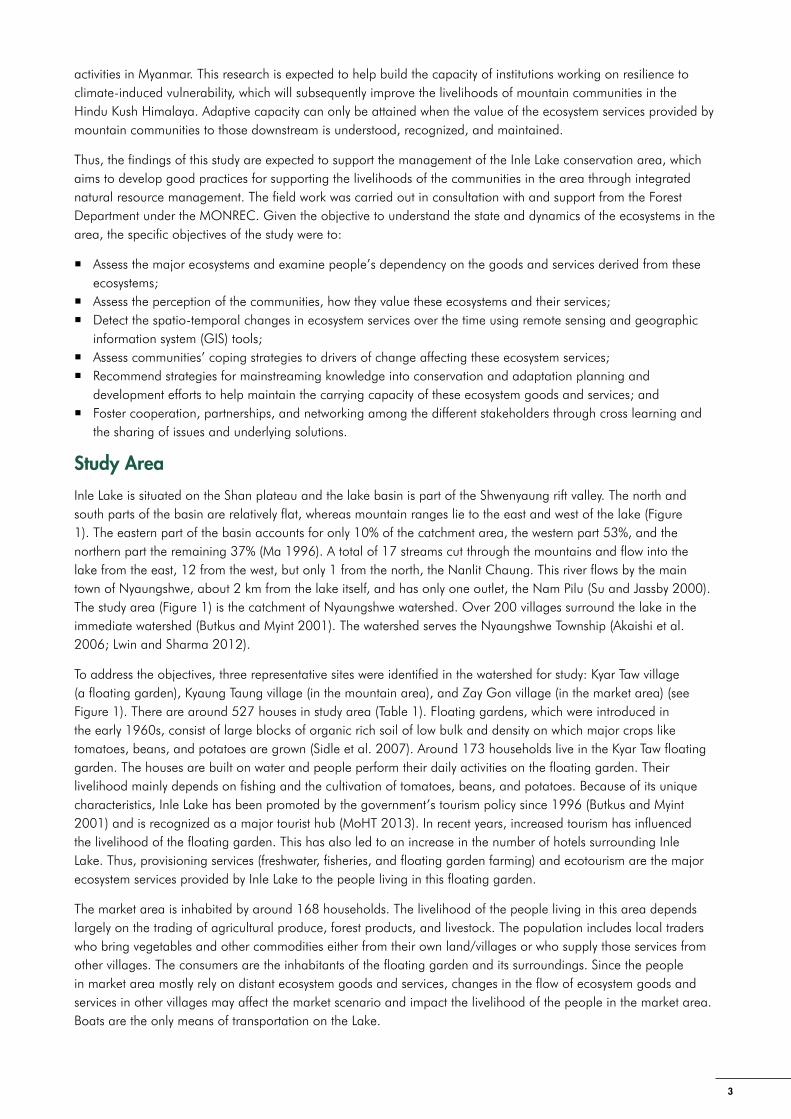
Sources of drinking waterThe main sources of drinking water are springs, bores/wells, and wetlands. The average quantity of drinking water used ranges from 15–23 litres per day (Figure 7). About 85% of households
0
20
40
60
80
100
Floating garden Market area Mountain area
Hou
seho
lds
perc
eent
Study sites
Grazing & stall fed Stall fed only Grazing only
Figure 6: Livestock feeding practices
Table 6: Income distribution of households
Average household
cash income per year (USD)
Floating garden
Market area
Mountain area
Total
1–500 0 (0%) 5 (8%) 3 (5%) 8 (5%)
501–1,000 15 (26%) 13 (22%) 40 (67%) 68 (38%)
>1,001 43 (74%) 42 (70%) 17 (28%) 102 (57%)
Total 58 (100%) 60 (100%) 60 (100%) 178 (100%)
Table 5: Comparative assessment of livestock rearing
Livestock Number of livestock kept
Households rearing livestock (%)
Floating garden Market area Mountain area
Present Last 5 years* Present Last 5 years Present Last 5 years
Cattle 1–5 3 0 13 4 3 10
Buffalo 1–5 0 0 0 0 83 73
Pigs
1–5 67 28 79 58 20 17
5–10 0 0 0 0 0 0
10–15 0 0 8 13 0 0
Poultry
1–25 6 0 25 8 0 0
25–50 0 0 0 13 0 0
>50 0 0 4 4 0 0
Fish
1–500 28 8 0 0 0 0
500–1,000 11 11 0 0 0 0
1,000–1,500 0 6 0 0 0 0
1,500–2,000 3 3 0 0 0 0
* average of last 5 year
11
in the floating garden depend on spring water and 65% of those in the market area depend on bore/well water. However, in the mountain area, 100% of households rely on rainwater-harvesting technology that has been installed in the area by the United Nations Development Programme (including a 5,000 gallon nominal capacity community tank, a community pond, and household-level rainwater harvesting systems) (Poole 2014). Other sources (8%) of water include purified drinking water which is purchased from the market or collected from stored tank of Myang Kun Monastery in Shwe Kyun Myau.
State of the Ecosystems
Importance and dependency on major ecosystemsThree major ecosystems – forest, agro-ecosystem, and wetland/freshwater – were identified during participatory rural appraisal exercises. Regardless of their dependency, during the survey, households were asked whether or not they consider these ecosystems important. Importance was categorized as: very important, important, moderately important, less important, or not important. Similarly, dependency was ranked: very dependent, dependent, moderately dependent, less dependent, or not dependent.
Forest ecosystemAbout 55% of households from mountain communities consider the forest ecosystem to be very important and 35% of households consider themselves to be very dependent on goods and services from the forest ecosystem (Figure 8). In the market communities, 63% of households consider forest ecosystems of very high importance and 27% consider themselves to be very dependent on them. Most households from the floating garden also reported the forest ecosystem as very important (55%), but only 10% considered themselves very dependent on it (38%
010
2030
4050
6070
8090
100
1-5
Lt
5.1-
10 L
t
15.1
Lt
22.7
Lt
Tota
l
1-5
Lt
5.1-
10 L
t
10.1
-15
Lt
15.1
-20
Lt
>20
Lt
Tota
l
1-5
Lt
Tota
l
1-5
Lt
5-10
Lt
10-1
5 Lt
15-2
0 Lt
> 20
Lt
Tota
l
Hou
seho
lds
perc
ent
Amount in litres
Floating garden Market area Mountain area
Harvested rainwaterWet-landBore/WellSpring Wetland
Figure 7: Main sources of drinking water

12
considered themselves less dependent). In the mountain area, some community forest land has been designated and community forest law provides rights and restriction on land use (Khaing 2014). Such laws may influence household dependency on the forest ecosystem.
Agro-ecosystemAbout 78% of households in the mountain area depend heavily on the agro-ecosystem (Figure 9), whereas 38% households reported low dependency in the floating garden area and moderate dependency (27%) in the market area. Households also reported the agro-ecosystem important for subsistent livelihoods. Despite less dependency on agro-ecosystems, households from the floating garden (36%) and market area (33%) considered agro-ecosystems to be very important. The reason might be that agricultural production from mountain areas are the source for those products consumed in the market area and floating garden. Shifting agriculture, fallow land, and floating garden farming, together with the conversion of lower slopes into agriculture land along the northwest side of the lake, are practised in and around Inle Lake (Sidle et al. 2007).
Wetland/freshwater ecosystemWetlands are formed by the interaction between the terrestrial system and the aquatic system and are among the world’s most productive environments. They are repositories of biological diversity and very fragile (Mitsch and Gosselink 2000; TEEB 2010). They provide water for agricultural productivity (Khan 2000), as well as ecosystem goods and services that are essential for the sustenance of an infinite number of species. Wetlands include hydrological, biogeochemical, and ecological functions — and it is the interconnectedness of their physical, biological, and chemical components (such as soils, water, plants, and animals) that enable wetlands to perform several vital functions (Richardson 1994; Khan 2000).
0
10
20
30
40
50
60
70
Not
impo
rtant
Less
impo
rtant
Mod
erat
ely
impo
rtant
Impo
rtant
Very
impo
rtant
Not
Dep
ende
nt
Less
dep
ende
nt
Mod
erat
ely
Dep
ende
nt
Dep
ende
nt
Very
Dep
ende
nt
Importance of forest ecosystem Dependence on forest ecosystem
Floating garden Market area Mountain area
Hou
seho
ld p
erce
ntFigure 8: Importance and dependency on forest ecosystem

13
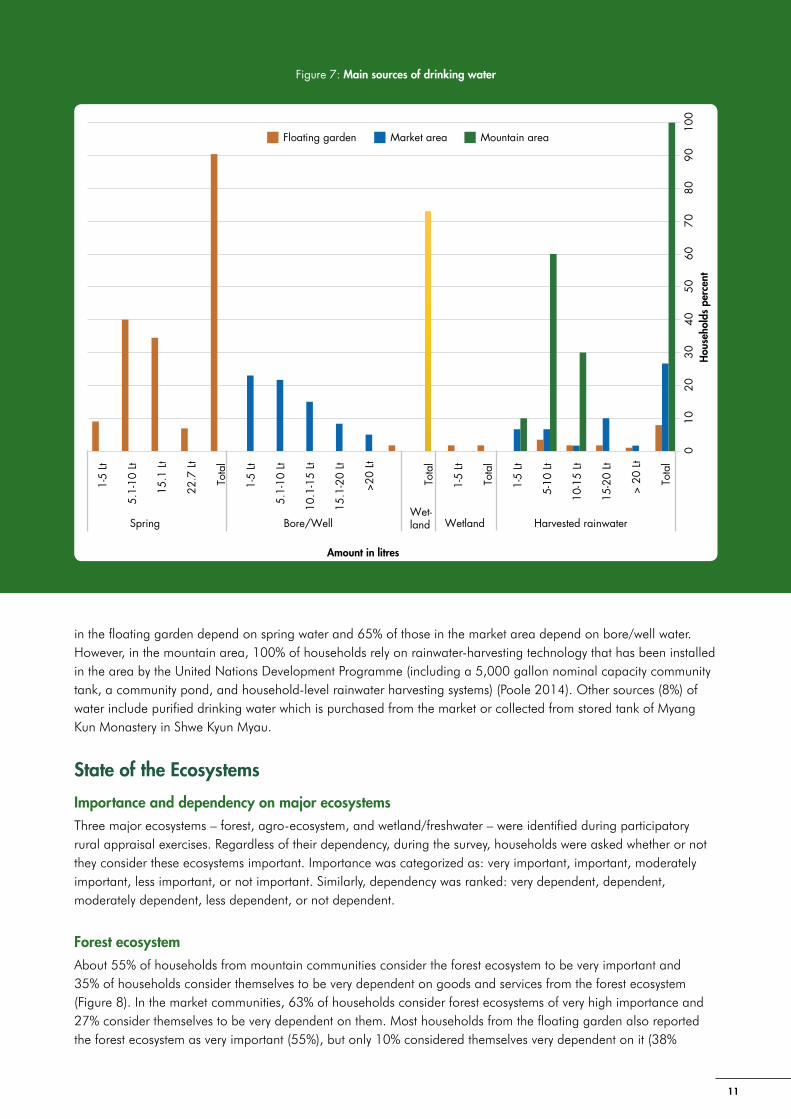
Households from the floating garden and mountain area perceived freshwater ecosystems as highly significant in terms of both dependency and importance. About 74% of the households from the floating garden and 53% of households from the mountain area reported being highly dependent on freshwater. Similarly, 78% of households from the floating garden and 60% from the mountain area considered freshwater to be an important ecosystem (Figure 10). Households in the floating garden are dependent on the freshwater ecosystem in two main ways. First, the floating garden area receives a large number of tourists who use boats as a means of transportation, which requires a sufficient amount of water in Inle Lake. Second, the floating garden needs water for crop production and aquaculture. In the market area, 28% of households consider themselves moderately dependent on the freshwater ecosystem and 32% consider freshwater ecosystem services to be moderately important.
Perceived Change in the Major Ecosystems
A harmonized relationship between people and nature for human wellbeing means ensuring the long-term flow of ecosystem goods and services (Gómez-Baggethun and Kelemen 2008). However, both human induced and natural disturbances are continuously changing in order to adapt the variability of flow of such ecosystem goods and services within tolerable bounds (Janssen and Anderies 2007). Ecosystem services refer to tangible and intangible benefits (goods and services), which can be categorized as: provisioning, regulatory, cultural, and supporting services provided to society by natural and human-modified ecosystems (Millennium Ecosystem Assessment 2003; Costanza et al. 1997). In the study area, these categorized services are derived from forests, agro-ecosystem, wetland, and freshwater ecosystems.
Around 95% of the households perceived that the forest ecosystem has decreased over the last 10 years (Figure 11). Such claims are also raised in the report by Khaing (2014), which explains that Shan state alone lost 40.4% of its
0
10
20
30
40
50
60
70
80
Not
impo
rtant
Less
impo
rtant
Mod
erat
ely
impo
rtant
Impo
rtant
Very
impo
rtant
Not
dep
ende
nt
Less
dep
ende
nt
Mod
erat
ely
depe
nden
t
Dep
ende
nt
Very
dep
ende
nt
Importance of agro-ecosystem Dependence on agro-ecosystem
Floating garden Market area Mountain area
Hou
seho
ld p
erce
ntFigure 9: Importance and dependency on agro-ecosystem
14
0
10
20
30
40
50
60
70
80
Less
impo
rtant
Mod
erat
ely
impo
rtant
Impo
rtant
Very
impo
rtant
Not
dep
ende
nt
Less
dep
ende
nt
Mod
erat
ely
depe
nden
t
Dep
ende
nt
Hig
hly
depe
nden
t
Importance of freshwater Dependence on freshwater
Floating garden Market area Mountain area
Hou
seho
ld p
erce
nt
-120
-100
-80
-60
-40
-20
0
20
40
60
80
Floa
ting
gard
en
Mar
ket a
rea
Mou
ntai
n ar
ea
Tota
l
Floa
ting
gard
en
Mar
ket a
rea
Mou
ntai
n ar
ea
Tota
l
Floa
ting
gard
en
Mar
ket a
rea
Mou
ntai
n ar
ea
Tota
l
Floa
ting
gard
en
Mar
ket a
rea
Mou
ntai
n ar
ea
Tota
l
Forest Agro-ecosystem Freshwater Wetland
Major ecosystemsNo change Increasing Decreasing Do not know
Hou
seho
ld p
erce
ntFigure 10: Importance and dependency on freshwater/wetland ecosystem
Figure 11: Perceived change in four ecosystems over the last 10 years

15
forest cover between 2001 and 2012. Households said that almost no forest is left in the mountain area; this also corresponds with Forest Department Statistics from 1998, which show that out of 343,587 km2 of natural forests, 37.4% of forest cover area has been deforested. The rate of deforestation and degradation was -1.17% from 1990–2000, -0.90% from 2000–2005, and -0.95% from 2005–2010 (FRA 2010). In recent years, the rate of deforestation and degradation has increased. The degraded forests upstream and increased soil erosion have led to sedimentation, which, combined with chemical pesticides leached from agricultural land, have resulted in an algae bloom in the lake (Ma 1996; Akaishi et al. 2006). This has further eroded the efficacy and sustainability of the flow of ecosystem goods and services downstream. Households said that there has been a huge reduction in forest ecosystem services due to the over-extraction of fuelwood, illegal logging, charcoal-making, shifting cultivation, the extension of agricultural land into forest areas, and population growth (with repercussions on demand for fuelwood and infrastructure development like roads and buildings).
People’s perception on the land use varied significantly between the study sites. While 73% of households perceived an increase in the agro-ecosystem, 78% also perceived a decline in agroecosystem practices. About 45% of the households from the mountain area perceived no change in agro-ecosystem, while 23% reported an increase in agro-ecosystem in the area. Elasticity between the increases and decreases in the agroecosystem is largely due to the conversion of degraded land and population growth which increases demands for irrigation and farming. Interestingly, 32% of households perceived no change in agro-ecosystem practices (Figure 11).
In relation to the wetland/freshwater ecosystem, about 63% of households perceived a huge reduction in the availability of freshwater ecosystem goods and services. Major concerns included the depletion of forests, erratic rainfall, less precipitation, rising temperatures, the drying out of rainwater collection ponds, and sedimentation. On the other hand, 30% of households mentioned that reforestation activities have contributed to lessen such changes in ecosystem goods and services. Perhaps something like: Inle Lake and the floating garden area suffer from pollution. Mineral and organic nutrients produced by the main market area (Nampam market) and tourist hub (Naung Shwe and Paung Taw Oo pagoda) end up in the lake due to improper management and sewage and solid waste. This is exacerbated by population growth and increased tourist numbers. Lwin and Sharma (2012) identified five major issues affecting the freshwater and wetland ecosystem in Inle Lake, namely: the houses built inside the lake have poor sanitation and improper management of waste; livestock breeding is a source of garbage and sewage; the waste and effluent from industry is being directly and indirectly discharged into the lake; the open lake water area is shrinking and deforestation is an issue; and intense agricultural practices in the catchment have added silt and nutrients to the shallow lake.
A significant number of households (98%) perceived an enormous reduction in the wetland ecosystem and its services. They opined that the large population living in the wetland (floating garden), high amount of accumulated sediment in the lake, deforestation, erratic rainfall, eutrophication, an increase in invasive species (water hyacinth in lake, (see Figure 11), and the lack of conservation activities are contributing factors to the depletion of the wetland ecosystem. The expansion of cropland area, sedimentation, deforestation, and anthropogenic activities (as a result of the growing population and tourism) are some of the factors contributing to the reduction in area of the wetland, which has caused significant economic loss (San and Rapera 2010). Eutrophication, increased invasive species, and population growth have also resulted in reduced water quality. Studies by Akaishi et al. (2006) noted that the rate of siltation from inflowing streams is 623,000 m3 per year and the clearing of the natural vegetation for cultivation has accelerated siltation in Inle lake. The study emphasizes that the change in water quality is a result of agrochemicals used for tomato cultivation in the lake. Households perceptions of the change in four ecosystem are interpreted in Figure 11.
Land Use Land Cover Change
Major land cover types in the study area consist of forest, shrubland, grassland, cropland, wetland, and freshwater. The literature indicates that Inle Lake has been experiencing major land use land cover changes (Sidle et al. 2007; Htwe et al. 2015). The analysis conducted by this present study supports earlier findings. Specifically, cropland has increased and wetland has decreased dramatically over the time (Figure 12). Such changes were also reiterated by the households (as discussed in previous sub-section). The data for 1989 shows that croplands constituted 59.5% of the Inle Lake conservation area. This increased to 60.67% in 2000 and to 64.53% in the year 2014. Consequently,

16
the freshwater has increased in each subsequent year. Conversely, the wetland area has decreased to 0.94% in the year 2014 from 3.95% in the baseline year 1989. Cropland area has been increased mostly in the Inle Lake area, as also reported by Htwe et al. (2015). Apparently, a dramatic shrinkage in the lake area has taken place over the past few decades. Major concerns arise about the declining lake area and the degrading ecosystem of the lake and its surroundings. In 1967, Ma (1967) reported a lake approximately 23 km long and 11 km wide, but, less than 30 years later, Thi (1996) reported water surface dimensions of only 11 km long and 5 km wide. The floating villages, floating gardens, and tourists have greater impact on the lake catchment than outside lake activities (Lwin and Sharma 2012). Sidle et al. (2007) estimated a decline of open water surface in Inle lake by 32.4% between 1935 and 2000. Deforestation in the mountains, agricultural encroachment, shifting cultivation, the expansion of the floating gardens, and changes in the water quality are other major concerns (Sidle et al. 2007). Depending on the crop variety, we can interpret that increased cropland demands more water for irrigation. And this might have led to the reduction in the wetland, in addition to other factors. The forest cover in the year 2000 increased by 23 km2 compared to 1989. However, this was reduced by 115 km2 in the year 2014 against the baseline line year 2000 (resulting in an overall reduction of 92 km2 against the baseline line year 1989) (Table 7).
Comparing Tables 8 and 9, an area of 115 km2 forest has been converted into cropland. Declines of 1 km2 of shrubland and 1 km2 of grassland were also observed. Cropland has increased by 209 km2, expanding into wetlands, shrublands, and grasslands over the 25 years from 1989 to 2014. However, over those years, the freshwater area has also increased by 38 km2. A similar trend was reported in other studies on Inle Lake (Sidle et al. 2007; Htwe et al. 2015). Referring to Table 8, freshwater has influenced grasslands, wetlands, and croplands. However, this requires further validation. Regardless, it is evident that Myanmar has experienced rapid deforestation over the last four decades (Leimgruber et al. 2005; Mon et al. 2012).
Figure 12: Land use land cover map of the Inle Lake for 1989, 2000 and 2014

17
Ecosystem Services Assessment
Utilization of ecosystem services The study looked at the use of ecosystem goods and services by households in the study area. In relation to provisioning goods and services, households obtain 19, 15, 6, and 12 different services from forests, agroecosystems, freshwater, and wetland ecosystems, respectively (Table 10). Similarly, 15 regulating, 4 supporting, and 6 cultural services are utilized from forest, agroecosystem, freshwater, and wetland ecosystem respectively. Besides collecting these goods and services, communities also purchase them from market. A matrix of provisioning, regulating, supporting, and cultural services from forest, agroecosystem, freshwater, and wetland is presented in Table 10.
Table 8: Change matrix of land cover from 1989 to 2000
Land cover (km2)
Fore
st
Shru
blan
d
Gra
ssla
nd
Cro
plan
d
Wet
land
Fres
hwat
er
Tota
l (19
89)
Forest 1,074 0 0 0 0 0 1,074Shrubland 24 268 0 25 3 1 321Grassland 0 0 394 0 0 0 394Cropland 0 0 0 3,232 0 0 3,232Wetland 0 0 0 34 177 3 214Freshwater 0 0 0 0 3 187 189Total (2000) 1,097 268 394 3,291 183 191 5,424Source: Landsat TM and Landsat 8
Table 9: Change matrix of land cover from 2002 to 2014
Land cover (km2)
Fore
st
Shru
blan
d
Gra
ssla
nd
Cro
plan
d
Wet
land
Fres
hwat
er
Tota
l (2
000)
Forest 982 0 0 115 0 0 1,097Shrubland 0 268 0 0 0 0 268Grassland 0 0 393 0 0 1 394Cropland 0 0 0 3,279 4 8 3,291Wetland 0 1 0 104 47 30 182Freshwater 0 0 1 2 0 189 192Total (2014) 982 269 394 3,500 51 228 5,424Source: Landsat TM and Landsat 8
Table 7: Summary of land cover statistics for 1989, 2000, and 2014
Land cover Year Land cover changes in km2 (1989–2014)
1989 2000 2014
km2 % km2 % km2 %
Forest 1,074 19.79 1,097 20.23 982 18.10 -92
Shrubland 321 5.92 268 4.94 269 4.96 -52
Grassland 394 7.27 394 7.27 393 7.24 -1
Cropland 3,232 59.58 3,291 60.67 3,500 64.53 268
Wetland 214 3.95 183 3.37 51 0.94 -164
Freshwater 189 3.49 191 3.52 229 4.22 40
Total 5,424 100 5,424 100 5,424 100

18
Almost all households in the mountain area mentioned that they consume mushroom (100%) and edible wild fruits/vegetables (97%) from the forest ecosystem. About 83% of the mountain communities collect forest fuelwood. Despite deforestation and degradation of the forest, it still accounts for the supply of fuelwood in the mountain area. Only 7% of households in the floating garden and 8% in the market area consume forest fuelwood. This suggests that mountain communities have greater access to forested areas. Similarly, many wetland services are predominantly utilized by floating garden communities. About 91% of floating garden households use water for bathing, 66% for fishing, 28% for fodder, 24% for seaweed, and 14% for irrigation. The agro-ecosystem seems very productive in the mountain area growing. About 93% of the households cultivate vegetables, 87% cultivate paddy and mushroom, and 65% collect fuelwood from the area agro-ecosystem. Similarly, households in the market area are also reliant on their own agro-ecosystem for vegetable production (87%), ornamental plants (67%), fuelwood (38%), and edible wild fruits (37%).
In an average of these three study sites, households rely on freshwater for their drinking-water supply (93%), for bathing (61%), for irrigation (6%), and for its supply of sand and boulders (3%). In addition to the forest, study results indicate that communities meet their fuelwood demands through the agro-ecosystem and the wetlands. The percentage of provisioning goods and services collected from four ecosystems are presented in Figure 13. Out of total consumers of particular ecosystem services percentage of user households from each three study sites (floating garden, market area and floating garden) was calculated. Changes in the availability of these services
Table 10: Types of goods and services from different ecosystems
Ecosystemgoods and
services
Provisioning (23) Regulating (14) Supporting (4) Cultural (6)
Forest (19) fuelwood, fodder, grazing, timber, poles, medicinal plants, ornamental plants, wild edible fruits, vegetables, mushrooms, fibre, thatch, bush meat, paddy, mud, orchid, cereals, drinking water, water for bathing, water for irrigation, boulders and sand
carbon sequestration, climate regulation erosion/flood control, ground-water recharge, nutrient enrichment, pest regulation, pollination, seed dispersal, soil fertility, soil formation, soil stability, waste treatment, water purification, and water retention
ecosystem resilience, habitat for species, hydrologic cycle, and soil formation
aesthetic beauty, ecotourism, education and research, recreation, nature worship, and spiritual enrichment
Agro-ecosystem (15)
fuelwood, fodder, grazing, timber/poles, medicinal plants, ornamental plants, wild edible fruits, vegetables, mushrooms, fibre, thatch, dyes, paddy, and cereals
carbon sequestration, climate regulation, erosion/flood control, ground-water recharge, nutrient enrichment, pest regulation, pollination, seed dispersal, soil fertility, soil formation, soil stability, waste treatment, water purification, and water retention
ecosystem resilience, habitat for species, hydrologic cycle, and soil formation
aesthetic beauty, ecotourism, education and research, recreation, nature worship, and spiritual enrichment
Freshwater (6)
fish, drinking water, water for bathing, water for irrigation, boulders and sand
carbon sequestration, climate regulation, erosion/flood control, ground-water recharge, nutrient enrichment, pest regulation, pollination, seed dispersal, soil fertility, soil formation, soil stability, waste treatment, water purification, and water retention
ecosystem resilience, habitat for species, hydrologic cycle, and soil formation
aesthetic beauty, ecotourism, education and research, recreation, nature worship, and spiritual enrichment
Wetland (12)
ornamental plants, wild edible fruits/vegetables, fish, drinking water, water for bathing, water for irrigation, boulders and sand, silt soil, seaweed, and fodder
nutrient enrichment, pest regulation, pollination, seed dispersal, soil fertility, soil formation, soil stability, waste treatment, water purification, water retention, carbon sequestration, climate regulation, erosion/flood control, ground-water recharge, and pest regulation
ecosystem resilience, habitat for species, hydrologic cycle, and soil formation
aesthetic beauty, ecotourism, education and research, recreation, nature worship, and spiritual enrichment

19
0 10 20 30 40 50 60 70 80 90 100Fuel wood
Grazing
Medicinal plants
Wild edible fruits/vegetables
Fibre
Bush meat
Cereals
Drinking water
Water for irrigation
Sand
Drinking water
Water for irrigation
Sand
Fodder
Timber/poles
Ornamental plants
Mushrooms
Thatch
Paddy
Vegetables
Wild edible fruits/vegetables
Fish
Water for bathing
Boulders
Silt soil
Fodder
morf secivres metsysoce gninoisivorP
fore
stFr
eshw
ater
Agr
o-ec
osys
tem
Wet
land
Proportion of households using services
Ecos
yste
m a
nd th
eir s
ervi
ces
Floating garden Market area Mountain area
Figure 13: Provisioning ecosystem services utility from different ecosystems
Figure 14: Provisioning services from four ecosystem in the year 1989, 2000 and 2014

20
in the years 1989, 2000, and 2014 are highlighted in Figure 14. Study results show that the local communities of these study areas make use of a wide range of provisional services — and a significant proportion of people are directly dependent them. However, the significant changes in these ecosystems over time mark an alarming indication of their threatened sustainability, as also reported by others (Sidle et al. 2000). Considering the limitations on methodological approach and objective of the study, the economic valuation for ecosystems services could not be assessed. However, information derived from participatory rural appraisal and HH survey results estimated a requirement of 10 - 23 litres of drinking water per household per day (excluding livestock). Thus, using direct cost, an annual economic value of freshwater for surveyed households (N=178) is estimated to be in the range of USD 116,946 - USD 268,975.8 (considering local market value of 1 litre of drinking water = USD 0.18)
Wetlands act as a “sink” for carbon and as a climate “stabilizer” (Khan 2000), providing key benefits to human society (Turner et al. 2000). Wetlands are defined as “the areas of marsh, fen, peat land or water, whether natural or artificial, permanent or temporary, with water that is static or flowing, fresh, brackish or salt, including areas of marine water the depth of which at low tide does not exceed six meters” (Ramsar Convention Secretariat 2013). Most study households have an awareness of the environmental benefits afforded by various ecosystems. Between 58% - 95% of households (105 - 170 households) noted that the forest ecosystem plays an important role in regulating existing environmental conditions (Table 11). Among the major regulatory activities that forests perform, households articulated awareness of erosion/flood control, climate regulation, carbon sequestration, water retention, and pollination and seed dispersal. About 73 households mentioned that the agro-ecosystem aids in pollination; 24 mentioned that it serves in nutrient enrichment; and 9 noted the agro-ecosystem in regulating climate and ground-water recharge. In addition, 28 households have some awareness that the freshwater ecosystem contributes to ground-water recharge. In regard to awareness of wetland services, 52 households mentioned its contribution to soil fertility; 50 households noted its significance in ground-water recharge; and 49 households mentioned its function in soil formation. Only 2 households mentioned the wetland as significant in regulating water-retention capacity (Table 11).
The number of households who mentioned the regulatory role of forest is illustrated in Table 11 and forest representation in LULCC maps for the years 1989, 2000, and 2014 are shown in Figure 15. In Inle Lake, community awareness of the ecosystems’ role in regulatory services is inspiring, compared to similar studies conducted in Bhutan (ICIMOD and RSPN 2014) and in Nepal (ICIMOD and MoFSC 2014).
Almost all households are aware that the forest ecosystem supports ecosystem resilience, providing a habitat for species, hydrological cycle, and soil formation. About 92% of households mentioned the forest’s support of ecosystem resilience; 12% noted the agroecosystem’s function in soil formation; 21% noted that the wetland provides a habitat for species; and 13% noted that freshwater also serves as a home
Table 11: Household’s awareness of regulating services in each of four ecosystems
Number of households aware of service in each ecosystem
Forest ecosystem
Agro-ecosystem
Fresh-water
Wetland
Carbon sequestration 155 12 4 43
Climate regulation 165 9 12 6
Erosion/flood control 170 14 5 33
Ground-water recharge 129 9 28 50
Nutrient enrichment 119 24 11 39
Pest regulation 163 22 1 3
Pollination 105 73 5 11
Seed dispersal 146 26 5 9
Soil fertility 117 23 11 52
Soil formation 109 22 11 49
Soil stability 142 17 7 21
Waste treatment 122 21 10 34
Water purification 155 13 9 13
Water retention 152 23 2 2
Table 12: Household’s awareness of supporting services in each of four ecosystems
Ecosystem Percentage of households awareness of each supporting service
ecosystem resilience
habitat for species
hydrological cycle
soil formation
Forest 92 82 85 59
Agro-ecosystem 7 11 4 12
Wetland 4 21 19 20
Freshwater 1 13 7 9

21
Figure 15: Regulating services from four ecosystem in the year 1989, 2000 and 2014
Figure 16: Supporting services from four ecosystems in the year 1989, 2000 and 2014
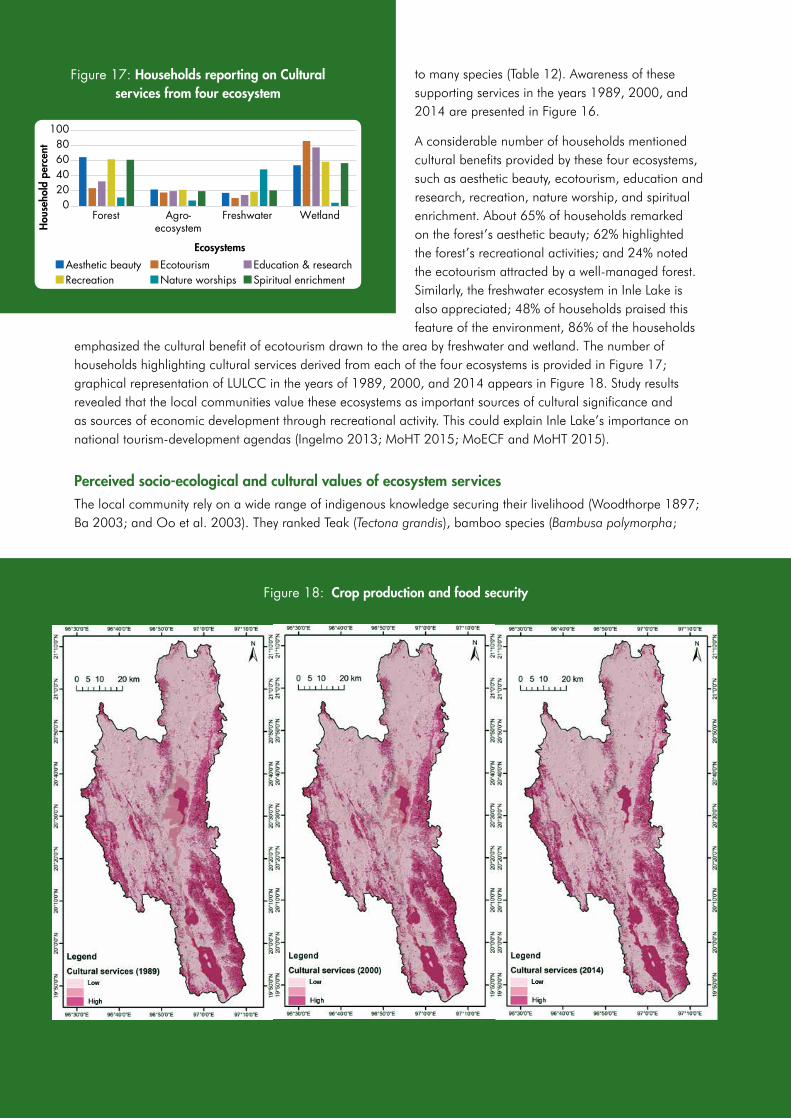
22
Figure 18: Crop production and food security
Figure 17: Households reporting on Cultural services from four ecosystem
to many species (Table 12). Awareness of these supporting services in the years 1989, 2000, and 2014 are presented in Figure 16.
A considerable number of households mentioned cultural benefits provided by these four ecosystems, such as aesthetic beauty, ecotourism, education and research, recreation, nature worship, and spiritual enrichment. About 65% of households remarked on the forest’s aesthetic beauty; 62% highlighted the forest’s recreational activities; and 24% noted the ecotourism attracted by a well-managed forest. Similarly, the freshwater ecosystem in Inle Lake is also appreciated; 48% of households praised this feature of the environment, 86% of the households
emphasized the cultural benefit of ecotourism drawn to the area by freshwater and wetland. The number of households highlighting cultural services derived from each of the four ecosystems is provided in Figure 17; graphical representation of LULCC in the years of 1989, 2000, and 2014 appears in Figure 18. Study results revealed that the local communities value these ecosystems as important sources of cultural significance and as sources of economic development through recreational activity. This could explain Inle Lake’s importance on national tourism-development agendas (Ingelmo 2013; MoHT 2015; MoECF and MoHT 2015).
Perceived socio-ecological and cultural values of ecosystem servicesThe local community rely on a wide range of indigenous knowledge securing their livelihood (Woodthorpe 1897; Ba 2003; and Oo et al. 2003). They ranked Teak (Tectona grandis), bamboo species (Bambusa polymorpha;
020406080
100
Forest Agro-ecosystem
Freshwater Wetland
Hou
seho
ld p
erce
nt
Ecosystems
Aesthetic beauty Ecotourism Education & researchRecreation Nature worships Spiritual enrichment

23
Dendrocalmus strictus), Gurjun Tree (Dipterocarpus tuberculatus), Pine (Pinus spp.), Gnagaw (Mesua ferrea), Yinma (Chukrasia tabularis), Burma cedar (Cedrela toona), and Eucalyptus as important for their daily use. These are socially very important as construction materials, as highlighted by about 85% of households. Teak is very expensive and somewhat rare, households explained. D. tuberculatus, one of the IUCN red-listed threatened species, is found — and valued — by communities in the study site. This further calls for the protection of D. tuberculatus. Pine and Gangaw among others are major sources for fuelwood in the market and mountain areas, as reported by 50% households.
Wetland and freshwater are home to numerous aquatic species, some of which have been reported dating back to the early 1900s (Oka 1922). About 40% of households mentioned the importance of carp from Inle, as it represents high value for Intha’s festival. Households mentioned not having seen carp for a long time. People believe that if the Inle carp disappears, the lake will also disappear. The Inle carp (Cyprinus carpio intha), known as nga-phane, is considered a cultural symbol of the local Intha people (Bruneau and Bernot 1972). It also serves an important role in the food supply and has become scarce (Butkus and Myint 2001). The declining population of Inle crap can be attributed to decreased water-clarity levels associated with suspended sediment and eutrophication (Su and Jassby 2000). Yay Kyat is one of the bird species symbolic of Inle Lake’s beauty. Households mentioned these birds, embracing their socio-ecological value and offering an urgent plea to protect this species from extinction. Eels are also important, as they signify economic well-being of the household, can be exported to China, and carry a high social value.
Tomato retains a high social and cultural value as a cash crop and as an important ingredient. About 60% of Households’s ranked tomato as very important, and 10% ranked it as important. Pig represents household economic status within the community, marking it with high social value. Households commented on rabbit as a crop destroyer. Peacock is considered a positive symbol of the forest — and communities believe that peacock prey on snakes, which add to their perceived value. About 45% of households mentioned decreased numbers of area peacock. Households also perceive tortoise to be auspicious indicators of productive agricultural land. Thus, community households ascribed high ecological value to both peacock and tortoise. About 4% of households mentioned that wild boar has not been seen in the area for a long time.
About 79% of households mentioned that Paung Daw Oo Pagoda and Alo Daw Pauk Pagoda carry high cultural value, as also indicated by Kyaw (1996). These famous area pagodas warrant an annual visit and have been included in the tourism products of Myanmar (Ingelmo 2013). A yearly festival takes place at each of these pagodas, every September/October and every December, respectively. Paung Daw Oo Pagoda can be reached by boat tour on Inle Lake, and it houses five small golden Buddha images. Alo Daw Pauk Pagoda can also be reached by Inle Lake boat. In recent years, tourism has been promoted and is considered promising for economic development in the area (Ingelmo 2013; Yee 2014; Munz and Molstad 2012).
Willingness to pay (WTP) for environmental managementAbout 96% of households showed willingness to pay (WTP) for fully managed ecosystems if communities are ensured the improved flow of goods and services from them. Only 3% of households remarked that ecosystem benefits are free in nature and should not require payment. Most community households are willing to pay either in cash or kind for the management of major ecosystems. WTP in cash ranges from 5 USD to 20 USD per household per year. WTP in kind ranges from 12 days to 36 days per person per year. Households indicated that funds generated for ecosystem management in the study area should be maintained and administered by either the village head (56%) or by the local community (55%). Only a few households preferred such funds to be managed by Non-Governmental Organizations (NGOs) (Table 13). The high rate of WTP could be due to perceptions of increased potential for economic wellbeing for the Inle Lake (Ingelmo 2013).
Livelihood vulnerability assessmentAcross the study sites, an average of 68% of farmers have adequate food for more than a year — on the other hand, 26% of households have adequate food for less than three months. Farms in the mountain area are very productivity, resulting in food security for more than a year. Food security status varies widely: from 98% in the mountain area to 28% in the floating garden. Due to poor production and less land for cultivation, about 50%

24
of the households in the floating garden have adequate food for less than 3 months (Figure 19). However, there are variations on availability of food in terms of difficult time during the year (Figure 20). Mountain faced difficulties during winter whereas floating garden in the monsoon and market area in summer. For the food-distressed population in the floating garden, households reported the most difficult month as November (17 HH), followed by June and Oct (6 HH each). In the market area, households experienced food security issues in April (7 HH), July (4 HH), and June (3 HH). Monthly food distress is shown in Figure 20. In addition to food deficits, households also reported an illness or accident befalling a household member and the degradation of natural ecosystem as other major difficulties they’ve encountered. Coping mechanisms include cash loans, grain loans from kin, meal adjustment, and selling of household assets or animals (Table 14).
0
20
40
60
80
100
Less than3 months
4-6 months 10-12months
More than12 months
Food
sec
urity
per
cent
Crop production and food secured monthsFloating gardenMarket area
Mountain areaTotal average
Figure 19: Crop production and food security
02468
101214161820
Jan Mar Apr May Jun Jul Oct Nov Dec
Perc
enta
ge
Difficult monthsFloating garden Market area Mountain area
Figure 20: Most difficult months for adequate food
Table 13: Fund-management preferences
Who should manage generated ecosystem funds
Floating garden
Market area
Mountain area
Total
Local community 15 21 19 55
Government 20 9 4 33
NGOs 0 3 1 4
Village head 15 11 30 56
Others 8 16 6 30
Total 58 60 60 178
Table 14: Coping strategies adopted by local communities in the study areas
Crisis HH % in Floating garden
HH % in Market area
HH % in Mountain
area
Coping strategy
Poor productionMinor problem 0 2 0 Taking loan, meal adjustment,
temporary labour migrationMajor problem 0 8 0
Food shortageMinor problem 33 15 2 Taking loan, saving and selling
of own cropMajor problem 5 3 0
Illness/accident of a household member; buying medicine
Minor problem 31 17 17 Taking loan, cash or grain loan from merchants, selling of household assets and jewellery Major problem 22 22 3
Irregular remittance Minor problem 2 2 0 Taking loan and repaying when money received
Market fluctuation or inflation
Minor problem 2 8 0 Loan from bank, mortgaging farmland, meal adjustmentMajor problem 3 5 0
Degradation of natural ecosystem
Minor problem 24 20 0Nothing
Major problem 2 45 0

25
Table 15: Long-term changes during the past ten years
Major indicators Long-term changes during the past 10 years
Percent of households
Remarks
Frequency of illness
No change 60
Declined 13 Due to increased number of health facilities
Increased 28 Age factor, high blood pressure
Health facilities No change 42
Improved/increased 58 Improved health clinics
Worsened/declined 1 Health facilities lacking or non-existent from the start
No change 35
Purchasing power
Improved/increased 54 People started earning more
Worsened/declined 11 Increased market price
Possibilities for generating income locally
No change 38 No idea
Improved/increased 53 Increased daily labour opportunities in Nyaung Shwe and Heho
Worsened/declined 9 Job opportunity scarcity for older people and those in poor health
Possibility of generating income from remittances
No change 100 People do not migrate
School facilities
No change 8
Improved/increased 67
Worsened/declined 24 After primary education students must go to other village for further studies
Quality of public services
No change 15 Not applicable
Improved/increased 84 Not applicable
Worsened/declined/ 1 Not applicable
Forest access
No change 21
Improved/increased 2
Worsened/declined 78 No forest remains near village area
Forest cover
No Change 4
Improved 3
Decreased 93 Siltation; deforestation
Soil fertility
No change 29 Not applicable
Worsened/declined 71 Use of chemical fertilizer
Food security
No change 54
Improved/increased 41 Not applicable
Worsened/declined 5 Not applicable
Veterinary facilities
No change 59
Improved/increased 1 Not applicable
Worsened/declined 1 Not applicable
Family size
No change 28
Improved/increased 42
Worsened/declined 30

26
Long term changes in the socio-economic indicators in the communitySocio-economic indicators of wellbeing in these communities have changed during the past decade. Increased numbers of health clinics in the study areas have contributed to improved health. With the increased demand for daily labour and more job opportunities in Nyaung Shwe and Heho, purchasing power of individuals in the community has increased, as reported by 54% of households. However, work remains a challenge for older residents. Interestingly, the area has not been experiencing in or out migration, negating any possibility for remittances. Additional improved social indicators include increased quality of public services, such as transportation, communications, safety, decision-making, and food security. However, forest cover has declined, limiting forest access. Water availability and quality has diminished throughout the past decade. Soil fertility has degenerated to its maximum point and chemical fertilizers are being used. Details are presented in Table 15.
Along with the socio-economic and ecological changes in the study area described above, 114 households noted that ecosystem-management activities have been carried out in their surrounding area. On average, 93% of the households in study area stated that such activities have improved livelihood. The site-specific segregation of responses indicates that 100% of mountain area households report improved livelihood, followed by 43% in the market area, and 12% in the floating garden. However, 16% of households are unsure if improvements are a result of ongoing ecosystem management. Mountain area households acknowledged that United Nations Development Programme initiatives and reforestation efforts have had positive influence on livelihood. Ongoing activities include:
� Wetland and riverside cleaning � Rain-water harvesting � Village-area tree plantation on the eastern side of Inle lake, overseen by the village head and forest department
In addition, Inle Lake has also been the recipient of numerous developmental interventions to sustain its ecosystems and the crucial goods and services produced for local communities (Brunse 2012; Jensen 2012; Jensen and Theint 2012 a, b; Kristensen 2012). During focus-group discussion, it was mentioned that wetland and riverside cleaning is performed yearly, just before the Intha Festival. The government has initiated this process and deploys a large
Major indicators Long-term changes during the past 10 years
Percent of households
Remarks
Security
No change 49
Improved/increased 49
Worsened/declined 2
Communications
No change 17
Improved/increased 83 Phone and mobile facilities
Transportation
No change 8
Improved/increased 85 Roads/transportation improved
Worsened/declined/ 7 Decreased water level in Inle Lake
Water availability
No change 41
Improved/increased 4 Drinkable water available for purchase
Worsened/declined 54 Lake water not drinkable for the past 10 years; drying up of two ponds; high dependency on rain water
Water quality
No change 59
Improved/increased 4
Worsened/declined 37
Decision making
No change 47
Improved/increased 52
Worsened/declined 1

27
number of workers to clean the lake. The community remarked that the lake-cleaning process should be executed more than once a year. Forest plantation is seen as the primary solution for restoring the country’s forest cover. Htun (2012) reports that plantations have been encouraged by the local government for local, commercial, and industrial use, and for watershed protection.
Htun (2012) further notes that for commercial plantations, a major constraint has been the difficulty in acquiring seeds and seedlings as a result of previous overexploitation and removal of seed-bearing trees. With this in mind, households noted that the forest department has provided free seedlings. The forest department has also initiated Eucalyptus growth. The communities must tend to grow these trees, but once the trees are mature, communities can use them for timber, construction material, or for sale in the marketplace. Households proposed the following activities and initiatives to further improve livelihood:
� Capacity building and material support (including seed) for agriculture in order to improve productivity and prevent soil erosion
� Restoration and management of forest to improved freshwater supply and irrigation � Improved irrigation facilities for agriculture � Improve livestock-breeding techniques and access to veterinary facilities � Improve educational facilities (in the mountain area, there is no high school; students either go to cities/towns or
discontinue their higher studies.) � Provide access to electricity and alternative energy (solar equipment) � Provision for fair trade and free trade allowance with other countries � Availability of soft/interest-free loans and micro-finance and agriculture facilities � Improved market and job opportunities � Additional transportation, access to better roads, and improved road maintenance � Improved health and health education

28
Conclusion and RecommendationsPeople in the study area depend mainly on forest, agriculture, floating garden, and freshwater ecosystems for livelihood. These populations have growing concerns about the increased demands on their ecosystem services. The study has identified community benefits and services derived from the forest, floating garden, and freshwater ecosystems—all of which have declined and been infringed upon by usage and cropland expansion. From 1989 to date, the forest area has been reduced by 92 km2. Despite this huge reduction in forested area, mountain communities find few alternative options for fulfilling their needs. Thus, they remain dependent on the shrinking forest.
Communities have come to understand that reduced forest cover means reduced forest services — amounting to reduced livelihood. Thus, a few of mountain area communities have limited open grazing and adopted stall-feeding practices instead. Access to alternative energy (improved cooking stoves; bio-gas installation) would further alleviate demand on the forest, reducing the community’s dependency on fuelwood. The ongoing practice of free seedling distribution has brought some change to communities, but the results seem insignificant. In some cases, planted seedlings die. Thus, beyond seedling-distribution, follow-up inspection, replanting, and care are required to ensure an adequate seedling survival rate.
There are further concerns that deforestation and degradation upstream has increased the rate of siltation in Inle Lake. Additionally, heavy rainfall tends to increase the landslide rate, further impacting the lake and the communities. Study results revealed an increase in the number of livestock, which leads to increased demand on resources. Irregular and unplanned management activities often lead to an unsustainable extraction of ecosystem goods and services, degrading the ecosystem further. Thus, a proper management plan and effective implementation will help address such concerns. Forest management, lower- and mid-stream wetland management, or other alternatives should be promoted for supplying fodder to livestock upstream. Since 1989, there has been a significant reduction in wetland area due to conversion to cropland. Cropland has increased from 3,232 km2 in 1989 to 3500 km2 in 2014. This conversion has had a major impact in the following ways:
� The huge reduction in wetland area has had an alarming effect on the large number of globally threatened, vulnerable, and critically endangered species in Inle Lake; and
� The leeching of chemical fertilizer into Inle Lake has caused an algae bloom and eutrophication, reducing the quality of water and impacting aquatic life.
Recognizing the importance of Inle Lake as a major tourist attraction, a conservation and watershed-restoration program were launched in 1997. However, many studies indicate continued infilling of the lake with sediment. This leaves further room to improve Inle Lake’s ongoing reclamation and rehabilitation programs and projects. Fresh and healthy water is essential to aquaculture and healthy fisheries. Decreased water levels and quality have reduced the number of fish in Inle Lake. Water levels have also impacted the major means of transportation in the area, as certain depths are required for boat-rowing. While the alternative of road transportation has recently become viable, this does not help the communities living in floating garden and on Inle Lake itself.
While the problem is most pronounced in the mountain area, the availability of drinking water is an issue faced across all of the study sites. Due to run-off, the high slopes of the mountain area retain no rainwater and water tables cannot recharge, leaving the ponds dry. An investment in establishing fresh water ponds in the foothills of the mountain area might serve as one possible solution for addressing rain-water run-off and water-scarcity issues. As evidence shows in the topographically similar area of Himachal Pradesh in India, establishing rainwater-harvesting ponds can successfully support sustenance and provide irrigation to thousands of people.
Communities are willing to pay for managed ecosystem services, if that payment safeguards and ensures the continuous flow of ecosystem good and services in long run. Since Inle Lake is a primary supplier of hydropower to the south of the lake, a Payment for Ecosystem Services (PES) mechanism can be initiated in between the hydropower plant and Inle Lake. Communities strongly suggest that local and state institutions are essential to managing a PES-generated fund. Communities noted the existence of a local institution overseen by the village head. Rather than

29
creating a new fund-management body, such an existing institution could be improved and asked to function in this capacity. This would also serve to empower the communities and increase their ownership of resources.
As a result of both the tourism boom and the increase in agricultural activity, Inle Lake is considered the most changing site in Myanmar. Thus, more extensive studies are necessary. Local communities have noted that the freshwater area is in decline, but this demands further study before we can reach any conclusions. More than water is required to restore a wetland ecosystem. Setting, landscape, habitat, topography, soil properties, nutrient supplies, hydrological and disturbance regimes, invasive species, seed banks, and declining biodiversity can all impact the restoration process. Therefore, restoration approaches that rely on field experimentation at multiple sites and across a temporal scale can serve to illuminate the complexity of the restoration process.
Integrated wetland research combining social and natural sciences can help, in part, to address information gaps and to achieve the required consistency. Such integration also mitigates dubious data and grey area through implementation of specific models pertaining to biodiversity and socio-economics. The current extinction crisis requires dramatic action to save the variety of species; most conservation biologist recognize that, although we cannot save everything, we should at least ensure that all ecosystems and habitat types are represented within regional conservation strategies.

30
ReferencesAkaishi, F., Satake, M., Otaki, M. & Tominaga, N. (2006). Surface water quality and information about the
environment surrounding Inle Lake in Myanmar. Limnology, 7(1), 57-62.
Annandale, N. (1918a). Fish and fisheries of the Inle Lake. Records of the Indian Museum, 14: 33-64, pis. 1-4.
Annandale, N. (1918b). Aquatic molluscs of the Inle Lake and connected waters’. Records of the Indian Museum, 14, 103-182.
Annandale, N. (1918c). Sponges, hydrozoa and polyzoa of the Inle Lake. Records of the Indian Museum, 14, 75-78.
Ba, T. (2003). The Inle Lake, the Inthas, and the boats: Myanmar perspectives. Myanmar perspectives 9 : 6. State Peace and Development Council, Yangon.
Balvanera, P.,Pfisterer, A.B., Buchmann, N., He, J.S., Nakashizuka, T., Raffaelli, D., Schmid, B. (2006). Quantifying the evidence for biodiversity effects on ecosystem functioning and services. Ecology Letters, 9(10), 1146-1156.
Bateman, I.J., Harwood, A.R., Mace, G.M., Watson, R.T., Abson, D.J., Andrews, B., Binner, A., Crowe, A., Day, B.H.., Dugdale, S., Fezzi, C., Foden, J., Hadley, D., Haines-Young, R., Hulme, M., Kontoleon, A., Lovett, A.A., Munday, P., Pascual, U., Paterson, J., Perino, G., Sen, A., Siriwardena, G., van Soest, D. & Termansen, M. (2013). Bringing ecosystem services into economic decision-making: land use in the United Kingdom. Science, 341, 45– 50.
Bertrand, G. & Rangin, C. (2003). Tectonics of the western margin of the Shan plateau (central Myanmar): implication for the India–Indochina oblique convergence since the Oligocene. Journal of Asian Earth Sciences, 21, 1139–1157
Bischoff, R. (1995). Buddhism in Myanmar: A Short History, Buddhist Publication Society, Yangoon.
Bruneau, M. & Bernot, L. (1972). Une population lacustre : les Intha du Lac Inlé. Journal d’agriculture tropicale et de botanique appliquée, (10-11), 402-441
Brunse, H. (2012). Agricultural Development within the Inlay Lake watershed area. Consultant report for the Institute of International Development project ‘Inlay Lake: a plan for the future’. IID: Yangon, Myanmar.
Bryan, B.A., Raymond, C.M., Crossman, N.D. & Macdonald, D.H. (2010). Targeting the management of ecosystem services based on social values: Where, what, and how. Landscape and Urban Planning, 97(2),111-122.
Butkus, S. & Myint, S. (2001). Pesticide use limits for protection of human health in the Inle Lake (Myanmar) watershed. Technical document. Living Earth Institute Olympia (NPO), Washington, DC.
Cardinale, B.J., Matulich, K.L., Hooper, D.U., Byrnes, J.E., Duffy, E., Gamfeldt, L., Balvanera, P., O’Cornor M.L. & Gonzalez, A. (2011). The functional role of producer diversity in ecosystems. American Journal of Botany, 98(3), 572-592.
Castro, A.J., Verburg, P.H., Martín-López, B., Garcia-Llorente, M., Cabello, J., Vaughn, C.C. & López, E. (2014). Ecosystem service trade-offs from supply to social demand: A landscape-scale spatial analysis. Landscape and Urban Planning, 132, 102-110.
Chaudhary, S., MacGregor, K., Houston, D. & Chettri, N. (2015). The evolution of ecosystem services: a time series and discourse-centred analysis. Environmental Science & Policy, 54, 25-24.
Chettri, N., Aryal, K., Kandel, P., Karki, S. & Uddin, K. (2014). Ecosystem services assessment: A framework for Himalica. Kathmandu: ICIMOD
Clarke, J. (1999). Biodiversity and protected areas: Myanmar. Unpublished report to the Regional Environmental Technical Assistance 577.

31
Costanza, R., dArge, R., de Groot, R., Farber, S., Grasso, M., Hannon, B., Limburg, K., Naeem, S., Oneill, R.V., Paruelo, J., Raskin, R.G., Sutton, P. & van den Belt, M, (1997). The value of the world’s ecosystem services and natural capital. Nature, 387, 253–260.
Daw, K.W.M. & Kyaw, W.M. (2000). Floating Islands of Inle Lake. Myanmar perspectives. Myanmar perspectives 6:7. SPDC, Yangon
Daw, T., Brown, K., Rosendo, S. & Pomeroy, R. (2011). Applying the ecosystem services concept to poverty alleviation: the need to disaggregate human well-being’. Environmental Conservation, 38(04), 370-379.
DeGroot, R.S., Alkemade, R., Braat, L., Hein, L. & Willemen, L. (2010). Challenges in integrating the concept of ecosystem services and values in landscape planning, management and decision making. Ecological Complexity, 7, 260–272.
Egashira, K. & Than, A.A. (2006). Cropping characteristics in Myanmar with some case studies in Shan State and Mandalay Division. Journal of the Faculty of Agriculture-Kyushu University, 51(2), 373-382.
Fisher, B., Turner, R.K. & Morling, P. (2009). Defining and classifying ecosystem services for decision making’. Ecological Economics 68, 643–653.
Fisher, J.A., Patenaude, G., Giri, K., Lewis, K., Meir, P., Pinho, P. & Williams, M. (2014). Understanding the relationships between ecosystem services and poverty alleviation: a conceptual framework. Ecosystem Services, 7, 34-45.
Fowler, G.J. & Malandkar, M.A. (2013). A chemical examination of samples of water and of shells from the Inle valley. Journal of the Indian Institute of Science, 6, 185.
Furuichi, T. (2005). A Preliminary Report on Sediment Sources, Erosion Processes, and Sedimentation in Lake Inle in Mid-Eastern Myanmar (Burma). (Abstracts of Papers Presented at the Fall Meeting of the Union, December 2004). 地形, 26(2), 160-161.
Furuichi, T. & Wasoon, R.J. (2011). Placing sediment budgets in the socio-economic context for management of sedimentation in Lake Inle, Myanmar. IAHS-AISH publication, 103-113.
Garcia, Y.T., Garcia, A.G., Oo, M. & Hossain, M. (2000). Income distribution and poverty in irrigated and rainfed ecosystems: The Myanmar case. Economic and Political Weekly, 4670-4676.
Gómez-Baggethun, E. & Kelemen, E. (2008). Linking institutional change and the flows of ecosystem services. Case studies from Spain and Hungary. Institutional Analysis of Sustainability Problems, 118-145.
Groombridge, B. & Jenkins, M. (1998). Freshwater biodiversity: A preliminary global assessment. WCMC Biodiversity Series No. 8. Cambridge: World Conservation Press.
Hadden, R.L. (2008). The Geology of Burma (Myanmar): An Annotated Bibliography of Burma’s Geology, Geography and Earth Science., Topographic Engineering Center (TEC) Engineer Research and Development Center (ERDC) 7701 Telegraph Road Alexandria, VA 22315
Hicks, C.C., Cinner, J.E., Stoeckl, N. & McClanahan, T.R. (2015). Linking ecosystem services and human-values theory. Conservation Biology, 29(5), 1471-1480.
Hossain, M. & Marlar, O. (1995). Myanmar Rice Economy: Policies, Performance and Prospects. Paper presented at the Final Workshop on Projections and Policy Implications of Medium- and Long-Term Rice Supply and Demand Project, Beijing, China.
Htwe, T.N., Kywe, M., Buerkert, A. & Brinkmann, K. (2015). Transformation processes in farming systems and surrounding areas of Inle Lake, Myanmar, during the last 40 years. Journal of Land Use Science, 10(2), 205-223.
ICIMOD & MoFSC (2014). An integrated assessment of the effects of natural and human disturbances on a wetland ecosystem: A retrospective from the Koshi Tappu Wildlife Reserve, Nepal. Kathmandu: ICIMOD.
ICIMOD & RSPN (2014). An integrated assessment of the effects of natural and human disturbances on a wetland ecosystem: A retrospective from Phobjikha Conservation Area, Bhutan. Kathmandu: ICIMOD.

32
Ingelmo, I.A. (2013). Design and development of a sustainable tourism indicator based on human activities analysis in Inle Lake, Myanmar. Procedia-Social and Behavioral Sciences, 103, 262-272.
Janssen, M.A. & Anderies, J.M. (2007). Robustness trade-offs in social-ecological systems. International Journal of the Commons, 1(1), 43-66.
Jensen, A. (2012). Evaluation of Inlay Lake Ecosystem and Options for Sustainable Management. Consultant report for the Institute of International Development project ‘Inlay Lake: a plan for the future. IID: Yangon, Myanmar.
Jensen, A. & Theint, S.M. (2012a). Sustainable Options for Floating Gardens Agriculture on Inlay Lake. Proceedings of Open Discussion Group, 31 March 2012. Report for the Institute of International Development project ‘Inlay Lake: a plan for the future’. IID: Yangon, Myanmar.
Jensen, A. & Theint, S.M. (2012b). Options for Sustainable Management of Sanitation on Inlay Lake. Proceedings of Open Discussion Group, 1 April 2012. Report for the Institute of International Development project ‘Inlay Lake: a plan for the future’. IID: Yangon, Myanmar.
Karki, S., Kandel, P., Thandar, A.M., Sherpa, C.L., Aryal, K. & Chettri, N. (2014). A Regional Orientation Training on Ecosystem Services Assessment under the Himalica Programme 3–7 April, 2014, ICIMOD Knowledge Park and Udayapur District, Nepal. Event Report, ICIMOD, Kathmandu, Nepal.
Kemp, S. (1018). Crustacea decapoda of the Inle lake basin. Records of the Indian Museum, 14, 81–102.
Khaing, D. (2014). MIID Himalica Pilot Myanmar Land Resource Assessment. Unpublished Report, ICIMOD.
Khan, M. (2000). Wetland biodiversity in the Kashmir Himalaya: assessment and conservation strategies.Environmental Biodiversity and Conservation, 69-93.
Kottelat, M. & Witte, K.E. (1999). Two new species of Microrasbora from Thailand and Myanmar, with two new generic names for small Southeast Asian cyprinid fishes (Teleostei: Cyprinidae). Journal of South Asian Natural History, 4(1), 49-56.
Kottelat, V.M. (1986). The fish fauna of Inle Lake in Burma. Aquatic and Terrestrial Zoology, 39, 403–406.
Kristensen, J. (2012). A permanent management system for Inlay Lake. Report for the Institute of International Development project ‘Inlay Lake: a plan for the future’. IID: Yangon, Myanmar.
Kyaw, W. (1996). Phaung-Daw-Oo Pagoda and the Inle Lake. Myanmar perspectives 2:9. SPDC, Yangon.
Lang, S., Kääb, A. & Pechstädt, J. (2011). Assessing components of the natural environment of the Upper Danube and Upper Brahmaputra river basins. Advances in Science and Research, 7, 21-36.
Leimgruber, P., Kelly, D.S., Steininger, M.K., Brunner, J., Müller, T. & Songer, M. (2005). Forest cover change patterns in Myanmar (Burma) 1990–2000. Environmental Conservation, 32(04), 356-364.
Lwin, Z. & Sharma, M.P. (2012). Environmental Management of the Inle Lake in Myanmar. Hydro Nepal: Journal of Water, Energy and Environment, 11, 57-60.
Ma, K.T. (1967). Fishes and fishing gear of Inle Lake. Rangoon: University Press
Ma, T.D.W. (1996). Floating island agriculture (Ye-chan) of Inle Lake. MA Thesis, University of Yangon.
Mace, G.M., Norris, K. & Fitter, A.H. (2011). Biodiversity and ecosystem services: a multilayered relationship. Trends in Ecology and Evolution, 27, 19–26.
MAS (1997). Myanmar agriculture in Progress, Myanmar Agricultural Service, Ministry of Agriculture and Irrigation, The Government of the Union of Myanmar, Yangon, Myanmar.
Millennium Ecosystem Assessment (2003). Ecosystem and human well-being. Washington: Island Press.
Millennium Ecosystem Assessment (2005). Ecosystems and human well-being: Synthesis. Washington, DC: Island Press
Milner-Gulland, E.J. (2012). Interactions between human behaviour and ecological systems. Philosophical Transactions of the Royal Society B: Biological Sciences, 367, 270–278.

33
Mitsch, W.J. & Gosselink, J.G. (2000). The value of wetlands: importance of scale and landscape setting. Ecological economics, 35(1), 25-33.
MoECF & MoHT (2015) Myanmar Ecotourism Policy and Management Strategy for Protected Areas 2015-2025. Ministry of Environmental Conservation and Forestry and Ministry of Hotel and Tourism, Nay Pyi Daw, 53pp.
MoHT (2013). Myanmar Tourism Statistics 2012. Nay Pyi Daw: Ministry of Hotel and Tourism, p 2
MoHT (2015). Myanmar Tourism Master Plan 2013-2020. Ministry of Hotel and Tourism, Nay Pyi Daw, 83pp.
Mon, M.S., Mizoue, N., Htun, N.Z., Kajisa, T. & Yoshida, S. (2012). Factors affecting deforestation and forest degradation in selectively logged production forest: A case study in Myanmar. Forest Ecology and Management, 267, 190-198.
Müller, F.R., de Groot, G. & Willemen, L. (2010). Ecosystem Services at the Landscape Scale: The Need for Integrative Approaches. Landscape Online, 23, 1-11. DOI:10.3097/LO.201023
Munz, A. & Molstad, A. (2012). Working paper for tourism development for Inlay Lake. Consultant report for the Institute of International Development project ‘Inlay Lake: a plan for the future’. IID: Yangon, Myanmar
Myint, D.K.W. & Maung, U.K.W. (2000). Floating islands of the Inle Lake. Myanmar Perspectives, 16(7).
Nahlik, A.M., Kentula, M.A., Fennessy, M.S. & Landers, D.H. (2012). Where is the consensus? A proposed foundation for moving ecosystem service concepts into practice. Ecological Economics, 77, 27–35.
Ng, H.H., Ng, P.K.L. & Britz, R. (1999). Channa harcourtbutleri (Annandale, 1918): a valid species of snakehead (Perciformes: Channidae) from Myanmar. Journal of South Asian Natural History, 4(1), 57-63.
Oka, A. (1922). Hirudinea from the Inle lake, Shan State. Records of the Indian Museum, 24, 521–534
Okamoto, I. (2012). Coping and adaptation against decreasing fish resources: case study of fishermen in Lake Inle, Myanmar. Institute of Developing Economies, Japan External Trade Organization (JETRO).
Olson, D.M. & Dinerstein, E. (1998). The Global 200: a representation approach to conserving the Earth’s most biologically valuable ecoregions. Conservation Biology, 12(3), 502-515.
Oo, C., Murakawa, S., Sakaue, K., Nishina, D., Koshikawa, Y. & Yakushijin, A. (2003). Study on the Indigenous Building Materials of Traditional Houses in Myanmar. Journal of Asian Architecture and Building Engineering, 2(1), 161-168.
Oo, N.N., Sutheerawatthana, P. & Minato, T. (2010). Comparison of information dissemination methods in Inle Lake: A lesson for reconsidering framework for environmental education strategies. Applied Environmental Education and Communication. 9(1), 58-74.
Oo, Z. (1995). Migratory birds and their habitat management in Inle wetland wildlife sanctuary. Yangoon, Myanmar.
Platt, S.G. & Rainwater, T.R. (2004). Inle Lake turtles, Myanmar with notes on Intha and Pa-O ethnoherpetology’. Hamadryad, 29, 5-14.
Poole, R.E. (2014). China’s’ Harmonious World in the Era of the Rising East. Student Pulse, 6(10).
Pradhan, N., Habib, H., Venkatappa, M., Ebbers, T., Duboz, R. & Shipin, O. (2015). Framework tool for a rapid cumulative effects assessment: case of a prominent wetland in Myanmar. Environmental Monitoring and Assessment, 187(6), 1-18.
Ramsar Convention Secretariat (2013). The Ramsar Convention Manual. A Guide to the Convention on Wetlands (Ramsar, Iran, 1971). 6th Edition. Ramsar Convention Secretariat, Gland.
Reyers, B., Biggs, R., Cumming, G.S., Elmqvist, T., Hejnowicz, A.P. & Polasky, S. (2013). Getting the measure of ecosystem services: a social–ecological approach. Frontiers in Ecology and Environment, 11, 268–273.
Richardson, C (1994) ‘Ecological functions and human values in wetlands: A framework for assessing forestry impacts’.Wetlands 14(1): 1-9.
Roberts, T.R. (1986). Danionella translucida, a new genus and species of cyprinid fish from Burma, one of the smallest living vertebrates. Environmental Biology of Fishes, 16(4), 231-241.

34
San, C.C. & Rapera, C.L. (2010). The on-site cost of soil erosion by the replacement cost methods in Inle Lake watershed, Nyaung Shwe Township, Myanmar. Journal of Environmental Science and Management, 13(1), 67-81.
Saw, Y.M. (2007). Changes of water quality and water surface area in Inle Lake: Facts and perception. Unpublished doctoral dissertation). University of Yangon, Myanmar.
Scholes, R.J., Reyers, B., Biggs, R., Spierenburg, M.J. & Duriappah, A. (2013). Multiscale and cross-scale assessments of social–ecological systems and their ecosystem services. Current Opinion in Environmental Sustainability, 5, 16–25.
Sett, E.S. & Liu, Y. (2014). Assessment of the Existing Tourism-Park-Community Relationships: A Case Study in the Inle Lake Wildlife Sanctuary, Myanmar. International Journal of Sciences, 3(2), 24-37.
Sidle, R.C., Ziegler, A.D. & Vogler, J.B. (2007). Contemporary changes in open water surface area of Lake Inle, Myanmar. Sustainability Science, 2(1), 55-65.
Stephenson, J. (1918). Aquatic oligogochaeta of the Inle Lake. Records of the Indian Museum, 14(1), 9–18.
Su, M. & Jassby, A.D. (2000). Inle: A large Myanmar lake in transition. Lakes & Reservoirs: Research & Management, 5(1), 49-54.
TEEB (2010). The economics of ecosystems and biodiversity: Mainstreaming the economics of nature – A synthesis of the approach, conclusions and recommendations of TEEB. Geneva, Switzerland: TEEB Consortium (c/o UNEP).
Than, M.M. (2007). Community activities contribution to water environment conservation of Inle Lake. Union Of Myanmar Ministry Of Agriculture And Irrigation, Irrigation Department. Myanmar.
Thant, K. (1968). Checklist of fishes in the Inle Lake. Tekatho Pyinapade Tha – Vol II.
Thaw, K (2001) Nine key sites for development of tourism in Myanmar. Myanmar perspectives, 7, 9. SPDC, Yangon.
Thaw, K. (1998). The industrial Inthas of Inle Lake. Myanmar perspectives, 4,4. SPDC, Yangon.
Thiha, A. (2001). Land-use adjustment based on watershed classification using remote sensing and GIS: A study of Inle watershed, Myanmar. Unpublished master thesis). Asian Institute of Technology, Bangkok.
Tun, A.A. & Maw, A.A. (2012). A Geographical Investigation on the Watershed Management and Conservation of the Inlay Lake Area. Project paper, Dagon University.
Turner, R.K., Van Den Bergh, J.C., Söderqvist, T., Barendregt, A., van der Straaten, J., Maltby, E. & van Ierland, E.C. (2000). Ecological-economic analysis of wetlands: Scientific integration for management and policy. Ecological Economics, 35(1), 7–23.
Woodthorpe, R.G. (1897). Some Account of the Shans and Hill Tribes of the States on the Mekong. Journal of the Anthropological Institute of Great Britain and Ireland, 13-28.
Yee, K.M. (2014). A Geographical Analysis on the Distribution Patterns of Hotels and Inns within the Inlay Lake Area. Project paper, Dagon University.

35

36
© ICIMOD 2017International Centre for Integrated Mountain Development
GPO Box 3226, Kathmandu, Nepal
Tel +977 1 5003222 Fax +977 1 5003299
Email [email protected] Web www.icimod.org
ISBN 978 92 9115 514 9
Project funded by the European Union