a multi-site evaluation of reduced probation caseload size in an
TRANSCRIPT

The author(s) shown below used Federal funds provided by the U.S. Department of Justice and prepared the following final report: Document Title: A Multi-Site Evaluation of Reduced Probation
Caseload Size in an Evidence-Based Practice Setting
Author: Sarah Kuck Jalbert, William Rhodes, Michael
Kane, Elyse Clawson, Bradford Bogue, Chris Flygare, Ryan Kling, Meaghan Guevara
Document No.: 234596
Date Received: June 2011 Award Number: 2006-IJ-CX-0011 This report has not been published by the U.S. Department of Justice. To provide better customer service, NCJRS has made this Federally-funded grant final report available electronically in addition to traditional paper copies.
Opinions or points of view expressed are those
of the author(s) and do not necessarily reflect the official position or policies of the U.S.
Department of Justice.

This document is a research report submitted to the U.S. Department of Justice. This report has not been published by the Department. Opinions or points of view expressed are those of the author(s) and do not necessarily reflect the official position or policies of the U.S. Department of Justice.

Contents
Abstract ................................................................................................................................................. 1
Acknowledgements ............................................................................................................................... 3
Executive Summary ............................................................................................................................. 4
1. Chapter 1: Introduction ......................................................................................................... 13
2. Chapter 2: Background and Literature Review .................................................................. 15
3. Chapter 3: Research Questions and Study Design ............................................................... 18 3.1. Research Questions ......................................................................................................... 18 3.2. Modified Research Design .............................................................................................. 18 3.3. Site Screening and Selection ........................................................................................... 20
4. Chapter 4: Oklahoma City ..................................................................................................... 22 4.1. Overview ......................................................................................................................... 22 4.2. Establishing the Randomized Controlled Trial ................................................................ 22 4.3. Data and Measures .......................................................................................................... 24 4.4. Supervision Conditions ................................................................................................... 28 4.5. Methodology .................................................................................................................... 30 4.6. Analysis and Findings ..................................................................................................... 35 4.7. Discussion ........................................................................................................................ 38
5. Chapter 5: Polk County, Iowa ............................................................................................... 41 5.1. Data.................................................................................................................................. 41 5.2. Methodology .................................................................................................................... 42 5.3. Supervision Conditions ................................................................................................... 43 5.4. Analysis and Findings ..................................................................................................... 49 5.5. Discussion ........................................................................................................................ 55
6. Chapter 6: Colorado ............................................................................................................... 56 6.1. Supervision Conditions ................................................................................................... 56 6.2. Data and Measures .......................................................................................................... 60 6.3. Analysis and Findings ..................................................................................................... 62 6.4. Discussion ........................................................................................................................ 66
7. Conclusions and Policy Implications ...................................................................................... 67
References ........................................................................................................................................... 71
Abt Associates Inc. i
This document is a research report submitted to the U.S. Department of Justice. This report has not been published by the Department. Opinions or points of view expressed are those of the author(s) and do not necessarily reflect the official position or policies of the U.S. Department of Justice.

Abstract
Criminal justice researchers have studied caseload size to determine whether smaller caseloads improve
probation outcomes. With exceptions, the findings have been disappointing: Reduced probation officer
caseloads have not reduced criminal recidivism for high risk probationers and have increased revocation
rates. One explanation is that officers with reduced caseloads do not materially change their supervision
practices when caseloads are reduced—they either fail to achieve increased supervision intensity (control)
or fail to improve treatment intervention (correction), or both. This raises the question: Would reduced
caseloads improve supervision outcomes for medium to high risk offenders in a probation agency that
trains its officers to apply a balance of controlling and correctional/rehabilitative measures? The logic is
that the reduced caseload would allow probation officers to better deliver correctional interventions,
thereby reducing recidivism without unduly increasing revocations.
Our research answered this question in three purposefully selected probation agencies: Oklahoma City,
where we implemented a randomized controlled trial (RCT) experiment; Polk County, Iowa, where we
implemented a regression discontinuity design study (RDD), and four judicial districts in Colorado, where
we implemented a RDD. In Oklahoma City the RCT degenerated and the study team turned to a
difference in differences (DD) estimator.
The results showed that reducing probation officer caseloads can reduce criminal recidivism when
delivered in a setting where probation officers apply EBP. The two agencies (Oklahoma and Polk
County, Iowa) that fully implemented EBP showed improved outcomes for probationers supervised by
officers with smaller caseloads. The districts in Colorado had not fully implemented EBP and showed no
reduced criminal recidivism attributable to smaller caseloads.
Our results suggest that reduced caseloads, in combination with EBP, can lead to improved recidivism
outcomes. The DD estimator in Oklahoma showed a statistically significant decrease in criminal
Abt Associates Inc. 1
This document is a research report submitted to the U.S. Department of Justice. This report has not been published by the Department. Opinions or points of view expressed are those of the author(s) and do not necessarily reflect the official position or policies of the U.S. Department of Justice.

recidivism and a modest increase in technical revocation rates for probationers supervised by officers who
had reduced caseloads. Apparently officers with reduced caseloads were better able to identify treatment
needs among their clientele, and thus better able to direct resources to those most in need. Consequently,
reduced caseloads result in more efficient distribution of resources, and improved average probation
outcomes.
In Polk County, we found that intensive supervision with a small caseload reduces the likelihood of
criminal recidivism by 26% percent (p=.037) for all offenses, 39% (p=.037) for drugs, property and
violent offenses, and 45% (p=.023) for property and violent offenses (drug offenses excluded). For longer
periods of time, recidivism is reduced significantly for property and violent crimes, 37% at eighteen
months and 30 months respectively.
We found little evidence that caseload size and resource allocation practices in Colorado’s four largest
districts (excluding Denver) reduced the risk of recidivism for the highest risk probationers on general
supervision. We speculate that the lack of treatment effect is related to the low frequency of correctional
intervention for medium to high risk probationers, and that some core elements of EBP were not
implemented until the end of the ten year study period (2007), contributing to the relative lack of
treatment provision. The Department of Probation Services has since made considerable efforts to train
or retrain officers and add elements of responsivity to Districts’ operations. It may be that similar
analysis in two years will yield different findings.
This study did not demonstrate the efficacy of the full complement of evidence based practices.
Probation officers received equivalent training, so there was no counterfactual to use to evaluate EBP.
Nevertheless, the implication is that EBP mattered: the literature demonstrates that without EBP (or
similar supervision strategies) reduced caseloads do not reduce recidivism.
Abt Associates Inc. 2
This document is a research report submitted to the U.S. Department of Justice. This report has not been published by the Department. Opinions or points of view expressed are those of the author(s) and do not necessarily reflect the official position or policies of the U.S. Department of Justice.

Acknowledgements
Our team received a great deal of support from many people, particularly from the many probation officers, supervisors, administrators, and data managers at the Oklahoma Department of Corrections, the 5th Judicial District of Iowa Department of Correctional Services, and the Colorado State Judicial Branch Department of Probation Services. Kenny Holloway and Kristie Phillips, Sally Kreamer, and Eileen Kinney were instrumental in supporting this study in each of their respective organizations. Chris Hyde, Lettie Prell, and Kris Nash provided crucial data and guidance on how to use that data. We are grateful to the members of our advisory team and the Community Corrections Research Network, who gave thoughtful and useful commentary at multiple stages of the study. We are appreciative of the methodological guidance of Steve Kennedy, Jacob Klerman, Fatih Unlu, Lauren Olsho, and Doug McDonald of Abt Associates Inc. Finally, we wish to thank Marlene Beckman for initiating this research, Laurie Bright for seeing it through, and Dale Parent for the immeasurable contribution he has made to this study and many others.
Abt Associates Inc. 3
This document is a research report submitted to the U.S. Department of Justice. This report has not been published by the Department. Opinions or points of view expressed are those of the author(s) and do not necessarily reflect the official position or policies of the U.S. Department of Justice.

Executive Summary
Probation sentences involve monitoring sentenced offenders who remain in the community. In some
jurisdictions, a probation sentence follows suspension of a prison sentence, while in others probation is a
statutorily distinct sentencing option. Offenders placed on probation are required to comply with
conditions specified by sentencing judges. Violation of these conditions can result in sanctions, including
incarceration. The number of probationers has risen dramatically from 1.1 million in 1980 to over 4
million in 2008, although probation populations declined somewhat in 2009 (Bonczar and Glaze, 2010).
While recent reliable nationwide trend data on probation spending are unavailable, probation spending
has, in most jurisdictions, lagged behind rising probationer populations (DiMichele and Paparozzi, 2008;
Scott-Hayward, 2009). As a result, probation officer (PO) caseloads have grown dramatically over this
36 year period—although they declined somewhat in 2009 (Glaze and Bonczar, 2010).
Larger caseload sizes concern policymakers and practitioners primarily because POs are thought to be
less able to detect probation violations and to intervene with offenders effectively, thereby compromising
public safety. However, probationers are diverse in their criminal involvement, vary considerably in their
need for services and other resources, and respond differently to correctional programming. To make the
most effective use of increasingly limited supervision resources, many probation agencies have adopted
methods to target their resources on those high-risk offenders who are thought to be most responsive to
correctional programming. These methods are generally termed “evidence based practices” (EBP). The
core elements of EBP include having probation officers perform assessments to identify each offender’s
static and dynamic risk factors, use those risk factors to predict which offenders are likely to reoffend, and
then assign offenders to different levels of supervision according to assessed risk. Control and
correctional resources are concentrated on the high-risk offenders. In many jurisdictions, this assessment
process also leads to a case plan designed to address dynamic factors—such as use of illegal drugs—that
are assumed to contribute to the risk of reoffending.
Abt Associates Inc. 4
This document is a research report submitted to the U.S. Department of Justice. This report has not been published by the Department. Opinions or points of view expressed are those of the author(s) and do not necessarily reflect the official position or policies of the U.S. Department of Justice.

Supervision of general caseload offenders on probation and especially offenders assigned to smaller
caseload Intensive Supervision Probation (ISP) programs has historically been based on a surveillance
model (Skeem and Manchak, 2008; Paparozzi and Geandreau, 2005). Controlling strategies in such
programs include drug testing, the threat of reincarceration for rule violations, increased contact
frequency, and, more recently, monitoring via electronic devices like Global Positioning Systems.
Without abandoning control strategies, EBP is designed to incorporate correctional strategies into routine
supervision of probationers, and to focus the delivery of these interventions on the probationers who most
need and benefit from them. In practice, many agencies are in the process of adopting elements and
components of the therapeutic model while maintaining the surveillance model that has been in place for
decades (Skeem and Manchak, 2008, Burrell, 2005; Taxman, 2008), a hybrid that is palatable to adherents
of both perspectives. Without a reduction in the numbers of probationers they supervise, however,
probation officers often lack the time or discretion to implement this hybrid strategy into their daily
practice.
Previous studies have failed to link a simple caseload size to criminal recidivism. However, no previous
studies have evaluated the combined effects of reducing caseload size and implementing EBP. This study
addresses this question: Does criminal recidivism fall with reduced caseloads in an agency that uses
evidence based practices?
Research Questions and Study Design
The principal question addressed here is whether reduced caseloads improve probation outcomes in
agencies that have implemented evidence based practices (EBP). Answering this question assumes that
we can measure not only the size of caseloads and whether agencies have actually implemented evidence-
based practices, but also whether that implementation has resulted in true changes to the way probation
agencies allocate their resources—and supervise offenders. We therefore examine how officers in the
Abt Associates Inc. 5
This document is a research report submitted to the U.S. Department of Justice. This report has not been published by the Department. Opinions or points of view expressed are those of the author(s) and do not necessarily reflect the official position or policies of the U.S. Department of Justice.

study have implemented supervision strategies associated with EBP and if changes in outcomes are
observed over time as components of EBP are introduced.
The principal null hypothesis is that criminal recidivism is the same for offenders supervised by officers
with lower caseloads as it is for offenders supervised by officers with higher caseloads. The alternative
hypothesis is that criminal recidivism is lower for offenders supervised by officers with lower
caseloads. Based on the literature review, we use a one-tailed test of statistical significance to test this
null hypothesis.
A secondary null hypothesis is that revocations for technical violations are the same for offenders
supervised under ISP as they are for offenders supervised under high-normal supervision caseloads. The
alternative hypothesis is that revocations for technical violations are higher for offenders supervised
by officers with lower caseloads or under intensive supervision.
We sought to test these hypotheses using a randomized controlled trial in multiple agencies using EBP.
We planned to randomly assign probation officers to two caseload sizes: an experimental reduced
caseload and a regular caseload (the control condition). Although this approach would not provide
estimated treatment effects that generalized outside the three sites, it would provide empirical support for
the concept that reduced probation caseloads in conjunction with EBP could lead to improved probation
outcomes.
We performed an extensive search to identify sites that had actually implemented EBP. There was a
limited set of probation agencies from which we could choose. Several agencies implemented EBP in
special units or on a rolling basis with certain officers, but few had implemented EBP across the agency.
Of those few agencies, several had implemented EBP and were willing to participate but had inadequate
data systems for measuring outcomes and for documenting critical variables (for example, treatment
Abt Associates Inc. 6
This document is a research report submitted to the U.S. Department of Justice. This report has not been published by the Department. Opinions or points of view expressed are those of the author(s) and do not necessarily reflect the official position or policies of the U.S. Department of Justice.

episodes or offender assessment scores). Furthermore, many agencies that met the first two criteria had
insufficient sample sizes with which to implement a random control trial (RCT) with sufficient power to
estimate even a large treatment effect.
Another problem arose. Even among those agencies that met the above criteria and who supplied
preliminary agreements to participate in RCT, two were unwilling to devote the resources necessary to
fully execute RCT. In a third, the random assignment of officers and offenders initially progressed
smoothly, but eventually the control group of officers deteriorated due to attrition among officers.
The research team also proposed an alternative, rigorous quasi-experimental design using regression
discontinuity (RDD) for the sites unable to implement the RCT. For the site where RCT degenerated, we
replaced the RCT with a difference in differences (DD) design. We observed the outcomes for POs with
reduced caseloads and the outcomes for POs with traditional caseloads both before the experiment (when
both had the same caseloads) and after the experiment (when the former had reduced caseloads). The
inference about the effectiveness of reduced caseloads was based on the relative change in outcomes pre-
and post-reduced caseloads for the former and the latter POs.
This alternative design was implemented in two sites (one encompassing several separate jurisdictions)
and a difference-in-differences design was implemented in one site. RDD and RCT share a common trait
that is desirable to evaluators: they can both generate estimates of the average treatment effect with
minimum validity challenges (Shadish, Cook and Campbell, 2002).
Data
The study team collected administrative records from probation and corrections agencies and qualitative
data from officer and supervisor focus groups during site visits, reviews of taped supervision contacts
from participating probation officers, and interviews with agency administrators. In Oklahoma, the
Abt Associates Inc. 7
This document is a research report submitted to the U.S. Department of Justice. This report has not been published by the Department. Opinions or points of view expressed are those of the author(s) and do not necessarily reflect the official position or policies of the U.S. Department of Justice.

Oklahoma Department of Correction provided probation data for all supervision cases directly before and
during the reduced caseload intervention. Criminal history data was obtained through a query of arrest
records from the Oklahoma State Bureau of Investigation. In Polk County, the Iowa Department of
Correction provided a matched file of court filing and sentence data for all active probation cases for
2000-2007. In Colorado, the state Division of Probation Services provided the study team with a ten-year
cohort of probation data for all judicial districts in Colorado. The study team selected the districts with
sufficient sample to support the study.
Table E.S. 1 – Agencies Included in Study Agencies selected
Overall sample size* EBP Implementation
Data system Other factors
Polk County, Iowa
3254 Advanced; 5-7 years prior to study
Detailed; outcome data available from state DOC
Agency unable to commit to RCT; RDD implemented
Oklahoma City, OK
4931 Recent; 1 year prior to study
Detailed; outcome data available through state query
Agency willing to commit to RCT; RCT implemented but deteriorated
Colorado District A 7,276 District B 8,383 District C 7,102 District D 8,349
Longstanding; early adopter; practices deteriorated, EBP not fully implemented at time of study (2007)
Adequate; outcome data available from state probation department
Agency unable to implement RCT in any district; RDD implemented
*Cases available and included in analysis
Findings
In Oklahoma City, this study found that:
• Probation officers applied EBP and concentrated control and correctional resources on high-risk
offenders.
o Probation officers used risk assessment instruments to assign probationers to active or
administrative supervision.
Abt Associates Inc. 8
This document is a research report submitted to the U.S. Department of Justice. This report has not been published by the Department. Opinions or points of view expressed are those of the author(s) and do not necessarily reflect the official position or policies of the U.S. Department of Justice.

o Smaller caseloads (average of 54 during the study period) were about half the size of
regular caseloads (average of 106 during the study period).
o Probation officers with smaller caseloads made more frequent supervision contacts with
probationers.
o Probationers supervised by officers with reduced caseloads were more likely to receive
correctional interventions.
• Probation outcomes generally improved.
o Probationers supervised by officers with reduced caseload had a higher rate of revocation
for technical violations, but that rate was very low (5%).
o Probationers supervised by officers with reduced caseloads had a lower rate of arrests for
new crimes.
In Polk County, this study found that:
• Probation officers applied EBP and concentrated control and correctional resources on high-risk
offenders.
o Officers consistently used risk assessment instruments to assign high-risk probationers to
smaller caseloads.
o Smaller caseloads were about 60 percent as large as regular caseloads; ISP caseloads
allow POs to spend about 1.7 hours for intensively supervised probationers per hour spent
on probationers supervised under high-normal caseloads.
o Probation officers with smaller caseloads made more frequent supervision contacts with
probationers.
o Probationers supervised by officers with reduced caseloads were more likely to receive
correctional interventions.
Abt Associates Inc. 9
This document is a research report submitted to the U.S. Department of Justice. This report has not been published by the Department. Opinions or points of view expressed are those of the author(s) and do not necessarily reflect the official position or policies of the U.S. Department of Justice.

• Probation outcomes generally improved.
o Probationers supervised by officers with reduced caseloads had revocation rates for
technical violations that were about the same as revocation rates for comparable
probationers supervised under regular caseloads.
o Probationers supervised by officers with reduced caseloads had a lower rate of arrests for
new crimes.
In Colorado, the study found:
• At the time of the study, Colorado had not fully implemented EBP.
• There was no improvement in outcomes for offenders supervised by officers with reduced caseloads.
The findings are suggestive. In the two probation offices that implemented evidence-based practices,
reduced caseloads led to improved probation outcomes. In the probation office that had not fully
implemented evidence-based practices, reduced caseloads did not improve probation outcomes. Our
results indicate that EBP has potential salutary effects on probation outcomes. However, our study team’s
extensive search for agencies with fully implemented EBP leads us to caution that the implementation
challenges for agencies seeking to establish EBP may ultimately limit the success of such practices.
Abt Associates Inc. 10
This document is a research report submitted to the U.S. Department of Justice. This report has not been published by the Department. Opinions or points of view expressed are those of the author(s) and do not necessarily reflect the official position or policies of the U.S. Department of Justice.

Table E.S.2 – Outcomes
Agencies selected Study methodology Supervision contact
intensity Treatment Provision
Change in recidivism
Polk County, Iowa Regression discontinuity design
Increased with smaller caseload
Similar for high intensity supervision and regular caseload probationers*
Likelihood of recidivism significantly reduced for higher intensity supervision probationers
Oklahoma City, OK Random assignment with difference in difference estimator
Increased with smaller caseload
Increased treatment needs identified and treatment provision with smaller caseload
Likelihood of recidivism significantly reduced for low caseload
Colorado Regression discontinuity design
Increased in most districts with smaller caseload
Increased treatment episodes in two districts; two districts similar
No reduction in recidivism for higher intensity supervision probationers
*Although mean rates of treatment provision were similar across supervision intensities, treatment type varied.
Limitations
We are tempted to conclude that this study is proof that EBP reduces recidivism. We cannot as we did
not test the effectiveness of EBP per se; we tested the effect of reduced caseloads on recidivism within the
context of an agency that has implemented EBP. We have found that increased supervision intensity and
reduced caseloads in two agencies using EBP led to significant reductions in the risk of recidivism for
medium and high risk probationers. The findings support further investigation into how EBP works and
rigorous tests of the effectiveness of the components of EBP.
Regression discontinuity design (RDD) and difference-in-differences design are strong quasi-
experimental designs that use administrative records to answer research questions. While we believe the
findings we report in our study are credible, we understand that no study based on observational data can
fully overcome validity challenges.
Abt Associates Inc. 11
This document is a research report submitted to the U.S. Department of Justice. This report has not been published by the Department. Opinions or points of view expressed are those of the author(s) and do not necessarily reflect the official position or policies of the U.S. Department of Justice.

Implications for Practitioners and Researchers
This study has several implications for researchers and practitioners:
• Reduced caseloads and increased supervision intensity for medium and high risk probationers
reduced recidivism in two agencies using Evidence Based Practices for probation supervision.
• We speculate, based on the deterioration of the high-caseload control group in Oklahoma City,
that smaller caseloads may be a useful tool for probation officer job retention.
• Treatment needs and treatment provision in Oklahoma City were higher for probationers
supervised by reduced caseload officers. We believe this finding indicates that study officers with
reduced caseloads were better able to identify treatment needs among their clientele, and thus
better able to direct resources to those who need intervention most. Apparently, reduced
caseloads result in more efficient distribution of resources and improved average probation
outcomes.
• Our difficulties in identifying sites with sufficiently implemented EBP to support the study
despite extensive screening suggest the need for comprehensive research on EBP implementation.
In particular, there is a need for researchers to investigate the gaps between practitioner
understanding of implementation and program planners’ intent for EBP programming.
• This study demonstrates that regression discontinuity research methods can be useful in
estimating the impact of programming on recidivism in probation populations. This is valuable
because RDD is readily applied in probation agencies that use risk assessment tools to assign
offenders to high- and low-risk probation categories.
Abt Associates Inc. 12
This document is a research report submitted to the U.S. Department of Justice. This report has not been published by the Department. Opinions or points of view expressed are those of the author(s) and do not necessarily reflect the official position or policies of the U.S. Department of Justice.

1. Chapter 1: Introduction
Since its early origins in America, the purpose of probation has been to accomplish different crime control goals at the same time. Probation aims to control supervised offenders by monitoring to detect restricted behavior, sanctioning violations of release conditions, and directing various rehabilitative services to offenders in hopes of reducing the likelihood of reoffending. Probation officers are asked to wear two hats—that of the law enforcement officer and that of the social worker. Indeed, probation was seen as the social work arm of local courts. In practice, however, there has existed a chronic tension between the surveillance/control objectives and the social service/rehabilitative objectives. This tension has become more pronounced as the courts’ demands for probation resources have increased. Probation sentences involve monitoring sentenced offenders who remain in the community. In some jurisdictions, a probation sentence follows suspension of a prison sentence, while in others probation is a statutorily distinct sentencing option. Offenders placed on probation are required to comply with conditions specified by sentencing judges. Violation of these conditions can result in sanctions, including incarceration. The number of probationers has risen dramatically from 1.1 million in 1980 to over 4 million in 2008, although probation populations declined somewhat in 2009 (Bonczar and Glaze, 2010). While recent reliable nationwide trend data on probation spending are unavailable, probation spending has, in most jurisdictions, lagged behind rising probationer populations (DiMichele and Paparozzi, 2008; Scott-Hayward, 2009). As a result, probation officer (PO) caseloads have grown dramatically over this 36 year period. Larger caseload sizes concern policymakers and practitioners primarily because POs are thought to be less able to detect probation violations and to intervene with offenders effectively, thereby compromising public safety. However, probationers are diverse in their criminal involvement, vary considerably in their need for services and other resources, and respond differently to correctional programming. To make the most effective use of increasingly limited supervision resources, many probation agencies have adopted methods to target their resources on those high-risk offenders who are thought to be most responsive to correctional programming. These methods are generally termed “evidence based practices” (EBP). The core elements of EBP include having probation officers perform assessments to identify each offender’s static and dynamic risk factors, use those risk factors to predict which offenders are likely to reoffend, and then assign offenders to different levels of supervision according to assessed risk. Control and correctional resources are concentrated on the high-risk offenders. In many jurisdictions, this assessment process also leads to a case plan designed to address dynamic factors—such as use of illegal drugs—that are assumed to contribute to the risk of reoffending. As discussed below in greater detail, scientific studies have failed to link a simple caseload size to criminal recidivism. However, none have evaluated the combined effects of reducing caseload size and implementing EBP. This study addresses this question: Does criminal recidivism fall with reduced caseloads in an agency that uses evidence based practices? In addition to the substantive research question, a portion of this study is important as a methodology study for program evaluators. The demands of public safety, limited resources available for evaluation, and the reality of criminal sentencing often limit evaluations to observational studies. Regression discontinuity is a rigorous methodology that can be employed in many settings without disrupting established correctional sentencing and programming practices. Many evaluators will be eager to take advantage of this methodology as an alternative or complement to random control trials, especially as
Abt Associates Inc. 13
This document is a research report submitted to the U.S. Department of Justice. This report has not been published by the Department. Opinions or points of view expressed are those of the author(s) and do not necessarily reflect the official position or policies of the U.S. Department of Justice.

offender triage using standard offender assessment and classification becomes the norm in community corrections agencies. This report presents results from three distinct studies: a random experiment in Oklahoma City, Oklahoma, a regression discontinuity study in Polk County, Iowa (Des Moines), and a regression discontinuity study in four judicial districts in Colorado. Each probation agency provides a different context for studying whether close supervision of offenders using techniques associated with Evidence Based Practice in probation reduces recidivism. There is some important information about Evidence Based Practice and reduced caseloads that readers of this report should keep in mind: EBP refers to those supervision practices and techniques that are commonly associated with the “What Works” literature. These practices are designed to identify offender risks (for example, prior criminal record or age) and address offender needs (drug treatment, violence intervention). This study will show that probation agencies that practiced EBP and reduced caseloads of high risk offenders both concentrated correctional programming on high risk offenders and reduce the rate of their recidivism.
Abt Associates Inc. 14
This document is a research report submitted to the U.S. Department of Justice. This report has not been published by the Department. Opinions or points of view expressed are those of the author(s) and do not necessarily reflect the official position or policies of the U.S. Department of Justice.

2. Chapter 2: Background and Literature Review
Probation is an alternative to prison or jail; offenders are sentenced to a term of supervision during which they must follow certain rules or risk incarceration for the remainder of their terms. Supervision can vary considerably in intensity, ranging from little to no supervision for very minor offenders to intensive monitoring and strict restrictions of activity for high-risk offenders. Evidence Based Practice (EBP) refers to the collected strategies described in the “What Works” body of literature. What Works research has attempted to demonstrate that there is value in rehabilitation, both from a policy and fiscal standpoint. Correctional strategies include skills training, provision of ancillary social services, drug and alcohol treatment, and behavior modification. Evidence shows that therapeutic strategies can reduce recidivism, particularly when targeted to the appropriate offenders (Paparozzi and Gendreau, 2005; Lowenkamp and Latessa, 2005). Supervision of general caseload offenders on probation and especially offenders assigned to smaller caseload Intensive Supervision Probation (ISP) programs has historically been based on a surveillance model (Skeem and Manchak, 2008; Paparozzi and Geandreau, 2005). Controlling strategies in such programs include drug testing, the threat of reincarceration for rule violations, increased contact frequency, and, more recently, monitoring via electronic devices like Global Positioning Systems. Without abandoning control strategies, EBP is designed to incorporate correctional strategies into routine supervision of probationers, and to focus the delivery of these interventions on the probationers who most need and benefit from them. In practice, many agencies are in the process of adopting elements and components of the therapeutic model while maintaining the surveillance model that has been in place for decades (Skeem and Manchak, 2008, Burrell, 2005; Taxman, 2008), a hybrid that is palatable to adherents of both perspectives. Without a reduction in the numbers of probationers they supervise, however, probation officers often lack the time or discretion to implement these strategies into their daily practice. In theory, reduced caseloads allow POs to provide adequate control and correctional interventions to high-risk offenders who otherwise would receive inadequate supervision and support. Early reduced-caseload implementation and research were designed to determine ideal caseload sizes, where the criterion was reducing prison populations by supervising higher-level offenders in the community (Clear and Hardyman, 1990). By design, ISP officers have smaller caseloads, with the intent that supervision contacts occur more frequently, rule violations and bad behaviors are identified more quickly, and public safety is maintained. Less risky offenders (or those less likely to recidivate based on their risk profile) are assigned to POs who maintain regular caseloads. Expectations were that spending comparatively more resources on those with the highest likelihood of reoffending and fewer resources on those less likely to reoffend would reduce criminal recidivism. Experiments with ISP were failures, both organizationally and in terms of probation outcomes for two primary reasons: some programs were not in fact delivering increased interaction or treatment provision despite smaller caseloads (Petersilia, 1999); others increased supervision intensity, which led to increased technical violations for behaviors that would not be considered criminal except for supervision status (Petersilia, 1999; Paparozzi and Gendreau, 2005; Skeem and Manchak, 2008). Typically, assignment to intensive supervision was not rule-driven, even in agencies that used assessments to determine risk of recidivism (Clear and Hardyman, 1990). As a result, offenders with low and moderate risk of recidivating were placed on ISP caseloads and introduced to increased surveillance and control intended
Abt Associates Inc. 15
This document is a research report submitted to the U.S. Department of Justice. This report has not been published by the Department. Opinions or points of view expressed are those of the author(s) and do not necessarily reflect the official position or policies of the U.S. Department of Justice.

Abt Associates Inc. 16
for much more serious offenders. Much of the research found no relationship between this increased supervision and reduced recidivism (Byrne & Kelly, 1989; Noonan, & Latessa, 1987; Taxman, 2002). In a meta-analysis of 47 studies on ISP, Gendreau et al. (2000) found that on average, offenders in the ISP programs had higher recidivism rates than their counterparts. In a more recent meta-analysis of random assignment evaluations of criminal justice programs, Farrington and Welsh (2005) found no effect on recidivism attributable to supervision on an ISP caseload. Further, treatment provision for those who did not need it (i.e. low level offenders) produced negative outcomes (Clear and Hardyman, 1990; Lowenkamp and Latessa, 2005). There were, however, exceptions to these results. Two ISP programs implemented and evaluated during the “get tough” era of probation demonstrated significantly reduced recidivism rates in New Jersey (Pearson, 1987) and significantly reduced recidivism among officers who demonstrated highly effective supervision skills in Massachusetts (Byrne, 1990; Byrne and Kelly, 1989). The New Jersey program integrated a rehabilitative model into its broader law enforcement purpose and achieved a significant reduction in recidivism among high-risk probationers (Pearson, 1987; Pearson and Harper, 1990). The Massachusetts program showed that recidivism was inversely related to the supervising officers’ higher rating on a “supervision index” of factors that combined treatment practices such as supervision contact, brokerage-style supervision, with systemic responses to violations and strict enforcement of probation conditions (Byrne, 1990). Paparozzi and Gendreau (2005) observed similar reductions in recidivism when high-risk parolees received treatment and were supervised by officers who balanced enforcement strategies with support for rehabilitation. This evidence suggests that intensive control strategies can be effective if they are focused on the correct offenders and if they are balanced with correctional strategies. Many jurisdictions allow probation departments to determine the intensity of offenders' supervision.1 Levels of supervision and definitions of supervision intensity vary considerably across jurisdictions, but in general they can be grouped into four categories:
• Administrative: Minimally supervised; PO is reactive rather than proactive. • Minimum or Low: Supervision conducted by mail, phone, or some combination. Little face-
to-face contact. • Medium-High: More regular contact; may include programming targeted to offenders’
identified issues, for example drug and alcohol treatment and random drug testing, require regular office visits, may include home visits.
• Intensive: Regular monitoring by an officer with a reduced caseload, mandatory treatment programming, follow-up with family members, drug testing, etc.
EBP is designed to address allocation issues by determining what works to improve offender outcomes by classifying offenders according to risk of recidivism and identifying needs, and by developing control and correctional interventions tailored to meet the individual needs of probationers (Joplin, Bogue, et al, 2004). Meeting these needs, EBP advocates theorize, will reduce risk of recidivism, thereby reducing the social and economic costs of new crimes. The shift to EBP-based therapeutic models means that significant changes have taken place in ISPs and in how offenders are assigned to ISPs. Today many agencies assign levels of supervision based on a
1 Offenders with special considerations are often exempted from this discretion, and receive a judicially
mandated level of supervision
This document is a research report submitted to the U.S. Department of Justice. This report has not been published by the Department. Opinions or points of view expressed are those of the author(s) and do not necessarily reflect the official position or policies of the U.S. Department of Justice.

Abt Associates Inc. 17
spectrum of factors, though primarily relying upon a quantitative score from a risk/needs assessment and case planning implements rational use of control and correctional resources. Three principles associated with the treatment model described above have been widely applied to programming in probation, often under different monikers but generally described similarly:
• Risk Principle: target the offenders at highest risk of recidivating; offenders most in need of treatment.
• Need Principle: address the specific needs of offenders to identify how to intervene in their lives.
• Responsivity Principle: determine the best method of delivering treatment, generally thought to be through a cognitive behavioral treatment (CBT) orientation (Lipsey et al, 2001).
The broad introduction of these principles in probation departments across the country has influenced day-to-day case management, supervision monitoring, and officer/offender interaction and engagement during supervision contacts. To address the risk principle, many departments have introduced case assessment and triaging (assignment of resources to offenders at higher risk for recidivism). Departments have used third-generation2 assessment tools to identify variable or dynamic needs that can be matched with treatment resources. Several studies have demonstrated that programs utilizing the risk principle to assign offenders to correctional programming have lower rates of recidivism (Lowenkamp, Latessa, and Holsinger, 2006; Lowenkamp and Latessa, 2004.) To achieve responsivity, departments must deliver treatment that can be flexible depending on the offender’s needs, abilities, and communication techniques. Motivational Interviewing (MI) and cognitive behavioral therapeutic interventions (Bourgon & Armstrong, 2005; Dowden & Andrews, 2004) have been shown to be effective with offenders in general (Lipsey, 1995). However, these interventions have not been rigorously tested in a probation supervision environment and some question whether POs and their supervisors have sufficient training and opportunity to effectively use MI and CBT techniques with offenders (Burke, Dunn, Atkins and Phelps, 2004). Further, the fidelity of day-to-day supervision practices with the EBP model is believed to be inconsistent in many probation departments. In summary, probation supervision models have changed substantially since the implementation of “get tough” ISP programs, and these changes may result in different outcomes for probationers supervised on small, intensive caseloads. The question remains, however: what difference does a smaller caseload make in the effectiveness of supervision? Do targeted, responsive, and therapeutic interventions combined with monitoring and sanctioning lead to better outcomes when officers have fewer offenders to supervise? Does a smaller caseload in fact lead to increased contact frequency, and does that frequency result in better provision of services or better outcomes?
2 Third-generation assessment tools take into account both the actuarial risk of offenders’ recidivating and the
dynamic or changeable psycho-social dimensions that theoretically may be improved to positively affect recidivism risk (Taxman, 2006).
This document is a research report submitted to the U.S. Department of Justice. This report has not been published by the Department. Opinions or points of view expressed are those of the author(s) and do not necessarily reflect the official position or policies of the U.S. Department of Justice.

3. Chapter 3: Research Questions and Study Design
This chapter has three sections. The first section presents the research questions that concern this evaluation. The second section summarizes the methodology used to answer those research questions. The third section explains how we selected the study sites. 3.1. Research Questions
The principal question addressed here is whether reduced caseloads improve probation outcomes in districts that have implemented evidence based practices (EBP). Answering this question assumes that we can measure not only the size of caseloads (which is not as straightforward as one might assume) and whether or not agencies have actually implemented evidence-based practices, but also whether that implementation has resulted in true changes to the way probation agencies allocate their resources, and the way officers supervise the offenders on their caseloads. We therefore examine how officers in the study have implemented supervision strategies associated with EBP and if changes in outcomes can be observed over time as components of EBP are introduced. The principal null hypothesis is that criminal recidivism is the same for offenders supervised by officers with lower caseloads as it is for offenders on intensive supervision or supervised by officers with higher caseloads. The alternative hypothesis is that criminal recidivism is lower for offenders supervised under intensive supervision, or by officers with lower caseloads. Based on the literature review, we use a one-tailed test of statistical significance to test this null hypothesis. A secondary null hypothesis is that revocations for technical violations are the same for offenders supervised under ISP as they are for offenders supervised under high-normal supervision caseloads. The alternative hypothesis is that revocations for technical violations are higher for offenders supervised by officers with lower caseloads or under intensive supervision. 3.2. Modified Research Design
We sought to test the hypotheses using a randomized controlled trial in multiple agencies using EBP. We planned to randomly assign probation officers to two caseload sizes: an experimental reduced caseload and a regular caseload (the control condition). Although this approach would not provide estimated treatment effects that generalized outside the three sites, it would provide empirical support for the concept that reduced probation caseloads in conjunction with EBP could lead to improved probation outcomes. We performed an extensive search to identify sites that had actually implemented EBP. There was a limited set of probation agencies from which we could choose. Several agencies implemented EBP in special units or on a rolling basis with certain officers, but few had implemented EBP across the agency. Of those few agencies, several had implemented EBP and were willing to participate but had inadequate data systems for measuring outcomes and for documenting critical variables (for example, treatment episodes or offender assessment scores). Furthermore, many agencies that met the first two criteria had
Abt Associates Inc. 18
This document is a research report submitted to the U.S. Department of Justice. This report has not been published by the Department. Opinions or points of view expressed are those of the author(s) and do not necessarily reflect the official position or policies of the U.S. Department of Justice.

insufficient sample sizes with which to implement a random control trial (RCT) with sufficient power to estimate a large treatment effect. Another problem arose. Even among those agencies that met the above criteria and who supplied preliminary agreements to participate in RCT, two were unwilling to devote the resources necessary to fully execute RCT. In a third, the random assignment of officers and offenders initially progressed smoothly, but eventually the control group of officers deteriorated due to attrition among officers. We replaced the RCT with a difference in differences (DD) design. We observed the outcomes for POs with reduced caseloads and the outcomes for POs with traditional caseloads both before the experiment (when both had the same caseloads) and after the experiment (when the former had reduced caseloads). The inference about the effectiveness of reduced caseloads was based on the relative change in outcomes pre- and post-reduced caseloads for the former and the latter POs. The research team also proposed an alternative, rigorous quasi-experimental design using regression discontinuity (RDD) for the sites unable to implement the RCT. This alternative design was implemented in two sites (one encompassing several separate jurisdictions) and a difference-in-differences design was implemented in one site. RDD and RCT share a common trait that is desirable to evaluators: they can both generate unbiased estimates of the average treatment effect with varying degrees of efficiency (Shadish, Cook and Campbell, 2002). RCT remains the gold standard of program evaluation and offers the best opportunity for understanding program effects. However, regression discontinuity design (RDD) is increasingly used in program evaluation (Hahn, Todd, & van der Klauuw, 2001; van der Klaauw, 2002; Imbens & Lemieux, 2007; Lee & Lemieux, 2009). Although RDD has sometimes been used in criminal justice evaluations (Lee & Lemieux, 2009), application has been infrequent. This is unfortunate because criminal justice settings often lend themselves to use of RDD—RCT is often infeasible due the demands of public safety, limited resources available for evaluation, and the reality of criminal sentencing. Probation agencies that use risk assessment tools to assign offenders to distinct supervision intensities appear to be particularly attractive candidates for RDD application. A strength of the RDD lies in the testability of underlying assumptions. This is in contrast to other quasi-experimental designs (such as regressions with control functions, propensity scores and instrumental variables) that rest on strong and typically untestable assumptions. Another strength is its intuitive appeal. The inference about treatment effectiveness is based on a comparison of the outcomes for offenders who are at the margins: those offenders who just failed to qualify for ISP and those offenders who just qualified for ISP. Many evaluators also consider the difference-in-differences estimator to be a strong quasi-experimental estimator (Bertrand, Duflo and Mullainathen, 2004; Abadie, 2005, Cameron and Trivedi, 2005, Imbens and Wooldridge, 2009). In the site where we implemented a RCT, we asked probation officers to volunteer for an experiment where some would receive reduced caseloads and the others would maintain traditional caseloads. A minority of POs volunteered, so the findings would not generalize to the broad population of POs. Moreover, many volunteers who were assigned to the control condition moved to administrative assignments, so the power of a RCT was unacceptably low.
Abt Associates Inc. 19
This document is a research report submitted to the U.S. Department of Justice. This report has not been published by the Department. Opinions or points of view expressed are those of the author(s) and do not necessarily reflect the official position or policies of the U.S. Department of Justice.

3.3. Site Screening and Selection
Selecting and engaging participant sites for this study presented unanticipated challenges. The study team screened over two dozen sites (see Appendix Table A) to determine their eligibility and appropriateness for the study. Sites were first screened via interviews and agency documentation for general eligibility. Critical criteria for eligibility in the study were a sufficient sample size of probationers and probation officers; adequate progress made in implementation of EBP; minimum data availability; and general willingness to participate. Sites that met these initial criteria were invited to participate in a more rigorous screening process. Table 3.1 – Agencies Included in Study
Agencies selected Overall sample size* EBP Implementation Data system Other factors Polk County, Iowa 3254 Advanced; 5-7 years
prior to study Detailed; outcome data available from state DOC
Agency unable to commit to RCT; RDD implemented
Oklahoma City, OK 4931 Recent; 1 year prior to study
Detailed; outcome data available through state query
Agency willing to commit to RCT; RCT implemented
Colorado District A 7,276 District B 8,383 District C 7,102 District D 8,349
Longstanding; early adopter
Adequate Agency unable to implement RCT in any district; RDD implemented
*Cases available for analysis Detailed site screening criteria • Demographic information
o Population of jurisdiction o # eligible probation intakes in jurisdiction per year o # medium and high risk offenders under supervision o # probation officers o Average probation caseload o Can site produce N's to support design?
• Leadership/organizational climate o Where in political cycle? o Branch of government probation is under o Will branch leadership remain consistent over 3 years? o Overall political support for EBP o Agency's recent history of funding o Probation leadership remain consistent over 3 years o Agency or CJ leaders support random assignment to populate treatment groups
• Staff and resources o Agency/staff/union support assignment of PO's to different caseloads o Staff/administration relations ok?
Abt Associates Inc. 20
This document is a research report submitted to the U.S. Department of Justice. This report has not been published by the Department. Opinions or points of view expressed are those of the author(s) and do not necessarily reflect the official position or policies of the U.S. Department of Justice.

o Agency leaders and funder relations ok? o Agency ready to dedicate resources to project o Turnover rate of supervision staff?
• Has site implemented elements of EBP in probation supervision o Risk/needs assessment o Separate specialized caseloads for DV, sex offender, mental health, etc. o Reduced general supervision caseloads, compared to pre-EBP o Concentrate services/treatment on assessed dynamic risks of medium and high-risk
probationers o Consider responsivity (cognitive behavioral programs, motivate change) o Comprehensive case-management o Progress of EBP can be divided into T1 (pre-EBP), T2 (transition), and T3 (EBP
implemented) o Can measure proportion of officers using EBP? o Infrastructure to manage EBP/reduced caseload supervision o Investment in training staff on EBP (anything left to do?) o How quality of contact measured? Does site use performance-based management to
monitor and improve EBP implementation o What improvements contemplated/needed?
• Research concerns o Does probation agency have a well-populated database o Can aggregate and case-level data be extracted and analyzed at multiple periods? o Is research staff available to support extraction and analysis? o History of research collaboration o Does site track probationer recidivism? For how long?
Several sites chose not to continue in the selection process during screening. Of the sites that participated in the more detailed screening process, several were deemed best candidates. The study team visited each of the best candidate sites, and extended invitations to three to participate in the random control trial. Two of these three declined due to resource limitations and changes in administration. Recruitment began again, and several more sites were screened, with two further invitations. One site declined this round of invitations, and another felt it was unable to implement the RCT study due to impending budget and physical plant changes. Subsequently, the study team explored implementing an alternative design in two agencies, given the inability and unwillingness of candidate agencies to participate in the RCT. We believe the problems the team encountered during the screening process are informative for other research efforts focused on the implementation of EBP in probation agencies. We learned that, at least at the time of the study, there was considerable variation between what sites considered to be full implementation of EBP and what our study team considered full implementation. The results of our extensive screening suggest the need for comprehensive research on EBP implementation and the gaps between practitioner understanding of implementation and program planners’ intent for EBP programming.
Abt Associates Inc. 21
This document is a research report submitted to the U.S. Department of Justice. This report has not been published by the Department. Opinions or points of view expressed are those of the author(s) and do not necessarily reflect the official position or policies of the U.S. Department of Justice.

4. Chapter 4: Oklahoma City
4.1. Overview
The evaluation in Oklahoma began with a randomized controlled trial (RCT). Consistent with the requirements of Abt Associates’ institutional review board (IRB), probation officers volunteered for an experiment. About half the volunteers were assigned to an experimental condition (reduced caseload POs); the rest were assigned to a control condition (control POs); and those who did not volunteer comprised a comparison group (regular caseload POs). The treatment POs had reduced caseloads (about 54 offenders per officer) and the control and comparison POs together had regular caseloads (about 106 offenders per officer). Over time the experiment degenerated as many of the control POs accepted administrative positions, so a test of outcomes for the reduced caseload and control POs would have lacked both validity and power. Consequently, the study combined the control and comparison POs into a single comparison PO group and applied a difference-in-differences estimator to study treatment effects. We established the RCT after determining that Oklahoma City had sufficiently implemented EBP to provide the necessary context for the study. Once the presence of EBP was established, we tested these research questions:
• How did criminal recidivism vary with probation officer caseload size? • How did revocations for violations of the conditions of supervision vary with probation
officer caseload size? 4.2. Establishing the Randomized Controlled Trial
In April of 2007, the study team began implementation of the RCT study design in Oklahoma City. The team presented the research plan to line officers, supervisors and administrators, and followed these on-site presentations with a series of conference calls to answer questions from officers. Given the risks to officers’ working conditions and job performance ratings, all officers were given information about the study, the potential risks of participating in the study, and were asked to give written consent to volunteer. We also asked that officers consider their immediate career plans prior to volunteering, as retirements or attrition would affect the composition of the caseload groups. After several rounds of calls and introductions, we assembled a pool of 27 volunteer officers. Non-volunteer officers conducted supervision business as usual, although caseloads for these officers rose somewhat during the study period, an anticipated consequence of the study. Officers were assigned at random to one of two groups: the experimental group in which officers would have caseloads of about 50 probationers per officer, and a control group in which officers would have caseloads about twice that size. The logic of this random assignment is that certain officers may be more effective than others in supervising probationers because of their prior experience, temperament, interpersonal skills, or motivation. To minimize the chances of having these more effective POs disproportionately represented in one or the other groups, thereby “stacking the deck” against finding an effect attributable to caseload size, random assignment procedures were used to ensure, to the maximum extent possible, that the distributions of more and less effective officers in the two comparison groups are comparable. Comparability increases with the number of subjects to be assigned, but because there was a
Abt Associates Inc. 22
This document is a research report submitted to the U.S. Department of Justice. This report has not been published by the Department. Opinions or points of view expressed are those of the author(s) and do not necessarily reflect the official position or policies of the U.S. Department of Justice.

Abt Associates Inc. 23
small pool of volunteer officers, there was a significant risk of having slightly different distributions of more effective officers in one or the other group. This situation reduces the statistical power for the analysis. Therefore, to improve statistical power, we sought to measure probation officer effectiveness in preventing recidivism and to incorporate this information into the random assignment procedure. We first assembled a data file comprising all terminated cases and open cases, and we identified the officers assigned to these cases. We then estimated, for each of the 27 volunteering officers, their relative effectiveness in preventing probationer recidivism. This was done using a statistical model (a survival model) that accounted for differences in the probationers’ composite risk scores and the length of time under supervision for each case. We calculated the time to failure as the length of time from the start of supervision to the time of revocation or other negative or unknown outcome; open cases were treated as censored.3 Some cases had supervision outcomes that were neutral (i.e., death) or unclear (unknown or listed as “other”); Model 1 treated these outcomes as positive, Model 2 as failures. We used the assumption for Model 2 as our operating definition of the failure rate and used the parameter estimates to stratify and randomly assign officers within each stratum to the treatment or control caseload.4 We assigned the South Office its own stratum (Stratum 8), as the number of officers available for random assignment was limited to two. For each stratum, the officer with the highest random number was assigned to the treatment condition to ensure that officers with varying effectiveness were assigned to the treatment and control groups. Officers were notified of their assignment status by letter. After assigning officers to the experimental or control groups, we created different caseloads that defined the experimental and control group conditions. Officers in the experimental group shifted randomly selected offenders off their active caseloads to achieve a caseload of 50. Officers were allowed to keep a small number of offenders on their caseload who were nearing the end of their probation sentence (within three months). Any other randomly selected case was shifted to a control group officer. Officers, supervisors, and administrators at the agency completed six steps to transition cases from the treatment caseloads:
1. The supervisor reviewed the officer’s total caseload and determined the number of active cases that the officer was carrying.
2. The supervisor subtracted 50 from the total number of cases, to determine the number of cases to be moved (for example, for a caseload of 85, the number of cases to be moved is 35).
3. The supervisor reviewed the caseload and removed those cases that fit the override criteria. 4. In order to guide the removal, supervisors calculated a ratio (N) of eligible cases to be moved.
For example, for a caseload of 85, in which 5 cases fit the override criteria, there is a ratio of 80 to 35. The study team assisted with calculating ratios when necessary.
5. The eligible cases were sorted by start date and the supervisor selected every Nth case according to the ratio.
6. Transfer notifications took place according to the department’s policy.
3 When an observation in the data is “censored” it is removed from the analysis because of an event. Some
censoring events common in survival analysis of probation data are revocations or new arrests. 4 Officers who volunteered for the study were included in both Models 1 and 2, though several were removed due to
insignificant numbers of failure events, or in one case, a total lack of data from an officer new to the agency. As a result, of the 27 officers who volunteered, 22 were included in Models 1 and 2.
This document is a research report submitted to the U.S. Department of Justice. This report has not been published by the Department. Opinions or points of view expressed are those of the author(s) and do not necessarily reflect the official position or policies of the U.S. Department of Justice.

After we established capped caseloads for the treatment officers, the study team implemented procedures to randomize assignments of new probation cases to treatment and comparison officers. The process was not significantly different from the extant assignment process, in which the assignment officer first identified the geographic office a probationer was to be supervised and then sequentially assigned each new probationer to officers. The study assignment process required every nth general supervision case to be assigned to the treatment condition, based on a ratio calculated using the flow of offenders through the assignment office. Risk assessments are conducted within 30 days of assignment, with low risk cases removed from the active supervision pool post-assessment. Low risk cases were thus part of treatment and control caseloads for short periods of time, but removed post-assessment. Probation caseloads are not static; thus we allowed some flexibility in the numbers of cases treatment officers were permitted to have on their active caseload at any given point in time. The ideal cap was 50 cases, though we allowed fluctuations as high as 55. The average treatment officer caseload was 54 during the study period, and the average comparison officer caseload was 106. 4.3. Data and Measures
We collected data from several sources: probation records, criminal histories, and qualitative data from the agency and officers. From probation records, we knew supervision outcomes: The offender completed the term of supervision; or the offender had his term revoked; or the offender was still under supervision as of August 2010. Criminal history data was obtained through a query of arrest records from the Oklahoma State Bureau of Investigation; for some probationers the agency was unable to match supervision records with criminal histories. The analysis of arrests during and after supervision was limited to those observations that had matches with criminal history records as there is no justification for imputing outcomes for missing dependent variables. We discuss the implications of the missing data in our findings. We also received data on assessment scores (derived from the Level of Service Inventory-Revised assessment tool), demographic characteristics, offender treatment programming (such as substance treatment) and supervision contacts. We interviewed agency administrators as part of the initial site screening process, and conducted follow-up focus groups with officers, supervisors, and administrators during the study period. We also asked the volunteer officers to submit audio tapes of several supervision contacts with offenders at the beginning of the study (Time 1) and one year after the study began (Time 2). Working under subcontract, the Justice Systems Assessment and Training group reviewed and scored those tapes using validated rating scales (See Appendix 2 for information and details). Ten treatment officers and thirteen control group officers participated in the Time 1 analysis, though many control group officers who submitted tapes at Time 1 left the agency before submitting tapes at Time 2, making comparisons between the groups over time impossible. We organized the data from probation records into two pools, described here as stock and flow. The flow is the pool of offenders who enter supervision during the period of random assignment. The stock was extant at the time of random assignment. The stock is different from the flow for two reasons. First, offenders who pose a high risk of failure are most likely to be revoked, so for that reason the average offender in the flow would be at a higher risk to recidivate than would the average offender in the stock. Second, however, offenders who pose a high risk of failure are likely to spend more time on probation
Abt Associates Inc. 24
This document is a research report submitted to the U.S. Department of Justice. This report has not been published by the Department. Opinions or points of view expressed are those of the author(s) and do not necessarily reflect the official position or policies of the U.S. Department of Justice.

(due to technical violations, etc.), so for that reason the average offender in the flow would be a lower risk than the average offender in the stock. Because these two selection mechanisms are unlikely to balance, the stock and flow comprise different mixtures of offenders. Comparing the stock and flow is a starting point for this analysis. For selected variables, Table 4.1 summarizes the differences between the stock and flow:
Table 4.1 Comparison of cases in stock and flow offender mix
LSI-R Level of Service Inventory- Revised Mean standard error Observations
Stock 16.72 0.056 2,651a Flow 15.68 0.06 2,280
Male Offender is male Mean standard error Observations Stock 0.715 0.012 3,011 Flow 0.720 0.012 2,894
HS Education: High school or higher Mean standard error Observations Stock 0.507 0.013 3,011 Flow 0.552 0.013 2,894
AOD History of alcohol or drug abuse Mean standard error Observations Stock 0.387 0.013 3,011 Flow 0.251 0.012 2,894
Prior Prior conviction, incarceration, or probation Mean standard error Observations Stock 0.554 0.013 3,011 Flow 0.465 0.013 2,894
a LSI scores were missing for approximately 20% of probationers. The implications are discussed in the text.
Static risk factors of offender recidivism entered the statistical analysis as the principal control variables. The level of service inventory- revised (LSI-R) is probably the most important, because it was developed to predict criminal recidivism. Other variables are likely predictors of recidivism; they are not captured by the LSI-R or are only partially captured by the LSI-R. The impression is that offenders from the stock differ from offenders in the flow. The differences are not great except for two variables: alcohol/drug abuse and prior convictions/incarceration/probation. These tabulations cannot identify differences in unobserved factors that affect recidivism. After all, probationers are members of the stock because they have managed to avoid having their supervision status revoked before the stock was assembled, and it is likely that some unobserved factors account for their ability to remain on probation. The analysis reported in this study controls for observable differences in offender characteristics by entering them into a regression (a Cox proportional hazard model) and controls for unobserved characteristics by applying a difference-in-differences logic. An additional observation is noteworthy: The LSI-R score is missing for approximately 20 percent of probationers. That is why the table reports 4,931 cases for the LSI-R score and 5,905 cases
Abt Associates Inc. 25
This document is a research report submitted to the U.S. Department of Justice. This report has not been published by the Department. Opinions or points of view expressed are those of the author(s) and do not necessarily reflect the official position or policies of the U.S. Department of Justice.
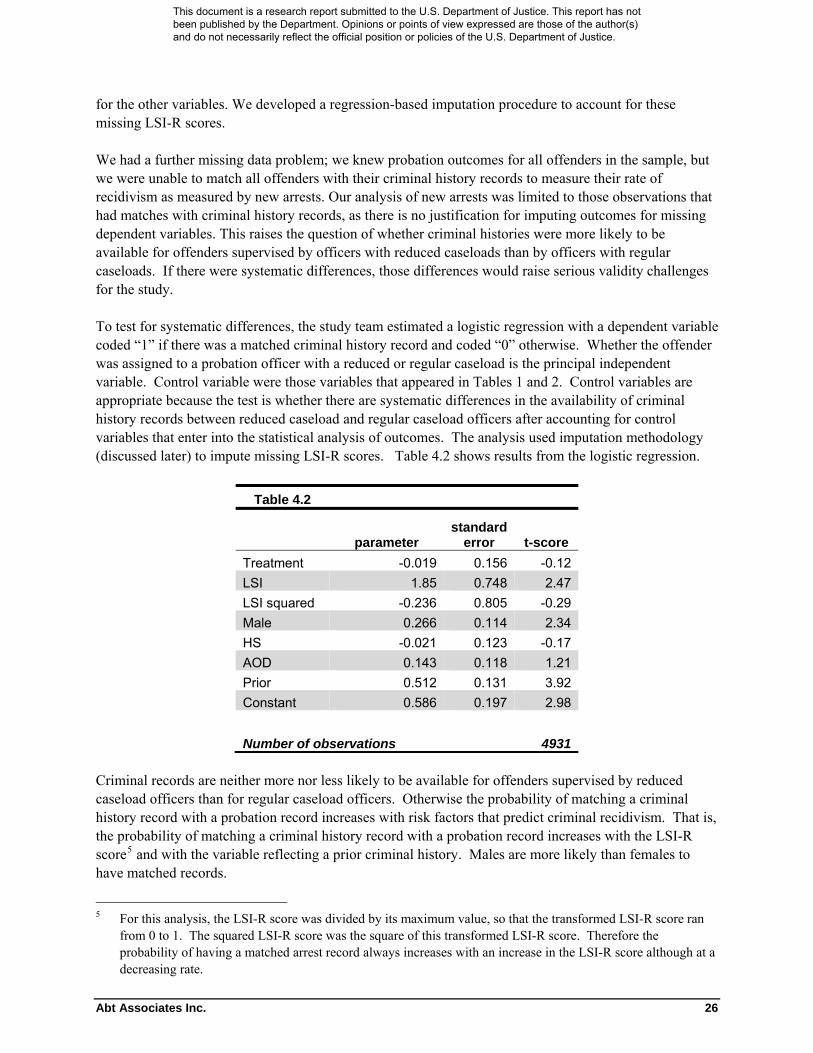
Abt Associates Inc. 26
for the other variables. We developed a regression-based imputation procedure to account for these missing LSI-R scores. We had a further missing data problem; we knew probation outcomes for all offenders in the sample, but we were unable to match all offenders with their criminal history records to measure their rate of recidivism as measured by new arrests. Our analysis of new arrests was limited to those observations that had matches with criminal history records, as there is no justification for imputing outcomes for missing dependent variables. This raises the question of whether criminal histories were more likely to be available for offenders supervised by officers with reduced caseloads than by officers with regular caseloads. If there were systematic differences, those differences would raise serious validity challenges for the study. To test for systematic differences, the study team estimated a logistic regression with a dependent variable coded “1” if there was a matched criminal history record and coded “0” otherwise. Whether the offender was assigned to a probation officer with a reduced or regular caseload is the principal independent variable. Control variable were those variables that appeared in Tables 1 and 2. Control variables are appropriate because the test is whether there are systematic differences in the availability of criminal history records between reduced caseload and regular caseload officers after accounting for control variables that enter into the statistical analysis of outcomes. The analysis used imputation methodology (discussed later) to impute missing LSI-R scores. Table 4.2 shows results from the logistic regression.
Table 4.2
parameter standard
error t-score Treatment -0.019 0.156 -0.12 LSI 1.85 0.748 2.47 LSI squared -0.236 0.805 -0.29 Male 0.266 0.114 2.34 HS -0.021 0.123 -0.17 AOD 0.143 0.118 1.21 Prior 0.512 0.131 3.92 Constant 0.586 0.197 2.98 Number of observations 4931
Criminal records are neither more nor less likely to be available for offenders supervised by reduced caseload officers than for regular caseload officers. Otherwise the probability of matching a criminal history record with a probation record increases with risk factors that predict criminal recidivism. That is, the probability of matching a criminal history record with a probation record increases with the LSI-R score5 and with the variable reflecting a prior criminal history. Males are more likely than females to have matched records.
5 For this analysis, the LSI-R score was divided by its maximum value, so that the transformed LSI-R score ran
from 0 to 1. The squared LSI-R score was the square of this transformed LSI-R score. Therefore the probability of having a matched arrest record always increases with an increase in the LSI-R score although at a decreasing rate.
This document is a research report submitted to the U.S. Department of Justice. This report has not been published by the Department. Opinions or points of view expressed are those of the author(s) and do not necessarily reflect the official position or policies of the U.S. Department of Justice.

Abt Associates Inc. 27
The findings from Table 4.2 are important for two reasons. The first reason is that comparisons between offenders supervised by reduced caseload officers and by regular caseload officers will not be biased by having outcome measures more readily available for one group than for the other. The second reason is that the findings from Table 4.2 alert the reader that results from the recidivism analysis pertain to offenders who are more serious than the typical probationer in Oklahoma City. Given these data, there are two outcome measures: revocation from supervision and arrest for a new crime. Furthermore, there are two variations of arrests: all crimes exclusive of technical violations and all crimes exclusive of relatively minor offenses. The analysis fixed the period at risk to a maximum of two years, but sensitivity analysis will show that shorter risk periods do not materially alter conclusions. There were negligible offender differences between offenders supervised by regular caseload officers and offenders supervised by reduced caseload officers (Table 4.3)—with the exception of the history of alcohol and drug use.6 Because the principal comparison is between outcomes for probationers supervised by these two groups of officers, the similarity between them is important for the analysis. Despite their similarities, however, we introduce them as controls for two reasons. First, there are some differences between the regular and reduced caseload group that must be controlled for in the analysis and second, by including covariates we will improve the efficiency of model estimation.
Table 4.3 LSI‐R Level of Service Inventory‐ Revised mean Standard error observations Regular caseload 16.16 0.047 3,877 Reduced caseload 16.6 0.084 1,054 Male Offender is male mean Standard error observations Regular caseload 0.714 0.01 4,756 Reduced caseload 0.734 0.02 1,149 HS Education: High school or higher mean Standard error observations Regular caseload 0.529 0.01 4,756 Reduced caseload 0.531 0.021 1,149 AOD History of alcohol of drug abuse mean Standard error observations Regular caseload 0.297 0.01 4,756 Reduced caseload 0.418 0.021 1,149 Prior Prior conviction, incarceration, or probation mean Standard error observations Regular caseload 0.498 0.01 4,756
Reduced caseload 0.561 0.021 1,149
6 We were concerned that this difference in the identification of drug users may be endogenous—that is, probation
officers with lower caseloads were more likely to detect substance abuse. Endogeneity of the AOD variable would bias the other parameter estimates. An alternative approach is to drop the AOD variable from the statistical analysis. This is justified if probationers are essentially assigned randomly to probation officers. Sensitivity analysis will show that this does not affect substantive conclusions.
This document is a research report submitted to the U.S. Department of Justice. This report has not been published by the Department. Opinions or points of view expressed are those of the author(s) and do not necessarily reflect the official position or policies of the U.S. Department of Justice.

Note also that the reduced caseload group has fewer observations than the regular caseload group, and this reduces the power below the level that could be achieved if the two groups had more equal numbers of observations. The power is even lower than what might be apparent from this table because of clustering; that is, probation officers contribute multiple observations to the statistical analysis. The analysis will take that clustering into account. 4.4. Supervision Conditions
In addition to establishing caseload size and static characteristics of the sample, we explored the differences in supervision intensity for offenders between the reduced and regular caseloads. We have observed that the reduced caseload was about one half that of the regular caseload. Offenders supervised on the reduced caseload also appeared to receive more substance abuse and mental health treatment (Table 4.4). Of course, we have also seen that treatment offenders tended to have greater need for substance abuse treatment (Table 4.3), so this partly explains why offenders in the treatment group had higher treatment rates. However, the rate of receiving treatment is much higher than the rate of needing treatment, suggesting that reduced caseload officers are more likely to refer their charges to substance abuse/mental health treatment than are regular caseload officers.
Table 4.4
Regular Caseload
Reduced Caseload
Has any treatment record 17% 44%***
Alcohol treatment- any type 2% 8%*** Drug treatment- any type 11% 27%*** Mental health treatment- any type 4% 10%***
Has treatment need and treatment record 6% 22%*** ***Denotes a p-value of .00001 or less; **denotes a p-value of <.01; *denotes a p-value of <.05 Supervision contacts were also significantly higher for offenders supervised by treatment officers versus those supervised by control officers. Offenders supervised by treatment officers averaged 1.8 more office visits per year than did control officers. Rates of successful telephone, home, and UA contacts were also significantly higher for offenders supervised by treatment officers than for those supervised by control officers (Table 4.5).
Table 4.5
Regular Caseload
Reduced Caseload
Annualized rate of contacts Office 4.7 6.50*** Telephone 0.79 1.50*** Home 0.55 0.83*** UA 0.007 0.02***
***Denotes a p-value of .00001 or less; **denotes a p-value of <.01; *denotes a p-value of <.05
Abt Associates Inc. 28
This document is a research report submitted to the U.S. Department of Justice. This report has not been published by the Department. Opinions or points of view expressed are those of the author(s) and do not necessarily reflect the official position or policies of the U.S. Department of Justice.

We also evaluated officers who volunteered for this study on multiple criteria associated with evidence based practice and supervision quality. Officers who volunteered for the study were asked to submit audio tapes of supervision contacts with offenders to our research partner, Justice Systems Assessment and Training (JSAT). These tapes were reviewed by trained coders and scored using validated scales (see Appendix 1 for details). Tapes were collected and reviewed at baseline (Time 1) and one year after the start of the study (Time 2). Officers’ interactions with probationers were scored by trained raters reviewing audiotapes of officers’ supervision sessions with probationers on their caseloads. Ten measures of interviewing skill usage were established from those ratings, and combined into an overall skill summary measure. Skill balance (Skba). Skill balance is a measure that indicates the degree to which an interviewer’s skill usage adheres to the balance of eight clinical skills prescribed for motivational interviewing (MI). The score, based on counts of instances of skill usage, is a weighted sum of discrepancies from ideal skill usages, ratios of skill usages, and penalties for inappropriate skill usages. Global skill ratings (Global). Global assessments over the entire interview, rather than counts of specific instances, were made for nine interviewing skills, including four measures from the MISC scale21: acceptance, egalitarianism, genuineness, warmth, and five from the MITI-2 (Moyers and Miller, 2003): empathy, evocation, collaboration, autonomy, and directiveness. The global skills measure is the mean of those 9 global ratings (alpha = .84). Motivational interviewing treatment integrity (MITI). Four measures of adherence to prescribed MI behaviors assessed, respectively, proportion of complex reflections, proportion of open questions, ratio of MI-adherent to MI nonadherent skills used, and ratio of reflections to questions. Higher proportions on each measure indicate more MI-adherent skill usage, and a scale of MI treatment integrity (MITI) was computed as the mean of the four ratings. Overuse of questions (QUSER). Raters counted the number of times during each interview that the officer asked three consecutive questions, and the longest uninterrupted string of questions. Those two ratings were standardized (z-scores), then averaged to form a measure of overuse of questions in relation to reflections and other clinical skills (alpha = .85). Officer interactive skills (OIS). Raters scored the interview audiotapes for appropriate use (yes or no) of six interactive skills: summarizations, open questions, simple reflections, complex reflections, affirmations, and double-side reflections. The officer interactive skills (OIS) score is the mean of those six ratings (alpha = .54). Quality contact standards (QCS). The QCS instrument is a 12-item instrument designed to provide a general overview concerning an officer’s interactions with offenders. Each item is rated from 1 (low) to 5 (high). Four QCS scale scores were computed as the mean of the ratings in the following areas: deportment and manner of being (4 items, alpha = .58), assessment and planning (4 items, alpha= .65), referral for treatment and service (2 items, alpha = .85), and enforcement of sanctions and ground rules (2 items, alpha = .57). Dual Role Inventory-Revised (DRI-R). The Dual Role Inventory-Revised (Skeem, Louden, Polaschek, and Camp, 2007) was designed to assess the balance and alignment officers have in their interactions with the people they are supervising. There are three subscales in the DRI-R: 1) Toughness (alpha = .87); 2)
Abt Associates Inc. 29
This document is a research report submitted to the U.S. Department of Justice. This report has not been published by the Department. Opinions or points of view expressed are those of the author(s) and do not necessarily reflect the official position or policies of the U.S. Department of Justice.

Trust (alpha = .95); and, Fairness (alpha = .95). Toughness is reverse scored so that higher ratings reflect less confrontational officers. The combined score of all three subscale or Total Dual Role Inventory (DRIT, alpha = .89) thus is a measure of the officer’s ability to engage and model a working relationship. The results below indicate that the treatment and control groups, at baseline, were similar in most areas evaluated, with the exception of organizational climate. Control officers indicated less job satisfaction than treatment officers, which may play a role in the attrition we describe among control group officers. Table 4.6
PPSQ- Officer Orientation Officer Skills
Case worker
Resource Broker
Law enforcement
Organizational climate Skba Global Miti4 Quser Ois Qcs
DRI-R
Reduced Caseload 1.38 1.47 1.29 9.34 0.08 3.99 0.33 0.06 0.49 3.17 5.38
Regular Caseload 1.37 1.58 1.50 8.09 0.09 4.17 0.31 0.16 0.48 3.03 5.83 4.5. Methodology
We studied two research questions: Did the use of reduced caseloads reduce criminal recidivism? Did the use of reduced caseloads alter revocation rates? We used three measures:
• An arrest for a serious crime. • An arrest for any crime other than a technical violation of the conditions of supervision. • A revocation was reported by the probation agency.
The study was adequately powered to detect a large treatment effect by comparing the supervision outcomes of offenders supervised by the officers who volunteered for the experiment. Power was dictated by the study’s sponsor (National Institute of Justice in consultation with the National Correctional Institute) who deemed that a small treatment effect would not be worth a doubling of probation costs. The experiment degenerated. A large proportion of officers who had been assigned to the control condition either left the agency or accepted alternative assignments. This created two problems. The first was that the original randomization could no longer assure that the reduced caseload officers were statistically equivalent to the regular caseload (volunteer) officers. The second was that the study no longer had adequate power to detect meaningful treatment effects. The study team was forced to turn to a difference-in-differences (DD) estimator. Because of the design of the original RCT, specifying that DD was complicated. Figure 4.1 gives an overview of the specification: Figure 4.1 – An Overview of the Research Design Period 1 Period 2 Period 3 Reduced Caseload Officers β1+γ1 β2+γ2 β3+γ3
Regular Caseload Officers β1 β2 β3
Abt Associates Inc. 30
This document is a research report submitted to the U.S. Department of Justice. This report has not been published by the Department. Opinions or points of view expressed are those of the author(s) and do not necessarily reflect the official position or policies of the U.S. Department of Justice.

Abt Associates Inc. 31
The figure has two rows and three columns comprising six cells. The first row pertains to officers who volunteered for the study and who were assigned to reduced caseloads. The second row pertains to all other officers, including those who volunteered for the study and those who did not volunteer. Thus the second row pertains to officers who had regular caseloads. The three columns pertain to periods, which are determined by when a probationer entered supervision. The RCT was started at the beginning of period 3. During that period every new probationer supervised by officers with reduced caseloads received a full dose of treatment. This means that the offenders who entered supervision during this period were always supervised by an officer with a reduced caseload. The relevant cell has heavy shading. Every other offender who entered supervision during this period was supervised by an officer with a regular caseload. If we were to only compare the outcomes for offenders in the two cells of period 3, we would risk selection bias—officers in the heavy shaded box may differ from officers in the box without shading, and we would not know whether to attribute differences in offender outcomes to those officer differences or to reduced caseloads. The second period extends from T years before the first period begins until just before the first period begins. T equals the length of the follow-up period.7 (T is two years for most of this analysis. However, we report sensitivity analysis for T of different lengths.) Some of the probationers who entered supervision during this second period received a partial dose of treatment. This means that some of the offenders in the lightly shaded cell were supervised by an officer who had a reduced caseload, but that level of supervision did not begin until their supervision terms entered period 3. The emphasis is on the word some because a proportion of the probationers who began their supervision terms during period 2 with reduced caseload officers were transferred to regular caseload officers at the beginning of period 3 as part of the RCT design.8 The third period comprises time before the second period. No probationer who entered supervision during period 1 was ever supervised by an officer who had a reduced caseload. Consequently there is no shading. Since we limited the study to high and moderate risk offenders,9 and since offenders were randomly assigned to officers, it is reasonable to make a simple comparison. The Greek letters that appear in each cell represent the average outcomes for offenders in each cell. The β represent the average outcomes for offenders who are supervised by probation officers who always had regular caseloads. The βs may change over time if there are trends in supervision outcomes. The β+γ represent the average outcomes for offenders who were supervised by probation officers who had reduced caseloads in period 3. Some contrasts are important. The first contrast is: ( ) 1111 βγβγ −+= 7 Estimation used partially parametric survival analysis. All observations are considered to be censored after T
years. 8 The probation officer identified in figure 1 is the probation officer at the beginning of the probationer’s supervision
term. Probationers frequently change officers because officers leave the probation agency or accept other duty assignment and for other reasons. However, during period 3, probations never moved between officers who had reduced caseloads and officers who had regular caseloads.
9 Probation officers supervise mixed caseloads. We limited the analysis to offenders who were classified as high and moderate risks, and thus received active supervision.
This document is a research report submitted to the U.S. Department of Justice. This report has not been published by the Department. Opinions or points of view expressed are those of the author(s) and do not necessarily reflect the official position or policies of the U.S. Department of Justice.

Abt Associates Inc. 32
This is a measure of how much better or worse outcomes were for offenders supervised by probation officers who started with regular caseloads in the first period and eventually had reduced caseloads, compared with officers who maintained regular caseloads throughout the study. The second contrast is: ( ) 3333 βγβγ −+= This is a measure of how much better or worse outcomes were for offenders supervised by probation officers who had reduced caseloads during the third period compared with offenders supervised by officers who had regular caseloads during the third period. If the β capture changes that happened over time for officers who had regular caseloads and if γ captures the differences between the outcomes for offenders supervised by probation officers with and without reduced caseloads, then the DD estimator of treatment effectiveness is: [1] 13 γγ −=Δ full Call Δfull the full treatment effect. By the same logic, the partial treatment effect Δ2 is: [2] 12 γγ −=Δ partial
An incremental treatment effect is the step-up from the partial effect to the full effect: [3] partialfulllincrementa Δ−Δ=Δ
The formulas explain the basis for the DD estimator, but we were also able to sharpen estimates and to reduce validity challenges by introducing time trends. The study team defined time so that it always ran from 0 on the first day of a period and 1 on the last day of the period. Time is when the offender entered supervision.10 If outcomes are changing over time, introducing time into a statistical model would account for some unexplained variance.
Figure 4.2 – Incorporating Time-Trends into the Research Design Period 1 Period 2 Period 3 Reduced Caseload Officers
β1+γ1+λ1T β2+γ2+(λ2+γ4)T β3+γ3+λ3T
Regular Caseload Officers
β1+λ1T β2+λ2T β3+λ3T
The λ parameters in Figure 4.2 capture the time trends, which are assumed to be the same for the officers with reduced caseloads as for officers with regular caseloads, with the exception of period 2. During period 2, offenders who were supervised by officers who eventually had reduced caseloads received
10 Suppose that period 2 began on January 1, 2000 and ended on December 30, 2001. Then a probationer who
entered on January 1, 2000 would enter supervision at time 0.5. A probationer who entered on July 1, 2000 would enter supervision at time 0.75.
This document is a research report submitted to the U.S. Department of Justice. This report has not been published by the Department. Opinions or points of view expressed are those of the author(s) and do not necessarily reflect the official position or policies of the U.S. Department of Justice.

Abt Associates Inc. 33
partial doses – the later they entered supervision, the higher the dose on average. Consequently there is another parameter γ4 that is unique to those offenders. The full treatment effect is exactly as it was specified above in equation [1]. The partial treatment effect has to be evaluated for some specific time, and the most logical time is at the end of period 2 because this is when the offender would receive nearly a full dose of treatment provided he had not been dropped from the caseload of the reduced caseload probation officer. Recall that some offenders were dropped in order to implement the random assignment. The new estimator for the partial treatment effect is: [4] 142 γγγ −+=Δ partial
The estimator for the incremental treatment effect remains as specified in equation [3]. There is one more change. Introducing covariates improves the efficiency of the estimated parameters and meets some validity challenges (namely, that offender characteristics may differ across probation officers). These covariates are: • LSI The offender’s LSI score.
• LSI squared The square of the LSI score, introduced to capture non-linearities.
• Male A dummy variable denoting that the offender was a male.
• HSplus A dummy variable denoting that the offender had a high school degree or higher.
• AOD A dummy variable denoting that the offender was diagnosed with an alcohol or drug
problem.
• Prior A dummy variable denoting that the offender had a prior conviction, probation term
or prison term.
Although figures 1 and 2 are useful heuristic devices, we needed to account for right hand censoring11, so the study team analyzed the data using a Cox proportional hazard model. We made the assumption that the hazard for failure is proportional to the factor: [5]
iZi eH =
Here i represents the ith probationer. Z is a linear function written as equation [6]. The periods play a role in this specification:
[6]
jj
ijijj
jijiijiijij
iji TIMEDDXTIMERDRDZ λβαγγ ∑∑∑===
++++=3
1
3
142
3
1
iX This is a row vector of risk factors that were identified and described above. (To improve computation and to facilitate interpretation, the LSI has been divided by 40, which is roughly the maximum LSI score. This means that the LSI score runs from 0 to 1.) The same transformation applies to the squared LSI score.
11 The occurrence of probation revocations as censoring requires using a survival model. The study team used
standard tests to conclude that the use of a proportional hazard model was acceptable.
This document is a research report submitted to the U.S. Department of Justice. This report has not been published by the Department. Opinions or points of view expressed are those of the author(s) and do not necessarily reflect the official position or policies of the U.S. Department of Justice.

Abt Associates Inc. 34
ijD These are dummy variables so that the dummy variable Dij equals 1 when the ith offender began
supervision during the jth period (j=1, 2 or 3) and equals zero otherwise. ijTIME This is the time that the offender entered supervision. Its coding depends on when the
probationer entered supervision during the period. If the offender entered supervision on the first day of period j, then TIME is zero. If the offender entered supervision on the last day of period j, then TIME is one. Entering supervision on day d when the days in the period span D days will cause TIME to be d/D. This specification identifies a trend that is specific to the period.
Before defining additional terms, note that captures apparent changes in
recidivism rates for offenders who are supervised by POs who always have regular caseloads. Therefore
represents a counterfactual: what would have happened to a
probationer if he had been supervised by a PO with a regular caseload? The parameters do not necessarily reflect real changes in probation outcomes over time because of the way that the sample was constructed from stocks and flows.
jj
ijijj
jij TIMEDD λβ ∑∑==
+3
1
3
1
jj
ijijj
jiji TIMEDDX λβα ∑∑==
++3
1
3
1
12 Nevertheless, the biases that affect recidivism statistics for probationers supervised by probation officers with reduced caseloads also affect recidivism statistics for probationers supervised by probation officers with regular caseloads, so this is a suitable and important counterfactual. Returning to the notation:
iR This is a dummy variable denoting the ith probationer was supervised by a probation officer who had a reduced caseload during period 3.
Now consider the remaining part of the model specification: . This captures
how the outcomes for probation officers with reduced caseloads differ from the outcomes for probation officers with regular caseloads. The α’s provide the ingredients for estimating the full, partial and incremental treatment effects as explained in the discussion surrounding Figures 1 and 2.
42
3
1γγ ijiiji
jij TIMERDRD +∑
=
We analyzed these data using a Cox proportional hazard model. The LSI is missing for nearly twenty percent of the sample. Missing data can bias estimates of treatment effectiveness. Missing data will always reduce the power to detect treatment effects (Schaefer 1997, Little and Rubin 2002). The analysis employed a regression-based imputation procedure, as implemented in Stata 11, to impute values for the LSI when data were missing (StataCorp 2009). The imputation model included all the variables that appear in the regression models described above. (The square of the LSI score was treated as what Stata calls a passive variable.) Following suggestions by White and Royston (2009), the imputation model also included the failure rate variable and the cumulative hazard based on a Nelson-Aalen estimator. (The
12 The problem is that the flow of offenders represents everyone who enters supervision while the stock of offenders
represents everyone who was under supervision at the time that the data were assembled. Some probations who had earlier revocations would be absent from the stock. Thus the time trend is not a pure trend, but it is equivalent for probationers supervised by officers with reduced caseloads and by officers with regular caseloads.
This document is a research report submitted to the U.S. Department of Justice. This report has not been published by the Department. Opinions or points of view expressed are those of the author(s) and do not necessarily reflect the official position or policies of the U.S. Department of Justice.

Abt Associates Inc. 35
Nelson-Aalen estimator is a non-parametric survival model.) The following analyses always use twenty files of imputed data.13 4.6. Analysis and Findings
As already discussed, LSI was missing for nearly twenty percent of the sample, which can bias estimates of treatment effectiveness and reduce power to detect treatment effects. The analysis employed a regression-based imputation procedure, as implemented in Stata 11, to impute values for the LSI when data were missing (StataCorp 2009). The imputation model included all the variables that appear in the regression models described below.14 The following analyses always use twenty files of imputed data. Table 4.7 summarizes results pertaining to this subsection and the next subsection. For convenience, the parameter estimates associated with the covariates are identified with the variable name, while the other names correspond to the parameters identified in equations [1] through [6]. To the left, the table reports results when recidivism excludes minor crimes and technical violations. To the right, the table reports results when recidivism excludes technical violations only.
Table 4.7 – Regression Results for Arrests While Under Supervision
Arrest exclusive of Minor arrests Arrests exclusive of technical violations hazard standard error t score hazard standard error t score
α1 1.128 0.217 0.630 1.104 0.210 0.520
α2 0.985 0.308 -0.050 0.981 0.274 -0.070
α3 0.730 0.079 -2.920 0.726 0.072 -3.220
α4 0.708 0.357 -0.680 0.683 0.317 -0.820 β2 0.822 0.157 -1.030 0.933 0.176 -0.370
β3 0.668 0.114 -2.370 0.721 0.123 -1.910
λ1 0.863 0.210 -0.600 1.007 0.257 0.030
λ2 0.774 0.124 -1.590 0.711 0.110 -2.190
λ3 0.994 0.155 -0.040 1.006 0.156 0.040
Male 1.405 0.077 6.220 1.343 0.076 5.230
HSplus 0.952 0.060 -0.790 0.930 0.058 -1.160
AOD 1.322 0.117 3.140 1.307 0.113 3.100
Prior 0.939 0.059 -1.010 0.946 0.059 -0.900
LSI 13.510 8.731 4.030 14.893 9.642 4.170
LSI squared 0.973 0.540 -0.050 0.898 0.497 -0.190 13 Because of the imputations, the computation of standard errors is more complicated, but Stata performs the
appropriate bookkeeping function. The statistics reported below come from Stata’s ms estimate procedure applied to Stata’s tscox procedure (Cleves, et al. 2010, p. 171). Our estimation employed a cluster robust standard error option because data are clustered by probation officer.
14 The LSI score squared was treated as what Stata calls a passive variable.
This document is a research report submitted to the U.S. Department of Justice. This report has not been published by the Department. Opinions or points of view expressed are those of the author(s) and do not necessarily reflect the official position or policies of the U.S. Department of Justice.

The table reports the exponential of the estimated parameter, called the hazard in this table. It reports the standard error for that estimate at well as the two-tailed probability value for the t distribution. The t-score cannot be computed by dividing the hazard by the standard error because the null is that the hazard equals one, not zero. The LSI is a strong predictor of recidivism. Males are more likely than females to recidivate. Drug users are more likely than others to recidivate. The variable prior (prior arrest, incarceration or probation) and the variable HSPLUS (high school graduate or higher degree) were not significant predictors. Arrest rates appear to have decreased over time. The β parameters are both less than 1 and β3 is statistically significant. The λ parameter estimates are less than one although they are not statistically significant. For this evaluation, the α parameters are most important because they lead to estimates of the full treatment effect, the partial treatment effect and the incremental treatment effect. Some manipulation is required because the table reports hazards while the parameters necessary to compute the treatment effects are the logarithm of these parameters. From equation [1]: ( ) ( ) 435.0128.1ln730.0ln13 −=−=−=Δ γγfull
From equation [4]: ( ) ( ) ( ) 481.0128.1ln708.0ln985.0ln142 −=−+=−+=Δ γγγpartial
And from equation [3]: 045.0=Δ−Δ=Δ partialfulllincrementa
Converting these effects back into hazards (by exponentiating the effects), the full treatment effect reduces the hazard by 0.65 (p=0.018 for a one-tailed test), the partial treatment effect reduces the hazard by 0.62 (p=0.034 for a one-tailed test). There is no statistically significant difference between the partial and full treatment effects possibly because there is too little power to detect. The study team repeated this analysis for recidivism defined as an arrest for any crime exclusive of a technical violation of the conditions of supervision. The estimates were not much different. The full treatment effect reduced the hazard by a factor of 0.66; the partial treatment effect reduced the hazard by a factor of 0.61. There was no statistically significant difference between the partial and full treatment effect. Hazards provide a useful way for researchers to think about treatment effects, but they are not so useful for practitioners, who prefer to think of reductions in the probability of recidivism. Figure 3 responds to that need. The figure shows the probability of survival (1 minus the probability of recidivism) for probationers that entered supervision during period 3.
Abt Associates Inc. 36
This document is a research report submitted to the U.S. Department of Justice. This report has not been published by the Department. Opinions or points of view expressed are those of the author(s) and do not necessarily reflect the official position or policies of the U.S. Department of Justice.

Abt Associates Inc. 37
Figure 4.3 - Difference in recidivism by caseload size
.6.7
.8.9
1S
urvi
val
0 200 400 600 800analysis time
reduced caseload regular caseload
Days
Survival Probability as a Function of Caseload Size
The survival function is estimated at the mean values for the covariates. It shows estimates of the differences between the survival rates for offenders supervised by POs with reduced caseloads and the survival rates by offenders supervised by POs with regular caseloads. At the end of two years, the differences appear large. The probability of recidivism for offenders supervised by POs with regular caseloads is roughly 0.35. The probability of recidivism for offenders supervised by POs with reduced caseloads is less than 0.25. This is roughly a 30 percent drop in recidivism rates. We found that results do not vary significantly for minor offenses. The findings are potentially sensitive to the length of the follow-up period because the length of the follow-up period determines the composition of probationers who began supervision during periods 1 and 2. The study team repeated the analysis after setting the length of the follow-up period to 1 ½ years, 1 year and ½ year. The full treatment effect was statistically significant at p<0.05 except for a follow-up period of one year, when it was significant at p=0.114. The partial treatment effect is likely to be most sensitive to the length of the follow-up period because the number of probationers who entered supervision during period 2 is roughly proportional to the length of the follow-up period. The partial treatment effect was statistically significant at p<0.05 for follow-up periods of two years and one-half year; it was significant at p=0.106 at one and one-half years; and it was only significant at p=0.272 for a follow-up period of one-year. Overall, sensitivity testing provides evidence that estimation of the full treatment effect is robust to definitions of the length of the follow-up period but estimation of the partial treatment effect is not robust to definitions of the length of the follow-up period. Did reduced caseloads increase technical revocation rates? Looking at all offenders who began supervision after October 1, 2007, probation officers with reduced caseloads revoked 5.2 percent of
reduced
regular
This document is a research report submitted to the U.S. Department of Justice. This report has not been published by the Department. Opinions or points of view expressed are those of the author(s) and do not necessarily reflect the official position or policies of the U.S. Department of Justice.

probationers and other POs revoked 1.3 percent of probationers. This difference is statistically significant. Looking at all offenders who began supervision before October 1, 2006, POs with reduced caseloads had revoked 5.4 percent of probationers and other POs had revoked 5.5 percent of probationers. This difference is not statistically significant. It appears that reduced caseloads have led to more revocations. Although technical revocations appear to have increased as a result of reduced caseloads, they remain low relative to revocation rates across the US, perhaps because Oklahoma City adheres to EBP. We selected Oklahoma City to participate in the study because they were willing to implement the RCT and because our screening indicated that EBP had been substantially implemented throughout the department at the time the study began. However, we also assume that EBP is an ongoing training, quality assurance, and skill building practice for officers, and we anticipated observing some changes in officer’s skill sets over time. We reviewed tapes of supervision contacts for all officers who volunteered for the study at the beginning of the RCT (Time 1) and at the end of the study (Time 2). Our very small sample size of officers and the degeneration of the control group of officers limited the utility of the tape critiques in assessing quantitative outcomes. However, we note two interesting findings: first, reduced caseload officers had Time 2 skill ratings that were only slightly better than regular officers’. We expected that officers’ supervision scores on scales designed to measure their skill in motivating offender change would improve as their caseloads went down. Second, officers’ baseline ratings on several key measures had no impact on offender outcomes. For example, officers who were rated as “caseworkers” (the most desirable rating for adherents of EBP) had no significant differences in outcomes over those rated as “resource brokers” or “law enforcers,” despite the size of their caseload. 4.7. Discussion
We have found that offenders assigned to officers with a reduced caseload reoffend less frequently than those assigned officers with regular caseloads. Why should that be? We can identify some potential reasons for this from our exploratory and qualitative work in this agency. One, officers with a reduced caseload were better able to learn and practice supervision techniques that are thought to address offender needs and motivate offenders to change behavior. The study team held focus groups with agency staff mid-way through the experiment, and asked them to discuss how the capped caseload had changed their supervision practices. Several treatment officers discussed their interactions with offenders:
• As an experimental officer, you can schedule hour office visits legitimately and take your time. Participants have met with treatment providers and the offender. You do get to give people who have larger issues more time, and that’s been great.
• Field contacts have been easier, and a home visit a month is very doable. • There is more quality to the contact, and the officer is able to figure out why they have
ongoing issues. • Clients feel that you’re taking more time to get to know them, and it builds trust. Offenders
have mentioned that they feel that this is the first time someone has listened to them. • More [offender] crying—more talking, more open-ended questions.
Abt Associates Inc. 38
This document is a research report submitted to the U.S. Department of Justice. This report has not been published by the Department. Opinions or points of view expressed are those of the author(s) and do not necessarily reflect the official position or policies of the U.S. Department of Justice.
Control officers, on the other hand, felt overwhelmed by their caseloads:
• The control officers are finding it difficult to keep up with their caseloads, especially when there are other reduced caseloads outside this study.
• “As a control officer, I am treading water.” Supervisors had similar comments:
• As supervisors, we can’t have same expectations for treatment and control officers. The treatment officers just have more time.
Another speculation is that treatment officers are able to make more judicious use of revocations to manage high-risk offenders. This speculation is certainly consistent with the evidence that revocation rates increase slightly when a probationer is supervised by a probation officer with a reduced caseload. Several comments made in focus groups with officers and supervisors also support this view:
• Control caseloads are crisis management, so you take care of who is in front of you. Follow up on missed contacts takes longer.
• The experiment does not stop new offenses; participants are not sure if they are catching more violations with smaller caseloads, but think that they might be. They are also more likely to respond quickly to violations.
• Supervisors have noticed that sanctions are imposed more swiftly by treatment officers, and there is better documentation in case notes.
However, our findings from the assessments of officer EBP skills only partially support the idea that treatment officers were better able to implement EBP. In fact, some officers in the treatment group showed little to no improvement in several markers thought to be associated with more rehabilitative, or correctional, supervision. Officers that were rated as “caseworkers” based on their supervision contact critiques showed no improved outcomes over those rated as law enforcement or resource brokers. Yet our officer sample size was very small, and we lack sufficient power to detect anything but a very large treatment effect. As noted earlier, the study team was concerned that the alcohol and drug abuse indicator variable was endogenous. That is, probation officers with reduced caseloads had greater opportunity to observe probationers’ behaviors, and may have had greater opportunity to observe episodes of substance use or need for substance abuse treatment. This concern stems from the fact that probationers are essentially assigned randomly to probation officers, yet Table 1 shows that the prevalence of probationers with alcohol and substance abuse problems is higher for probationers supervised by officers with reduced caseloads. Suppose that probationers are assigned randomly and that the alcohol and substance abuse indicator is endogenous. Given random assignment of probationers to probation officers, the only role that the alcohol and substance abuse indicator plays in the regression is to reduce residual variance. The indicator can be dropped from the regression with the cost of reduced efficiency, so dropping the AOD variables is one way of dealing with endogeneity.
Abt Associates Inc. 39
This document is a research report submitted to the U.S. Department of Justice. This report has not been published by the Department. Opinions or points of view expressed are those of the author(s) and do not necessarily reflect the official position or policies of the U.S. Department of Justice.

We do not present the full results here, but dropping the AOD variable does not much affect findings. The full treatment effect is -.68 with a standard error of .19. The partial treatment effect is .63 with a standard error of .32. This leads to the conclusions that including the need for substance abuse treatment, a possibly endogenous regressor, does not seriously affect conclusions. Offenders supervised by treatment group officers had significantly more access to drug, alcohol, and mental health treatment. One measure indicates that offenders in this group may have had greater treatment need (see earlier discussion of control variables), although LSI risk scores, designed to factor in substance dependence and abuse, were identical across offender groups. Though our analysis controls for need for AOD treatment, we theorize that officers with reduced caseloads were better able to identify offenders with a need for treatment, and also better able to deliver that treatment appropriately. Our data lend support to this theory—offenders randomly assigned to reduced caseloads had a significantly higher rate of AOD treatment need as well as AOD treatment receipt.
Abt Associates Inc. 40
This document is a research report submitted to the U.S. Department of Justice. This report has not been published by the Department. Opinions or points of view expressed are those of the author(s) and do not necessarily reflect the official position or policies of the U.S. Department of Justice.

5. Chapter 5: Polk County, Iowa
Polk County, Iowa is a mid-size county that encompasses the city of Des Moines and outlying suburbs and rural areas that lie within Iowa’s 5th Judicial District. Our analysis focused on offenders supervised by officers in the Des Moines location. Although the agency was willing to initiate an RCT, an unexpected change in leadership at the start of the study meant the agency was forced to withdraw. We implemented, with NIJ’s support, an alternative study design that capitalized on the agency’s detailed data system and universal use of risk/need classification. Polk County uses the Iowa Risk Assessment tool to initially screen and classify offenders sentenced to probation. The result of this assessment triggers a number of actions by the department. The Iowa Risk score determines the supervision intensity (i.e. low-normal, high-normal, intensive) and dictates whether other assessments will be administered— for example, a Level of Service Inventory-Revised assessment (LSI-R) or The Jesness Inventory (a tool used to classify personality types among juvenile delinquent and adult offenders). This study estimates how moving an offender from high-normal supervision to intensive supervision (ISP) improves probation outcomes. We used a regression discontinuity design (RDD) to answer two principal research questions:
• How did criminal recidivism vary with probation officer caseload size? • How did revocations for violations of the conditions of supervision vary with probation
officer caseload size? This chapter has five sections. Section 5.1 briefly describes the data; details appear in subsequent sections. Section 5.2 briefly describes the regression discontinuity design; again, details appear in subsequent sections. Section 5.3 demonstrates that ISP differs materially from high-normal supervision. Without that demonstration there would be little point to estimating how outcomes differ under ISP and high-normal supervision. Section 5.4 explains and justifies the application of RDD to these data. Section 5.5 presents findings regarding the effectiveness of intensive supervision. 5.1. Data
The 5th Judicial District was an early adopter of EBP and has substantially implemented components since 1997. In 2000, the agency began implementing standardized case planning. In 2002, it began implementing motivational interviewing, responsivity and general EBP training for management. Management completed EBP training of all staff in 2004. Because the study period began late in 2001, estimation may understate the full effectiveness of reduced caseloads in an EBP environment. We conducted tape reviews of volunteer officers’ supervision skills to gain a qualitative understanding of EBP implementation in the site. Officers in Polk had relatively high ratings of their organizational climate (job satisfaction), and were most oriented as resource brokers rather than the more desirable caseworker orientation (though the difference between the two was slight). Overall, Polk officers were
Abt Associates Inc. 41
This document is a research report submitted to the U.S. Department of Justice. This report has not been published by the Department. Opinions or points of view expressed are those of the author(s) and do not necessarily reflect the official position or policies of the U.S. Department of Justice.
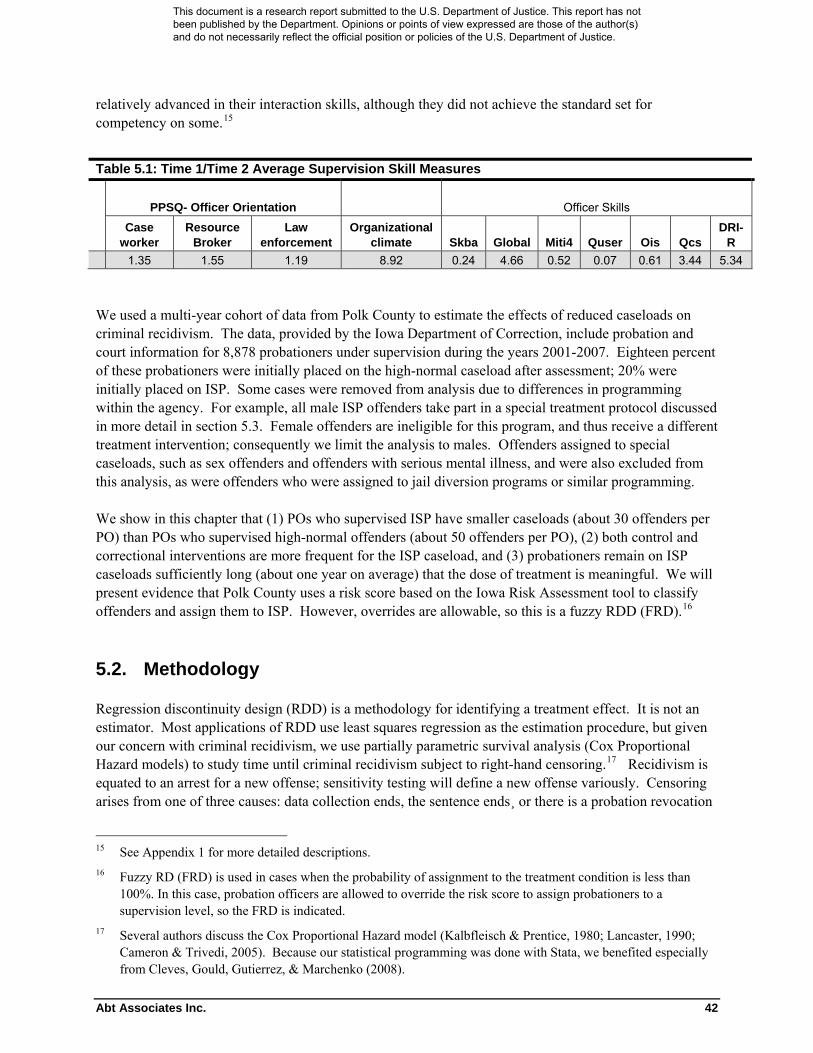
Abt Associates Inc. 42
relatively advanced in their interaction skills, although they did not achieve the standard set for competency on some.15
We used a multi-year cohort of data from Polk County to estimate the effects of reduced caseloads on criminal recidivism. The data, provided by the Iowa Department of Correction, include probation and court information for 8,878 probationers under supervision during the years 2001-2007. Eighteen percent of these probationers were initially placed on the high-normal caseload after assessment; 20% were initially placed on ISP. Some cases were removed from analysis due to differences in programming within the agency. For example, all male ISP offenders take part in a special treatment protocol discussed in more detail in section 5.3. Female offenders are ineligible for this program, and thus receive a different treatment intervention; consequently we limit the analysis to males. Offenders assigned to special caseloads, such as sex offenders and offenders with serious mental illness, and were also excluded from this analysis, as were offenders who were assigned to jail diversion programs or similar programming. We show in this chapter that (1) POs who supervised ISP have smaller caseloads (about 30 offenders per PO) than POs who supervised high-normal offenders (about 50 offenders per PO), (2) both control and correctional interventions are more frequent for the ISP caseload, and (3) probationers remain on ISP caseloads sufficiently long (about one year on average) that the dose of treatment is meaningful. We will present evidence that Polk County uses a risk score based on the Iowa Risk Assessment tool to classify offenders and assign them to ISP. However, overrides are allowable, so this is a fuzzy RDD (FRD).16 5.2. Methodology
Regression discontinuity design (RDD) is a methodology for identifying a treatment effect. It is not an estimator. Most applications of RDD use least squares regression as the estimation procedure, but given our concern with criminal recidivism, we use partially parametric survival analysis (Cox Proportional Hazard models) to study time until criminal recidivism subject to right-hand censoring.17 Recidivism is equated to an arrest for a new offense; sensitivity testing will define a new offense variously. Censoring arises from one of three causes: data collection ends, the sentence ends¸ or there is a probation revocation
15 See Appendix 1 for more detailed descriptions. 16 Fuzzy RD (FRD) is used in cases when the probability of assignment to the treatment condition is less than
100%. In this case, probation officers are allowed to override the risk score to assign probationers to a supervision level, so the FRD is indicated.
17 Several authors discuss the Cox Proportional Hazard model (Kalbfleisch & Prentice, 1980; Lancaster, 1990; Cameron & Trivedi, 2005). Because our statistical programming was done with Stata, we benefited especially from Cleves, Gould, Gutierrez, & Marchenko (2008).
Table 5.1: Time 1/Time 2 Average Supervision Skill Measures
PPSQ- Officer Orientation Officer Skills
Case worker
Resource Broker
Law enforcement
Organizational climate Skba Global Miti4 Quser Ois Qcs
DRI-R
1.35 1.55 1.19 8.92 0.24 4.66 0.52 0.07 0.61 3.44 5.34
This document is a research report submitted to the U.S. Department of Justice. This report has not been published by the Department. Opinions or points of view expressed are those of the author(s) and do not necessarily reflect the official position or policies of the U.S. Department of Justice.

Abt Associates Inc. 43
for a technical violation. The third form of censoring is sometime known as a competing event. We assume that the competing event is independent of criminal recidivism. Rhodes (1986) provides some justification for this assumption, but if independence is untenable, the effect is likely to bias the treatment effect toward zero. Diagnostic testing (not reported here) failed to reject the null hypothesis of proportional hazards but rejected the null that the survival distribution was Weibull (and hence exponential). Similarly, we use a Cox Proportional Hazard model to study the time until a technical violation. The approach is the same as studying the time until criminal recidivism, but now the occurrence of an arrest for a new offense is the censoring event. The model specification imposes the restriction that the baseline hazard is not shifted by treatment.18 It also imposes the restriction that treatment does not affect the hazard for several control variables included in the model:
• LSI-R score – another instrument used to predict recidivism • Age and age-squared • Married • Alcohol or drug addiction • Employed • Number of prior convictions • Prior convictions for violent offenses
5.3. Supervision Conditions
The principal null hypothesis is that outcomes for offenders under ISP are no different than the outcomes for offenders under high-normal supervision. The alternative hypothesis is that offenders under ISP have better outcomes. For statistical testing to be worthwhile, however, we need to demonstrate that ISP is different from high-normal supervision in ways that lead us to expect better outcomes. That demonstration appears in this section. Officers in Polk County often supervise a mix of high risk and lower risk probationers, and their supervision assignments changed over the length of the study period. Computing an average caseload for these officers would be misleading. A requisite for evaluating the effectiveness of reduced caseloads is to establish that POs who supervise offenders under ISP in fact supervise fewer offenders than POs who supervise offenders under high-normal caseloads. This is deceptively difficult because POs typically have mixed assignments and the mixture changes over time. Polk County’s workload measure provides a way of overcoming this measurement challenge.19 Offenders placed on ISP are assigned a workload value of 0.0333, offenders placed on high-normal supervision are assigned a workload value of 0.0200, offenders placed on low-normal supervision are assigned a workload value of 0.0100, and so on for other supervision levels.
18 The model specification is a single equation that has a dummy variable and an interaction between r and ISP
when . This forces the baseline hazard to be the same. Covariates were not interacted. Crr ≥
19 Caseload refers to the number of offenders supervised by a probation officer. Workload refers to the level of effort required to supervise a caseload.
This document is a research report submitted to the U.S. Department of Justice. This report has not been published by the Department. Opinions or points of view expressed are those of the author(s) and do not necessarily reflect the official position or policies of the U.S. Department of Justice.

Abt Associates Inc. 44
These figures suggest that if officers supervised only ISP probationers, they would supervise about 30 offenders for every 50 offenders supervised by an officer with an exclusively high-normal supervision caseload—a 40% reduction in caseload. It is important to note that the officers’ caseloads may not in fact be 30 or 50 due to fluctuations in numbers of probationers at any given time and the mix of offenders the officer supervises (as it relates to risk level). In addition to extra time, ISP officers are also provided supplemental support through a special unit (the SMART program) to establish and maintain behavioral management programs for their caseloads. This study first evaluates whether reducing the caseload by 40 percent (from high-normal caseloads to ISP caseloads) improves supervision outcomes conditional on the use of EBP. Although it seems reasonable to conclude that caseloads are reduced by about 40 percent, it is difficult to show this through tabulations because POs supervise mixed caseloads; the mixture changes over time; and furthermore, POs have other duties (Figure 5.1).
This document is a research report submitted to the U.S. Department of Justice. This report has not been published by the Department. Opinions or points of view expressed are those of the author(s) and do not necessarily reflect the official position or policies of the U.S. Department of Justice.
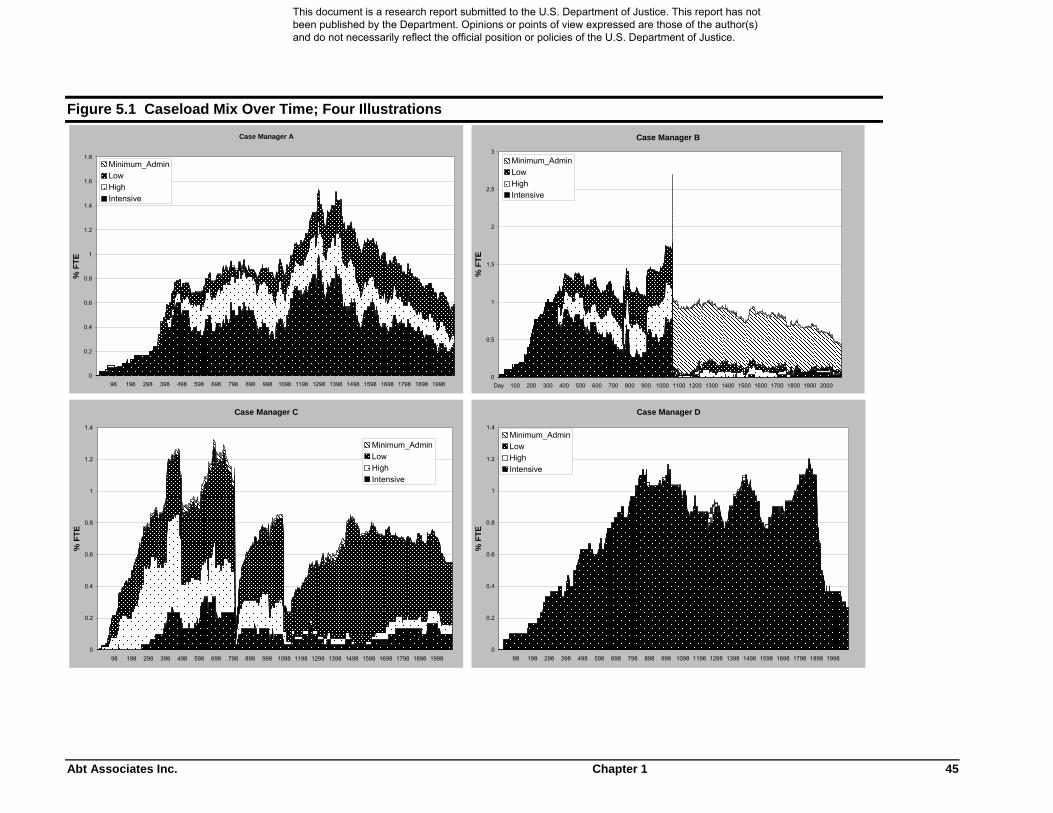
Figure 5.1 Caseload Mix Over Time; Four Illustrations Case Manager A
0
0.2
0.4
0.6
0.8
1
1.2
1.4
1.6
1.8
98 198 298 398 498 598 698 798 898 998 1098 1198 1298 1398 1498 1598 1698 1798 1898 1998
% F
TE
Minimum_AdminLow HighIntensive
Case Manager B
0
0.5
1
1.5
2
2.5
3
Day 100 200 300 400 500 600 700 800 900 1000 1100 1200 1300 1400 1500 1600 1700 1800 1900 2000
% F
TE
Minimum_AdminLow HighIntensive
Case Manager C
0
0.2
0.4
0.6
0.8
1
1.2
1.4
98 198 298 398 498 598 698 798 898 998 1098 1198 1298 1398 1498 1598 1698 1798 1898 1998
% F
TE
Minimum_AdminLowHighIntensive
Case Manager D
0
0.2
0.4
0.6
0.8
1
1.2
1.4
98 198 298 398 498 598 698 798 898 998 1098 1198 1298 1398 1498 1598 1698 1798 1898 1998
% F
TE
Minimum_AdminLowHighIntensive
Abt Associates Inc. Chapter 1 45
This document is a research report submitted to the U.S. Department of Justice. This report has not been published by the Department. Opinions or points of view expressed are those of the author(s) and do not necessarily reflect the official position or policies of the U.S. Department of Justice.

Panel A shows the workload for a PO who managed a mixed caseload of intensive, high-normal and low-normal probationers. We constructed this graph by multiplying the caseload on each day over a 2100 day period by workload weights. This officer’s workload was well below a full-time equivalent (FTE) level of 1 during the early period, perhaps because the officer was just joining the department or was transferring from other caseload assignments, for example, from a specialized caseload. Thereafter, the officer’s workload varied, but averaged about one FTE. Panel B shows the workload of a PO who abruptly moved from having a mixed caseload of intensive, high-normal and low-normal to having a caseload that was almost exclusively at the administrative and minimum supervision levels. This PO experienced a startup period with a low-risk probation supervision workload, which stabilized (with variation) at about 1 to 1.25 FTE before the caseload switched from primarily intensive, high-normal and low-normal to mostly administrative and minimum supervision. A third panel shows a different pattern: The PO had a mixed caseload, but there were short periods during which he or she almost stopped supervising anyone, followed by periods during which he or she reestablished a caseload. Over time the caseload shifted progressively away from intensive and high-normal supervision. Except for some relatively short exceptional periods, the officer’s workload was 1 FTE or lower. The last panel shows a PO who specialized in intensive supervision during the entire course of supervision. Except for the beginning and end of his or her supervision career, the workload was about 1 FTE. These figures are not altogether clear because POs have other duties, and because we have selected them purposefully to represent concepts in this discussion. Nevertheless, what the figures suggest is that Polk County imposes a workload of roughly one FTE on its officers, and officers with intensive and high-normal supervision caseloads have lower caseloads but nevertheless workloads that are equivalent to the workloads of other officers. That is, POs have latitude to spend more work time on offenders assigned to intensive supervision than on offenders assigned to high-normal supervision, the contrast of interest to this study. Thus ISP caseloads allow POs to spend about 1.7 hours on offenders supervised on ISP per hour spent on offenders supervised under high-normal caseloads. This ratio understates PO time available for ISP caseloads because Polk County maintains a special unit (the SMART program) staffed by four employees who work with POs to establish and maintain behavioral management programs for ISP caseloads. This does not necessarily mean that POs apply their work time disproportionately by supervision levels, but the following subsections suggest that they do. We must also establish that the smaller caseload is in fact accompanied by differences in supervision, i.e. increased supervision and differences in treatment provision. In this section we establish that there are differences in supervision practices and treatment provision between ISP and high-normal caseloads. It is important to note, however, that these measures capture the fact and frequency of treatment services, but cannot represent the quality of the treatment services and supervision contacts. The implementation of EBP in the ISP program in 2002 has, according to the department, changed the culture of ISP supervision (Bogue, personal communication, 2007). The department suggests that these changes have improved officers’ skills by better screening new officers; only more experienced officers or those with more advanced training may supervise ISP caseloads. ISP is administered through a
Abt Associates Inc. 46
This document is a research report submitted to the U.S. Department of Justice. This report has not been published by the Department. Opinions or points of view expressed are those of the author(s) and do not necessarily reflect the official position or policies of the U.S. Department of Justice.

Abt Associates Inc. 47
comprehensive program called SMART. While high-normal offenders treatment needs identified in the assessment process and are referred to treatment providers according to their case plan; male ISP offenders receive treatment services that are coordinated and delivered under the auspices of the SMART program.20 Offenders in the SMART program have more formalized treatment completion requirements. They progress (or regress) through phases until supervision ends for any reason, or reassessment indicates the offender can move to less intensive supervision. While our study was not designed to measure implementation effectiveness or fidelity to programming associated with EBP, we can derive estimates of supervision intensity differences between the smaller and higher caseloads. Gross measures of supervision contacts differ between high-normal and intensive supervision for the offenders included in the RDD analysis (see Table 5.2). Table 5.2 Supervision contacts Mean numbers of supervision contacts at one year High normal ISP Office 17.19 24.04 Phone 3.74 4.48 Home 0.3 1.09 Field 0.28 0.39
We use fixed-effects Poisson models (with POs fixed) to predict numbers of contacts for offenders assigned to ISP caseloads versus high-risk probationers for direct in-office, field contacts, phone, and home contacts. Holding risk score and time on supervision constant, ISP increases the predicted number of office contacts by 2.92 contacts per year; similarly, offenders on ISP have .63 more predicted phone contacts, .59 more predicted field contacts, and 1.0 more home contacts per year than high-normal offenders. This evidence demonstrates a difference in intensity between ISP and high-normal caseload supervision, particularly in face-to-face contacts in the office and home visits. Treatment provision is one of the hallmarks of EBP. By itself, a commitment to EBP does not mean that intensive supervision will mean a higher level of treatment provision, because EBP would direct rehabilitative services both to offenders under high-normal and intensive supervision. In Polk County, treatment services are performed by numerous agencies and organizations under contract to the Department of Probation. Treatment programs range from inpatient, residential treatment for drug addiction or mental health to non-intensive outpatient treatment or basic skills classes. Polk County has a sophisticated data system that captures information about multiple treatment interventions, the type, setting, and length. Tables 5.3 and 5.4 show more detail about treatment for offenders with Iowa Risk Scores between 18 and 23 (21 is the threshold for ISP). Table 5.3 shows the number of “needs” identified during the assessment process; Table 5.4 shows the rate at which those identified needs were met by the probation agency through treatment programming. A caveat: data on treatment intensity are difficult to describe given the variability in treatment programs, their intent, and the severity of needs of the clients referred to them. In this section we do attempt to do this, in broad strokes, though we acknowledge that our data do not include measures of treatment quality. Several characteristics of ISP offenders are notable: they do not appear to have higher needs on average than their high-normal supervision counterparts. For example, assessments for offenders on ISP show that the average offender has 2.71 identified needs; assessment for offenders on high-normal supervision
20 Female offenders are not eligible for the SMART program, and as a result are not included in this analysis.
This document is a research report submitted to the U.S. Department of Justice. This report has not been published by the Department. Opinions or points of view expressed are those of the author(s) and do not necessarily reflect the official position or policies of the U.S. Department of Justice.

show that the average offender has 2.78 identified treatment needs. Apparently treatment needs drive neither the risk scores nor the assignment to ISP. Table 5.3 Treatment Needs Treatment Needs for Iowa Risk Score 18-23 High normal ISP Mean number of identified treatment needs 2.78 2.71 At least one identified treatment need 92.96 88.67** Two or more treatment needs 81.45 74.64*** Three or more treatment needs 65.62 62.25*
***Denotes a p-value of .00001 or less; **denotes a p-value of <.01; *denotes a p-value of <.05 Although needs do not differ materially, the nature of service delivery does vary somewhat between offenders on high-normal supervision and offenders on ISP supervision. ISP offenders are more likely to receive group treatment than individual treatment, and ISP offenders have shorter treatment duration than high-normal offenders, although the differences in treatment duration are only statistically significant for one mean group (See Table 5.4). Table 5.4 shows the treatment provided to meet the first three “needs” identified in the agency’s offender treatment data, and the duration and modality of the provided treatment. Table 5.4 Treatment duration and setting
For bandwidth 18-23a Treatment /need 1 Treatment /need 2 Treatment /need 3 Supervision intensity High normal ISP High normal ISP High normal ISP Mean days in treatment 155.53 150.41 159.33 141.37 189.47 150.68* % group treatment 42.62 56.2*** 54.36 59.7 50 57.99 % individual treatment 33.53 25.85*** 15.9 14.99 17.76 14.24
Notes: (a) Bandwidth 18-23 refers to probationers with risk scores between 18 and 23, inclusive. A risk score of 21 or higher triggers assignment to ISP. “Treatment” refers to a broad array of services provided to offenders. Substance abuse treatment is certainly the most common, followed by basic skills interventions (for example, financial management or basic skills treatment). Table 5.5 shows the breakdown of treatment services received by offenders. Offenders may receive multiple episodes of treatment; the figures in this table are inclusive of the first three treatment interventions. The treatment types clearly vary for offenders on ISP compared to high-normal offenders. ISP offenders get more batterer’s programming, behavioral treatment, and sex offender treatment; high-normal offenders get more substance treatment and basic skills programming. We used logistic regression to estimate the probability of receiving and completing treatment for offenders assigned to ISP and high-risk caseloads. Holding risk score constant, offenders assigned to ISP are somewhat more likely to be assigned to treatment (85% vs. 80%), but 10% less likely to complete treatment (63% vs. 73%) once they receive it. While fewer ISP offenders complete treatment successfully than high-normal offenders, the treatment for ISP offenders appears to be aimed at addressing behavioral issues rather than skills acquisition. Therefore, it may be that treatment is more difficult to complete for ISP offenders.
Abt Associates Inc. 48
This document is a research report submitted to the U.S. Department of Justice. This report has not been published by the Department. Opinions or points of view expressed are those of the author(s) and do not necessarily reflect the official position or policies of the U.S. Department of Justice.

Abt Associates Inc. 49
Table 5.5 Treatment type For bandwidth 18-23 High- Normal ISP Any Substance Treatment 64.0% 45.9%***Any Mental Health Treatment 5.5% 7.3% Any Basic Skills Treatment 42.6% 35.3%***Any Batterer's Treatment 7.7% 25.1%***Any Behavioral Treatment 18.8% 24.5%** Any Sex Offender Treatment 1.7% 4.5%***
***Denotes a p-value of .00001 or less; **denotes a p-value of <.01; *denotes a p-value of <.05 This subsection shows that treatment needs do not vary materially for offenders who are at the margin of qualifying for ISP. That is, those offenders who just miss qualifying have treatment needs that are not much different than the treatment needs of offenders who just qualify for ISP. This is what we would expect to observe and, in fact, if it were not true, we would question that there is enough difference between ISP and high-normal supervision to test the treatment effect using an RDD. Service delivery for high-normal and ISP differ, but it is difficult to qualify or quantify those differences beyond the broad strokes we depict here. The problem is that offenders placed on ISP appear to be referred to different types of treatments than do their counterparts on high-normal. We cannot say that treatment delivered as part of ISP is more intense, more frequent, or otherwise better than treatment delivered as part of high-normal supervision. Offenders on ISP and high risk probation are reassessed at 6 months, or when there is a change in probation status, for example, when there is a revocation or early discharge. Ultimately, most ISP offenders graduate to the general caseload after being reassessed using the Iowa risk assessment tool. Program staff estimates the average length on ISP as 5 months (Personal communication, 2007); but our data show that the median length of time on ISP is 342 days; mean time on ISP is 412 days. Approximately 60% of ISP offenders are reassigned to a lower risk category at the time of first reassessment; for those who are reassigned, the mean time on ISP is 190 days. Thus a one-year dose of ISP seems typical. 5.4. Analysis and Findings
There are multiple diagnostic tests that we used to help determine if RDD is appropriate for this set of data. At a minimum for RDD to work, assignment to ISP must be based on a risk score such that offenders with risk scores greater than or equal to a critical threshold value (CTV) on the Iowa Risk Score must have selection probabilities into ISP that are sharply higher than for offenders with risk scores just less than the CTV. According to Polk County’s classification policy, offenders with an Iowa Risk score21 of 21 or higher should be assigned to ISP. There are override criteria for offenders with lower scores, but Figure 5.2 shows that the classification policy is broadly followed.
21 The Iowa Risk Instrument scores numerically starting at -5. For simplicity in interpretation, we have rescaled
scores by adding 6 points.
This document is a research report submitted to the U.S. Department of Justice. This report has not been published by the Department. Opinions or points of view expressed are those of the author(s) and do not necessarily reflect the official position or policies of the U.S. Department of Justice.

Abt Associates Inc. 50
Figure 5.2 Selection into ISP as a Function of the Iowa Risk Score
0%
10%
20%
30%
40%
50%
60%
70%
80%
90%
100%
1 3 5 7 9 11 13 15 17 19 21 23 25 27 29 31 33 35
Prop
ortio
n of
offe
nder
s as
sign
ed to
ISP
or H
igh
norm
al ISP
High normal
Overrides
The figure identifies offenders by risk score on the horizontal axis. It reports the percentage of offenders assigned to ISP and to high-normal caseloads on the vertical axis. There is a sharp break in the probability of assignment to ISP at the CTV of 21. Almost all offenders with risk scores of 21 or higher are assigned to ISP. The probability of assignment to high-normal caseloads is about 0.80 for offenders with risk scores between 18 and 20. To avoid contaminating the high-normal caseload with the low-normal caseload (typically scores between 13 and 17), the rest of the analysis reported here restricts offenders to those with risk scores of 18 and higher. Thus, on the basis of this minimal diagnostic test, Polk County seems to qualify for a RDD. However, since the probability of treatment is not absolute at zero or 1, we employ a fuzzy RDD design.22 Another useful test is to determine if risk scores vary continuously around the CTV. If assessment officers have external motivation and ability to “game” the risk score, we would expect to see a discontinuous distribution of risk scores between 20 and 21. This would challenge the validity of any comparison of groups to the left and right hand side of the CTV, as we would know the risk determinations to be artificial and assignments to treatment based on a continuous measure of risk would be suspect. In fact, there is a modest discontinuity is the distribution of risk scores between 20 and 21, but given the overall variation in risk scores, this appears to be attributable to the fact that the risk scores
22 There are two forms of RDD. In the first form, the probability of assignment to treatment (ISP in this context)
jumps from zero to one at the discontinuity point (CTV). This is called a sharp RDD. In the second form, the probability may be greater than zero to the left of the CTV or less than one to at the CTV or both. This is called a fuzzy RDD (FRD).
This document is a research report submitted to the U.S. Department of Justice. This report has not been published by the Department. Opinions or points of view expressed are those of the author(s) and do not necessarily reflect the official position or policies of the U.S. Department of Justice.

are lumpy. See figure 5.3. Specifically, if true risk scores of 21 were manipulated to inflate the recorded number of risk scores of 20, we would expect that recorded risk scores of 21 would be less than the recorded risk scores of 22. This does not happen. We conclude that RDD passes this diagnostic test. Figure 5.3 Distribution of the Risk Scores about the Critical Threshold Value
0.0
5.1
.15
Den
sity
16 18 20 22 24 26risk score
Distribution of Risk Scores about the Threshold
Offenders supervised under ISP and high-normal caseloads have high rates of recidivism; over two-thirds are arrested for some new charge during or after supervision; nearly half of these offenders are arrested within six months of the start of their supervision period. Most new charges are for public order offenses (65%), including traffic violations, which are often not punishable by lengthy incarcerations or, in many cases, by any criminal sanction. The majority (71%) of offenders with a new arrest during their supervision period also have their probation revoked, although the revocation does not always immediately follow the new arrest, and often it is for a technical violation of the conditions of supervision. Although two of every three arrests are for public order offenses, the other third are for more serious matters: drug-law violations (8%), property (12%) and violent crimes (15%). Regardless of the reason for revocation or type of crime for which the offender is arrested, the time to arrest and time to revocation are both heavily skewed toward the first year of supervision. See Figure 5.4.
Abt Associates Inc. 51
This document is a research report submitted to the U.S. Department of Justice. This report has not been published by the Department. Opinions or points of view expressed are those of the author(s) and do not necessarily reflect the official position or policies of the U.S. Department of Justice.

Figure 5.4 Days to failure on supervision
050
100
150
200
250
Freq
uenc
y
0 200 400 600 800 1000Days
Days to new arrest
020
4060
Freq
uenc
y
0 500 1000Days
Days to revocation
We employed a Cox proportional hazards model to estimate criminal recidivism and we used a RDD to identify the effects of reduced caseload on criminal recidivism. As discussed earlier, we defined recidivism as an arrest for a new charge during or after the probation supervision period. Because the effectiveness of ISP may differ depending on the nature of the crime, we alternatively defined a new arrest as an arrest for:
• Public order, drug-law, property or violent crime. • Drug-law, property or violent crime. • Property or violent crime.
We estimated treatment effects using several bandwidths--a bandwidth is the range of Iowa Risk Scores that enter the analysis. For ease of interpretation and explanation we present results for a bandwidth between 18 and 23, which appears to be “optimal” based on sensitivity testing. Table 5.4 presents results for additional bandwidths. We conducted separate analyses of arrest outcomes during three different time periods:
• Six months following start of supervision • Eighteen months following start of supervision • Thirty months following start of supervision
Treatment effects are reported as hazards. Thus, Table 5.4 shows that when the follow-up period is limited to six months, ISP reduces the likelihood of criminal recidivism by 25.5% percent (p=.037) for all offenses, 39.4% (p=.037) for drugs, property and violent offenses, and 45% (p=.023) for property and violent offenses (drug offenses excluded). ISP clearly reduces the hazard of recidivism when compared to high normal supervision. For longer periods of time, recidivism is reduced significantly for property and violent crimes, 37% at eighteen months and 30 months respectively.
Abt Associates Inc. 52
This document is a research report submitted to the U.S. Department of Justice. This report has not been published by the Department. Opinions or points of view expressed are those of the author(s) and do not necessarily reflect the official position or policies of the U.S. Department of Justice.

Table 5.6 The Effects of ISP on Criminal Recidivism Maximum follow-
up period six months All offenses
Drugs, property and violence Property and violence
Bandwidth Treatment
effect Probability
effect=1 Treatment
effect Probability
effect=1 Treatment
effect Probability
effect=1 20 21 0.852 0.112 0.78 0.122 0.68 0.047 19 22 0.661 0.031 0.412 0.01 0.346 0.004 18 23 0.745 0.037 0.606 0.037 0.55 0.023 18 24 0.742 0.032 0.597 0.031 0.552 0.021 18 25 0.763 0.044 0.63 0.045 0.58 0.029 18 26 0.766 0.044 0.622 0.039 0.587 0.031 18 27 0.774 0.05 0.616 0.035 0.578 0.026 18 28 0.766 0.042 0.621 0.036 0.589 0.03 18 29 0.748 0.03 0.58 0.02 0.546 0.016 18 30 0.734 0.022 0.564 0.015 0.535 0.013
Maximum follow-up period
eighteen months All offenses Drugs, property and
violence Property and violence
Bandwidth Treatment
effect Probability
effect=1 Treatment
effect Probability
effect=1 Treatment
effect Probability
effect=1 20 21 0.858 0.074 0.837 0.148 0.756 0.064 19 22 0.639 0.006 0.456 0.004 0.392 0.002 18 23 0.815 0.061 0.707 0.059 0.631 0.028 18 24 0.796 0.039 0.688 0.043 0.622 0.022 18 25 0.796 0.037 0.68 0.037 0.627 0.022 18 26 0.796 0.034 0.654 0.023 0.614 0.017 18 27 0.811 0.047 0.654 0.022 0.609 0.015 18 28 0.809 0.044 0.653 0.021 0.613 0.015 18 29 0.794 0.031 0.618 0.011 0.578 0.008 18 30 0.784 0.024 0.612 0.009 0.573 0.007
Maximum follow-up period three
years
All offenses Drugs, property and violence
Property and violence
Bandwidth Treatment
effect Probability
effect=1 Treatment
effect Probability
effect=1 Treatment
effect Probability
effect=1 20 21 0.839 0.046 0.823 0.123 0.729 0.042 19 22 0.643 0.005 0.504 0.009 0.426 0.003 18 23 0.804 0.046 0.705 0.053 0.626 0.023 18 24 0.789 0.03 0.694 0.043 0.627 0.021 18 25 0.798 0.035 0.689 0.037 0.636 0.022 18 26 0.797 0.032 0.662 0.023 0.622 0.017 18 27 0.814 0.045 0.668 0.025 0.624 0.017 18 28 0.818 0.047 0.672 0.025 0.634 0.019 18 29 0.804 0.034 0.639 0.014 0.601 0.01 18 30 0.794 0.027 0.634 0.012 0.598 0.009
However, our power calculations tell us that the analysis is only sufficiently powered to identify very large treatment effects, despite the fact that the samples are large. While in this instance we did observe
Abt Associates Inc. 53
This document is a research report submitted to the U.S. Department of Justice. This report has not been published by the Department. Opinions or points of view expressed are those of the author(s) and do not necessarily reflect the official position or policies of the U.S. Department of Justice.

Abt Associates Inc. 54
treatment effects that met this threshold, the standard errors are higher than we would hope to see with very precise estimates.23 Table 5.7 Number of Cases Entering the Analysis as a Function of Bandwidth
Bandwidth High-normal cases ISP cases 20 21 491 413 19 22 906 796 18 23 1322 1106 18 24 1322 1344 18 25 1322 1531 18 26 1322 1688 18 27 1322 1782 18 28 1322 1870 18 29 1322 1908 18 30 1322 1932
Based on the literature review, we are concerned that ISP may increase the rate of revocations for technical violations (closer observation of offenders may result in more frequent detection of violations). The statistics behind testing the null hypothesis that ISP does not affect revocations for technical violations are familiar: we change the dependent variable to revocation for a technical violation and treat an arrest for a new crime as a censoring event (or an event that limits our observation of the data). Summarizing the results is straightforward: There is no strong evidence that ISP increased the hazard rate for revocations for technical violations. The estimates based on a maximum follow-up period of six months have different directions than the estimates based on longer follow-up periods. When the maximum follow-up period is six months, the effects are significant at 0.10 only once. For longer follow-up period, the estimates never approach statistical significance. Still, conclusions require caution. The minimum detectable effects are large. There is not much power to detect moderate effects on increasing the rate of revocations for technical violations. Polk County distinguishes offenders who should be placed on moderate-normal supervision (risk scores between 13 and 17) and offenders who should be placed on high-normal supervision (risk scores between 18 and 20). We can pose the same question as above, but now applied to these supervision levels: Does high-normal supervision reduce the rate of recidivism below what it would have been had the same offender been placed on moderate-normal supervision? Probation officers have more time for high-normal supervision levels. According to case weights used by Polk County, an officer with a caseload of exclusively low-normal probationers will have double the number of probationers to supervise than an officer with an exclusively high-normal caseload.
23 Readers considering an RDD approach for other jurisdictions are cautioned that Polk County barely provided an
adequate sample size for performing the analysis. Using RDD in even smaller jurisdictions may be ill advised.
This document is a research report submitted to the U.S. Department of Justice. This report has not been published by the Department. Opinions or points of view expressed are those of the author(s) and do not necessarily reflect the official position or policies of the U.S. Department of Justice.

Abt Associates Inc. 55
In fact, high-normal supervision appears to reduce the rate of criminal recidivism for offenders who are at the margin between assignment to high-normal supervision and moderate-normal supervision. When recidivism is defined as recidivism for a drug, property or personal crime, the evidence is compelling. Participation in high-normal supervision reduces criminal recidivism by about 50 percent. With one exception (six month follow-up and bandwidth of 14-20) the effect is significant at 0.05. When recidivism is defined as recidivism for a property or personal crime, the evidence is again compelling. Participation in high-normal supervision reduces criminal recidivism by about 52 percent. With one exception (six month follow-up and bandwidth of 17-18) the effect is significant at 0.05. Defining criminal recidivism as an arrest for any new crime, the evidence is least convincing. The reduction in arrest rates is about 11 percent, but this effect approaches statistical significance only when the risk period is three years. 5.5. Discussion
We find strong evidence in Polk County that increased supervision intensity for high risk probationers reduces the risk for recidivism. However, we also note some cautions. The size of the estimated treatment effect may be understated – the inferences rely on a fuzzy regression discontinuity design. Practically 100 percent of offenders with risk scores of 21 are assigned to ISP. Roughly 20 percent of offenders with risk scores of 20 are also assigned to ISP. The consequence is that the treatment effect will be diluted.24 Additionally, the RDD design allows us to estimate the treatment effect for those offenders on the margins of the cutoff point; we cannot extend the inference to the entire population of medium and high risk probationers (or else risk losing the benefit of the RDD). Our findings in this site are encouraging for proponents of EBP-- as we have defined it for this report--a combination of resource allocation, risk assessment, and responsivity to need. We have determined that Polk has indeed implemented the major components of EBP, and officers and supervisors routinely identify and intervene to address offenders’ criminogenic needs. Although treatment duration is slightly shorter and treatment completion is lower for higher risk probationers, the vast majority of offenders on both high normal and ISP caseloads receive treatment. Higher risk probationers receive more attention from their supervising officers, yet we find no significant “supervision effects” of the sort that derailed surveillance and control oriented ISPs. We believe these findings are strong evidence that reduced caseloads in combination with programming in the “What Works” tradition, can reduce offenders’ risk of recidivism.
24 See Appendix II for more detailed discussion of a correction for this.
This document is a research report submitted to the U.S. Department of Justice. This report has not been published by the Department. Opinions or points of view expressed are those of the author(s) and do not necessarily reflect the official position or policies of the U.S. Department of Justice.

Abt Associates Inc. 56
6. Chapter 6: Colorado
The Colorado Department of Probation incorporated some supervision practices that are now associated with EBP in the 1990s, including the use of case assessment to allocate supervision resources. The state was one of the earliest to implement assessments that include probationer recidivism risk scoring as well as probationer service needs. All adult regular supervision probationers are assessed using the Level of Service Inventory (LSI), the predecessor assessment tool to the Level of Service Inventory- Revised (LSI-R) that is used more frequently in probation departments. These practices have been implemented statewide since the mid-1990s, meaning Colorado should offer an opportunity to observe the effects of enhanced supervision practices over time. The study team initially sought to implement RCT in several judicial districts in Colorado, capitalizing on the relative uniformity of supervision standards and practices in the districts. Several judicial districts were initially identified as potential RCT sites, but like many other jurisdictions, the agency’s resources did not allow for implementation of a design that required maintenance of reduced caseloads for an extended period. Thus, the four largest districts in Colorado25 participated in the RDD study. The research questions are the same as were posed in the previous chapters. We seek to test whether the use of reduced caseloads in an environment that employs EBP reduces criminal recidivism, and we seek to test whether the use of reduced caseloads increases revocations for technical violations of the conditions of supervision. We first seek to establish that the state as a whole, and the four districts we focus on, have indeed implemented EBP. Section 6.1 poses and answers essential questions: Does Colorado employ EBP? Are high-risk offenders supervised by POs with reduced caseloads? Section 6.2 shows that Colorado provides a suitable setting for applying a regression discontinuity design. Section 6.3 presents findings. 6.1. Supervision Conditions
The theory supporting our research is that reduced caseloads will lead to reduced recidivism without large increases in technical revocations but only in an environment that employs EBP. It is necessary to answer the question: Does Colorado employ the key components of EBP this study sought to establish? The State of Colorado implemented many elements associated with Evidence Based Practices in the mid 1990s, although some key elements (for example, Motivational Interviewing with quality assurance) were discontinued due to resource intensity. Statewide efforts to integrate responsivity into treatment referrals and caseplans began in 1994 as well, but state level administrators believe that the level of implementation varies widely across the state.
25 Excluding Denver.
This document is a research report submitted to the U.S. Department of Justice. This report has not been published by the Department. Opinions or points of view expressed are those of the author(s) and do not necessarily reflect the official position or policies of the U.S. Department of Justice.

Abt Associates Inc. 57
The study team interviewed Chief Probation Officers for each district to understand more about implementation in their individual agency. Table 6.1 shows that implementation was limited during the time our data cohort was under supervision. Table 6.1 EBP Implementation, 1997-2007
During the study period, did the district… Dist A Dist B Dist C Dist D
Do assessment & triage? Yes (with
exceptions) Yes Yes Yes
Perform case planning/ treatment with officer training?
No Only in
final year
Yes Only in final 3-4
years
Train officers in and practice Motivational Interviewing?
No Only in
final year
Only in final year
Only in final year
These are important findings. They cause us to question whether Colorado employed EBP in the manner identified as effective by the “What Works” literature. When our research team selected the three study sites, it appeared that Colorado employed the elements of EBP we identify as core components earlier in this report. After selecting Colorado for study, we studied field practices, and found suggestions to the contrary: Colorado had not been using these key elements of EBP26 for the length of the ten year study period. We performed assessments of officer supervision skills using audio tapes of supervision contacts to gauge general supervision skills in each study district in Colorado—though the retrospective RDD analysis did not allow us to tie prior outcomes to current officer skills. Our tape assessments of probation officers also indicate that officers’ supervision skills are underdeveloped and that officers do not necessarily reflect comfort with applying supervision techniques associated with EBP. However, the officers who participated in tape ratings are very satisfied with the organizational climate of their agencies. Please refer to Chapter 4 for variable definitions. Table 6.2 Average Supervision Skill Measures27
PPSQ- Officer Orientation Officer Skills
Caseworker Resource
Broker Law
enforcement Organizational
climate Skba Global Miti4 Quser Ois Qcs DRI-
R
1.22 1.56 1.07 10.69 0.01 4.53 0.43 -0.04 0.49 3.18 5.48
26 Numerous practices and strategies are identified in the What Works literature as components of EBP. We
investigated the components our expert panel and research team identified as core components, but we recognize that Colorado may use other supervision strategies that are consistent with EBP but were not included in this study.
This document is a research report submitted to the U.S. Department of Justice. This report has not been published by the Department. Opinions or points of view expressed are those of the author(s) and do not necessarily reflect the official position or policies of the U.S. Department of Justice.

Abt Associates Inc. 58
Appendix I contains more detailed findings for the 32 officers who participated in T1 and T2 waves of tape critiques, including information on the assessment scales used. As we show in the previous chapter on Polk County, we must first determine that there is in fact a difference in treatment for offenders assigned to maximum level supervision and medium level supervision. The data available for analysis of supervision practices, in particular evaluation of case planning and response to identified needs, was limited for the districts in the Colorado analysis. Nevertheless, we were able to document differences between medium and maximum supervision intensities (Table 6.3). Across all four districts, the average LSI score was higher for offenders who were supervised under the maximum level than under the medium supervision level. The rate of providing treatment appears to be somewhat higher when offenders are supervised at the maximum level, although this may reflect differences in need. Contact rates are higher for offenders supervised at the maximum level. However, recidivism is also higher for offenders supervised at the maximum level. The higher rate of recidivism is not definitive for evaluation for reduced caseloads, because the benefits of reduced caseloads may not fully offset the disadvantages of supervising offenders with higher risks under the reduced caseload condition. Estimates of treatment effectiveness based on RDD will be more valid. Table 6.3 Study site characteristics
Dist A Dist B Dist C Dist D Med Max Med Max Med Max Med Max
Percent of all probation cases on supervision level 26% 15% 36% 22% 25% 14% 20% 7% Mean LSI score 23.4 32.8 23.3 32.6 22.8 32.3 22.3 32.4 Has any treatment episodes 17% 18% 24% 25% 24% 26%* 24% 29%*** Rate of contacts per year In-person 6.06 7.84*** 7.48 8.94*** 7.38 7.93** 5.49 6.30*** Phone 3.56 5.04*** 2.72 3.27*** 4.27 4.91*** 3.15 4.55*** Average probation outcomes New filing for serious offense 36% 48%*** 43% 56%*** 36% 46%*** 32% 47%*** Technical Revocations 9.5 9.7 8 6.7* 10 10 12 12
***Denotes a p-value of .00001 or less; **denotes a p-value of <.01; *denotes a p-value of <.05 We use fixed-effects Poisson models (with POs fixed) to predict numbers of contacts for offenders assigned to maximum intensity caseloads versus those assigned to medium intensity for direct (non-collateral) in-office, field contacts, phone, and home contacts (Table 6.4).28 Holding risk score and time on supervision constant, assignment to maximum intensity increases the predicted number of office contacts by between .44 and 1.2 face-to-face contacts per year; offenders at maximum also have more home and phone contacts across the board. Case planning contact rates are similar for maximum and medium offenders in three of four districts. Recorded rates of contacts at one year are similar in the Colorado districts and Oklahoma City, while office and other face-to-face contacts were much higher in Polk County for both high-normal and ISP offenders. 28 Treating the PO as a fixed-effect would be nonsense if POs specialized with some having maximum level
supervision and others having medium level supervision. They do not specialize. POs have mixed caseloads so introducing a covariate for PO identity holds constant differences in work practices across POs.
This document is a research report submitted to the U.S. Department of Justice. This report has not been published by the Department. Opinions or points of view expressed are those of the author(s) and do not necessarily reflect the official position or policies of the U.S. Department of Justice.

Table 6.4 Predicted number of contacts per year
Dist A Dist B Dist C Dist D
Max Med Max Med Max Med Max Med Face to Face 8.01 7.57 7.80 6.86 7.98 6.78 6.43 5.40 Home 0.34 0.27 0.40 0.39 0.62 0.48 0.18 0.17 Phone 6.73 5.74 3.35 3.36 6.25 5.29 5.35 4.39 Case planning 0.39 0.43 0.32 0.33 0.65 0.53 0.12 0.13
Colorado’s official supervision standards determine the number of contacts required for offenders by supervision intensity. According to the 2005 Standards for Probation of the Colorado Judicial Branch, maximum level supervision dictates two face-to-face contacts with an offender per month and one home visit in the first 90 days of supervision, with subsequent home visits to be determined by the case plan. The standards for medium level offenders are one face-to-face contact per month, with residence verification every two months. We mention the standards only to demonstrate that there is a demonstrable difference in supervision policy, and we see significant differences in face-to-face contacts by supervision level intensity in three of the four districts. However, no district meets the targets proposed in the supervision standards. Probation officers in Colorado may have multiple roles on probation cases. Several officers may be assigned to an offender at a particular time. This complicates an assessment of caseload and workload, particularly given the natural fluctuations in caseload and officer assignments. The research question was whether reduced caseloads change probation outcomes. Therefore, our immediate task was to determine if caseloads vary systematically, and if so, by how much? Multiple officers were assigned to each probation record in our data cohort, but the dates of officer assignments to offenders are unknown, meaning we were unable to construct straightforward caseloads for each officer. We required an indirect approach. We examined the distribution of cases for officers over a one year period, and determined which officers had a high proportion of cases assigned to maximum level supervision. Given the observed distribution, we set that threshold at 33%. We then asked: Did POs who were above this threshold have lower caseloads than POs below this threshold? We can determine from Table 6.5 that relatively few officers carried caseloads with a high proportion of maximum intensity cases. Table 6.5 Percent of Max-level cases on caseload
1 year N
(POs) Percent 0-0.1 659 61.19 0.1-0.25 364 33.80 0.25-0.33 39 3.62 0.33-0.5 14 1.30 0.5-0.67 1 0.09 0.67-0.75 0 0.0 0.75-1 0 0.0
We then modeled the total number of cases associated with an officer, as a function of the percentage of offenders on that officer's caseload that was maximum intensity. The percentage maximum is continuous.
Abt Associates Inc. 59
This document is a research report submitted to the U.S. Department of Justice. This report has not been published by the Department. Opinions or points of view expressed are those of the author(s) and do not necessarily reflect the official position or policies of the U.S. Department of Justice.

This model allows us to estimate the changes we might expect to see in an officer’s caseload if his or her overall proportion of maximum cases changes from, for example, 25% to 33%. Table 6.6 shows the predicted mean and median number of offenders who were supervised by POs who fell into the two categories- “Low” (under 25% of their caseload is maximum), and “High”, over 33% of their caseload is maximum. Table 6.6 Estimated Number of Offenders Supervised
Mean total offenders Mean Median Low (Officers with <25% of MAX on caseload) 7040 60.35469 22 High (Officers with >25% of MAX on caseload) 270 21.86296 11
Both the predicted mean and median numbers of offenders are significantly lower for officers who supervise maximum intensity cases than those who supervise medium intensity cases, indicating there is a difference in caseload and workload for officers associated with maximum cases when compared to medium cases. It is important to note that the figures in the tables above are not a determination of caseload size, but rather an estimate of the number of cases associated with officers. Given the lack of dates associated with officer assignments, we are not able to determine discrete caseload numbers for the officers in our cohort. We are able to use our estimates of caseload assignments and our analysis of supervision contacts to conclude that offenders assigned to maximum intensity supervision receive more attention from their supervising probation officers than those assigned to medium level supervision. Thus we have established that a regression discontinuity will test a difference in treatment conditions between medium and maximum supervision. 6.2. Data and Measures
The state Division of Probation Services provided the study team with a multi-year cohort of probation data, from 1997-2007, which includes probationers from all 22 judicial districts in the state. Of these, four districts were determined to be eligible for the RDD study. Outcome data were derived from court filings data provided by the Colorado State Court Administrator’s Office. Colorado’s official supervision standards specify LSI assessment score cutoffs for medium supervision at 19 and maximum supervision at 28. Clear discontinuity points can be observed at those levels (see Figure 6.1). Thus our ideal bandwidth to observe variation in treatment effects due to reduced caseloads is 28-29. As we demonstrated in Polk County, several diagnostic tests are required to determine whether an RDD is feasible in a jurisdiction. The simplest and most necessary is determining the existence of a discontinuity point. An additional important test is that the risk scores have a continuous distribution about the discontinuity point. Across the four candidate districts in Colorado, the probability of assignment to the maximum supervision level based on a critical value of the risk score is between 72% (District C) and 87% (District B), thus we employ a fuzzy RDD (Figure 6.1). The important observation based on Figure 6.1 is that there is a sharp break at a risk score of 28. Immediately below that critical risk score, a probationer is most likely
Abt Associates Inc. 60
This document is a research report submitted to the U.S. Department of Justice. This report has not been published by the Department. Opinions or points of view expressed are those of the author(s) and do not necessarily reflect the official position or policies of the U.S. Department of Justice.

assigned to medium risk. Immediately above that critical risk score, an offender is most likely assigned to a maximum level of supervision. Figure 6.1 Probability of Selection into Maximum Supervision
We also must determine the variation of risk scores around the CTV to test whether there is a discontinuous distribution of offenders at the cutoff point for supervision intensity assignments. If there is evidence that officers determine risk scores based on external factors (for example, staffing available to supervise higher risk cases) rather than on the internal properties of the risk assessment tool, then the RDD would be invalid—a basic assumption of RDD is that subjects are ordered according to some systematic criteria applied equally to the entire population, allowing us to compare those that are most alike on either side of the CTV. See Figure 6.2.
Abt Associates Inc. 61
This document is a research report submitted to the U.S. Department of Justice. This report has not been published by the Department. Opinions or points of view expressed are those of the author(s) and do not necessarily reflect the official position or policies of the U.S. Department of Justice.

Figure 6.2 Distribution of the Risk Scores about the Critical Threshold Value District A
District B
020
040
060
0Fr
eque
ncy
15 20 25 30 35Asmt_Reasmt: Total score for the 1st assessment found for this probation term
020
040
060
0Fr
eque
ncy
15 20 25 30 35Asmt_Reasmt: Total score for the 1st assessment found for this probation term
District C
District D
020
040
060
080
0Fr
eque
ncy
15 20 25 30 35Asmt_Reasmt: Total score for the 1st assessment found for this probation term
020
040
060
080
010
00Fr
eque
ncy
15 20 25 30 35Asmt_Reasmt: Total score for the 1st assessment found for this probation term
As with Polk, there does appear to be a slight break in the distribution of risk scores in three of the four judicial districts included in the study, but these breaks do not appear to indicate systematic “gaming” of the risk scoring system. We would expect to see fewer offenders on the maximum side of the CTV if officers were being pressured to reduce demands on staffing, while instead we see more offenders immediately to the right of the cut-off. We conclude here that each selected district is a candidate for the RDD analysis. 6.3. Analysis and Findings
Overall, sixty percent or more of all offenders in the study cohort had a new court filing at some point after starting probation supervision. (Table 6.7.) A significantly higher proportion of offenders at the maximum supervision level had a new filing than medium- level offenders, a difference of 5-11% across districts. Across all study districts, offenders who began probation at maximum intensity supervision were significantly more likely to have a new filing for drug and property offenses than those who began supervision at medium intensity. In three of the four districts, maximum level probationers were significantly more likely to have a new filing for violent or sex offenses. Offenders at medium level supervision were more likely to have a new filing for less serious offenses, including public order and traffic offenses.
Abt Associates Inc. 62
This document is a research report submitted to the U.S. Department of Justice. This report has not been published by the Department. Opinions or points of view expressed are those of the author(s) and do not necessarily reflect the official position or policies of the U.S. Department of Justice.

Table 6.7 New court filings by charge typea
Dist A Dist B Dist C Dist D
Med Max Med Max Med Max Med Max New filing for any offense 69% 76%*** 77% 83%*** 69% 74%*** 63% 74%*** Drug 8% 10%** 10% 13%*** 8% 10%** 8% 11%*** Sex/Violent Offenses 9% 12%** 11% 13%** 12% 13% 8% 12%*** Property 13% 17%** 18% 22%*** 11% 13%** 12% 16%*** Other 32% 28%** 33% 27%*** 32% 27%** 31% 26%** a Multiple charges may appear for each probationer ***Denotes a p-value of .00001 or less; **denotes a p-value of <.01; *denotes a p-value of <.05 Offenders who began at medium level supervision also had longer average times to new court filing and revocation than those who began supervision at maximum (Table 6.8). Table 6.8 Time to new court filing and revocation
Time to arrest and revocation Dist 1 Dist 2 Dist 3 Dist 4
Med Max Med Max Med Max Med Max Mean time to new filing (days) 342 254 457 333 360 265 405 292 Mean time to revocation (days) 405 325 478 370 428 355 478 386 We employed a Cox proportional hazards model to estimate criminal recidivism and we used a RD design to identify the effects of reduced caseload on criminal recidivism. As discussed earlier, we defined recidivism as a filing for a new charge during or after the probation supervision period. Because the effectiveness of maximum supervision may differ depending on the nature of the crime, we alternatively defined a new filing as an filing for:
• Public order, drug-law, property or violent crime. • Drug-law, property or violent crime. • Property or violent crime.
We estimated treatment effects using ten bandwidths--a bandwidth is the range of Level of Service Inventory (LSI) Scores that enter the analysis. We conducted separate analyses of new court filings during three different time periods:
• Six months following start of supervision • Twelve months following start of supervision • Eighteen months following start of supervision
We report the number of cases for each district at each bandwidth comparison (Table 6.9).
Abt Associates Inc. 63
This document is a research report submitted to the U.S. Department of Justice. This report has not been published by the Department. Opinions or points of view expressed are those of the author(s) and do not necessarily reflect the official position or policies of the U.S. Department of Justice.

Table 6.9 Number of Cases Entering the Analysis as a Function of Bandwidth
District A District B District C District D
Bandwidth Medium Maximum Medium Maximum Medium Maximum Medium Maximum 28 29 426 440 548 435 343 397 481 32127 30 877 800 1037 890 702 693 996 61426 31 1315 1149 1574 1286 1142 978 1500 87425 32 1769 1426 2096 1623 1543 1241 1986 110324 33 2238 1688 2590 1942 1979 1469 2466 130223 34 2691 1933 3103 2209 2406 1680 3030 147722 35 3150 2104 3599 2432 2873 1856 3606 162721 36 3586 2269 4112 2610 3329 2019 4188 173620 37 4049 2405 4615 2733 3817 2154 4807 184319 38 4519 2502 5064 2839 4329 2236 5506 1928
Treatment effects are reported as hazards. Here we present findings for drug, property, and violent crime court filings. Findings for other offense categories did not differ appreciably. We can see from the results, across districts and across bandwidths, that the risk for recidivism is not reduced by assignment to maximum level supervision. One might be tempted to interpret the hazard ratios in some sites (greater than one), as an increased risk of recidivism for maximum level probationers, given the ISP literature that documents the negative outcomes of supervision effects (see Chapter 1). This is not the hypothesis we tested, and the variation in treatment effect and p-values render this interpretation unconvincing. Further, some p-values appear to be very low, indicating a significant finding (or one that allows us to reject the null hypothesis). However, we remind readers that the estimates produced by expanding the bandwidth are not independent of each other, and thus we might expect to see a significant finding one out of every ten iterations if we set the threshold for significance at p=.10. Thus we find little compelling evidence that allows us to reject the null hypothesis, and attribute any seemingly observed treatment effects to multiple comparison error.
Abt Associates Inc. 64
This document is a research report submitted to the U.S. Department of Justice. This report has not been published by the Department. Opinions or points of view expressed are those of the author(s) and do not necessarily reflect the official position or policies of the U.S. Department of Justice.

Table 6.10 Effects of assignment to maximum supervision on recidivism
Drugs, property and violence Follow-up period six months District A District B District C District D
Bandwidth Treatment
effect Probability
effect=1 Treatment
effect Probability
effect=1 Treatment
effect Probability
effect=1 Treatment
effect Probability
effect=1 28 29 0.834 0.306 1.686 0.089 0.699 0.203 1.773 0.153 27 30 0.424 0.095 1.992 0.159 0.482 0.162 0.512 0.280 26 31 0.808 0.332 1.930 0.084 0.418 0.060 1.981 0.199 25 32 0.988 0.488 1.432 0.182 0.470 0.059 2.022 0.146 24 33 0.851 0.328 1.226 0.285 0.640 0.146 2.406 0.069 23 34 0.711 0.153 1.216 0.276 0.807 0.288 1.459 0.238 22 35 0.769 0.198 1.200 0.278 0.867 0.342 1.340 0.276 21 36 0.725 0.136 1.496 0.085 0.812 0.265 1.618 0.150 20 37 0.854 0.286 1.551 0.059 0.787 0.225 2.154 0.037 19 38 0.859 0.286 1.399 0.106 0.776 0.202 1.971 0.046 Follow-up
period twelve
months District A District B District C District D
Bandwidth Treatment
effect Probability
effect=1 Treatment
effect Probability
effect=1 Treatment
effect Probability
effect=1 Treatment
effect Probability
effect=1 28 29 0.860 0.311 1.673 0.056 1.123 0.368 1.530 0.151 27 30 0.354 0.036 1.846 0.147 1.045 0.471 0.694 0.316 26 31 0.755 0.254 1.910 0.056 0.720 0.234 1.481 0.243 25 32 1.163 0.335 1.647 0.069 0.765 0.246 2.076 0.058 24 33 1.191 0.288 1.272 0.212 0.871 0.344 2.173 0.029 23 34 1.096 0.373 1.262 0.199 1.114 0.365 1.438 0.161 22 35 1.121 0.331 1.256 0.188 1.261 0.210 1.437 0.144 21 36 1.087 0.367 1.559 0.035 1.085 0.381 1.494 0.106 20 37 1.120 0.314 1.555 0.028 1.065 0.403 1.837 0.023 19 38 1.013 0.477 1.422 0.057 1.052 0.419 1.708 0.031 Follow-up
period eighteen months District A District B District C District D
Bandwidth Treatment
effect Probability
effect=1 Treatment
effect Probability
effect=1 Treatment
effect Probability
effect=1 Treatment
effect Probability
effect=1 28 29 0.943 0.417 1.719 0.042 1.245 0.239 1.189 0.320 27 30 0.530 0.105 2.295 0.069 1.005 0.497 0.635 0.240 26 31 0.923 0.416 2.095 0.027 0.949 0.450 1.038 0.469 25 32 1.244 0.243 1.774 0.034 1.043 0.452 1.445 0.182 24 33 1.189 0.264 1.506 0.072 1.119 0.358 1.747 0.059 23 34 1.138 0.303 1.419 0.084 1.235 0.224 1.320 0.192 22 35 1.112 0.323 1.379 0.087 1.259 0.184 1.189 0.280 21 36 1.046 0.418 1.614 0.016 1.113 0.327 1.179 0.277 20 37 1.028 0.448 1.542 0.020 1.161 0.257 1.364 0.118 19 38 0.980 0.459 1.448 0.035 1.157 0.251 1.207 0.224
Abt Associates Inc. 65
This document is a research report submitted to the U.S. Department of Justice. This report has not been published by the Department. Opinions or points of view expressed are those of the author(s) and do not necessarily reflect the official position or policies of the U.S. Department of Justice.

6.4. Discussion
We have found little evidence that caseload size and resource allocation practices in Colorado’s four largest districts (excluding Denver) have reduced the risk of recidivism for the highest risk probationers on general supervision. We have also presented evidence that may explain these results—in particular, we speculate that the minimal treatment provision is likely related to the lack of treatment effect we observe in Colorado. Finally, we find little evidence that EBP is implemented to the same extent in Colorado as in the other two study sites. However, we note that the state probation agency has made considerable efforts to train or retrain officers and add elements of responsivity to Districts’ operations. It may be that similar analysis in two years will yield different findings. Finally, we are reminded that Colorado was an early adopter of many elements of EBP more than 15 years ago. In the intervening years, the overall caseload in the state has increased nearly eightfold, and some components of EBP were discontinued due to their resource intensity, i.e. cost. Advocates for “What Works” methods in probation supervision should take note that our findings demonstrate the importance of continued investment in what we have described as “correctional” resources- those that address the mutable needs of probationers.
Abt Associates Inc. 66
This document is a research report submitted to the U.S. Department of Justice. This report has not been published by the Department. Opinions or points of view expressed are those of the author(s) and do not necessarily reflect the official position or policies of the U.S. Department of Justice.

7. Conclusions and Policy Implications
In Oklahoma City, this study found that: • Probation officers applied EBP and concentrated control and correctional resources on high-risk
offenders. o Probation officers used risk assessment instruments to assign probationers to active or
administrative supervision, although these assessments were missing for 20% of cases. o Smaller caseloads were about half the size of regular caseloads. o Probation officers with smaller caseloads made more frequent supervision contacts with
probationers. o Probationers supervised by officers with reduced caseloads were more likely to receive
correctional interventions. • Probation outcomes generally improved.
o Probationers supervised by officers with reduced caseloads had a higher rate of revocation for technical violations, but that rate was very low (5%).
o Probationers supervised by officers with reduced caseloads had a lower rate of arrests for new crimes.
In Polk County, this study found that: • Probation officers applied EBP and concentrated control and correctional resources on high-risk
offenders. o Officers consistently used risk assessment instruments to assign high-risk probationers to
smaller caseloads. o Smaller caseloads were about 60 percent as large as regular caseloads. o Probation officers with smaller caseloads made more frequent supervision contacts with
probationers. o Probationers supervised by officers with reduced caseloads were more likely to receive
correctional interventions. • Probation outcomes generally improved.
o Probationers supervised by officers with reduced caseloads had revocation rates for technical violations that were about the same as revocation rates for comparable probationers supervised under regular caseloads.
o Probationers supervised by officers with reduced caseloads had a lower rate of arrests for new crimes.
In Colorado, the study found: • Colorado had not fully implemented EBP during the study period. • There was no improvement in outcomes for offenders supervised by officers with reduced caseloads. The findings are suggestive. In the two probation offices that implemented evidence-based practices, reduced caseloads led to improved probation outcomes. In the probation office that failed to implement evidence-based practices, reduced caseloads did not improve probation outcomes.
Abt Associates Inc. 67
This document is a research report submitted to the U.S. Department of Justice. This report has not been published by the Department. Opinions or points of view expressed are those of the author(s) and do not necessarily reflect the official position or policies of the U.S. Department of Justice.
Implications The sites included in this study were selected after an exhaustive search, and met specific criteria. We cannot assert that these results will generalize to other agencies that do not meet these criteria. On the other hand, we have no reason to believe that the results would differ in other agencies. Given that the Colorado sites were not using the full complement of EBP components we assessed during the study period, our results are based on two probation agencies—and thus are not broadly generalizable. Although the RCT degenerated in one site and was infeasible in others, the DD and RDD approaches are strong quasi-experimental designs and even have some advantages over the RCT. First, the sample sizes are larger, so the DD had more power to detect a treatment effect. Second, the DD estimator generalizes to all probation officers while the RCT design would have generalized to those probation officers who volunteered for the experiment. The RDD approach offers potential uses for probation departments seeking to understand the marginal effects of programming changes on recidivism, and has the potential to be repeated over time at less cost than a RCT. Still, the study team recognizes that these designs cannot altogether overcome validity challenges that are less of a problem in a RCT setting. Our results indicate that EBP has potential salutary effects on probation outcomes. However, our study team’s extensive search for agencies with substantially implemented EBP leads us to caution that the implementation challenges for agencies seeking to establish EBP may ultimately limit the success of such practices. We are tempted to conclude that this study is proof that EBP reduces recidivism. We cannot as we did not test the effectiveness of EBP per se, we tested the effect of reduced caseloads on recidivism within the context of an agency that has implemented EBP. We have found that increased supervision intensity and reduced caseloads in two agencies using EBP led to significant reductions in the risk of recidivism for medium and high risk probationers. The findings support further investigation into how EBP works and rigorous tests of the effectiveness of the components of EBP. Three qualifiers are important for the two sites where we used RDD. The first is that the test for effectiveness of reduced caseloads presumes the application of EBP; reduced caseloads might work differently for agencies that fail to follow EBP guidelines. Second, we must be able to establish that the experience of offenders on a reduced caseload is different than that of offenders on a higher caseload. We will identify that difference between larger and smaller caseloads subsequently. The third is that the treatment effect is roughly (see Lee & Lemieux, 2009) the average treatment effect for offenders who are at the margin between being selected for ISP and high-normal supervision. It is not the average treatment effect from reduced caseloads. We note here that inference based on an RDD differs from inference drawn from a design that estimates average treatment effects for groups, as our design in Oklahoma does. Inference based on random assignment designs requires no strong assumptions beyond the integrity of the random assignment. Inference based on RDD requires some strong assumptions. Granted, in contrast to other quasi-experimental research designs, the assumptions supporting use of RDD are testable. However, while an evaluator can reject a null that the assumptions hold, and therefore reject use of RDD, the alternative is to accept the null and maintain the assumptions. This does not mean that the assumptions are correct – merely that they are consistent with the evidence and not rejected. With adequate data, this weakens the required assumptions, but the need to make some assumptions means that inferences based on the RDD are not on the same plane as inferences based on random assignment.
Abt Associates Inc. 68
This document is a research report submitted to the U.S. Department of Justice. This report has not been published by the Department. Opinions or points of view expressed are those of the author(s) and do not necessarily reflect the official position or policies of the U.S. Department of Justice.

Unless the treatment effect is homogenous, RDD and a randomized experiment estimate different things. A RDD estimates the treatment effect at the margin (or CTV) as that term was defined earlier. A random design experiment estimates the average treatment effect over study subjects within a range equivalent to the bandwidth. While most probation agencies are unlikely to eliminate intensive supervision for the riskiest of probationers, they may be interested in exploring the marginal effects of raising or lowering the risk score thresholds for offender classification purposes. If Polk County wanted to know if the selection rule for ISP assured that offenders at the margin benefited, then the RDD provides an answer—in this case, that answer would be yes. The ability to answer this question is important since programming is rarely turned on or off- it is rather adjusted, expanded, or contracted. Making a decision about marginal program adjustments requires an estimate of marginal program effects. RDD is a tool that provides these estimates. Random assignment on the other hand answers a different question—what is the average effect of the intervention, in this case a smaller caseload, for the entire group of probationers? Although RDD estimates the average treatment effect at the margin, the marginal treatment effect may not be the policy question. Program interventions sometimes set selection rules so that the benefit from treatment is modest at the margin but increases with r. For example, the federally-funded school lunch program may have little benefit for children whose family income is at the threshold for eligibility but it may have great benefit for children whose family income is much lower than the threshold. Similarly, intensive probation may benefit those at the upper end of the risk continuum far more than those at the margin. This study found that reducing probation officer caseloads can reduce criminal recidivism when delivered in a setting where probation officers apply EBP. This finding is consistent with expectations, based on glimmers of evidence found amidst results in other probation studies. But this study also allows us to identify a pathway for explaining these improved probation results. We have seen in Oklahoma that the probationer samples in each officer group, reduced caseload and regular caseload, are identical but for their need for substance abuse treatment. Treatment needs were identified by officers after probationers are assigned to their caseload, so this significant difference in the samples is not likely a result of unobserved bias in the randomization process. Rather, we believe this difference is in itself a finding—officers with reduced caseloads are better able to identify treatment needs among their clientele, and thus better able to direct resources to those who need intervention most. Thus, reduced caseloads result in more efficient distribution of resources, and improved average probation outcomes. While such resource allocation is a cornerstone of EBP, this study did not demonstrate the efficacy of the full complement of evidence based practices. All probation officers had been equivalently trained, so there was no counterfactual by which an evaluator could evaluate EBP. Nevertheless, the implication is that EBP mattered: the literature demonstrates that without EBP (or introduction of similar supervision strategies) reduced caseloads do not reduce recidivism. Thus, rather than using EBP as a context for framing the efficacy of reduced caseloads, we suggest that reduced caseloads be considered as fundamental to EBP as risk/need assessment and responsivity. Reinforcing this assertion is the study team’s findings that criminal recidivism was decreased (although there was no significant increase in revocations) by reduced probation officer caseloads in Polk County, another probation agency that had implemented EBP. Continuing the story, the study team found that criminal recidivism was not decreased by reduced caseloads in Colorado, where probation agencies attempted but were unable to successfully implement and maintain EBP. This evidence notwithstanding,
Abt Associates Inc. 69
This document is a research report submitted to the U.S. Department of Justice. This report has not been published by the Department. Opinions or points of view expressed are those of the author(s) and do not necessarily reflect the official position or policies of the U.S. Department of Justice.

the study did not test the efficacy of EBP. This study provides tantalizing evidence but drawing conclusions about the apparent importance of EBP from a sample of three seems unwarranted.
Abt Associates Inc. 70
This document is a research report submitted to the U.S. Department of Justice. This report has not been published by the Department. Opinions or points of view expressed are those of the author(s) and do not necessarily reflect the official position or policies of the U.S. Department of Justice.

References
Abadie, A. (2005). Semiparametric difference-in-differences estimators - Blackwell Publishers Ltd. doi:10.1111/0034-6527.00321
Andrews, D. A., Zinger, I., Hoge, R. D., Bonta, J., Gendreau, P., & Cullen, F. T. (1990). Does correctional treatment work? A clinically relevant and psychologically informed meta-analysis. Criminology, 28(3), 369.
Berk, R. A., & Leeuw, J. d. (1999). An evaluation of California's inmate classification system using a generalized regression discontinuity design. Journal of the American Statistical Association, 94(448), 1045-1052. Retrieved from http://www.jstor.org/stable/2669918
Berk, R. A., & Rauma, D. (1983). Capitalizing on nonrandom assignment to treatments: A regression-discontinuity evaluation of a crime-control program. Journal of the American Statistical Association, 78(381), 21-27. Retrieved from http://www.jstor.org/stable/2287095
Bertrand, M., Duflo, E., & Mullainathan, S. (2004). How much should we trust differences-in-differences estimates? Quarterly Journal of Economics, 119(1), 249-275.
Bonczar, T. P. & Glaze, L. E. (2009). Probation and parole in the United States, Statistical Tables No. NCJ 231674). Washington, DC: Bureau of Justice Statistics, Office of Justice Programs, U.S. Department of Justice.
Bourgon, G., & Armstrong, B. (2005). Transferring the principles of effective treatment into a "real world" prison setting. Criminal Justice and Behavior, 32(1), 3-25.
Burke, B. L., Dunn, C. W., Atkins, D. C., & Phelps, J. S. (2004). The emerging evidence base for motivational interviewing: A meta-analytic and qualitative inquiry. Journal of Cognitive Psychotherapy, 18(4), 309-322.
Burrell, W. (2005). Trends in probation and parole in the states. The book of the states, 2005 () Council on State Governments.
Byrne, J.M. (1990). The future of intensive probation supervision and the new intermediate sanctions. Crime Delinquency, 36(1), 6.
Byrne, J. M., & Kelly, L. M. (1989). Restructuring probation as an intermediate sanction: An evaluation of the Massachusetts intensive probation supervision program: Final report to the National Institute of Justice. Lowell, Massachusetts: University of Massachusetts, Lowell.
Cameron, A., & Trivedi, P. (2005). Microeconomics: Methods and applications. Cambridge, UK: Cambridge University Press.
Camp, C. G., Camp, G. M., & Criminal Justice Institute (U.S.). (1998). The corrections yearbook 1998. Middletown, Conn.: Criminal Justice Institute.
Clear, T. R., & Hardyman, P. L. (1990). The new intensive supervision movement. Crime & Delinquency, 36(1), 42-60.
DeMichele, M., & Paparozzi, M. (2008). Community corrections: A powerful field. Corrections Today, 70(5), 68-72. Retrieved from http://search.ebscohost.com/login.aspx?direct=true&db=aph&AN=36188297&site=ehost-live
Dowden, C., & Andrews, D. A. (2004). The importance of staff practice in delivering effective correctional treatment: A meta-analytic review of core correctional practice. International Journal of Offender Therapy and Comparative Criminology, 48(2):203-14.
Drake, E. K., Aos, S., & Miller, M. (2009). Evidence-based public policy options to reduce crime and criminal justice costs: Implications in Washington state. Victims and Offenders, 4(2), 170.
Abt Associates Inc. 71
This document is a research report submitted to the U.S. Department of Justice. This report has not been published by the Department. Opinions or points of view expressed are those of the author(s) and do not necessarily reflect the official position or policies of the U.S. Department of Justice.

Farrington, D., & Welsh, B. (2005). Randomized experiments in criminology: What have we learned in the last two decades? Journal of Experimental Criminology, 1(1), 9-38
Gendreau, P., Goggin, C., & Smith, P. (2000). Generating rational correctional policies: An introduction to advances in cumulating knowledge. Corrections Management Quarterly, 4(2), 52-60. Retrieved from http://search.ebscohost.com/login.aspx?direct=true&db=sih&AN=SM182941&site=ehost-live
Hahn, J., Todd, P., & Klaauw, W. V. d. (2001). Identification and estimation of treatment effects with a regression-discontinuity design. Econometrica, 69(1), 201-209. Retrieved from http://www.jstor.org/stable/2692190
Imbens, G. W., & Angrist, J. D. (1994). Identification and estimation of local average treatment effects. Econometrica, 62(2), 467-475. Retrieved from http://www.jstor.org/stable/2951620
Imbens, G. W., & Lemieux, T. (2008). Regression discontinuity designs: A guide to practice. Journal of Econometrics, 142(2), 615-635.
Joplin, L., Bogue, B., Campbell, N., Carey, M., Clawson, E., Faust, D., et al. (2004). Using an integrated model to implement evidence-based practices in corrections. Publication of the International Community Corrections Association and American Correctional Association.
Lee, D., & Lemieux, T. (2009, February). Regression Discontinuity Designs in Economics. Retrieved July 27, 2009, from NBER Working Paper Series: http://www.nber.org/papers/w14723
Lipsey, M. W., & Cullen, F. T. (2007). The effectiveness of correctional rehabilitation: A review of systematic reviews. Annual Review of Law and Social Science, 3(1), 297-320. Retrieved from http://dx.doi.org/10.1146/annurev.lawsocsci.3.081806.112833
Lowenkamp, C.T, Latessa, E.J, and Holsinger, A.M. (2005). Increasing the effectiveness of correctional programming through the risk principle: Identifying offenders for residential placement. Criminology Public Policy, 4(2), 263.
Lowenkamp, C. T., Latessa, E. J., & Holsinger, A. M. (2006). The risk principle in action: What have we learned from 13,676 offenders and 97 correctional programs? Crime & Delinquency, 52(1), 77-93.
Martinson, R. (1974). What works? Questions and answers about prison reform. The Public Interest, 35,22-54.
Miller, W. R., & Moyers, T. B. (2003). Manual for the motivational interviewing skill code (MISC) University of New Mexico.
Noonan, S., & Latessa, E. (1987). Intensive probation: An examination of recidivism and social adjustment. American Journal of Criminal Justice, 12(1), 45-61.
Paparozzi, M. A., & Gendreau, P. (2005). An intensive supervision program that worked: Service delivery, professional orientation, and organizational supportiveness. The Prison Journal, 85(4), 445-466.
Pearson, F. S. & Harper, A. (1990). Contingent intermediate sentences: New Jersey's intensive supervision program. Crime & Delinquency, 36(1), 75-86.
Pearson, F. S., Rutgers University. Institute for Criminological Research., & National Institute of Justice (U.S.). (1987). Final report of research on New Jersey's intensive supervision program. New Brunswick, N.J.: Institute for Criminological Research, Dept. of Sociology, Rutgers-the State University of New Jersey.
Petersilia, J. (1999). A decade of experimenting with intermediate sanctions: What have we learned? Justice Research and Policy, 1(1)
Petersilia, J., Turner, S., Kahan, J., & Peterson, J. (1985). Executive summary of rand's study, "granting felons probation: Public risks and alternatives". Crime & Delinquency, 31(3), 379.
Abt Associates Inc. 72
This document is a research report submitted to the U.S. Department of Justice. This report has not been published by the Department. Opinions or points of view expressed are those of the author(s) and do not necessarily reflect the official position or policies of the U.S. Department of Justice.

Rhodes, W. (1986). A survival model with dependent competing events and right-hand censoring: Probation and parole as an illustration. Journal of Quantitative Criminology, 2(2), 113.
Scott-Hayward, C. (2009). The fiscal crisis in corrections: Rethinking policies and practices. New York, NY: Vera Institute of Justice, Center of Sentencing and Corrections.
Skeem, J. L., & Manchak, S. (2008). Back to the future: From Klockars' model of effective supervision to evidence-based practice in probation. Journal of Offender Rehabilitation, 47(3), 220-247.
Skeem, J. L., Louden, J. E., Polaschek, D., & Camp, J. (2007). Assessing relationship quality in mandated community treatment: Blending care with control. Psychological Assessment, 19(4), 397-410. doi:10.1037/1040-3590.19.4.397
Taxman, F.S. (2002). Supervision: Exploring the dimensions of effectiveness. Federal Probation, 66(2), 14-27.
Taxman, F. S. (2008). No illusions: Offender and organizational change in Maryland's proactive community supervision efforts. Criminology & Public Policy, 7(2), 275-302.
Abt Associates Inc. 73
This document is a research report submitted to the U.S. Department of Justice. This report has not been published by the Department. Opinions or points of view expressed are those of the author(s) and do not necessarily reflect the official position or policies of the U.S. Department of Justice.

Abt Associates Inc. 74
Appendix Table A. Agencies Screened for Study Agencies removed from consideration
Agency EBP Implementation
Data system Available Sample (n)
Other factors
Maricopa County, AZ EBP implemented in 2005
Detailed Large Agency initially interested in RCT; declined due to lack of agency funding
Orange County, CA EBP well established
Detailed Adequate High staff turnover, agency ultimately declined to participate
King County, WA EBP well established
Detailed Adequate Caseload sizes already small; agency declined
Dupage County, IL EBP well established
Insufficient Small
Travis County, TX Agency declined due to competing priorities
San Diego, CA EBP established Large Agency declined due to lack of resources
Connecticut (Multiple cities)
Agency declined participation
Collin County, TX Agency declined participation
Boston, MA No EBP implemented
Large
Chicago, IL Insufficient Large New York, NY No EBP
implemented Large
Multnomah County, OR EBP implemented Detailed Large/Adequate Agency declined participation
Maine (multiple cities) EBP implemented Detailed Agency declined participation
Suffolk County, NY Baltimore, MD Large Agency declined
participation North Carolina (Multiple cities)
No EBP implemented
Detailed Large/Adequate Agency declined participation
Washington County, MN EBP implemented Detailed Insufficient Concerns about randomization by stakeholders
Nebraska (Multiple cities) EBP partially implemented
Detailed Adequate/insufficient
Potential sample size problems, EBP not fully implemented
Washington State/Pierce County, WA
EBP fully implemented
Detailed Large/Adequate Declined participation, agency leadership change
Cedar Rapids, Iowa Insufficient Columbus, Ohio EBP partially
implemented Insufficient Large/Adequate
Westchester County, NY EBP implemented Detailed Insufficient Most caseloads specialized
This document is a research report submitted to the U.S. Department of Justice. This report has not been published by the Department. Opinions or points of view expressed are those of the author(s) and do not necessarily reflect the official position or policies of the U.S. Department of Justice.

Addendum omments from Colorado Probation
Services C
Reviewers from the Colorado Division of Probation Services objected to conclusions reached by the Abt Associates study. The reviewers raised a general concern that they had inadequate opportunity to participate in data analysis and interpretation. They had three additional specific complains.
First, the report questioned whether Colorado had fully implemented evidence‐based practices. Reviewers from the Division of Probation Services objected that the evidence for reaching that conclusion was incomplete and contradicted an independent assessment done by one of the report’s authors. Second, the reviewers felt that data reporting probation officer controlling and correctional activities understated probation officer activities. Third, the reviewers were concerned with the validity of the recidivism data.
The reviewers’ comments are reported later in this appendix. Prior to reporting the reviewer’s comments, the Abt Associates authors provide an overarching response.
The Abt Associates Response
We would have benefited from additional contact with sources at the Colorado Division of Probation Services. As was true of other probation agency data providers, the Colorado Division of Probation had difficulty providing data for this evaluation. This is understandable: Probation agencies do not collect data for the convenience of researchers. Nevertheless, the reality is that data assembly, checking, analysis and reporting is laborious. It requires multiple requests, drawing interpretations with little or no documentation, and (as the reviewers note) dealing with missing data problems. Although we had frequent contacts with data providers, we appreciate that allowing the Division of Probation Services with only a few months to review the report was insufficient.
As researchers, the Abt Associates team sees the world of data assembly and analysis differently than does the Colorado Division of Probation Services. For example, based on other sources, the reviewers asserted that probation officers make more contacts than are included in the electronic case files. The Abt researchers have no reason to dispute that assertion, but the important question is how undercounting affects the analysis and its interpretation. An observation made in our report was that officers with reduced caseloads made more frequent contacts than did officers with regular caseloads. We used that observation to draw the qualitative inference that officers with reduced caseloads actually altered their work routines, so that the routines of officers with reduced caseloads in fact differed from that of officers with regular caseloads.
This document is a research report submitted to the U.S. Department of Justice. This report has not been published by the Department. Opinions or points of view expressed are those of the author(s) and do not necessarily reflect the official position or policies of the U.S. Department of Justice.

The observation that reduced caseload officers performed their jobs differently does not depend on absolute data accuracy. Suppose that probation officers only report one‐half of their contacts. Provided that reduced caseload officers and regular officers have the same reporting rates, underreporting does not affect the inferences reached in this report. This same argument extends to other variables that were tabulated just to show that reduced caseload probation officers performed their jobs differently than did regular caseload probation officers.
The Colorado Division of Probation Services reviewers felt that we misjudged the extent to which the Division had implemented evidence‐based practices. That may be true, because anyone familiar with EBP understands that the requirements of EBP are vague and the degree to which EBP has been implemented in difficult to establish. Nevertheless, our evidence was based on the opinions of informed sources, and we are inclined to believe that the best assessment is that the Colorado Division of Probation Services had not fully implemented EBP at the time of our evaluation. The Division may have improved its implementation in recent years; with regard to that possibility, our report is silent.
Our opinion notwithstanding, suppose that the Colorado Division of Probation Services had fully implemented EBP and that the Abt Associates researchers were wrong. What consequence would that finding have for the conclusions drawn in this report? The reviewers did not argue with the conclusions from the outcome analysis: Reduced caseloads failed to reduce criminal recidivism. The Abt report speculated that the failure to reduce criminal recidivism could be attributed to failure to fully implement EBP. If the Division is correct that Colorado had fully implemented EBP, then the basis for this speculation evaporates, but we are still left with the conclusion that reduced caseloads did not reduce criminal recidivism in Colorado. Thus, the conclusion from the report holds; it is the explanation that evaporates.
The reviewers felt that the recidivism data provided by the state may have had errors. This brings the discussion back to the earlier point, however. Unless data errors were systematically biased against probation officers with reduced caseloads, data errors will not affect the conclusions from the evaluation: Reduced caseloads did not improve probation outcomes in Colorado.
The Division Comments
[From an email June 9, 2011]
The Colorado Division of Probation Services (DPS) objects to the conclusions drawn as a result of this study for several reasons summarized below. More detail is provided in an addendum to this report. (Note: the addendum is the longer response, which appears below.)
Conclusions about the implementation of EBP and outcomes for reduced caseloads are invalid because of severe limitations to the study methodology, including:
This document is a research report submitted to the U.S. Department of Justice. This report has not been published by the Department. Opinions or points of view expressed are those of the author(s) and do not necessarily reflect the official position or policies of the U.S. Department of Justice.

1. The review of only three of eight principles of effective intervention promulgated by the National Institute of Corrections
2. Missing data, particularly related to treatment referrals 3. Use of data believed to be inaccurate to draw conclusions (e.g. contact rates). Data errors are
suspected because: a. Report data is drastically inconsistent with other existing data; b. After DPS’s review of a prior draft of the report, researchers removed data they
discovered to be in error which suggests the possibility of additional errors; and c. Data that could not be adequately explained (e.g. Table 6.7);
4. Conclusions based on comparisons between larger and smaller caseloads when smaller caseload data from Colorado was not included in the analysis and
5. The absence of consideration of other variables that might impact outcomes (e.g. availability of treatment, staffing levels, policy changes).
[From an email on June 8, 2011]
I have shared your report and our phone discussion with Tom Quinn, the current Director at DPS, and noted our collective responses and/or suggested edits below. Additional concerns were raised with Tom’s review. We elaborate below but the main issues are:
• There was little to no contact during the data analysis phase of this project and we got the report in May with too little time to review and correct;
• In our brief review you acknowledged and corrected some items, such as reducing the alleged number of probation officers from over 4000 to under 900, and deleting a chart that you agree was incorrect. We believe equally egregious errors remain and should be corrected.
• You conclude that Colorado does not apply EBP but o one of the authors of your report has published recently to the contrary; o you only apply 3 of the 8 NIC principles of effective supervision; o you ignore other existing documents detailing the processes and positive outcomes
related to EBP in Colorado; o you reach your conclusions based on limited codes in the data system without
considering information in the narratives.
We would like the conclusion that Colorado does not apply EBP removed.
More general detail follows as well as specific responses to your email:
1. The Limitations section of the report should be expanded to note the following: a. Only three of NIC’s eight principles of effective intervention were included in the study
and implementation of the other five principles were not evaluated. NIC has a checklist which could have been used to more fully assess EBP implementation.
b. The data used to determine treatment involvement is severely limited by the electronic management system and caution should be used when interpreting the results regarding the number of treatment episodes. Although Abt and Associates were provided a query that included all offenders during the 10 year timeframe who were associated with treatment, the query did not include an additional portion of probationers who were also enrolled in some type of treatment. Many probation
This document is a research report submitted to the U.S. Department of Justice. This report has not been published by the Department. Opinions or points of view expressed are those of the author(s) and do not necessarily reflect the official position or policies of the U.S. Department of Justice.

officers who do not use the substance abuse treatment tracking (SUBS code)module in the information system. Instead, they record treatment involvement in their chronological case notes. These notes are difficult to query and were not provided to Abt.
c. Documents from Colorado probation which directly address actual trends on recidivism, staffing levels, probation population, offender technical violations, and success rates were not reviewed. Those data were instead derived by ABT from statistical calculations from data queries.
d. Other variables which might affect outcomes, such as availability of treatment (which increased then decreased then increased in Colorado over the study period); training (which was enhanced over the study period); staffing levels (which increased, then decreased, then increased over the study period); and policy changes including new tools for the field to use in case management were not considered or accurately represented.
2. We are still very confused by how you drew conclusions that compared outcomes of larger and
smaller caseloads if you did not include ISP clients in the analysis. If not an ISP caseload, what smaller caseloads were used for the comparisons?
3. We object to the conclusions as stated on pg. 10 because of the data errors that have been identified and we believe still exist, the noted limitations to the study, and evidence to the contrary through a variety of other reports and data we have. Specifically, how can you claim that EBP has not been implemented substantially when you only looked at 3 of 8 principles and did not examine any existing evidence to the contrary? What reduced caseloads existed for you to conclude that there were no improvements in outcomes for offenders supervised on reduced caseloads?
4. We appreciate your review of the data and the removal of data you found to be inaccurate (Figure 6.1) and the corrections you made to Table 6.5 although we still have concerns about the accuracy of the revised data in Table 6.5. See below. The need to make these corrections and the fact that your conclusions are radically different than other data we have, lead us to believe there are more data errors that require correction and publishing this report in its current or recently revised format is, at best, inaccurate.
Abt Associates Changes in Response to Comments
Below we report changes made in the final draft in response to comments made by the reviewers. The following was taken from an email on June 3 from the Division in response to Abt Associates changes the draft. Reviewer comments are in bold.
I have investigated the various issues we discussed on Wednesday [June 1, 2011], and thought I would let you know the results.
This document is a research report submitted to the U.S. Department of Justice. This report has not been published by the Department. Opinions or points of view expressed are those of the author(s) and do not necessarily reflect the official position or policies of the U.S. Department of Justice.

1. I wrote some language for the report on other EBP practices that were not a part of our study:
Numerous practices and strategies are identified in the What Works literature as components of EBP. We investigated the components our expert panel and research team identified as core components, but we recognize that Colorado does use other strategies that are consistent with EBP but were not included in this study. Specifically, the Eight Principles of Effective Intervention promulgated by the National Institution of Corrections and others, are utilized as the framework for EBP implementation. (Note: our EBP Progress Report summarizes efforts related to each principle.) Another consideration is the rather stark contrast between your report and one submitted to us in March by JSAT, one of the other authors on this study. It reads: “Secondly, DPS holds a long‐standing interest in more deeply developing the potential officers have for supporting evidence‐based practices and principles. This support typically takes place at two levels: structural, system‐wide policies and resource allocations, and, at the individual officer level. Innovations and strategies with the potential for enhancing performance at both of these levels understandably hold a premium for DPS. In terms of its evolutionary history, Colorado probation moved from general need and offense‐based supervision to a strategy and risk based system in the early 1980’s. In the early 1990’s probation transitioned into a risk and (criminogenic) need based supervision model. Now probation is considering the possibility of evolving into a risk‐need‐responsivity strategy model based on offender profiles or typologies.”
By the way, we have not had a chance to review JSAT’s portion of the report.
2. I clarified the language regarding the officer tape critiques vs. the RD study officers. Thank you.
3. I changed all references from re‐arrest to court filings Thank you.
4. I clarified that the revocation figures are technical revocations, not all revocations. Okay – so that means recidivists are not included in the technical violator category but we are still not clear if the technical violations include absconders.
5. I removed Figure 6.1. I made an error in computing that resulted in accumulations of cases over time rather than only counting new cases. I apologize. That should also solve the problem related to staffing level changes. Does it eliminate reference to the contact rates that are extremely low and showing a steady decline? We still believe the contact information presented represents an error in the data or calculation. As you noted in our phone conversation, “POs are notoriously bad at entering codes” and doing analysis on this kind of data is not what you like to do. We agree.
6. I double checked the supervision contact numbers (Table 6.3 below). They are correct in the tables, but I changed our reporting of them from a monthly rate to an annual rate for clarity. As
This document is a research report submitted to the U.S. Department of Justice. This report has not been published by the Department. Opinions or points of view expressed are those of the author(s) and do not necessarily reflect the official position or policies of the U.S. Department of Justice.

noted above, we believe there is a significant error in this data. You are reporting that officers are seeing maximum risk clients only 7 to 9 times per year. I would not be surprised to see contact rates that are lower than suggested guidelines but these rates of significantly lower than anyone would expect. Additionally, in 2008, the National Center for State Courts conducted a workload value study indicating that officers were spending 3.58 hours per month (or 42.96 hours per year) on casework for maximum level cases. That includes non‐contact work such as collateral checks so it is not directly comparable to your analysis. However, if you believe they are only seeing clients approximately 8 times a year plus 4 phone calls a year, that would suggest that those contacts and calls, on average, are about 3 hours each (43 hours/12 contacts‐calls). We don’t believe that is correct. However, we would be willing to review data to determine if we can find where the error is.
7. I asked our statistician to review Table 6.5. He agreed that the number of officers looks artificially inflated, due to the way he computed the regression. We have changed this table (below). It seems odd that the number of POs for 0‐0.1 is exactly the same as for 0.67‐0.75 and the same for 0.1‐0.25 and 0.75‐1.0. In any case, we struggle with the relevance of this data as it seems to be used to determine “changes we might expect to see in an officer’s caseload (not sure what specifically the changes are) if his or her overall proportion of maximum cases changes from, for example 25% to 33%.” (pg. 59) when that does not address overall caseload size and it was the effect of caseload size combined with EBP implementation that you were testing. Further, with a different base level of staffing from one year to the next, how would that modify the expected result?
8. I clarified in Table 6.7 that the filings may reflect multiple charge types per probationer. That’s helpful. That data is still confusing though. For example, in Dist 1, Med, the total for “rearrest for any offense” is 69%. If filings reflect multiple charge types, wouldn’t the offense categories have to equal at least 69%? It only equals 62%. Regardless, those rates are exceedingly high and are not consistent with any of our recidivism data. (see attached report).
9. I have changed all references to Districts to A,B,C, and D for consistency and anonymity for the districts. Thank you.
10. We noted in the conclusion that we recognize the state has, in the intervening years, made substantial effort to implement EBP. I added this statement to the Executive Summary as well. Thank you.
I hope this addresses your concerns about the report. As noted above, we believe some of the data in the report is inaccurate and would like the time it will take to review the data files to determine if we can find the problem. It is hard to say if our concerns are addressed without seeing the revised report. I understand the results were not what you hoped for, and we understand they have implications for your agency. We are strong proponents of objective data analysis. However, we feel the limitations of the study, the description of EBP, and EBP implementation complexities are under‐represented in this report and are relevant to the results. As noted, we have serious concerns about
This document is a research report submitted to the U.S. Department of Justice. This report has not been published by the Department. Opinions or points of view expressed are those of the author(s) and do not necessarily reflect the official position or policies of the U.S. Department of Justice.

the accuracy of the data and/or the calculations used with the data and therefore find the conclusions erroneous. Equally concerning is the process of the study in which there was little to no interaction during the data analysis period. My records indicate that we did not have any discussion about the data or analysis from mid 2008 until November 2010. At that time, Mike sent me PowerPoint slides with findings and indicated the report was to follow shortly. I thought the report would provide the necessary explanation to respond to the results but we did not receive the report until May of 2011. We were not afforded the opportunity to engage with you, with adequate time for serious review and identification of potential errors, until after you had provided data to the NIJ advisory group and Community Corrections Research Network. We did not have an opportunity to review or correct inaccurate data until you were ready to finalize the report. It now appears that you are ready to complete the report without providing us enough time to review the data we believe is still inaccurate. If your timeframe is so tight to not allow for an adequate review of the remaining data, perhaps you would like to pull Colorado from the study and exclude us from your report. Lastly, a report with limited context and potential inaccuracies will do nothing to encourage those probation staff and leaders who work hard on a daily basis to influence positive behavioral change or to educate stakeholders (such as the Colorado Legislature) and garner their support to further our EBP implementation efforts. We appreciate your cooperation on this study—we know you did not have to participate, and we realize you may wish you hadn’t, given the results. I and the rest of the team hope you can make some use of the results, and we are happy we were able to use your input to make the report more accurate and reflective of the reality in Colorado Probation. I have investigated the various issues we discussed on Wednesday, and thought I would let you know the results.
1. I wrote some language for the report on other EBP practices that were not a part of our study:
Numerous practices and strategies are identified in the What Works literature as components of EBP. We investigated the components our expert panel and research team identified as core components, but we recognize that Colorado does use other strategies that are consistent with EBP but were not included in this study. Specifically, the Eight Principles of Effective Intervention promulgated by the National Institution of Corrections and others, are utilized as the framework for EBP implementation. (Note: our EBP Progress Report summarizes efforts related to each principle.) Another consideration is the rather stark contrast between your report and one submitted to us in March by JSAT, one of the other authors on this study. It reads: “Secondly, DPS holds a long‐standing interest in more deeply developing the potential officers have for supporting evidence‐based practices and principles. This support typically takes place at two levels: structural, system‐wide policies and resource allocations, and, at the individual officer level. Innovations and strategies with the potential for enhancing performance at both of these levels understandably hold a premium for DPS. In terms of its evolutionary history, Colorado probation moved from general need and offense‐based supervision to a strategy and risk based system in the early 1980’s. In the early 1990’s probation transitioned into a risk and (criminogenic) need based supervision model. Now probation is considering
This document is a research report submitted to the U.S. Department of Justice. This report has not been published by the Department. Opinions or points of view expressed are those of the author(s) and do not necessarily reflect the official position or policies of the U.S. Department of Justice.

the possibility of evolving into a risk‐need‐responsivity strategy model based on offender profiles or typologies.”
By the way, we have not had a chance to review JSAT’s portion of the report.
2. I clarified the language regarding the officer tape critiques vs. the RD study officers. Thank you.
3. I changed all references from re‐arrest to court filings Thank you.
4. I clarified that the revocation figures are technical revocations, not all revocations. Okay – so that means recidivists are not included in the technical violator category but we are still not clear if the technical violations include absconders.
5. I removed Figure 6.1. I made an error in computing that resulted in accumulations of cases over time rather than only counting new cases. I apologize. That should also solve the problem related to staffing level changes. Does it eliminate reference to the contact rates that are extremely low and showing a steady decline? We still believe the contact information presented represents an error in the data or calculation. As you noted in our phone conversation, “POs are notoriously bad at entering codes” and doing analysis on this kind of data is not what you like to do. We agree.
6. I double checked the supervision contact numbers (Table 6.3 below). They are correct in the tables, but I changed our reporting of them from a monthly rate to an annual rate for clarity. As noted above, we believe there is a significant error in this data. You are reporting that officers are seeing maximum risk clients only 7 to 9 times per year. I would not be surprised to see contact rates that are lower than suggested guidelines but these rates of significantly lower than anyone would expect. Additionally, in 2008, the National Center for State Courts conducted a workload value study indicating that officers were spending 3.58 hours per month (or 42.96 hours per year) on casework for maximum level cases. That includes non‐contact work such as collateral checks so it is not directly comparable to your analysis. However, if you believe they are only seeing clients approximately 8 times a year plus 4 phone calls a year, that would suggest that those contacts and calls, on average, are about 3 hours each (43 hours/12 contacts‐calls). We don’t believe that is correct. However, we would be willing to review data to determine if we can find where the error is.
7. I asked our statistician to review Table 6.5. He agreed that the number of officers looks artificially inflated, due to the way he computed the regression. We have changed this table (below). It seems odd that the number of POs for 0‐0.1 is exactly the same as for 0.67‐0.75 and the same for 0.1‐0.25 and 0.75‐1.0. In any case, we struggle with the relevance of this data as it seems to be used to determine “changes we might expect to see in an officer’s caseload (not sure what specifically the changes are) if his or her overall proportion of maximum cases changes from, for example 25% to 33%.” (pg. 59) when that does not address overall caseload size and it was the effect of caseload size combined with EBP implementation that you were
This document is a research report submitted to the U.S. Department of Justice. This report has not been published by the Department. Opinions or points of view expressed are those of the author(s) and do not necessarily reflect the official position or policies of the U.S. Department of Justice.

testing. Further, with a different base level of staffing from one year to the next, how would that modify the expected result?
8. I clarified in Table 6.7 that the filings may reflect multiple charge types per probationer. That’s helpful. That data is still confusing though. For example, in Dist 1, Med, the total for “rearrest for any offense” is 69%. If filings reflect multiple charge types, wouldn’t the offense categories have to equal at least 69%? It only equals 62%. Regardless, those rates are exceedingly high and are not consistent with any of our recidivism data. (see attached report).
9. I have changed all references to Districts to A,B,C, and D for consistency and anonymity for the districts. Thank you.
10. We noted in the conclusion that we recognize the state has, in the intervening years, made substantial effort to implement EBP. I added this statement to the Executive Summary as well. Thank you.
I hope this addresses your concerns about the report. As noted above, we believe some of the data in the report is inaccurate and would like the time it will take to review the data files to determine if we can find the problem. It is hard to say if our concerns are addressed without seeing the revised report. I understand the results were not what you hoped for, and we understand they have implications for your agency. We are strong proponents of objective data analysis. However, we feel the limitations of the study, the description of EBP, and EBP implementation complexities are under‐represented in this report and are relevant to the results. As noted, we have serious concerns about the accuracy of the data and/or the calculations used with the data and therefore find the conclusions erroneous. Equally concerning is the process of the study in which there was little to no interaction during the data analysis period. My records indicate that we did not have any discussion about the data or analysis from mid 2008 until November 2010. At that time, Mike sent me PowerPoint slides with findings and indicated the report was to follow shortly. I thought the report would provide the necessary explanation to respond to the results but we did not receive the report until May of 2011. We were not afforded the opportunity to engage with you, with adequate time for serious review and identification of potential errors, until after you had provided data to the NIJ advisory group and Community Corrections Research Network. We did not have an opportunity to review or correct inaccurate data until you were ready to finalize the report. It now appears that you are ready to complete the report without providing us enough time to review the data we believe is still inaccurate. If your timeframe is so tight to not allow for an adequate review of the remaining data, perhaps you would like to pull Colorado from the study and exclude us from your report. Lastly, a report with limited context and potential inaccuracies will do nothing to encourage those probation staff and leaders who work hard on a daily basis to influence positive behavioral change or to educate stakeholders (such as the Colorado Legislature) and garner their support to further our EBP implementation efforts. We appreciate your cooperation on this study—we know you did not have to participate, and we realize you may wish you hadn’t, given the results. I and
This document is a research report submitted to the U.S. Department of Justice. This report has not been published by the Department. Opinions or points of view expressed are those of the author(s) and do not necessarily reflect the official position or policies of the U.S. Department of Justice.

the rest of the team hope you can make some use of the results, and we are happy we were able to use your input to make the report more accurate and reflective of the reality in Colorado Probation.
This document is a research report submitted to the U.S. Department of Justice. This report has not been published by the Department. Opinions or points of view expressed are those of the author(s) and do not necessarily reflect the official position or policies of the U.S. Department of Justice.