a multi-year survey of stem-end chip defect in chipping
TRANSCRIPT

A Multi-Year Survey of Stem-End Chip Defect in ChippingPotatoes (Solanum Tuberosum L.)
Yi Wang & Paul C. Bethke & Michael J. Drilias &
William G. Schmitt & Alvin J. Bussan
Published online: 11 October 2014# The Potato Association of America 2014
Abstract One of the most serious tuber quality concerns ofUS chip potato growers is stem-end chip defect, which isdefined as a localized post-fry discoloration in and adjacentto the vasculature on the stem end portion of potato chips. Theseverity and incidence of stem-end chip defect vary withgrowing location and variety, but quantitative data describingthis are not available. A multi-year and location study wasconducted to evaluate chipping potato varieties for toleranceto stem-end chip defect formation and to quantify defectseverity and incidence regionally and temporally. It was ob-served that higher night temperature in July and August com-pared to the regional 30-year history was consistently associ-ated with higher SECD severity. Average SECD severity waslinearly correlated with incidence of chips having severeSECD. Chip color and tuber stem-end glucose content weresignificantly correlated with average SECD score across alltreatments. Multiple tuber samplings from early growing sea-son to mid post-harvest storage demonstrated that some vari-eties, such as Nicolet and Pike, had fewer stem-end chipdefects than other varieties across years and locations. Stem-end chip defect was rarely observed prior to harvest, but wasapparent at the time of harvest on multiple varieties dependingon the year and location. Tuber stem-end sucrose and glucoseprior to harvest were not indicators of defect development at
harvest and out of storage, but pre-harvest chip color wassignificantly correlated with defect severity 10 weeks afterpreconditioning was finished.
Resumen Una de las más serias preocupaciones en calidad detubérculo de los productores de papa para fritura es el defectode la hojuela en la zona de unión con el estolón (SECD, por sussiglas en inglés) que se define como una decoloración post-fritura de las papas fritas, localizada en y adyacente al sistemavascular en la porción del extremo del tubérculo en donde seune con el estolón. La severidad e incidencia del defecto de lafritura del extremo del tubérculo varía con la localidad yvariedad del cultivo, pero no están disponibles datoscuantitativos que lo describan. Se condujo un estudiomultianual y de localidades para evaluar las variedades de papade fritura respecto a la tolerancia a la formación del defecto dela hojuela en el extremo basal y para cuantificar la severidaddel defecto y su incidencia regional y temporalmente. Seobservó que la temperatura más alta nocturna en julio y agostocomparada con la historia regional de 30 años, estuvoconsistentemente asociada con una severidad más alta deSECD. El promedio de severidad del SECD estuvocorrelacionado linealmente con la incidencia de hojuelas condefecto severo. Muestreos múltiples de tubérculos desde ciclosde cultivo tempranos hasta el almacenamiento medio post-cosecha, demostraron que algunas variedades, tales como Ni-colet y Pike, tenían menos defectos que otras a lo largo de losaños y las localidades. El defecto se observó rara vez antes dela cosecha, pero fue evidente al momento de la cosecha enmúltiples variedades, dependiendo del año y la localidad. Lasacarosa y la glucosa del extremo basal del tubérculo antesde la cosecha no fueron indicadores del desarrollo deldefecto al cosechar y fuera del almacén, pero el colorde la hojuela en pre-cosecha estuvo correlacionadosignificativamente con severidad del defecto 10 semanasdespués de que se terminó el preacondicionamiento.
Electronic supplementary material The online version of this article(doi:10.1007/s12230-014-9414-8) contains supplementary material,which is available to authorized users.
Y. Wang (*) :M. J. Drilias :W. G. Schmitt :A. J. BussanDepartment of Horticulture, University of Wisconsin-Madison, 1575Linden Drive, Madison, WI 53706, USAe-mail: [email protected]
P. C. BethkeUSDA-ARS, Vegetable Crops Research Unit and Department ofHorticulture, University of Wisconsin-Madison, 1575 Linden Drive,Madison, WI 53706, USA
Am. J. Potato Res. (2015) 92:79–90DOI 10.1007/s12230-014-9414-8

Keywords White potato . Stem-end chip defect . Chippingpotato varieties . Potato chip quality . Average chip defectscore . Severe chip defect incidence . Tuber sucrose andglucose concentration
AbbreviationsSECD Stem-end chip defectMg megagramFW fresh weight
Introduction
Potato (Solanum tuberosum L.) is one of the world’s majoragricultural crops and is consumed daily by millions of peoplefrom diverse cultural backgrounds (Pedreschi et al. 2006a).Retail sales of potato chips in the US are approximately $6billion per year, which represents 33 % of total snack foodsales in this market (Clark 2003; Garayo and Moreira 2002).Michigan (MI) and Wisconsin (WI) ranked the first and thirdin the nation in potato production for chip processing in 2012,with harvested yields of 0.6 and 0.25 million Mg respectively(Anonymous 2013). Chipping potatoes grown in those twostates are processed into chips at plants throughout the upperMidwest either directly from the field or after post-harveststorage. Texas (TX) produces 0.2 million Mg of chippingpotatoes (Anonymous 2012), most of which are shipped toprocessing plants in the South. The production of high qualitypotato chips requires stringent quality control measures. Se-lection of appropriate varieties is one method used to meetestablished specifications (Gould 1980).
To ensure a steady supply of raw product throughout theyear, up to 80 % of the potato crop is stored in climate-controlled warehouses (Bussan et al. 2009). Harvesting tubersat peak maturity favors good storability, and one of the mostimportant indicators of optimal tuber maturation is tuber su-crose concentration (Bussan et al. 2009; Sowokinos and Pres-ton 1988). For chipping potatoes intended for long-term stor-age, sucrose concentration at harvest is typically less than1.0 mg g−1 fresh weight (Bussan et al. 2009). Excessivesucrose at harvest can be removed when tubers are held at12 to 16 °C until the sucrose level drops below 1.0 mg g−1 FW,a process called preconditioning. Preconditioning potatoesafter harvest aids wound healing and skin maturation whilereducing sugars are respired or otherwise utilized (Sowokinosand Preston 1988).
Color of potato chips is an extremely important criterionfor the potato processing industry and it is strictly related toconsumer perception (Scanlon et al. 1994). The color of thefood surface is the first quality parameter evaluated by con-sumers and is critical in the acceptance of the product, evenbefore it enters the mouth. Color development that occurs
during cooking of potato chips is the result of the Maillardreaction and the extent of dark color development depends onthe concentration of reducing sugars and amino acids near thechip surface, and the temperature and time of frying (Habiband Brown 1957; Marquez and Anon 1986). An undesirableMaillard reaction product found in fried potatoes is acrylam-ide (Bethke and Bussan 2013; Mottram et al. 2002; Pedreschiet al. 2005, 2006b; Stadler et al. 2002). Acrylamide is apotential human carcinogen and substance that may interferewith prenatal development (Lineback 2012; Mottram et al.2002; Pedersen et al. 2012; Zhang and Zhang 2007).
Stem-end chip defect (SECD) is a serious quality concernfor chipping potatoes that is characterized by dark-coloredvasculature and adjacent tissues at the stem (basal) end ofthe fried chip. Previous research indicated that the discolor-ation on the stem end of chips was related to high acidinvertase activity on the tuber stem end, which resulted in anaccumulation of reducing sugars (Wang et al. 2012; Wang andBethke 2013). The elevated reducing sugars are the immediatecause of dark color formation via the Maillard reaction duringfrying (Wang et al. 2012). SECD is hypothesized to be causedby heat stress (Wang et al. 2012), but infection of potato plantswith the vascular pathogen Verticillium dahliae contributes toSECD as well (Wang and Bethke 2013).
Stem-end chip defect is similar to sugar end defect of fryprocessing potatoes, which is characterized by a dark or“burnt” appearance on the stem end of fried products (Thomp-son et al. 2008). Both defects result from elevated invertaseactivity and reducing sugars at the tuber stem end (Iritani andWeller 1973; Kleinkopf 1976; Sowokinos et al. 1985; Thomp-son et al. 2008). However, the defining characteristic ofSECD, a close association between vascular tissues and darkcolor after frying, is often not observed in fried products withsugar end defects. Sugar end defect has been linked to warmsoil conditions during tuber initiation and early tuber bulkingand defect severity can be exacerbated by intermittent droughtstress (Hiller and Thornton 1993; Iritani 1981, 1987). Potatovarieties differ in susceptibility to stress conditions that triggersugar end defect formation in processing potatoes (Sabba et al.2007).
Chip potato growers and processors have observed thatstem-end chip defect occurs erratically and with varying se-verity across years, locations, and varieties. A 3-year surveywas conducted on farms in Michigan, Texas, and Wisconsinfrom 2009 to 2011 with the major goals of 1) investigatingprogression of SECD incidence and severity through thegrowing season and in post-harvest storage; 2) identifyingchipping potato varieties tolerant to growing conditions thatcan cause development of SECD; 3) determining the effec-tiveness of preconditioning to decrease the incidence or se-verity of SECD during storage; 4) evaluating tuber stem-endglucose and sucrose concentrations in different varietiesgrown across multiple locations and years; and 5) assessing
80 Am. J. Potato Res. (2015) 92:79–90

the correlation between tuber stem-end sucrose or glucoseconcentrations prior to harvest and defect incidence and se-verity subsequent to harvest.
Materials and Methods
Experimental Design and Sample Collection
Multiple chipping varieties were grown in small plot trials incooperation with Walther Farms (Three Rivers, MI), CSSFarms (Dalhart, TX), and Heartland Farms (Hancock, WI) in2009, 2010 and 2011. Weather data (from June 1st to August31st) for these three locations during the 3 years of the study,and the 30-year (1982–2011) average night temperatures forJuly and August at each site in each study year were obtainedfrom the National Climatic Data Center.
Varieties Nicolet and Snowden were planted every year ateach location.Multiple other varieties of interest to chip potatogrowers were included in the trial in each year. Besides thetwo common varieties, FLV1, FLV2, FLV3, FLV4, andMegachip were grown in 2009; CO95051, FLV1, FLV2,FLV3, FLV4, Megachip, and Pike were grown in 2010;CO95051, FL1, FL2, FL3, Lamoka, Megachip, and Pike weregrown in 2011. Those varieties were advanced breeding linesor recent releases that had performed well in variety trialsincluding the United States Potato Board and Snack FoodAssociation trials and the National Chip Processor Trial. Ad-ditional proprietary varieties (FLV1, FLV2, FLV3 and FLV4)and recently developed lines of interest (FL1, FL2, and FL3)were obtained from Frito-Lay Inc.
Tuber samples were collected at four to five time points ineach growing and storage season, from early to mid-Augustthrough January of the following year. There were two to threetime points prior to harvest in each year: 4 weeks before vinedesiccation, 2 weeks before vine desiccation, and at vinedesiccation. Samples were also collected at harvest, and fourand/or 10 weeks after the end of the preconditioning period.Tuber samples collected prior to harvest consisted of threetubers from each of six plants at each location. After finalharvest, 14 to 18 kg of potatoes from each variety andstudy site were placed in a climate-controlled storagefacility having 95 % or more relative humidity, CO2
concentration <2,000 ppm and tightly managed tempera-ture. Potatoes were preconditioned at 13 °C until tubersof check variety Snowden had reached target stem-endsucrose concentration of 0.70 mg g−1 FW (for TX 2011,Snowden was not preconditioned well due to low tem-perature before preconditioning at the start of storage).After preconditioning, storage temperatures were de-creased 0.05 °C every 8 h until the set temperature of9 °C was reached.
Potato Chip Frying and Scoring
Eighteen 170–280 g (6–10 oz) tubers randomly selected fromeach variety were cut in halves, one half was discarded, a slicethat was 1 mm in thickness was cut off the other half anddiscarded. A second slice was cut, rinsed in cold water, patteddry on terry towels, and the rest was saved for sugar process-ing. Chips were fried in sunflower oil at 182 °C for 2 min and10 s. Chips were inspected for defects and scored on the 0 to 5SECD rating scale described inWang et al. (2012). Chips withscores of 3, 4 and 5 were categorized as severe defects as theycan result in rejection at chip processing facilities. Chips withscores of 0, 1 and 2 are likely to meet processor requirementsfor defect free (Wang et al. 2012). The percentage of tubersproducing chips with severe defects is an important parameterfor evaluating chipping varieties. Average chip color from 18crushed chips, including those with defects, was quantifiedusing a HunterLab D25LT colorimeter (Hunter AssociatesLaboratory Inc., Reston, VA) and overall chip color wasscored using the standards reference chart for potato chips(Potato Chip International Institute).
Sugar Sample Processing
The 18 tuber halves saved from chip frying were randomlybulked into three replications, six in each. Tuber halves werecut into basal (stem-end) and apical (bud-end) portions. Stem-end samples were collected from the basal 2 cm of the tuberhalf while the bud-end samples were collected from the re-mainder. Stem-end and bud-end samples containing 200 gtissue were juiced separately using a model 6001 AcmeSupreme Juicerator (Waring Commercial, Stamford, CT).The juicer was rinsed with three aliquots of 50 ml refrigerated50 mM phosphate buffer, pH 7.2, turned off for 20 s, andallowed to spin down for 1 min before opening. Final volumeof the extract was brought up to 275 ml with refrigerated50 mM phosphate buffer (same buffer as described above).Juice samples in 400 mL glass beakers were stored in arefrigerator for 20 to 30 min, and gently stirred withoutdisturbing the precipitate (including starch) in the bottom ofthe beaker shortly before 10 ml of juice was placed into alabeled scintillation vial and frozen for later analysis. Duringanalysis, sucrose and glucose were measured following Ap-plication Note #305 (YSI Incorporated 2003) in 2010 andApplication Note #309 (YSI Incorporated 2000) in 2011 and2012, using YSI 2700 Select Biochemistry Analyzer (YSILife Sciences, Yellow Springs, OH). Sucrose and glucoseconcentrations are reported as mg g−1 FW.
Data Analysis
The rank of average July and August night temperatures ineach location between 2009 and 2011 relative to the
Am. J. Potato Res. (2015) 92:79–90 81

corresponding 30-year history (1982–2011) was determinedusing the ‘percentrank’ function in Excel (Microsoft, Seattle,WA). Analysis of Variance (ANOVA) was performed to testeffects of year, location, sampling time, variety, and theirinteractions using the Linear Mixed Model procedure of R(R Development Core Team 2012). In the model, year andlocation are tested as random effects, and sampling time andvariety are tested as fixed effects. Mean SECD scores, tuberstem-end glucose and sucrose concentrations, and chip colormeasurements were separated by Fisher’s LSD at p=0.05.Pearson’s correlation was used to analyze relationships be-tween SECD scores and chip color, average SECD scores andsevere SECD incidence, stem-end sugars (sucrose and glu-cose) and SECD scores, as well as stem-end sugars and chipcolor. To investigate the effects of pre-harvest or at-harvestchip color, tuber stem-end sugar concentrations (glucose orsucrose), and their interactions on post-harvest average SECDscores (4 and 10weeks after preconditioning), anANOVA testwas performed using the Linear Model procedure in R at p=0.05. In addition, to assess the difference in stem-end glucosecontent of tubers at- and post-harvest with average defectscore <0.8 or ≥0.8, an one-way ANOVAwas performed usingthe Linear Model procedure in R at p=0.05.
Results
Air Temperatures During the Growing Season VariedAcross Years and Locations
Average monthly temperatures during tuber bulking werelower in 2009 compared to 2010 and 2011 at all three trialsites (Fig. 1). In July of 2009, the average monthly air tem-peratures in MI, TX and WI were 3.0, 0.2, and 3.8 °C belowtheir 30-year average local temperatures, respectively. In Au-gust of that year, temperatures were 1.3, 0.3, and 1.7 °C lessthan average for the three locations, separately (Fig. 1). In2010 and 2011 at MI and WI, the difference between theaverage monthly air temperatures and the 30-year local re-cords in July and August were almost always higher than 0(Fig. 1a and c), suggesting that the primary growing seasonsfor potato production in those two locations in those 2 yearswere warmer than average. In 2010 at TX, the temperaturedifferences between monthly average and historical monthlyaverage records were 0.5 and 0.7 °C in July and August,separately. While in the 2011 season at TX, the differenceswere remarkably higher than those in the previous year, at 3.3and 3.4 °C for July and August, respectively (Fig. 1b).
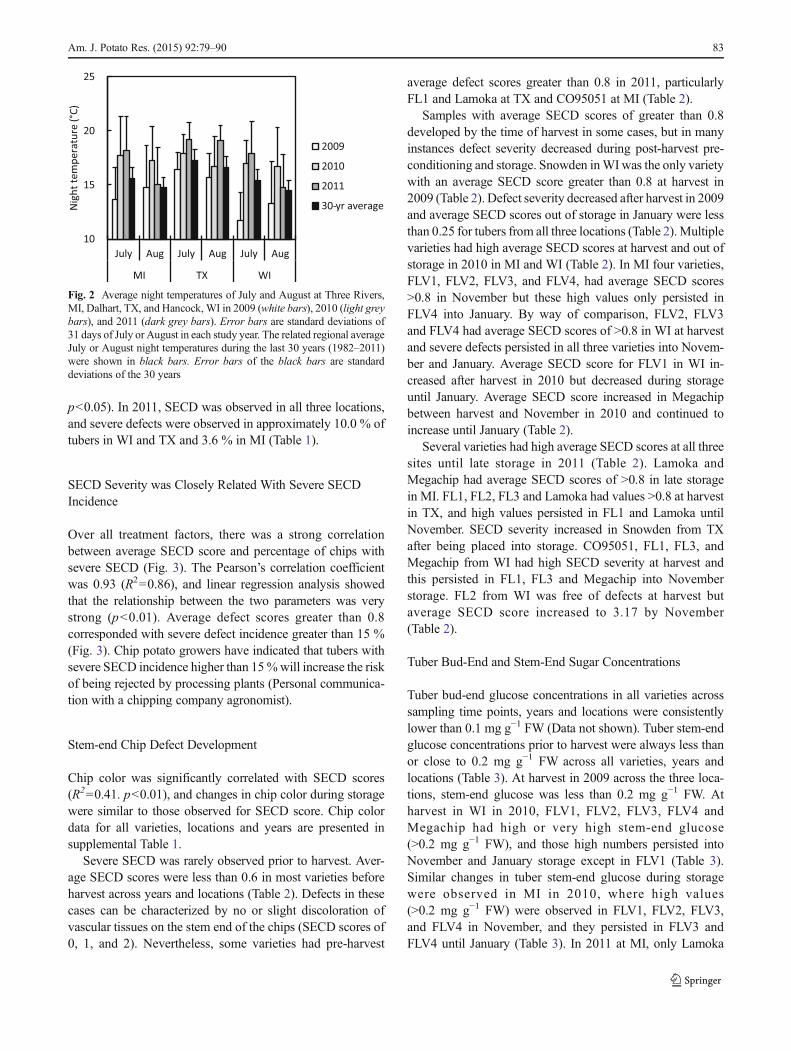
Temperatures at night in 2009 were relatively cool, and fellwithin the lower 25th percentile rank in the corresponding 30-year dataset in all three locations during July and in TX andWI during August (Fig. 2). In 2010, July and August night
temperatures were 2.2 °C (96th percentile) and 2.5 °C (97thpercentile) higher than historical monthly averages in MI, and1.5 °C (84th percentile) and 2.2 °C (97th percentile) higher inWI (Fig. 2). July and August night temperatures in 2011 were2.6 °C (100th percentile) and 0.4 °C (62th percentile) higherthan the historical monthly averages in MI, and 2.5 °C (100thpercentile) and 0.2 °C (57th percentile) higher in WI (Fig. 2).In TX, the differences between average night temperatures inJuly and August and the regional monthly 30-year averageswere 0.7 °C (73th percentile) and 0.04 °C (58th percentile) in2010, and 2.0 °C (84th percentile) and 2.5 °C (97th percentile)in 2011, respectively (Fig. 2).
Stem-end Chip Defect Occurred Erratically Across Yearsand Locations
In 2009, all three locations had low average SECD scores and0 % severe SECD incidence when averaged across all sam-pling times and varieties (Table 1). In 2010, MI and WI hadhigher SECD severity and incidence than TX (Table 1,
369
12151821242730
Apr May June July Aug Sep Oct
c
369
12151821242730
Tem
pera
ture
( C)°
369
12151821242730
2009 2010 201130 yr monthly average
a
b
Tem
pera
ture
( C) °
Tem
pera
ture
( C)°
Fig. 1 Average monthly air temperature (April to October) during thelast 30 years (1982–2011, dashed lines with round markers), in 2009(solid line with diamond markers), in 2010 (solid line with squaremarkers), and in 2011 (solid line with triangle markers) at Three Rivers,MI (a), Dalhart, TX (b), and Hancock, WI (c)
82 Am. J. Potato Res. (2015) 92:79–90
p<0.05). In 2011, SECD was observed in all three locations,and severe defects were observed in approximately 10.0 % oftubers in WI and TX and 3.6 % in MI (Table 1).
SECD Severity was Closely Related With Severe SECDIncidence
Over all treatment factors, there was a strong correlationbetween average SECD score and percentage of chips withsevere SECD (Fig. 3). The Pearson’s correlation coefficientwas 0.93 (R2=0.86), and linear regression analysis showedthat the relationship between the two parameters was verystrong (p<0.01). Average defect scores greater than 0.8corresponded with severe defect incidence greater than 15 %(Fig. 3). Chip potato growers have indicated that tubers withsevere SECD incidence higher than 15%will increase the riskof being rejected by processing plants (Personal communica-tion with a chipping company agronomist).
Stem-end Chip Defect Development
Chip color was significantly correlated with SECD scores(R2=0.41. p<0.01), and changes in chip color during storagewere similar to those observed for SECD score. Chip colordata for all varieties, locations and years are presented insupplemental Table 1.
Severe SECD was rarely observed prior to harvest. Aver-age SECD scores were less than 0.6 in most varieties beforeharvest across years and locations (Table 2). Defects in thesecases can be characterized by no or slight discoloration ofvascular tissues on the stem end of the chips (SECD scores of0, 1, and 2). Nevertheless, some varieties had pre-harvest
average defect scores greater than 0.8 in 2011, particularlyFL1 and Lamoka at TX and CO95051 at MI (Table 2).
Samples with average SECD scores of greater than 0.8developed by the time of harvest in some cases, but in manyinstances defect severity decreased during post-harvest pre-conditioning and storage. Snowden inWI was the only varietywith an average SECD score greater than 0.8 at harvest in2009 (Table 2). Defect severity decreased after harvest in 2009and average SECD scores out of storage in January were lessthan 0.25 for tubers from all three locations (Table 2).Multiplevarieties had high average SECD scores at harvest and out ofstorage in 2010 in MI and WI (Table 2). In MI four varieties,FLV1, FLV2, FLV3, and FLV4, had average SECD scores>0.8 in November but these high values only persisted inFLV4 into January. By way of comparison, FLV2, FLV3and FLV4 had average SECD scores of >0.8 in WI at harvestand severe defects persisted in all three varieties into Novem-ber and January. Average SECD score for FLV1 in WI in-creased after harvest in 2010 but decreased during storageuntil January. Average SECD score increased in Megachipbetween harvest and November in 2010 and continued toincrease until January (Table 2).
Several varieties had high average SECD scores at all threesites until late storage in 2011 (Table 2). Lamoka andMegachip had average SECD scores of >0.8 in late storagein MI. FL1, FL2, FL3 and Lamoka had values >0.8 at harvestin TX, and high values persisted in FL1 and Lamoka untilNovember. SECD severity increased in Snowden from TXafter being placed into storage. CO95051, FL1, FL3, andMegachip from WI had high SECD severity at harvest andthis persisted in FL1, FL3 and Megachip into Novemberstorage. FL2 from WI was free of defects at harvest butaverage SECD score increased to 3.17 by November(Table 2).
Tuber Bud-End and Stem-End Sugar Concentrations
Tuber bud-end glucose concentrations in all varieties acrosssampling time points, years and locations were consistentlylower than 0.1 mg g−1 FW (Data not shown). Tuber stem-endglucose concentrations prior to harvest were always less thanor close to 0.2 mg g−1 FW across all varieties, years andlocations (Table 3). At harvest in 2009 across the three loca-tions, stem-end glucose was less than 0.2 mg g−1 FW. Atharvest in WI in 2010, FLV1, FLV2, FLV3, FLV4 andMegachip had high or very high stem-end glucose(>0.2 mg g−1 FW), and those high numbers persisted intoNovember and January storage except in FLV1 (Table 3).Similar changes in tuber stem-end glucose during storagewere observed in MI in 2010, where high values(>0.2 mg g−1 FW) were observed in FLV1, FLV2, FLV3,and FLV4 in November, and they persisted in FLV3 andFLV4 until January (Table 3). In 2011 at MI, only Lamoka
10
15
20
25
July Aug July Aug July Aug
MI TX WI
Nig
htte
mpe
ratu
re( °
C)
2009
2010
2011
30-yr average
Fig. 2 Average night temperatures of July and August at Three Rivers,MI, Dalhart, TX, and Hancock, WI in 2009 (white bars), 2010 (light greybars), and 2011 (dark grey bars). Error bars are standard deviations of31 days of July or August in each study year. The related regional averageJuly or August night temperatures during the last 30 years (1982–2011)were shown in black bars. Error bars of the black bars are standarddeviations of the 30 years
Am. J. Potato Res. (2015) 92:79–90 83

displayed stem-end glucose greater than 0.2 mg g−1 FWout ofthe November storage. Only FL1 had stem-end glucose great-er than 0.2 mg g−1 FW at the November storage time point atTX. Interestingly at WI in 2011, at-harvest stem-end glucosewas higher than 0.2 mg g−1 FW for all varieties, and stem-endglucose content in CO95051, FL1, FL2 FL3 and Megachipremained above 0.2 m g−1 FW 4 weeks after the end ofpreconditioning (Table 3).
Pearson’s correlation coefficient between stem-end glucoseand average SECD score across all years, locations, varietiesand sampling time points was 0.51 (R2=0.26, p<0.01).Pearson’s correlation coefficient between stem-end glucoseand chip color across all treatments was 0.38 (R2=0.06,p<0.05). For data of the check variety Snowden alone,Pearson’s correlation coefficient between stem-end glucoseand SECD score was 0.49 (R2=0.24, p<0.05), similar to thosewhen data were combined across varieties. At harvest andafter harvest, average stem-end glucose in tubers was0.20 mg g−1 FW when average defect score was <0.8 (lessthan 15 % severe SECD, Fig. 3) and 0.45 mg g−1 FW when
average defect score was ≥0.8. These two numbers weresignificantly different at p<<0.001.
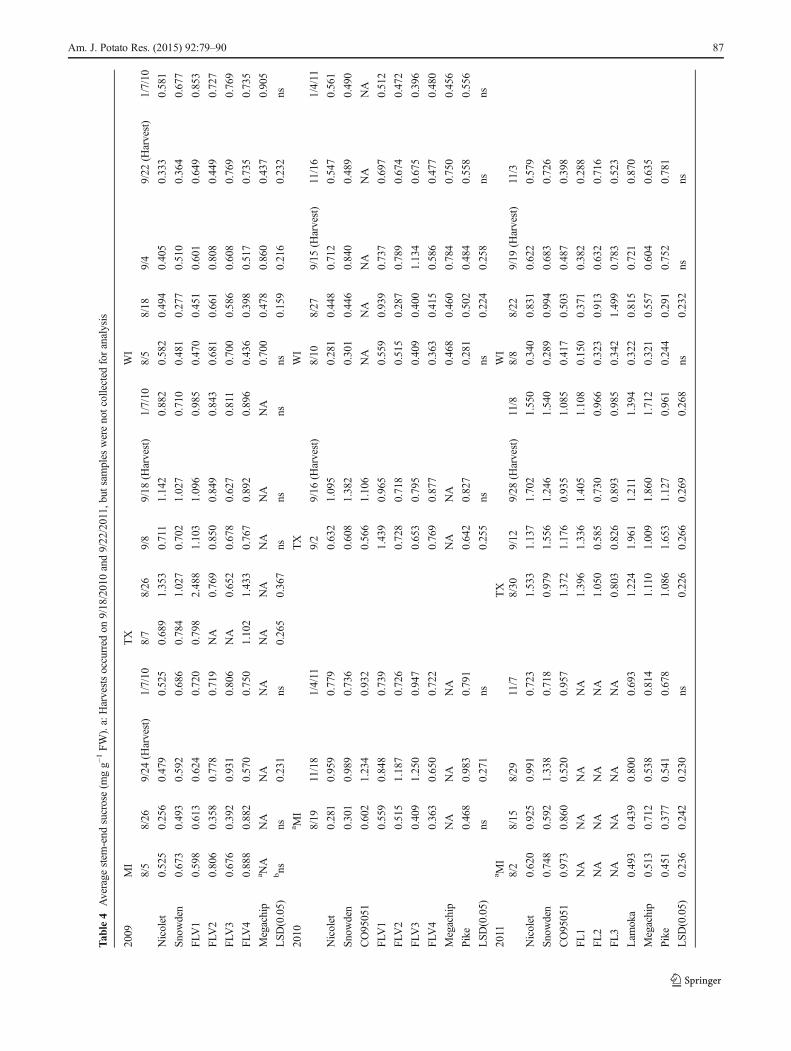
Tuber bud-end sucrose concentrations were higher than thestem-end for most varieties at harvest and out of storage (datanot shown). Stem-end sucrose concentrations at harvesttended to be approximate to 1.0 mg g−1 FW or less for allthree sites in 2009, and for WI in 2010 and 2011. Harvestsugar data were not available for MI in 2010 and 2011, but MItuber sucrose concentrations in November of 2010 and 2011ranged from 0.65 to 1.20 mg g−1 FW (Table 4). Snowden atTX in 2010 and Nicolet, Snowden, Lamoka and Megachip atTX in 2011 had tuber sucrose at harvest greater than1.20 mg g−1 FW and these remained above 1.20 mg g−1 FWthrough November. Correlations between stem-end sucroseand average SECD score or chip color were very poor (datanot shown).
Late in-Season Stem-End Glucose and SucroseConcentrations Were not Indicators of SECD at Harvestand During Storage, but Late in-Season Chip Color wasan Indicator
For data across all treatment factors, chip color 4 or 2 weekspre-vine desiccation, at vine desiccation and at harvest was asignificant predictor of average SECD score 10 weeks afterpreconditioning was completed (Table 5). In contrast, pre-vinedesiccation or at-harvest chip color was a less effective pre-dictor of average SECD score at the final harvest or 4 weeksafter the preconditioning period, with p-values ranging be-tween 0.06 and 0.17 (Table 5). In comparison, the pre-vinedesiccation or at-harvest stem-end glucose was not predictiveof post-harvest SECD score, and neither was the interactionbetween stem-end glucose and chip color (Table 5).
Table 1 Summary of average SECD scores, severe SECD (defect score equal to or higher than 3) incidence, and chip color scores across all varieties andsampling times
SECD Chip color
Average score Severe SECD incidence
2009 MI 0.05±0.26 0.0 % 2.9±1.2
2010 MI 0.41±0.98 6.5 % 5.0±1.4
2011 MI 0.30±0.79 3.6 % 4.7±0.9
2009 TX 0.02±0.20 0.0 % 3.5±1.3
2010 TX 0.01±0.14 0.0 % 4.3±0.9
2011 TX 0.51±1.17 10.0 % 4.9±0.8
2009 WI 0.06±0.30 0.0 % 2.9±1.3
2010 WI 0.54±1.08 8.2 % 4.6±1.1
2011 WI 0.51±1.06 9.8 % 4.7±1.0
Y × L interaction (p-value) <0.01**
** Significant at p<0.01
R²=0.86
01020304050607080
0.0 0.5 1.0 1.5 2.0 2.5 3.0 3.5Average SECD Score
Chip
s with
seve
re S
ECD
(%)
y=0.1912x-0.0104
Fig. 3 Linear regression relationship between average SECD scores andpercentage of chips with severe SECD. Each data point represents a singlevariety, at one sampling time point, at a single location, in one of the3 years of the study
84 Am. J. Potato Res. (2015) 92:79–90

Tab
le2
Average
SECDscores.a:H
arvestsoccurred
on9/18/2010and9/22/2011,butsam
ples
werenotcollected
foranalysis
2009
MI
TX
WI
8/5
8/26
9/24
(Harvest)
1/7/10
8/7
8/26
9/8
9/18
(Harvest)
1/7/10
8/5
8/18
9/4
9/22
(Harvest)
1/7/10
Nicolet
0.00
0.00
0.00
0.00
0.00
0.00
0.00
0.11
0.00
0.00
0.00
0.00
0.17
0.00
Snowden
0.00
0.00
0.11
0.00
0.00
0.00
0.00
0.00
0.00
0.00
0.00
0.00
1.22
0.00
FLV1
0.00
0.00
0.00
0.00
0.00
0.06
0.00
0.00
0.00
0.00
0.00
0.00
0.00
0.00
FLV2
0.00
0.00
0.06
0.00
0.06
0.00
0.00
0.11
0.00
0.00
0.00
0.00
0.11
0.00
FLV3
0.00
0.00
0.56
0.22
0.00
0.00
0.00
0.33
0.00
0.00
0.00
0.00
0.11
0.00
FLV4
0.00
0.00
0.00
0.11
0.00
0.00
0.00
0.00
0.00
0.00
0.00
0.00
0.44
0.00
Megachip
NA
NA
NA
NA
NA
NA
NA
NA
NA
0.00
0.00
0.00
0.06
0.00
LSD
(0.05)
nsns
0.32
0.14
0.06
0.06
ns0.27
nsns
nsns
0.32
ns
2010
a MI
TX
WI
8/19
11/18
1/4/11
8/16
9/2
9/16
(Harvest)
8/10
8/27
9/15
(Harvest)
11/16
1/4/11
Nicolet
0.00
0.06
0.17
0.00
0.00
0.06
0.00
0.00
0.00
0.33
0.44
Snowden
0.00
0.00
0.42
0.00
0.00
0.06
0.00
0.06
0.56
0.44
0.28
CO95051
0.00
0.11
0.23
0.00
0.00
0.00
NA
NA
NA
NA
NA
FLV1
0.00
1.28
0.69
0.00
0.00
0.06
0.00
0.00
0.67
0.94
0.17
FLV2
0.00
1.17
0.36
0.00
0.00
0.11
0.00
0.72
1.56
1.39
2.00
FLV3
0.00
1.50
0.63
0.00
0.00
0.06
0.00
0.22
1.44
2.00
2.22
FLV4
0.00
1.56
0.94
0.00
0.00
0.00
0.00
0.00
1.39
1.50
1.22
Megachip
NA
NA
NA
NA
NA
NA
0.00
0.00
0.61
1.33
1.44
Pike
0.00
0.06
0.35
0.00
0.00
0.00
0.00
0.06
0.17
0.39
0.22
LSD
(0.05)
ns0.71
0.69
nsns
0.16
ns0.24
0.58
0.78
0.86
2011
a MI
TX
WI
8/2
8/15
8/29
11/7
8/30
9/12
9/28
(Harvest)
11/8
8/8
8/22
9/19
(Harvest)
11/3
Nicolet
0.00
0.00
0.00
0.22
0.00
0.00
0.33
0.06
0.00
0.17
0.78
0.22
Snowden
0.17
0.22
0.11
0.72
0.00
0.56
0.22
0.94
0.00
0.17
0.00
0.33
CO95051
0.78
1.28
0.00
0.00
0.39
0.33
0.33
0.00
0.00
0.56
0.89
0.50
FL1
NA
NA
NA
NA
0.22
2.33
1.72
2.89
0.00
0.00
3.28
2.83
FL2
NA
NA
NA
NA
0.00
0.33
0.89
0.17
0.00
0.00
0.00
3.17
FL3
NA
NA
NA
NA
0.00
0.00
1.28
0.67
0.00
0.22
1.44
0.94
Lam
oka
0.00
0.33
0.00
0.94
0.00
3.17
1.61
1.44
0.00
0.00
0.17
0.44
Megachip
0.17
0.06
0.39
1.22
0.00
0.22
0.67
0.00
0.00
0.11
2.72
1.94
Pike
0.00
0.28
0.00
0.39
0.00
0.00
0.00
0.22
0.00
0.56
0.00
0.17
LSD
(0.05)
0.36
0.42
0.30
0.71
0.26
0.66
0.69
0.68
ns0.32
0.63
0.57
Am. J. Potato Res. (2015) 92:79–90 85

Tab
le3
Average
stem
-end
glucose(m
gg−
1FW
).a:Harvestsoccurred
on9/18/2010and9/22/2011,butsam
ples
werenotcollected
foranalysis
2009
MI
TX
WI
8/5
8/26
9/24
(Harvest)
1/7/10
8/7
8/26
9/8
9/18
(Harvest)
1/7/10
8/5
8/18
9/4
9/22
(Harvest)
1/7/10
Nicolet
0.057
0.108
0.150
0.116
0.101
0.171
0.083
0.040
0.057
0.059
0.013
0.061
0.047
0.184
Snow
den
0.045
0.080
0.195
0.093
0.112
0.189
0.100
0.043
0.048
0.026
0.013
0.112
0.100
0.137
FLV1
0.091
0.147
0.092
0.044
0.118
0.106
0.104
0.032
0.095
0.044
0.023
0.075
0.034
0.090
FLV2
0.043
0.145
0.160
0.091
0.065
0.135
0.182
0.036
0.113
0.014
0.011
0.124
0.031
0.029
FLV3
0.044
0.091
0.192
0.157
0.067
0.160
0.095
0.041
0.130
0.044
0.009
0.181
0.032
0.114
FLV4
0.051
0.116
0.099
0.107
0.092
0.131
0.111
0.028
0.105
0.027
0.010
0.100
0.040
0.085
Megachip
a NA
NA
NA
NA
NA
NA
NA
NA
NA
0.022
0.014
0.096
0.045
0.197
LSD
(0.05)
bns
ns0.038
0.014
ns0.06
nsns
0.026
nsns
0.030
nsns
2010
a MI
TX
WI
8/19
11/18
1/4/11
9/2
9/16
(Harvest)
8/10
8/27
9/15
(Harvest)
11/16
1/4/11
Nicolet
0.031
0.145
0.098
0.036
0.067
0.058
0.072
0.173
0.178
0.148
Snow
den
0.039
0.115
0.077
0.043
0.254
0.050
0.060
0.196
0.177
0.073
CO95051
0.164
0.167
0.112
0.041
0.130
NA
NA
NA
NA
NA
FLV1
0.031
0.313
0.150
0.104
0.053
0.141
0.064
0.235
0.299
0.153
FLV2
0.058
0.390
0.117
0.121
0.102
0.058
0.199
0.457
0.701
0.545
FLV3
0.043
0.478
0.258
0.071
0.087
0.051
0.089
0.506
0.914
0.555
FLV4
0.054
0.489
0.221
0.052
0.072
0.086
0.066
0.367
0.600
0.385
Megachip
NA
NA
NA
NA
NA
0.050
0.047
0.232
0.978
0.666
Pike
0.037
0.176
0.149
0.055
0.056
0.034
0.047
0.112
0.152
0.154
LSD
(0.05)
ns0.175
0.019
0.027
0.036
nsns
0.158
0.280
0.176
2011
a MI
TX
WI
8/2
8/15
8/29
11/7
8/30
9/12
9/28
(Harvest)
11/8
8/8
8/22
9/19
(Harvest)
11/3
Nicolet
0.006
0.028
0.003
0.007
0.006
0.006
0.006
0.007
0.030
0.027
0.385
0.132
Snow
den
0.007
0.004
0.060
0.049
0.009
0.015
0.024
0.069
0.057
0.082
0.857
0.198
CO95051
0.041
0.012
0.008
0.037
0.064
0.029
0.010
0.067
0.118
0.145
0.620
0.576
FL1
NA
NA
NA
NA
0.006
0.081
0.020
0.255
0.037
0.022
1.077
1.026
FL2
NA
NA
NA
NA
0.004
0.108
0.019
0.020
0.023
0.024
1.151
0.784
FL3
NA
NA
NA
NA
0.007
0.028
0.052
0.099
0.113
0.104
0.712
0.481
Lam
oka
0.007
0.318
0.065
0.209
0.006
0.008
0.014
0.067
0.017
0.020
0.314
0.164
Megachip
0.002
0.022
0.010
0.013
0.015
0.008
0.035
0.100
0.067
0.028
0.610
0.678
Pike
0.004
0.006
0.005
0.034
0.004
0.009
0.008
0.021
0.032
0.039
0.312
0.133
LSD
(0.05)
ns0.012
ns0.010
ns0.009
0.069
0.118
nsns
0.231
0.370
86 Am. J. Potato Res. (2015) 92:79–90
Tab
le4
Average
stem
-end
sucrose(m
gg−
1FW
).a:Harvestsoccurred
on9/18/2010and9/22/2011,butsam
ples
werenotcollected
foranalysis
2009
MI
TX
WI
8/5
8/26
9/24
(Harvest)
1/7/10
8/7
8/26
9/8
9/18
(Harvest)
1/7/10
8/5
8/18
9/4
9/22
(Harvest)
1/7/10
Nicolet
0.525
0.256
0.479
0.525
0.689
1.353
0.711
1.142
0.882
0.582
0.494
0.405
0.333
0.581
Snow
den
0.673
0.493
0.592
0.686
0.784
1.027
0.702
1.027
0.710
0.481
0.277
0.510
0.364
0.677
FLV1
0.598
0.613
0.624
0.720
0.798
2.488
1.103
1.096
0.985
0.470
0.451
0.601
0.649
0.853
FLV2
0.806
0.358
0.778
0.719
NA
0.769
0.850
0.849
0.843
0.681
0.661
0.808
0.449
0.727
FLV3
0.676
0.392
0.931
0.806
NA
0.652
0.678
0.627
0.811
0.700
0.586
0.608
0.769
0.769
FLV4
0.888
0.882
0.570
0.750
1.102
1.433
0.767
0.892
0.896
0.436
0.398
0.517
0.735
0.735
Megachip
a NA
NA
NA
NA
NA
NA
NA
NA
NA
0.700
0.478
0.860
0.437
0.905
LSD
(0.05)
bns
ns0.231
ns0.265
0.367
nsns
nsns
0.159
0.216
0.232
ns
2010
a MI
TX
WI
8/19
11/18
1/4/11
9/2
9/16
(Harvest)
8/10
8/27
9/15
(Harvest)
11/16
1/4/11
Nicolet
0.281
0.959
0.779
0.632
1.095
0.281
0.448
0.712
0.547
0.561
Snow
den
0.301
0.989
0.736
0.608
1.382
0.301
0.446
0.840
0.489
0.490
CO95051
0.602
1.234
0.932
0.566
1.106
NA
NA
NA
NA
NA
FLV1
0.559
0.848
0.739
1.439
0.965
0.559
0.939
0.737
0.697
0.512
FLV2
0.515
1.187
0.726
0.728
0.718
0.515
0.287
0.789
0.674
0.472
FLV3
0.409
1.250
0.947
0.653
0.795
0.409
0.400
1.134
0.675
0.396
FLV4
0.363
0.650
0.722
0.769
0.877
0.363
0.415
0.586
0.477
0.480
Megachip
NA
NA
NA
NA
NA
0.468
0.460
0.784
0.750
0.456
Pike
0.468
0.983
0.791
0.642
0.827
0.281
0.502
0.484
0.558
0.556
LSD
(0.05)
ns0.271
ns0.255
nsns
0.224
0.258
nsns
2011
a MI
TX
WI
8/2
8/15
8/29
11/7
8/30
9/12
9/28
(Harvest)
11/8
8/8
8/22
9/19
(Harvest)
11/3
Nicolet
0.620
0.925
0.991
0.723
1.533
1.137
1.702
1.550
0.340
0.831
0.622
0.579
Snow
den
0.748
0.592
1.338
0.718
0.979
1.556
1.246
1.540
0.289
0.994
0.683
0.726
CO95051
0.973
0.860
0.520
0.957
1.372
1.176
0.935
1.085
0.417
0.503
0.487
0.398
FL1
NA
NA
NA
NA
1.396
1.336
1.405
1.108
0.150
0.371
0.382
0.288
FL2
NA
NA
NA
NA
1.050
0.585
0.730
0.966
0.323
0.913
0.632
0.716
FL3
NA
NA
NA
NA
0.803
0.826
0.893
0.985
0.342
1.499
0.783
0.523
Lam
oka
0.493
0.439
0.800
0.693
1.224
1.961
1.211
1.394
0.322
0.815
0.721
0.870
Megachip
0.513
0.712
0.538
0.814
1.110
1.009
1.860
1.712
0.321
0.557
0.604
0.635
Pike
0.451
0.377
0.541
0.678
1.086
1.653
1.127
0.961
0.244
0.291
0.752
0.781
LSD
(0.05)
0.236
0.242
0.230
ns0.226
0.266
0.269
0.268
ns0.232
nsns
Am. J. Potato Res. (2015) 92:79–90 87

Discussion
Stem-end chip defect presents challenges to chipping potatogrowers across production areas and crop years, in part be-cause of the erratic appearance of the defect. It has beenproposed that heat stress, particularly nighttime heat stress,could be a major environmental contributor to development ofSECD (Wang et al. 2012). The high percentage of severedefect incidence observed in MI and WI in 2010 and acrossall three sites in 2011 (Table 1) supports this hypothesis.Higher monthly average temperatures and monthly averagenight temperatures compared to the regional 30-year historywere observed during July or August of those years (Figs. 1and 2). For example, in TX the monthly average temperaturein July of 2011 was 3.3 °C higher than the 30-year average andcorrespondingly there was a high percentage (10 %) of severeSECD in TX in that year. In contrast, 2009 and 2010 hadbelow average temperatures during July in TX and severeSECD incidence was 0 % in both years (Fig. 1, Table 1). Inaddition, in August of 2010 at MI and WI, average nighttemperatures were 2.5 and 2.2 °C higher than the historicalaverage, both at the 97th percentile rank relative to the region-al 30-year history, and correspondingly the SECD incidencein those regions was 6.5 and 8.2 % higher than the previousyear when mean night temperatures were lower than the 25thpercentile of the 30-year history (Fig. 2, Table 1). Theseobservations are also in agreement with previous data show-ing that non-pathological stress (such as heat stress) affectingthe development of potato tubers can result in biochemicalchanges during storage that influence tuber market quality
(Sowokinos et al. 1985). Yamaguchi et al. (1964) reportedthat yield, specific gravity and starch content of Russet Bur-bank and White Rose tubers were highest, and the sugarcontents lowest, when tubers were grown in soil temperaturesbetween 15 and 24 °C, compared with tubers grown at highertemperatures.
Heat stress, especially during tuber initiation and earlytuber bulking, is known to promote reducing sugar accumu-lation and sugar end defect development in Russet Burbank(Kleinkopf et al. 1988; Sabba et al. 2007). Sugar end defectcan rarely be improved through preconditioning or extendedstorage (Thompson et al. 2008), but a reduction in the severityof SECDwas observed during storage for multiple varieties inour study. For example, Snowden in 2009 at WI had anaverage SECD score of 1.22 at harvest, and this decreased to0.00 by January (Table 2). FLV1, FLV2 and FLV3 had aver-age SECD scores of 1.17 to 1.50 in November of 2010 at MI,but scores for these three varieties were 0.69 or less in January(Table 2). Further study will be needed to evaluate if opti-mized preconditioning conditions and storage times will con-sistently decrease average SECD severity to commerciallyacceptable values.
Average SECD score and severe SECD defect incidencewere useful measures of defect development, because theywere highly correlated with each other (Fig. 3). Either of thesetwo parameters should be sufficient for monitoring SECDduring storage. There were significant correlations betweenstem-end glucose, chip color and SECD average score acrossall years, locations, sampling time points and varieties. How-ever, the data presented in Table 5 show that pre- and at-
Table 5 p-values of ANOVA test on effects of pre- and at-harvest stem-end glucose, chip color and their interactions on post-harvest average SECDscores
Time Effects Avg. SECD score atharvest
Avg. SECD score 4 weeks post-precondn
Avg. SECD score 10 weeks post-precondn
4 weeks pre-vinedesiccation
Stem-end gluc 0.730 0.685 0.591
Chip color 0.062 0.078 0.014 *
Interaction 0.601 0.129 0.434
2 weeks pre-vinedesiccation
Stem-end gluc 0.260 0.582 0.716
Chip color 0.069 0.085 <0.001 ***
Interaction 0.792 0.657 0.286
At vine desiccation Stem-end gluc 0.406 0.315 0.118
Chip color 0.838 0.166 0.047 *
Interaction 0.371 0.259 0.574
At harvest Stem-end gluc 0.209 0.232 0.301
Chip color 0.081 0.106 <0.001 ***
Interaction 0.922 0.069 0.826
* Significant at p<0.05
*** Significant at p<0.001
88 Am. J. Potato Res. (2015) 92:79–90
harvest stem-end glucose was not well correlated with post-harvest SECD severity, but chip color prior to or at vinedesiccation could be an indicator of SECD development instorage (Table 5), although a significant association betweenthe two was only found 10 weeks after preconditioning wasachieved. Hypothesis to explain this given stem-end glucose’shigh correlation with chip color could be that firstly, fructose,which is the other major form of reducing sugar in potatoes,also plays a role in the Maillard reaction that causes the chipcolor (Haase 2007); secondly, reducing sugars are the primarybut not the only constituents in chip color formation.Rodriguez-Saona and Wrolstad (1997) had demonstrated thatpotato varieties with different reducing sugar contents pro-duced chips with similar color attributes, and ascorbic acid,phenolic acids, glutamine were also highly correlated withpotato chip color. Those all suggest that glucose alone doesnot explain or predict overall color quality. The findings inTable 5 indicate that future study on SECD should not be onlyfocused on chip color and glucose, other chemical compo-nents in potato tubers pre- and post-harvest such as fructose,phenolic acids, ascorbic acids and some amino acids need tobe considered as well.
Data from this study have shown that higher average stem-end glucose content at harvest or after harvest is associatedwith higher average SECD. Thus high tuber stem-end glucosecontents may indicate increased likelihood of defects and ahigher chance of rejection by chip processors. This hypothesisis supported by data from FLV2, FLV3, FLV4 and MegaChipat WI in 2010, where stem-end glucose was 0.60–0.98 mg g−1
FW at harvest and average SECD scores were >0.8 at harvestand during storage (Tables 2 and 3).
Stem-end chip defect occurs erratically between years andlocations, with defects appearing locally in some years andregionally in others (Wang and Bethke 2013). We did notidentify a chipping potato variety that was immune to SECDdevelopment. Thus, varieties that develop few defects orrecover from the defect while in storage may be preferredfor production regions in which SECD is most frequentlyobserved. Nicolet and Pike constantly showed low aver-age SECD across years and locations, suggesting thatthey were relatively more tolerant to conditions that gaverise to SECD. In the single case when Nicolet had anaverage SECD score greater than 0.8 at harvest, thedefect improved during the preconditioning process andaverage SECD score in November decrease to 0.22(Table 2).
Management practices designed to control or mitigateSECD should include selecting appropriate varieties, moni-toring air and soil temperature during early and late tuberbulking stages as indicators of heat stress that can lead todefect formation, monitoring pre-vine desiccation chipcolor, as well as appropriate preconditioning and post-harvest storage.
Acknowledgments The authors thank Walter Farms, CSS Farms,Heartland Farms and their employees for helping us to conduct this study.The authors thank Frito-lay, Inc. for authorizing use of FL varieties.Special thanks are given to United States Potato Board Chip Committeefor encouraging this research and to the United States Potato Board forfunding this research.
References
Anonymous. 2012. Potato acreage. United States Department ofAgriculture, National Agricultural Statistics Service. ISSN: 1949–1552.
Anonymous. 2013. Potato statistical yearbook. Page 65. http://nationalpotatocouncil.org/potato-facts/ (accessed 21 November2013).
Bethke, P.C., and A.J. Bussan. 2013. Acrylamide in processed potatoproducts. American Journal of Potato Research 90: 403–424.
Bussan, A.J., R. Sabba, and M.J. Drilias. 2009. Tuber maturation andpotato storability: optimizing skin set, sugars, and solids.Cooperative extension, UW-Madison extension bulletin A3884-02.
Clark, J.P. 2003. Happy birthday, potato chip! And other snack develop-ments. Food Technology 57: 89–92.
R Development Core Team. 2012. R: A language and environment forstatistical computing. R Foundation for Statistical Computing,Vienna, Austria. ISBN 3-900051-07-0, URL http://www.R-project.org/.
Garayo, J., and R.Moreira. 2002. Vacuum frying of potato chips. Journalof Food Engineering 55: 181–191.
Gould, W.A. 1980. Quality control procedures for the manufacture ofpotato chips and snack foods. Alexandria: Potato Chip/Snack FoodAssociation.
Haase, N.U. 2007. The canon of potato science: 48. Maillard Reaction.Potato Research 50: 407–409.
Habib, A.T., and H.D. Brown. 1957. Role of reducing sugars and aminoacids in the browning of potato chips. Journal of Food Technology11: 85–89.
Hiller, L.K., and R.E. Thornton. 1993. Management of physiologicaldisorders. In Potato health management, ed. R.C. Rowe, 87–94.St. Paul, MN: APS.
Iritani, W.M. 1981. Growth and pre-harvest stress and processing qualityof potatoes. American Potato Journal 58: 71–80.
Iritani, W.M. 1987. The physiological basis of sugar end development.Proceedings of the University of Idaho Winter Commodity Schools19: 165–168.
Iritani, W.M., and L. Weller. 1973. The development of translucent endtubers. American Potato Journal 50: 223–233.
Kleinkopf, G.E. 1976. Translucent end of potatoes. Proceedings inUniversity of Idaho Potato School 8: 51–61.
Kleinkopf, G.E., D.T. Westermann, and M.J. Wille. 1988. Soil tempera-ture effects on sugar end development. Proceedings in University ofIdaho Winter Commodity Schools 20: 180–181.
Lineback, D.R., J.R. Coughlin, and R.H. Stadler. 2012. Acrylamide infoods: a review of the science and future considerations. AnnualReview of Food Science and Technology 3: 15–35.
Marquez, G., and M.C. Anon. 1986. Influence of reducing sugars andamino acids in the color development of fried potatoes. Journal ofFood Science 51: 157–160.
Mottram, D.S., B.L. Wedzicha, and A.T. Dodson. 2002. Acrylamide isformed in the Maillard reaction. Nature 419: 448–449.
Pedersen, M., H. von Stedingk, M. Botsivali, S. Agramunt, J. Alexander,G. Brunborg, et al. 2012. Birth weight, head circumference, andprenatal exposure to acrylamide from maternal diet: The EuropeanProspective Mother-Child Study (NewGeneris). EnvironmentalHealth Perspectives 120: 1739–1745.
Am. J. Potato Res. (2015) 92:79–90 89

Pedreschi, F., P.C. Moyano, K. Kaack, and K. Granby. 2005. Colorchanges and acrylamide formation in fried potato slices. FoodResearch International 38: 1–9.
Pedreschi, F., J. Leon, D.Mery, and P. Moyano. 2006a. Development of acomputer vision system to measure the color of potato chips. FoodResearch International 39: 1092–1098.
Pedreschi, F., K. Kaack, and K. Granby. 2006b. Acrylamide content andcolor development in fried potato strips. Food ResearchInternational 39: 40–46.
Rodriguez-Saona, L.E., and R.E. Wrolstad. 1997. Influence of potato com-position on chip color quality. American Potato Journal 74: 87–106.
Sabba, R.P., A.J. Bussan, B.A. Michaelis, R. Hughes, M.J. Drilias, andM.T. Glynn. 2007. Effect of planting and vine-kill timing on sugars,specific gravity and skin set in processing potato cultivars. AmericanJournal of Potato Research 84: 205–215.
Scanlon, M.G., R. Roller, G. Mazza, and M.K. Pritchard. 1994.Computerized video image analysis to quantify color of potatochips. American Potato Journal 71: 717–733.
Sowokinos, J.R., and D.A. Preston. 1988. Maintenance of potato pro-cessing quality by chemical maturity monitoring (CMM). StationBulletin 586–1988; Item Number AD-SB-3441. MinnesotaAgricultural Experiment Station, University of Minnesota.
Sowokinos, J.R., E.C. Lulai, and J.A. Knoper. 1985. Translucent tissuedefects in Solanum tuberosum L: I. Alterations in amyloplast mem-brane integrity, enzyme activities, sugars, and starch content. PlantPhysiology 78: 489–494.
Stadler, R.H., I. Blank, N. Varga, F. Robert, J. Hau, A. Guy, P. Robert, andM.C. Riediker. 2002. Acrylamide from Maillard reaction products.Nature 419: 449–450.
Thompson, A.L., S.L. Love, J.R. Sowokinos, M.K. Thornton, andC.C. Shock. 2008. Review of the sugar end disorder in potato(Solanum tuberosum, L.). American Journal of Potato Research85: 375–386.
Wang, Y., and P.C. Bethke. 2013. Effects of Verticillium dahliaeinfection on stem-end chip defect development in potatoes.Crop Science 53: 1–7.
Wang, Y., A.J. Bussan, and P.C. Bethke. 2012. Stem-end chip defect inchipping potatoes (Solanum tuberosum, L.) as influenced by mildenvironmental stresses. American Journal of Potato Research 89:392–399.
Yamaguchi, M., H. Timm, and A.R. Spurr. 1964. Effects of soil temper-ature on growth and nutrition on potato plants and tuberization,composition and periderm structure of tuber. Proceedings of theAmerican Society for Horticultural Science 84: 412–423.
YSI Incorporated. 2000. Application note number 309. http://www.ysilifesciences.com/uploads/application-20note-20309.pdf.
YSI Incorporated. 2003. Application note number 305. http://www.ysilifesciences.com/uploads/Application-20note-20305.pdf.
Zhang, Y., and Y. Zhang. 2007. Formation and reduction of acryl-amide in Maillard reaction: a review based on the current stateof knowledge. Critical Reviews in Food Science and Nutrition47: 521–542.
90 Am. J. Potato Res. (2015) 92:79–90