a multichamber, pressure-based test method to determine
TRANSCRIPT

February 2017 | Volume 3 | Article 71
Original researchpublished: 10 February 2017
doi: 10.3389/fbuil.2017.00007
Frontiers in Built Environment | www.frontiersin.org
Edited by: Matthew Mason,
University of Queensland, Australia
Reviewed by: Aly Mousaad Aly,
Louisiana State University, USA Ioannis Zisis,
Florida International University, USA
*Correspondence:Gregory A. Kopp
Specialty section: This article was submitted to Wind
Engineering and Science, a section of the journal
Frontiers in Built Environment
Received: 30 September 2016Accepted: 18 January 2017
Published: 10 February 2017
Citation: Miller CS, Kopp GA, Morrison MJ,
Kemp G and Drought N (2017) A Multichamber, Pressure-Based Test Method to Determine Wind
Loads on Air-Permeable, Multilayer Cladding Systems.
Front. Built Environ. 3:7. doi: 10.3389/fbuil.2017.00007
a Multichamber, Pressure-Based Test Method to Determine Wind loads on air-Permeable, Multilayer cladding systemsConnell Shamus Miller1, Gregory A. Kopp1*, Murray J. Morrison2, Gary Kemp3 and Nick Drought3
1 Boundary Layer Wind Tunnel Laboratory, Faculty of Engineering, University of Western Ontario, London, ON, Canada, 2 Insurance Institute for Business and Home Safety, Richburg, SC, USA, 3 Cambridge Consultants Ltd., Cambridge, UK
Current standardized testing on air-permeable multilayer cladding is inaccurate since one of the primary parameters for setting the peak net wind loads across the clad-ding is the external pressure gradient, which is removed from all standardized testing. After implementing a latex-barrier system and examining the control strategy for the pressure loading actuators, a multichamber airbox system for testing air-permeable multilayer cladding is developed and compared to a benchmark study performed by the Insurance Research Lab for Better Homes. The results indicate that using multichamber, pressure-based testing to obtain wind loads for air-permeable, multilayer wall systems with flexible cladding is sufficiently accurate. This method also shows that eliminating temporal variations from the external pressures for easier standardized testing would provide fairly accurate results.
Keywords: wind loads, full-scale test methods, air-permeable cladding, pressure equalization, pressure loading actuators
inTrODUcTiOn
BackgroundSevere wind storms around the world continue to cause significant economic losses. While there have been significant advances and successes with building codes, design standards, and construc-tion methods, which have reduced major structural failures (e.g., Gurley and Masters, 2011), losses caused by extreme wind storms continue to grow. These tend to be due to failures of the building envelope and connections, e.g., cladding failures caused by either net pressure loads or wind-borne debris impacts, failures of nailed connections, etc. Entry of rain water through the resulting openings is a significant source of damage (e.g., Sparks et al., 1994; Gurley and Masters, 2011). This contrasts significantly with earthquakes where a substantial portion of the losses is due to failures of major structure members. Where structural members fail in wind storms, they are often due to failure of an envelope component first, such as a window or door that allows internal pressurization. Thus, mitigation of economic losses in wind storms is strongly dependent on enhanced performance of cladding systems and their connections.
The performance of cladding and connections is usually evaluated by component tests, normally in compliance with standardized tests. Examples of standardized tests that are used to evaluate product performance under wind loads include ASTM D5206 (2013) for vinyl siding,

2
Miller et al. Airbox Testing on Multilayer Cladding
Frontiers in Built Environment | www.frontiersin.org February 2017 | Volume 3 | Article 7
ASTM E1592 (2012) for metal roofing, and ASTM E1300 (2012) for glazing and glass. Most of these standardized tests make use of a sealed airbox system,1 where the pressure required to fail the particular product is obtained. Many of these standardized tests use uniform, static pressures or slowly increasing pres-sures, such as those listed above. For components that have low-cycle fatigue as a failure mechanism, sinusoidally varying pressures at various frequencies and amplitudes are applied (Henderson et al., 2013a). In all cases, the pressures applied by these standard tests are uniform over the component. This, of course, provides applied loads that are significantly differ-ent than real wind loads, but which are relatively simple and inexpensive to apply (Kopp et al., 2012).
While there are standardized tests to assess the capacity of cladding systems, wind loads are much less well-defined, particu-larly for cladding and component systems with air-permeable, multilayer assemblies. ASCE 7-05 (American Society for Civil Engineering, 2006) acknowledges this (in section C6.5.2.2 of ASCE 7-05 or section 30.1.5 of ASCE 7-10), indicating that
The designer may elect either to use the loads derived from Section 6.5 [single-layer pressures] or to use loads derived by an approved alternative method. If the designer desires to determine the pressure differential across the air-permeable cladding element, appropriate full-scale pressure measurements should be made on the applicable cladding element, or reference be made to recognized literature for documentation pertaining to wind loads.
For such systems, net wind load coefficients are not generally known, and standard methods for determining wind loads, i.e., scale-model wind tunnel tests, cannot be used. While ASCE 7 indicates that “full-scale pressure measurements should be made,” there are limited methods that have been developed. For example, the test standard for vinyl siding, which is a type of relatively low-cost cladding used in North American residential wood-frame wall assemblies, is ASTM D5206 (2013). In this standard, pressure equalization is eliminated by placing an airtight barrier between the siding layer and internal sheath-ing layer or insulating layer. Uniform, static pressures are then applied via an airbox in order to determine the capacity of the siding. This yields the net pressure at the limit state (assuming that the failure mechanism and capacity are not substantially altered by the approach). The limit-state pressure is related to the wind loads in ASTM D3679 (2013). This standard requires that the design external pressure in ASCE 7 be multiplied by a “pressure equalization factor” (PEF), which in this case has a value of 0.36. Thus, ASTM D3679 (2013) assumes that the net pressure across the siding is 64% lower than the external pressure acting on the wall (i.e., 64% lower than the net pres-sure across the entire wall, assuming the building internal pressure is 0 or that there is a sealed internal layer). The PEF in ASTM D3679 (2013) was obtained from static, uniform airbox
1 We will use the terms “airbox” and “pressure chamber” synonymously to indicate the enclosed volume where pressure is applied to a specimen’s surface.
tests conducted by Architectural Testing, Inc. (2002); with similar values found by uniform, but time-varying, pressures in Gavanski and Kopp (2011a). Recently, using full-scale wind tunnel tests from the Insurance Institute for Business and Home Safety (IBHS) Research Center, Morrison and Cope (2015) found a PEF of closer to 0.8, indicating load coefficients that are more than double those of ASTM D3679 (2013), all else being equal. As discussed in detail below, the external pressure gradient is a primary parameter in setting the net wind load on air-permeable, multilayer cladding. Clearly, there is a need to develop appropriate methodologies for assessing net pressures for air-permeable, multilayer assembles, which is the objective of the current study.
Methods for Determining Wind loads on air-Permeable, Multilayer claddingThere are at least four possible methods for determining the net pressure coefficients on air-permeable, multilayer cladding systems: (i) analytical models or computational fluid dynam-ics, (ii) large-scale or full-scale wind tunnel tests, (iii) full-scale field measurements, and (iv) airbox tests with applied external pressures.
Bienkiewicz and Sun (1997) have shown that the wind loads for air-permeable multilayer systems depend on the external pres-sure gradient, the gap between panels, the thickness of the panels, the cavity depth between the panels and the interior surface, and the loss coefficients for the flows through the various openings. Because of the prominent dependence on the external pressure gradient, compartmentalization of the cavity is extremely effec-tive at reducing the net wind loads (Kumar, 2000) by limiting the effects of the spatial gradients, leaving only the second order dependence on the temporal gradient. Rain screen walls make extensive use of this concept (Kumar, 2000). Oh and Kopp (2014) found that, because of the external pressure gradient, there is a neutral pressure line, which causes the net, area-averaged pressure coefficients to reduce with area faster than the external pressure coefficients do. These authors’ analytical model shows that spatial and temporal variations of the cavity pressures can be modeled analytically for one-dimensional cavity pressure fields using the unsteady Bernoulli equation and appropriate loss models. Sun and Bienkiewicz (1993) used a similar, but steady-flow, model to model the mean two-dimensional cavity pressure field. However, a full spatial and temporal analytical model of cavity pressures has not yet been developed. Computational fluid dynamics-based solutions are also possible, but these have not been conducted to the authors’ knowledge.
Large-scale wind tunnel tests have been used to study pressure equalization for roof pavers. Mooneghi et al. (2014) showed that sufficient tap resolution is required to ascertain wind loads on these systems, using their 1/2-scale building model in the wall of wind facility. Considering the small gaps involved, it seems unlikely the more typical boundary layer wind tunnel model scales can be used since the full-scale gaps are often on the order of 3 mm and smaller. For roof-mounted photovoltaic arrays, larger gaps mean that standard boundary layer wind tunnels can be used at scales of 1/20 to 1/30, although there has not yet been a full-scale validation of these relatively large-model-scale

3
Miller et al. Airbox Testing on Multilayer Cladding
Frontiers in Built Environment | www.frontiersin.org February 2017 | Volume 3 | Article 7
results (compared to typical model scales of 1/300 to 1/500 in most boundary layer wind tunnels). For vinyl siding, with gaps between panels that are largely undefined (because of how the panels clip together), model-scale wind tunnel methods cannot be used at all (even at 1/10). For this reason, Morrison and Cope (2015) examined such systems at full scale in the IBHS Research Center wind tunnel. The main disadvantage of this approach is that it is not cost effective for routine product testing and one can only test the products on a limited set of building sizes, lim-iting the generality of the findings, as discussed by Kopp et al. (2012). Full-scale field measurements are useful for validation of other test methods, but the cost, limited pressure tap resolu-tions, and limited numbers of building configurations mean that this approach cannot be practically used for determining design loads.
Kopp et al. (2012) have shown that full-scale multichamber airbox testing can be used to test overall building responses to wind loads. However, it has not been established whether such approaches can be used with air-permeable, multilayer systems. Given the potential advantages of a relatively low-cost and straightforward test methodology, the objective of the current study is to determine whether multichamber airbox testing is feasible for assessing wind loads on air-permeable, multilayer cladding systems. To this end, the multichamber, PLA approach of Kopp et al. (2010, 2012) is modified, as described in Section “The Multichamber, PLA Approach,” with a test case of vinyl sid-ing examined in Section “Test Case for Air-Permeable, Multilayer Cladding.”
The MUlTichaMBer, Pla aPPrOach
BackgroundOne of the first systems to replicate realistic fluctuating pressures on a scale suitable for representative sections of the building envelope is the Building Research Establishment’s real-time wind uniform load follower (BRERWULF; Cook et al., 1988). While this test method was a significant advance, the main disadvantage of the BRERWULF system is that it could not accommodate airflow through the specimen, which is common in many stand-ard building materials. As such, a multichamber BRERWULF system for testing air-permeable cladding would not function well because of the necessity to allow airflow between chambers.
A loading system capable of applying spatially and temporally varying loads on standing seam metal roof cladding was devel-oped at Mississippi State University (Sinno et al., 2003; Surry et al., 2007). The test rig used large capacity electromagnets to apply an array of quickly varying uplift loads on top of a uni-form positive pressure applied from an airbox underneath the cladding. Importantly, the MSU system brings the application of realistic (temporally and spatially varying) wind pressures to the test specimen. The disadvantages of this technique are that it only works with metal cladding elements and there is a significant amount of tuning to the system required before a specific loading trace could be applied to a specimen.
Kopp et al. (2010, 2012) presented a loading system based on “pressure loading actuators” (PLAs), which overcame the limitations of the BRERWULF and MSU loading systems. The
PLA system uses multiple pressure chambers to capture the spatial variations of the wind loads while each individual PLA is able to capture pressure fluctuations up to about 10 Hz with peak pressures of up to about 23 kPa in pressure and −20 kPa in suction (Kopp et al., 2010). Thus, very large loads, at the limit states of wood-frame houses, could be applied (Morrison et al., 2012; Henderson et al., 2013b) to buildings with significant leakage through the building envelope via a system of flexible, independent airboxes.
Pressure chambersAll pressure-based loading systems require a chamber in which to apply the pressures. Usually, these are nominally airtight and of fixed volume, i.e., they have solid side walls. Thus, the PLAs also require pressure chambers in order to apply the load to a building surface. However, for applying loads to the surface of a house, Morrison et al. (2012) developed a system of multiple, independ-ent, flexible airbags with rigid supporting frames. These pressure chambers consisted of a rigid modular lid, which incorporated a molded inlet duct with air filter, the surface of the building (test specimen), which forms one surface of the chamber, and a flexible vinyl skirt that encloses the space between the lid and building surface, which forms the walls of the chamber. This system was required to be at least nominally airtight so that the pressure traces could be controlled reliably with leakage coming only through the building surface (such as bricks or cracks). The lids of the pressure chambers were connected to a rigid reaction frame. The skirt or membrane was required to be flexible since the building or component could deflect (on the order of 15 cm or more). Each pressure chamber was independent of the others because they were separated by approximately 2″ (5 cm) with no physical communication between them.
This pressure-chamber system was adequate for testing the structural response of buildings, but there is a significant issue that needs to be addressed for cladding tests. The surface areas outside of the chambers, but part of the test sample, are problematic for multilayer cladding tests where the intent is to determine the net pressures across layers of the cladding. The reason for this issue is that the cavity pressures depend significantly on the external pressure gradients, as discussed above. Thus, these non-pressurized areas need to be eliminated (or only located at non-porous areas of the cladding surface) because they artificially alter the pressure gradients. For vinyl siding, where there may be continuous leakage, the only solution is to eliminate the unloaded areas on the external surface of the cladding by having common “skirts” for adjacent pressure chambers. This poses a challenge for the PLA control system because there are two forms of communication between adja-cent chambers: (i) net flows through the interior volume of the cavity between layers from one chamber to another and (ii) the changes in chamber volume due to the movement of the skirt because of the time-varying differences in pres-sure between adjacent chambers. Details of the implemented pressure-chamber solution for testing vinyl siding are provided in Section “Test Case for Air-Permeable, Multilayer Cladding.” To understand the control solution, the operation of the PLAs is described next.

FigUre 1 | (a) A schematic drawing of the five-port valve concept and (B) an operational flow diagram showing the three limiting states of the valve.
4
Miller et al. Airbox Testing on Multilayer Cladding
Frontiers in Built Environment | www.frontiersin.org February 2017 | Volume 3 | Article 7
Flow-reversing Valves and the PlasConceptually, the control of the pressure in an airbox can be done in two different ways. One can vary the supply pressure into the airbox by varying the fan speed and direction using a variable speed drive. Alternatively, one can use a flow-reversing valve to control the pressure inside a pressure chamber. The first option provides the simplest and cheapest solution; however, it is not technically feasible to change the fan speed fast enough to be able to meet both the pressure magnitudes and frequencies required to simulate realistic wind loads on cladding elements. As such, the conceptual design consists of a fan or blower to produce the pressures, a valve system to regulate the applied pressures, and a feedback control system in order to monitor the applied pressure and adjust the valve system accordingly.
Different valve configurations could be employed to quickly reverse airflow to and from a fan operating at constant speed. The minimum number of ports required would be four, with one into the low-pressure side of the fan, one out of the high-pressure side of the fan, one connected to atmosphere, and one to the airbox. However, for the current, as well as for the previous BRERWULF design, a five-port design was employed, with the additional port also connected to atmosphere. The advantage of a five-port design is that it avoids a closed loop between the fan inlet and outlet which would result in heat building up in the system. It should be noted that individual valves could be used on the different ports to change the flow direction but to minimize the number of components, moving parts, and control complexity, a rotating disk within the valve was chosen. This has the advantage of one moving part, which is on the axis of rota-tion of a servomotor.
Figure 1 shows a schematic of a five-port valve and rotating disk concept along with a flow schematic showing its operation. The valve is made in two halves (i.e., two castings), one with two ports and the other with three, with a slotted disk between them.
A schematic representation of these parts is presented in Figure 1 while Figure 2 depicts an assembly drawing of all the parts mak-ing up the valve. The two ports in the two-port half of the valve are connected to the fan with “i” (Figure 1A) representing the connection to the inlet (low-pressure side) of the fan and “o” representing the connection to the outlet (high-pressure side) of the fan. The direction of flow through these ports is also shown in Figure 1A. For the three-port half of the valve, there is inflow from the atmosphere into port “a” and outflow to the atmosphere from port “c.” Port “b” is connected to the pressure chamber, and flow can be either into or out of this chamber, depending on the position of the slotted disk. It is for this reason that this device is called a flow-reversing valve.
Figure 1B shows the three limiting states of the valve: (i) neu-tral, with no flow into or out of the pressure chamber, (i) full flow out of the pressure chamber, and (iii) full flow into the pressure chamber. The position of the slotted disk, which is controlled by a servomotor, determines which state occurs. For example, when the disk is in the position such that port “a” is entirely blocked, there is no inflow from the atmosphere, and the flow is from the pressure chamber through port “b” into the fan inlet, through the fan, and out to atmosphere. This state leads to lower than atmospheric pressure (i.e., suction) in the pressure chamber. This is depicted in the middle schematic of Figure 1B, while the other two schematics in Figure 1B depict the other two limit states discussed above.
As noted above, the slotted disk is positioned by a servomo-tor, which can move the slotted disk to any angle. Depending on the disk angle, a range of positive and negative pressures can be achieved, which is determined by the fan characteristics, flow losses (i.e., pressure drops) in the ducts, valve, and other flow elements, and leakage into (or out of) the pressure chamber. Figure 2 presents the final assembly of the different valve components, along with the symmetric slotted disk design. The final shape of the valve was determined by using computational

FigUre 3 | a valve map showing the comparison between the first-generation disk (blue) and the final symmetric disk (red).
FigUre 2 | an assembly drawing showing an exploded view of the final valve design and symmetric disk.
5
Miller et al. Airbox Testing on Multilayer Cladding
Frontiers in Built Environment | www.frontiersin.org February 2017 | Volume 3 | Article 7
fluid dynamics to minimize the losses, improving the overall performance of the system (i.e., reducing power requirements to achieve particular pressures at particular leakage flow rates). The next section discusses the development of the valve in detail, and how it controls the pressure under different leakage conditions.
system Performance and control under Variable leakage FlowsOne of the critical aspects of simplifying the computer control system was the linearization of the valve, i.e., ensuring a nearly linear relationship between airbox pressure and valve position. Figure 3 depicts the “valve map” (the static-flow relationship between pressure and velocity) for the perfectly symmetric valve/disk arrangement (which is shown schematically in Figure 1) in a pressure chamber with fixed volume and very small leakage. The gradient of pressure with respect to valve position at high magnitudes of suctions and pressures is roughly 30 times the gradient in regions closer to 0 pressure (neutral position). This non-linearity would result in increased complexity of an already complex control system, significantly increasing the time critical computing resources required, particularly when operating mul-tiple PLAs. In order to improve the linearity of the valve map with the symmetric disk, stationary tabs with a suitable profile were introduced to the valve housing. The improved linearity of the modified system can be seen in Figure 3. Overall performance of the PLA in fixed volumes and high peak pressures is discussed in Kopp et al. (2010). At much lower pressures, with interconnected pressure chambers, the PLAs still function with high accuracy, as discussed below. Figure 4 shows the pressure versus valve posi-tion of the symmetric disk under different leakage conditions as indicated. While the pressures at a given valve position reduce with increasing leakage in the airbox, it decreases linearly with increasing leakage. The linearity of pressure versus leakage flow at each valve position allows the control system to automatically adjust to different initial leakage conditions or to adapt to chang-ing leakage conditions during a test.
As can be inferred from the valve maps presented in Figures 3 and 4, the PLA is a single-input–single-output system with the valve position as the input and the required pressure as the output. Thus, the requested valve position and the measured pressure are an input–output pair for use in a proportional–integral–derivative
(PID) control system. The control system is effectively approxi-mated to a linear first-order model as the required pressure trace, whether fluctuating or a simple ramp, is preloaded as a feed-forward term. The feedback PID term is based on the tracking error which is simply the difference between the required and measured pressures. The valve map is used to determine what valve position is required to meet the applied pressure under steady-state conditions resulting in a known system time con-stant, τ, for the PID control. In calculating τ from the requested pressure and achieved pressure in real time, the adjacent pressures from the current and previous time steps are used.
Changes in leakage and air-chamber volume cause the time constant, τ, to vary enormously. The solution for this issue was to use gain scheduling; the real-time estimation of τ is used to deter-mine the system gain from a suite of preloaded lookup tables, which are generated for known leakage and volumes. However, the system gain (K) increases with increasing τ, which can lead to instabilities with an overestimation of τ, particularly for very small volumes relative to power or input traces that have minimal changes in time (i.e., static pressures or ramp loads). This is only an issue at start up when the control system has no information on τ, that is, the pressure chamber and test element properties. Therefore, a median value of τ and a limit on the increase in K is set for the first 10 s of program control. The system learns the chamber’s characteristics within this time frame. In cases where absolute control is required in the first 10 s, a user defined value of τ can be used. However, this necessitates additional experiments to determine the correct system time constant. With the lookup tables and the linearization of the valve chamber with disk posi-tion, the PID control system then can adapt rapidly to changing chamber conditions. The control system was designed this way so that that it could adapt to any pressure chamber and input trace (within certain bounds), and still run effectively without any user input into the PID.
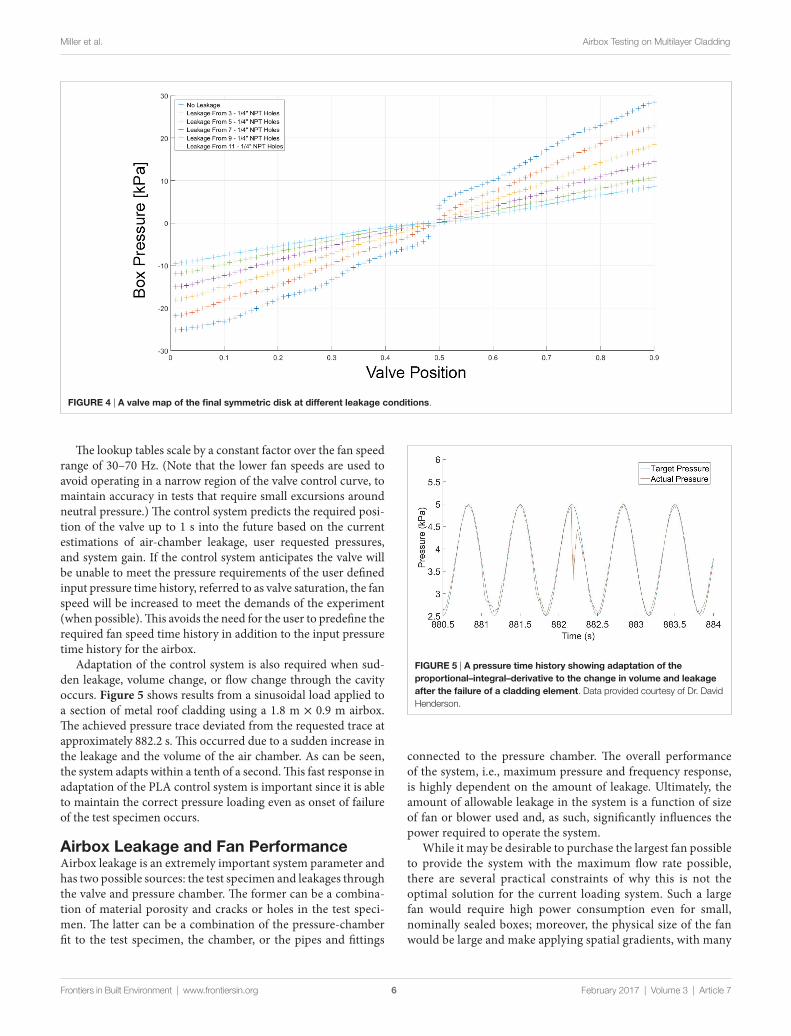
FigUre 5 | a pressure time history showing adaptation of the proportional–integral–derivative to the change in volume and leakage after the failure of a cladding element. Data provided courtesy of Dr. David Henderson.
FigUre 4 | a valve map of the final symmetric disk at different leakage conditions.
6
Miller et al. Airbox Testing on Multilayer Cladding
Frontiers in Built Environment | www.frontiersin.org February 2017 | Volume 3 | Article 7
The lookup tables scale by a constant factor over the fan speed range of 30–70 Hz. (Note that the lower fan speeds are used to avoid operating in a narrow region of the valve control curve, to maintain accuracy in tests that require small excursions around neutral pressure.) The control system predicts the required posi-tion of the valve up to 1 s into the future based on the current estimations of air-chamber leakage, user requested pressures, and system gain. If the control system anticipates the valve will be unable to meet the pressure requirements of the user defined input pressure time history, referred to as valve saturation, the fan speed will be increased to meet the demands of the experiment (when possible). This avoids the need for the user to predefine the required fan speed time history in addition to the input pressure time history for the airbox.
Adaptation of the control system is also required when sud-den leakage, volume change, or flow change through the cavity occurs. Figure 5 shows results from a sinusoidal load applied to a section of metal roof cladding using a 1.8 m × 0.9 m airbox. The achieved pressure trace deviated from the requested trace at approximately 882.2 s. This occurred due to a sudden increase in the leakage and the volume of the air chamber. As can be seen, the system adapts within a tenth of a second. This fast response in adaptation of the PLA control system is important since it is able to maintain the correct pressure loading even as onset of failure of the test specimen occurs.
airbox leakage and Fan PerformanceAirbox leakage is an extremely important system parameter and has two possible sources: the test specimen and leakages through the valve and pressure chamber. The former can be a combina-tion of material porosity and cracks or holes in the test speci-men. The latter can be a combination of the pressure-chamber fit to the test specimen, the chamber, or the pipes and fittings
connected to the pressure chamber. The overall performance of the system, i.e., maximum pressure and frequency response, is highly dependent on the amount of leakage. Ultimately, the amount of allowable leakage in the system is a function of size of fan or blower used and, as such, significantly influences the power required to operate the system.
While it may be desirable to purchase the largest fan possible to provide the system with the maximum flow rate possible, there are several practical constraints of why this is not the optimal solution for the current loading system. Such a large fan would require high power consumption even for small, nominally sealed boxes; moreover, the physical size of the fan would be large and make applying spatial gradients, with many

FigUre 6 | a graph of box pressure versus flow rate for the selected fan at different variable speed drive speeds, along with the manufacturer’s fan curve, demonstrating the effect of leakage on the pressure.
7
Miller et al. Airbox Testing on Multilayer Cladding
Frontiers in Built Environment | www.frontiersin.org February 2017 | Volume 3 | Article 7
pressure chambers in close proximity, more difficult. Finally, in order to accommodate the large flow rates, the size of the valve would also need to be increased so that the air velocity through the valve is kept to a minimum, and consequently the losses. The performance of the entire fan–valve–airbox (nominally sealed) was evaluated by using an orifice plate to measure the flow rate going into the airbox and measuring the achieved pressure. Leakage flow rates were obtained by creating controlled openings within the airbox. In addition, these tests were repeated at numerous fan frequencies ranging from 30 to 70 Hz. The results of these tests are shown in Figure 6. In addition to meeting other requirements such as physical size, the manufacturer’s fan curve for the chosen fan is shown in Figure 6. The fan combined with the tuned valve is capable of providing flow rates of up to 300 CFM at ~10 kPa and 100 CFM at 20 kPa at a fan speed of 60 Hz. However, as can be seen from the figure, the system does not need to run the fan at full speed, which leads to consequent changes in maximum pressures and flow rates. This, in turn, allows the total power consumption to be reduced in aggregate for an array of PLAs that are running different pressure traces.
To allow greater flexibility, the PLA loading system can be run in three different configurations depending on the application. The first configuration is the simplest where a single PLA unit is connected to a single chamber. The second configuration uses a single fan/blower connected to two independent valve and servo motors. Each valve is connected to its own box, with its own feedback pressure transducer allowing two airboxes to be controlled independently of each other using only a single fan. This configuration is ideal for small airboxes with minimal leak-age and has the advantage of reducing the power consumption of the system, along with reducing the per airbox capital cost of
the entire system. The third PLA configuration uses one airbox with multiple individual PLA units. Under this configuration, only the first PLA (leader unit) has a pressure transducer, and the remaining units mimic the valve movements of the leader exactly. Under this configuration, significantly higher flow rates can be realized while maintaining the performance characteris-tics required to simulate the real wind loads. This is the approach used for the vinyl siding tests discussed in Section “Test Case for Air-Permeable, Multilayer Cladding.”
TesT case FOr air-PerMeaBle, MUlTilaYer claDDing
Full-scale Pressure Measurements on Vinyl sidingRecent tests at the IBHS examined the loads on various siding systems using their full-scale wind tunnel (Cope et al., 2012, 2014; Morrison and Cope, 2015). Pressures were measured on the walls of a full-scale, single story wood-frame house with plan dimensions of 9.1 m (30 ft.) × 12.2 m (40 ft.), a mean roof height of approximately 3.7 m (12 ft.), and a roof slope of 4-on-12. The walls of the test building were 2.4 m (8 ft.) high and clad with 11.1 mm (7/16″) OSB. In the study done by Morrison and Cope (2015), a total of four siding products were tested: vinyl siding, foam backed vinyl siding, wood siding, and hardy board. In order to test all four products simultaneously the walls of the build-ing were divided into eight sub-wall assemblies. The long walls were divided in half resulting in a test wall 6.1 m (20 ft.) long, while the shorter walls extended 3.7 m (12 ft.) from the corner leaving 6 ft. in the center of the short wall to access the interior of the building. All siding products were installed following the

FigUre 7 | a graph showing a portion of the external pressure time history for each individual airbox.
8
Miller et al. Airbox Testing on Multilayer Cladding
Frontiers in Built Environment | www.frontiersin.org February 2017 | Volume 3 | Article 7
manufacturers guidelines; drywall was installed on the interior of the walls so that the wall assembly matched, as accurately as possible, real construction. Along the 6.1 m (20 ft.) walls, wind-induced pressures were measured at 16 locations, while along the 3.7 m (12 ft.) walls, they were measured at 12 locations. At each measurement location, the external pressure, the net pressure across the siding, and the net pressure across the OSB were meas-ured simultaneously. Experiments were conducted in an open exposure at four different wind speeds (Morrison et al., 2012). The orientation of the building to the wind was varied over a full 360° in 10° increments. The results of these tests indicate that pressure equalization has a significant effect on the outer layer of these systems. For example, results have shown that vinyl siding must carry a net load of up to 75–80% of the peak net load across the entire wall assembly. Given this 20–25% reduc-tion in loads, the IBHS results are substantially different than the results obtained using a single-partitioned pressure chamber or considered through ASTM D3679 (2013). This study is used to provide benchmark data for validating the multichamber pressure-loading approach using PLAs. In particular, Figure 7 shows segments of the measured external pressure time histories
at five locations along the wall from the IBHS experiments—it is these time histories that are applied in the multichamber tests described below.
Multichamber Pressure Test setupAs described in Section “The Multichamber, PLA Approach,” a new pressure-chamber system is required for testing air-permeable multilayer cladding systems. The main task is to ensure that the unloaded surfaces are minimized because of the importance of the external pressure gradients on setting the cavity pressure. In addition, the chamber walls should be (i) nominally airtight, so as to minimize the direct flows between chambers, (ii) flexible, so that the barriers have limited effects on the performance or deformations of the flexible cladding, (iii) strong enough to be robust through a range of test conditions, and (iv) easily installed and repeatable. After taking the mate-rial properties into consideration, a latex-barrier system was constructed. Small-scale testing showed that latex worked well in all of its required functions and, therefore, was implemented for the full-scale testing.
Since the objective was to replicate the IBHS results, test specimen was built with the same siding. These walls were 12 ft. long by 8 ft. high, with 2-by-4s used as the studs. The sheathing was 3/4″ plywood; however, a polyurethane sheet was placed in between the studs and the plywood to seal the pressure chamber, which is slightly different in setup compared to the IBHS tests, but which ensures that leakage between the pressure chamber to the atmosphere was minimized. House wrap was then placed over the plywood to replicate typical construction practice, since the focus of the study is the net loads on the outer (i.e., vinyl siding) layer. Pressure taps were then installed through the plywood and house wrap at the same locations as for the IBHS wall. Vinyl siding was installed on to the wall using appropriate nails at 16″ intervals along the length of the wall. All pieces of vinyl siding were cut to be 12 ft. long in order to not have any lap splices in the test chamber. Starter strips, ending strips, and utility trim were also used to model typical construction practice. The test wall could then be placed in a rigid-sided chamber of slightly larger dimensions than the test wall, which in this case is the same chamber used by Gavanski and Kopp (2011b).
Five chambers were created within the airbox for this test by placing four latex barriers within the larger rigid box. These five chambers coincided with the pressure tap layout from the IBHS tests: four of the chambers were 2 ft. long, with one being 4 ft. long. All latex barriers ran vertically across the siding, as can be seen in Figure 8, which presumes that the primary external gradient was along the length of the wall. This is a reasonable approximation for the side walls when they are under suction, although further work is needed to examine the effects of these gradients. In the current case, with five pressure time histories available, five pressure chambers are used. These data were obtained from the IBHS experiments, as depicted in Figure 7. [Regarding the effects of pressure gradients and the use of one set of pressure time histories, as discussed in Bienkiewicz and Sun (1997) and Oh and Kopp (2014), and shown below, the pres-sure gradient is clearly one of the governing parameters of the

FigUre 9 | Measured differential pressure time histories under (a) uniform and (B) gradient external pressures.
FigUre 8 | a photograph showing the latex-barrier system, creating separate airboxes attached to a vinyl siding specimen.
9
Miller et al. Airbox Testing on Multilayer Cladding
Frontiers in Built Environment | www.frontiersin.org February 2017 | Volume 3 | Article 7
net wind loads on air-permeable cladding elements, with high net loads being associated with high-pressure gradients. Due to this, further work is required to determine both appropriate design pressure gradients and the resulting number of required pressure chambers to obtain sufficient accuracy in the tests. This will involve additional wind tunnel testing to examine how the pressure gradients and pressure time histories change with overall building geometry and terrain conditions, compared to the single test case from IBHS.]
resUlTs anD DiscUssiOn
The primary objective of the current tests is to determine whether multichamber pressure tests are capable of assessing net pressures on an air-permeable cladding system. This is done by applying the IBHS measurements of external pressures through the PLA system and measuring the resulting PEF. Figure 9 shows a plot of a segment of the resulting time histories of the differential pressures across the cladding layer (i.e., the vinyl siding) for two cases: one with the external pressures from IBHS data (see Figure 7 above) and one with spatially uniform pressures at each location. For the latter case, the pressure time history with the largest peak external pressure from the IBHS data was repeated identically in all five chambers. The different colors represent the differential pressures, pd, in each separate airbox,
p p pd e c= − ,
where pe is the external pressure coefficient and pc is the cav-ity pressure coefficient. The five curves are overlaid on top of each other to determine the minimum (i.e., largest magnitude) observed differential pressure. The PEF is defined as
PEF external cavity
external
xP x P x
P( ) = ( ) − ( )
,
where P xexternal ( ) and P xcavity ( ) represent the external and cavity pressures, respectively, at the location on the wall and Pexternal is
the peak external pressure across the entire wall. [Note that in these experiments there should be negligible flow or pressure transferred from the interior of the wall because the house wrap provides a sealing layer. Thus, the net pressure over the assembly from the outside (siding) layer to the sealed layer is equal to the external pressure. For this reason, we use the external pressure instead of the net wall pressure in the definition of the PEF.] The data in Figure 9 indicate that the peak differential pres-sures across the siding layer are about 350 Pa, while the peak external pressures are about 400 Pa. Thus, under fluctuating, spatially varying pressures, the reduction of the largest net pressure to the largest external pressure is about 12%, leading to an approximate peak PEF of 0.88. This result is substantially different when compared with the data obtained from uniform, but time-varying, external pressures, where the largest peak differential pressure across the siding layer is about 40 Pa. Thus, under fluctuating uniform pressures, the net reduction relative to the peak external pressure is about 90%. This result is consistent with the findings of Gavanski and Kopp (2012) but leads to an even larger reduction than that used in ASTM D3679-13 [although it is reasonably consistent with the data obtained from the study performed by Architectural Testing, Inc. (2002) who obtained PEFs between 0.03 and 0.18]. These results definitively show that the spatial pressure gradient is a critical parameter for the process of pressure equalization and neglecting it leads to highly erroneous loads for these types of cladding systems.

FigUre 11 | Pressure equalization factor as a function of time for a sudden change of the pressure with time, including external spatial pressure gradients.
FigUre 10 | Measured pressure equalization factor, normalized by the peak external pressure from the (a) insurance institute for Business and home safety wind tunnel and the (B) current multichamber pressure tests.
10
Miller et al. Airbox Testing on Multilayer Cladding
Frontiers in Built Environment | www.frontiersin.org February 2017 | Volume 3 | Article 7
Figure 10 presents a comparison of the PEFs from the IBHS full-scale wind tunnel experiments and the current multicham-ber pressure-based experiments. As with the previous plots, the different colors represent the PEF in each chamber, with the colors from the two experiments matched. Between the two results, the multichamber airbox results seem to be deviating less from the mean. This is most likely because, although this new method of multichamber airbox testing is a step forward in the accuracy of the net pressure on cladding elements due to the application of spatial gradients, the spatial gradients being applied are still highly simplified. Due to limited tap resolution from IBHS, there may be subtle differences in the spatial distri-bution between tap locations that were not captured in original testing and which are made uniform within each airbox in the current tests.
The PLA system was able to simulate the applied external pres-sure time histories from IBHS results, with minor smoothing of the peak pressures. Recent model scale testing of multilayer roof systems suggests that the short duration, localized peak pressures control the cavity pressure, and the resulting net wind loads, to a significant extent (Oh and Kopp, 2014). This will have some effect on the results, but as shown in Figure 10, the distributions of the PEF values are similar, even with the minor smoothing of peak pressures. In fact, the PEF values are higher during the multichamber airbox testing, when compared to the IBHS wind tunnel experiments. In addition, further research is needed to
define the number of pressure chambers actually required, along with analysis of data to determine design pressure gradients to go with the peak pressures.
To determine whether a static, multichamber pressure test may be useful for a test standard, the external pressures at the moment that caused the peak PEF in Figure 10 were applied (i.e., all temporal variations were eliminated except for the rapid change in external pressure from 0 to the target values). Figure 11 shows the resultant PEF value, plotted against time. The results of this test show that the largest steady-state PEF is slightly larger than that obtained in the dynamic tests (Figure 9), although it is only about 5% higher. This suggests that static, but multichamber, pressure tests are feasible for a test standard so that the complexity of using the PLA system may not be required in standardized product tests. Interestingly, the temporal gradient of the rapidly changing pressure in the test caused a temporary increase of the maximum PEF in two of the five pressure chambers, which, considering that the PEF in the dynamic test is due to peak pressures that also had rapid variations, indicates there is a complexity in the temporal aspects of pressure equalization, as found by Oh and Kopp (2014). In the present case, having the pressures jump from 0 to their final values, the magnitude of the load was only altered by about 10% compared to the final steady values.
cOnclUsiOn
An experimental study was conducted to determine whether multichamber airbox testing is feasible for assessing wind loads on air-permeable, multilayer cladding systems. Although there is airflow between individual airboxes and uncontrolled volume changes caused by shared barriers for the pressure chambers creating complications for the PLA control system, the concept of creating a multichamber, pressure-based, testing apparatus that can accurately obtain wind loads for air-permeable, multilayer wall systems with flexible clad-ding has been shown to work. This was accomplished by (i) the creation of multiple flexible latex barriers to enable the

11
Miller et al. Airbox Testing on Multilayer Cladding
Frontiers in Built Environment | www.frontiersin.org February 2017 | Volume 3 | Article 7
application of multiple, discreet, time-varying loads across a test specimen, (ii) the development of linearized five-port, flow-reversing valve, in conjunction with (iii) an adaptive PID control strategy. Using this multichamber pressure loading system together with external pressure data obtained at the full-scale IBHS wind tunnel, cavity pressures and PEFs were found to match the full-scale results reasonably well. The results confirm the conclusion of Cope et al., (2012) that the PEF in ASTM D3679-13 is unconservative. The good news is that static multichamber-based pressure tests are able to capture the important features of pressure equalization. Further work is required to create an improved test standard, particularly with respect to the minimum number of pressure chambers which may be required and setting the design pressure gradient or pressure pattern, neither of which were examined herein. Future work will examine these issues.
aUThOr cOnTriBUTiOns
CM is a Ph.D. student under the supervision of GAK, and this research is a portion of what will become CM’s doctoral thesis. The experiments and approach were designed collaboratively
by the authors. The manuscript was written collaboratively; CM wrote the first draft. The experiments and the direct analysis of the experimental data were conducted by CM, with direct input from GAK. MM contributed information from the full-scale testing at IBHS. GK and ND contributed information about the development of the PLA system.
acKnOWleDgMenTs
This work is dedicated to the memory of Mr. Geoffrey Robson, who made significant contributions to development of the PLA control system. Funding provided by the Institute for Catastrophic Loss Reduction (ICLR) and the Natural Sciences and Engineering Research Council (NSERC) of Canada under the Collaborative Research and Developed Program is gratefully acknowledged. The ongoing support and encouragement for our work provided by Mr. Paul Kovacs of ICLR is gratefully acknowledged. Some equipment was developed under funding from the Canada Foundation for Innovation. The authors also wish to acknowl-edge the many contributions to the development of the PLAs and PLA-based testing methodologies by Drs. Marek Myszko, David Henderson, and Eri Gavanski.
reFerences
American Society for Civil Engineering. (2006). ASCE 7-05: Minimum Design Loads for Buildings and Other Structures. Reston, VA: American Society for Civil Engineering.
Architectural Testing, Inc. (2002). Wind Pressure Equalization Research Project Report. No. 01-40776.01 for the Vinyl Siding Institute. Washington, DC: Architectural Testing, Inc.
ASTM D3679. (2013). Standard Specification for Rigid Poly (Vinyl Chloride) (PVC) Siding. West Conshohocken, PA: ASTM International. Available at: www.astm.org
ASTM D5206. (2013). Standard Test Method for Windload Resistance of Rigid Plastic Siding. West Conshohocken, PA: ASTM International. Available at: www.astm.org
ASTM E1300. (2012). Standard Practice for Determining Load Resistance of Glass in Buildings. West Conshohocken, PA: ASTM International. Available at: www.astm.org
ASTM E1592. (2012). Standard Test Method for Structural Performance of Sheet Metal Roof and Siding Systems by Uniform Static Air Pressure Difference. West Conshohocken, PA: ASTM International. Available at: www.astm.org
Bienkiewicz, B., and Sun, Y. (1997). Wind loading and resistance of loose-laid roof paver systems. J. Wind Eng. Ind. Aerodyn. 72, 401–410. doi:10.1016/s0167-6105(97)00235-3
Cook, N. J., Keevil, A. P., and Stobart, R. K. (1988). Brerwulf – the big bad wolf. J. Wind Eng. Ind. Aerodyn. 29, 99–107. doi:10.1016/0167-6105(88)90149-3
Cope, A. D., Crandell, J. H., Johnston, D., Kochkin, V., Liu, Z., Stevig, L., et al. (2012). “Wind loads on components of multi-layer wall systems with air-per-meable exterior cladding,” in Proceedings of the ATC-SEI Advances in Hurricane Engineering Conference, Miami, FL.
Cope, A. D., Crandell, J. H., Liu, Z., and Stevig, L. (2014). Wind loads on fasteners used to attach flexible porous siding on multi-layer wall systems. J. Wind Eng. Ind. Aerodyn. 133, 150–159. doi:10.1016/j.jweia.2014.06.007
Gavanski, E., and Kopp, G. A. (2011a). Glass breakage tests under fluctuating wind loads. J. Arch. Eng. 17, 34–41. doi:10.1061/(asce)ae.1943-5568.0000028
Gavanski, E., and Kopp, G. A. (2011b). Examination of load resistance in win-dow glass design. J. Arch. Eng. 17, 42–50. doi:10.1061/(asce)ae.1943-5568. 0000030
Gavanski, E., and Kopp, G. A. (2012). Effects of pressure equalization on the performance of residential wall systems under extreme wind loads. J. Struct. Eng. 138, 526–538. doi:10.1061/(asce)st.1943-541x.0000476
Gurley, K. R., and Masters, F. J. (2011). Post-2004 hurricane field survey of residential building performance. Nat. Haz. Rev. 12, 177–183. doi:10.1061/(asce)nh.1527-6996.0000044
Henderson, D. J., Williams, C., Gavanski, E., and Kopp, G. A. (2013a). Failure mechanisms of roof sheathing under fluctuating wind loads. J. Wind Eng. Ind. Aerodyn. 114, 27–37. doi:10.1016/j.jweia.2013.01.002
Henderson, D. J., Morrison, M. J., and Kopp, G. A. (2013b). Response of toe-nailed, roof-to-wall connections to extreme wind loads in a full-scale, timber-framed, hip roof. Eng. Struct. 56, 1474–1483. doi:10.1016/j.engstruct. 2013.07.001
Kopp, G. A., Morrison, M. J., Gavanski, E., Henderson, D., and Hong, H. P. (2010). The ‘three little pigs’ project: hurricane risk mitigation by integrated wind tunnel and full-scale laboratory tests. Nat. Hazards Rev. 11, 151–161. doi:10.1061/(asce)nh.1527-6996.0000019
Kopp, G. A., Morrison, M. J., and Henderson, D. J. (2012). Full-scale testing of low-rise, residential buildings with realistic wind loads. J. Wind Eng. Ind. Aerodyn. 10, 25–39. doi:10.1016/j.jweia.2012.01.004
Kumar, K. (2000). Pressure equalization of rainscreen walls: a critical review. Build. Environ. 35, 161–179. doi:10.1016/s0360-1323(9)00015-3
Mooneghi, M., Irwin, P., and Chowdhury, A. G. (2014). Large-scale testing on wind uplift of roof pavers. J. Wind Eng. Ind. Aerodyn. 128, 22–36. doi:10.1016/j.jweia.2014.03.001
Morrison, M. J., and Cope, A. D. (2015). “Wind performance and evaluation methods of multi-layered wall assemblies,” in Proceeding of ASCE Structures Congress, Portland, OR.
Morrison, M. J., Henderson, D. J., and Kopp, G. A. (2012). The response of a wood-frame, gable roof to fluctuating wind loads. Eng. Struct. 41, 498–509. doi:10.1016/j.engstruct.2012.04.002
Oh, J. H., and Kopp, G. A. (2014). Modelling of spatially and temporally-varying cavity pressures in air permeable, double-layer roof systems. Build. Environ. 82, 135–150. doi:10.1016/j.buildenv.2014.08.008
Sinno, R., Surry, D., Flower, S., and Ho, E. (2003). “Testing of metal roofing systems under simulated realistic wind loads,” in Proceedings of the Eleventh International Conference on Wind Engineering, Lubbock, TX.
Sparks, P. R., Schiff, S. D., and Reinhold, T. A. (1994). Wind damage to envelopes of houses and consequent insurance losses. J. Wind Eng. Ind. Aerodyn. 53, 145–155. doi:10.1016/0167-6105(94)90023-x
Sun, Y., and Bienkiewicz, B. (1993). Numerical simulation of pressure distributions underneath roofing paver systems. J. Wind Eng. Ind. Aerodyn. 4, 517–626. doi:10.1016/0167-6105(93)90319-j

12
Miller et al. Airbox Testing on Multilayer Cladding
Frontiers in Built Environment | www.frontiersin.org February 2017 | Volume 3 | Article 7
Surry, D., Sinno, R. R., Nail, B., Ho, T. C., Farquhar, S., and Kopp, G. A. (2007). Structurally effective static wind loads for roof panels. J. Struct. Eng. 133, 871–885. doi:10.1061/(asce)0733-9445(2007)133:6(871)
Conflict of Interest Statement: The authors declare that the research was con-ducted in the absence of any commercial or financial relationships that could be construed as a potential conflict of interest.
Copyright © 2017 Miller, Kopp, Morrison, Kemp and Drought. This is an open- access article distributed under the terms of the Creative Commons Attribution License (CC BY). The use, distribution or reproduction in other forums is permitted, provided the original author(s) or licensor are credited and that the original publication in this journal is cited, in accordance with accepted academic practice. No use, distribution or reproduction is permitted which does not comply with these terms.