a multiple deficit model of adhd - aidai · pdf filea multiple deficit model of adhd ... the...
TRANSCRIPT
A Multiple Deficit Model of ADHD
Bruce F. Pennington
Supported by NIH (HD-27802 and HD-049027)

Collaborators
Colorado Learning Disability Research Center (CLDRC)
Erik Willcutt Co-PI on ADHD Project
Dick Olson PI of CLDRC
John DeFries “Father” of CLDRC
Shelley Smith My longtime genetics collaborator
Jan Keenan Co-PI of Reading and Language project
Graduate Students and Post-Docs
Michelle Shanahan
Holly Barnard
Lauren McGrath
Laura Santerre-Lemmon
Cinnamon Bidwell at CU-Boulder
Cynthia Hartung now on faculty at University of Wyoming
OutlineI Single Deficit Models of ADHD
A. Executive Inhibition
B. State Regulation
C. Delay Aversion
II Why Single Deficit Models Fail
A. Review of Executive Inhibition Model: Inhibition deficit is associated, coheritable, but not pervasive in ADHD
B. Tests of Motivational Effects
1. Motivational Inhibition Tasks
2. Manipulating Incentives on the Stop Task
3. Delay Aversion
4. Orbital Frontal Tasks: Object Reversal and Gambling
III What is the Multiple Deficit Model?
IV Multiple Deficit Model Applied to Comorbidity of ADHD and RD
A. ADHD and RD have a genetic overlap
B. ADHD and RD have a cognitive overlap
V. Conclusions
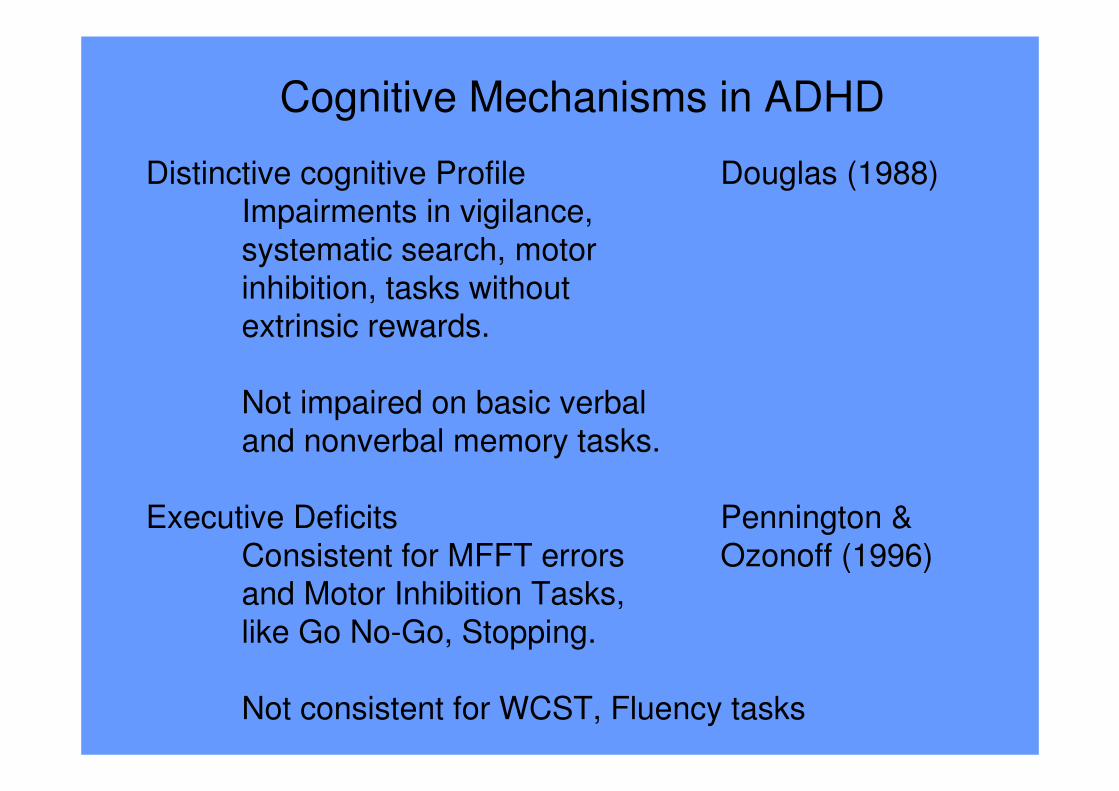
Cognitive Mechanisms in ADHD
Distinctive cognitive Profile Douglas (1988)Impairments in vigilance,
systematic search, motor
inhibition, tasks without extrinsic rewards.
Not impaired on basic verbal
and nonverbal memory tasks.
Executive Deficits Pennington &
Consistent for MFFT errors Ozonoff (1996)and Motor Inhibition Tasks,
like Go No-Go, Stopping.
Not consistent for WCST, Fluency tasks

The Frontal Hypothesis in ADHD
Frontal Lobe Dysfunction
Pontius (1973)
Rosenthal & Allen (1978)
Stamm & Kreder (1979)
Gualtieri & Hicks (1985)
Zametkin & Rapaport (1986)
Mattes (1989)
Executive Dysfunction
Douglas (1983)
Conners & Wells (1986)
Pennington (1991)
Schachar, Tannock, & Logan (1993)
Pennington & Ozonoff (1996)
Barkley (1997)
Nigg (2000)

Executive Inhibition Hypothesis
Key Idea: The PFC-mediated process of voluntary motor inhibition is impaired in ADHD.
Marker task: Stopping task (Logan, Cowan & Davis, 1984)
Fundamental Questions:
1) Inhibition deficits are found in other disorders.
2) If someone fails to inhibit, is it because top-down control is too weak, or because bottom-up impulses are too strong, or both?

State Regulation Models of ADHDSergeant & van der Meere (1990)
Douglas (1989)
Key Idea: In contrast to executive inhibition model, holds that core problem is in maintaining optimal state for task. For instance, manipulation of event rate can lessen inhibition deficits.
Marker tasks: Reaction time (RT) and RT variability (SDRT)
Fundamental Questions:
1) Slower and more variable RTs are pervasive in developmental disabilities.
2) Neuroimaging studies of RT and SDRT implicate PFC.
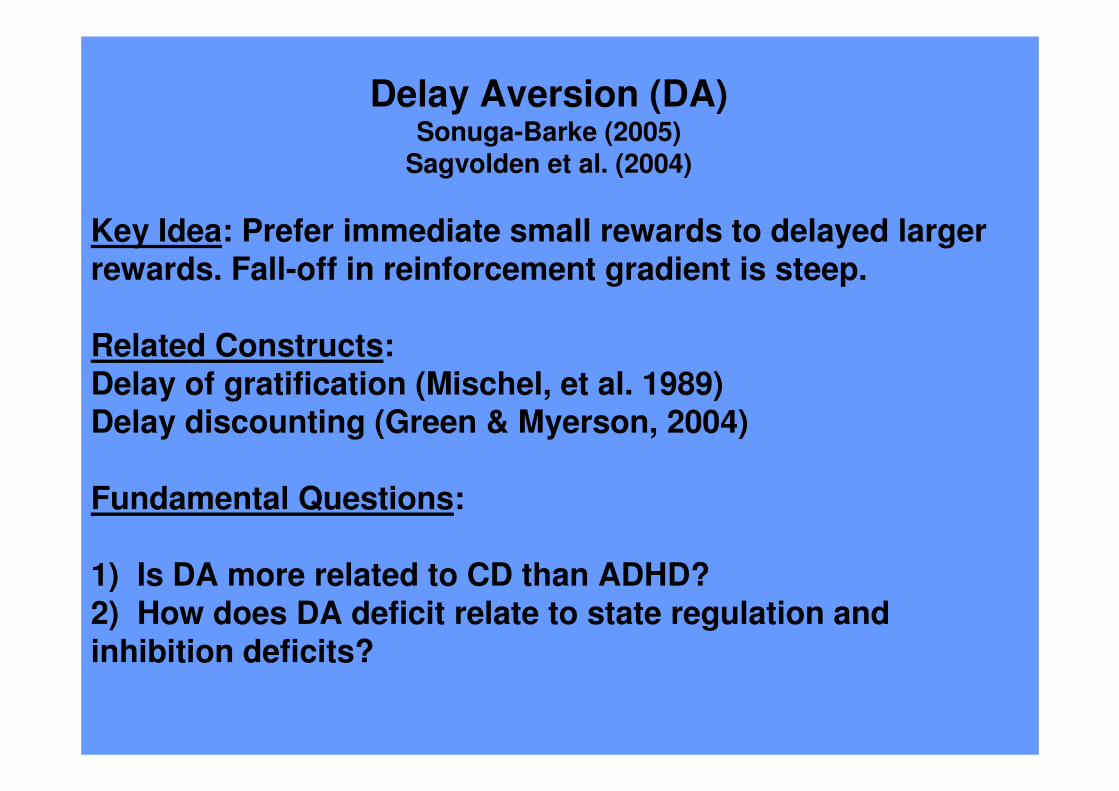
Delay Aversion (DA)Sonuga-Barke (2005)
Sagvolden et al. (2004)
Key Idea: Prefer immediate small rewards to delayed larger rewards. Fall-off in reinforcement gradient is steep.
Related Constructs: Delay of gratification (Mischel, et al. 1989)Delay discounting (Green & Myerson, 2004)
Fundamental Questions:
1) Is DA more related to CD than ADHD? 2) How does DA deficit relate to state regulation and inhibition deficits?

Delay Discounting(Green & Myerson, 2004)

Five criteria that must be met for EF weaknesses to be considered
the core deficit of ADHD
I. Groups with ADHD must exhibit weaknesses on EF measures.
II. The group deficit must remain significant after controlling for IQ
and symptoms of other disorders.
III. The group EF deficit must explain a large proportion of the variance
in ADHD symptoms.
IV. EF weaknesses must be present in most individuals with ADHD,
and absent in most individuals without ADHD.
V. EF weaknesses must be due to the same genes as ADHD.
The EF theory of ADHD
A core EF deficit is necessary and sufficient to cause ADHD
(usually referring to the combined type)

Meta-analysis of EF and ADHD (Willcutt, Brodsky, et al., 2005; Willcutt, Doyle, Nigg, Faraone, & Pennington, 2005)
• One key measure of each core EF domain was identified
� Inhibition: Stop-signal Reaction Time (25 studies)
� Set shifting: Wisconsin Card Sort perseverative errors (25 studies)
� Verbal working memory: sentence span (3 studies) and digits backward (6)
� Planning: Tower of Hanoi / London (12 studies)
� Interference Control: Clinical Stroop (9 studies)
� Executive Processing Speed: Trailmaking Test Part B (13 studies)
• 100 new studies of EF measures have been published since the
review by Pennington and Ozonoff (1996)
• 65 studies that administered at least one of these six measures
were included (most studies combined type only)
• Total N = 3,374 with ADHD and 2,969 without ADHD

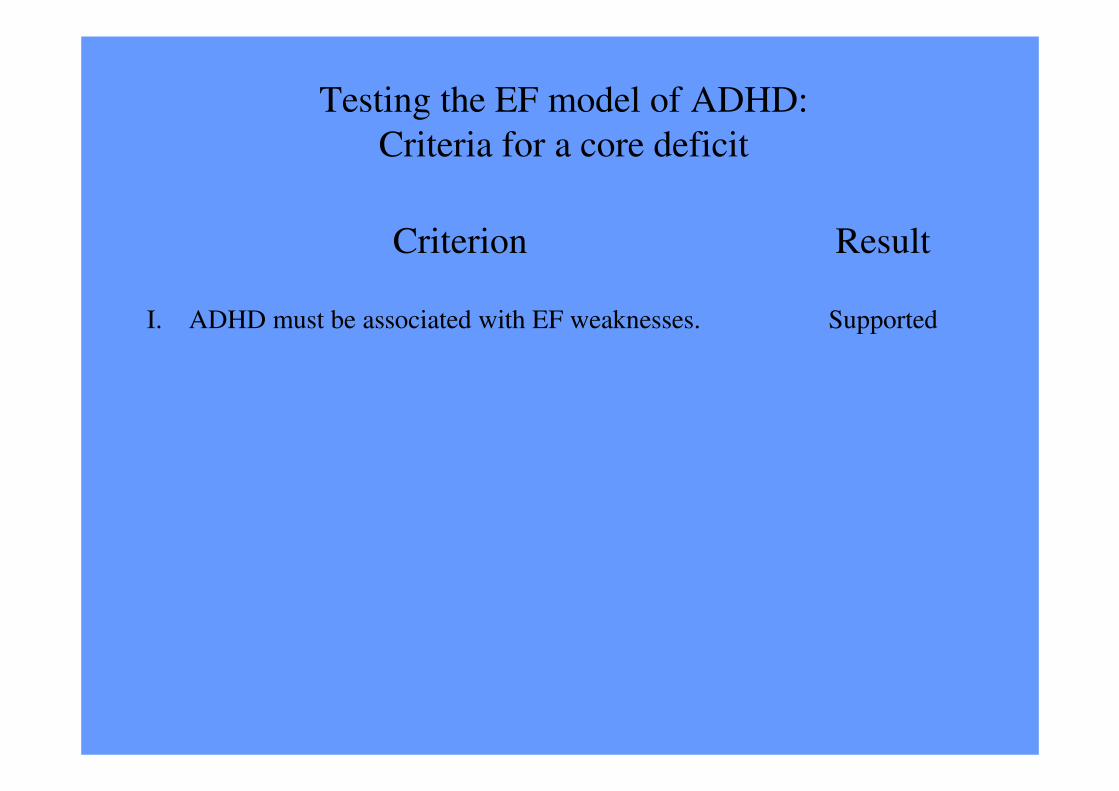
Testing the EF model of ADHD:
Five Criteria for a core deficit
ResultCriterion
I. ADHD must be associated with EF weaknesses.
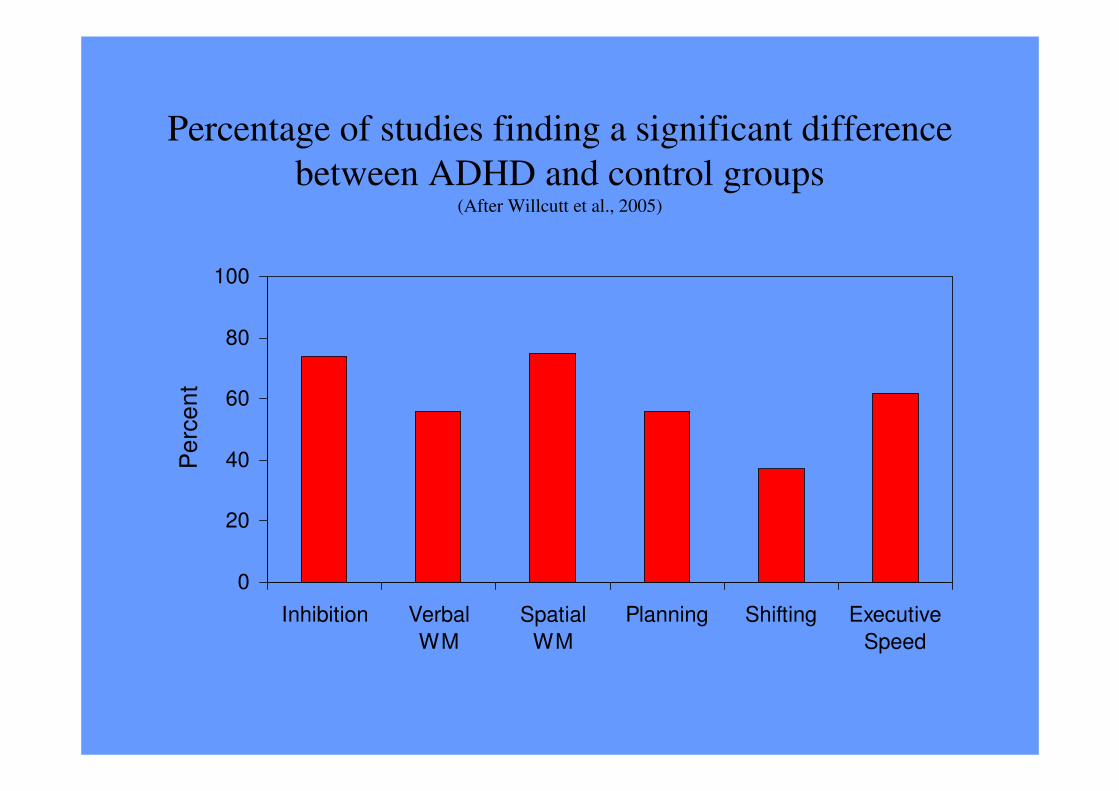
Percentage of studies finding a significant difference
between ADHD and control groups(After Willcutt et al., 2005)
0
20
40
60
80
100
Inhibition Verbal
WM
Spatial
WM
Planning Shifting Executive
Speed
Pe
rce
nt
Testing the EF model of ADHD:
Criteria for a core deficit
ResultCriterion
SupportedI. ADHD must be associated with EF weaknesses.

Testing the EF model of ADHD:
Criteria for a core deficit
ResultCriterion
SupportedII. EF weaknesses must not be explained by group
differences in IQ or comorbid symptoms.
SupportedI. ADHD must be associated with EF weaknesses.

Testing the EF model of ADHD:
Criteria for a core deficit
ResultCriterion
III. The EF deficit must be large enough to be a core
deficit.
SupportedII. EF weaknesses must not be explained by group
differences in IQ or comorbid symptoms.
SupportedI. ADHD must be associated with EF weaknesses.
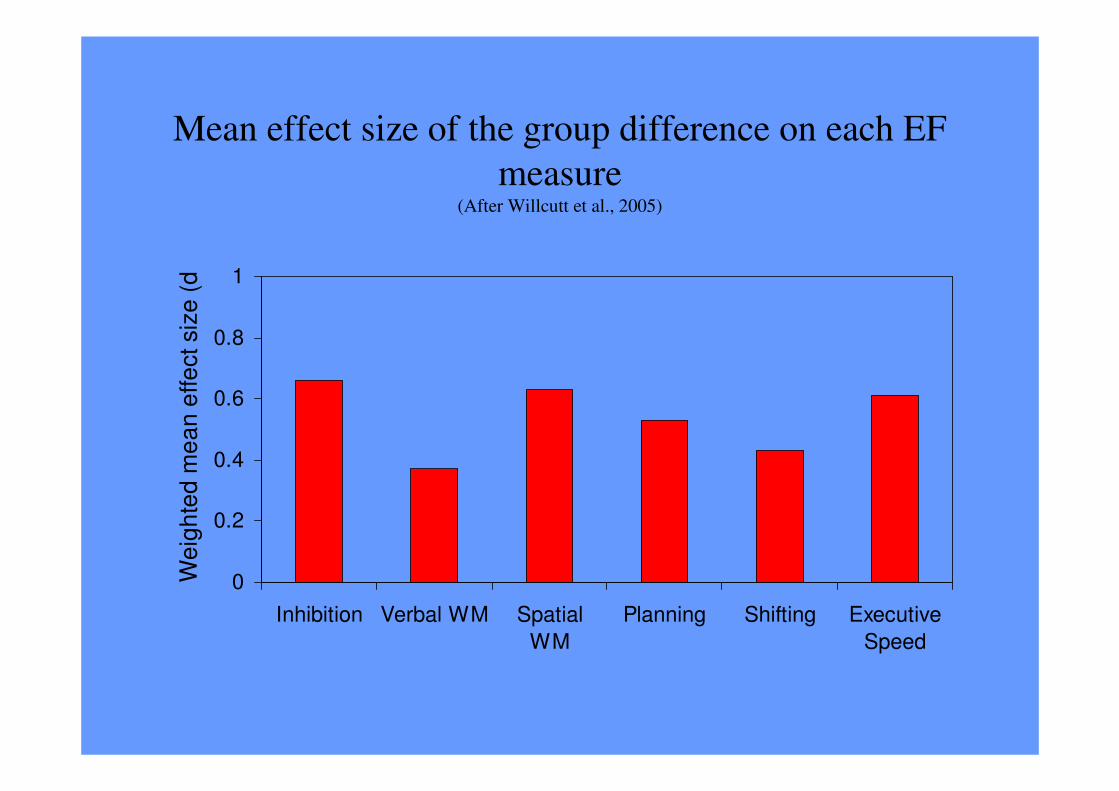
Mean effect size of the group difference on each EF
measure(After Willcutt et al., 2005)
0
0.2
0.4
0.6
0.8
1
Inhibition Verbal WM Spatial
WM
Planning Shifting Executive
Speed
We
igh
ted
me
an
effe
ct siz
e (
d)
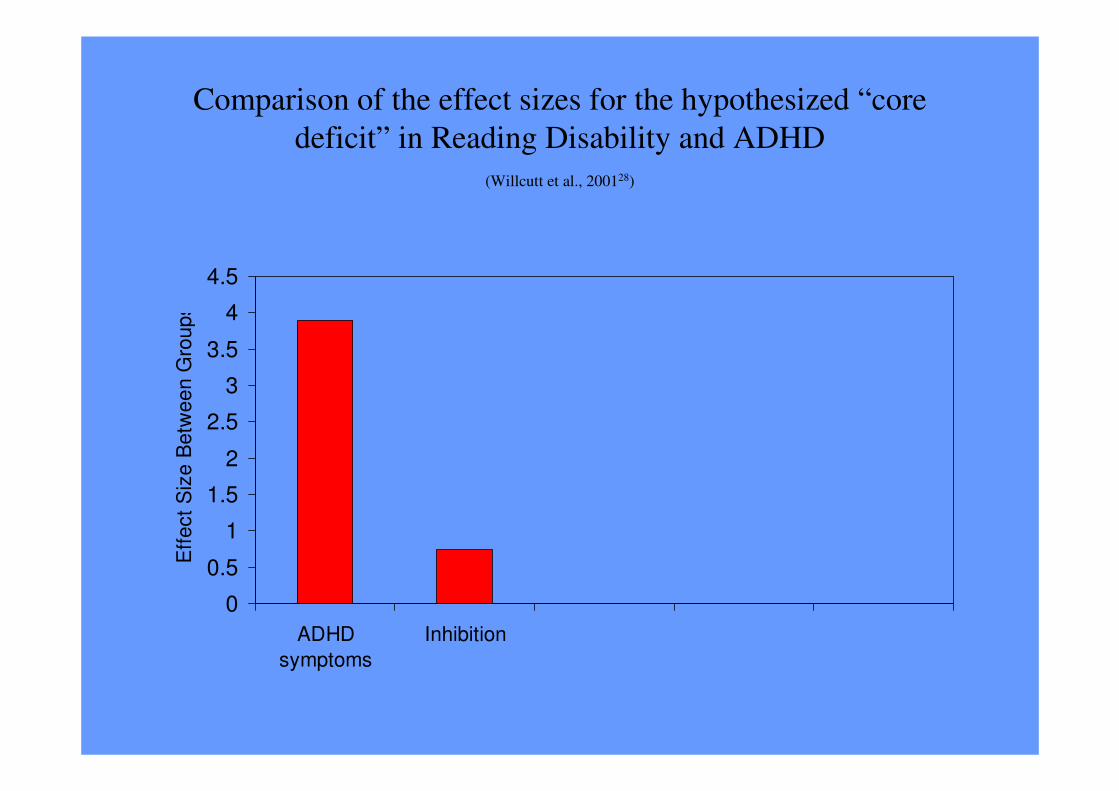
Comparison of the effect sizes for the hypothesized “core
deficit” in Reading Disability and ADHD
(Willcutt et al., 200128)
0
0.5
1
1.5
2
2.5
3
3.5
4
4.5
ADHD
symptoms
Inhibition
Eff
ect
Siz
e B
etw
ee
n G
roup
s

0
0.5
1
1.5
2
2.5
3
3.5
4
4.5
ADHD
symptoms
Inhibition Reading
Achievement
Phoneme
Awareness
Eff
ect
Siz
e B
etw
ee
n G
roup
s
Comparison of the effect sizes for the hypothesized “core
deficit” in Reading Disability and ADHD
(Willcutt et al., 2001)

Testing the EF model of ADHD:
Criteria for a core deficit
ResultCriterion
Not SupportedIII. The EF deficit must be large enough to be a core
deficit.
SupportedII. EF weaknesses must not be explained by group
differences in IQ or comorbid symptoms.
SupportedI. ADHD must be associated with EF weaknesses.

Testing the EF model of ADHD:
Criteria for a core deficit
ResultCriterion
IV. EF deficits must be present in most individuals with
ADHD and absent in most individuals without
ADHD.
Not SupportedIII. The EF deficit must be large enough to be a core
deficit.
SupportedII. EF weaknesses must not be explained by group
differences in IQ or comorbid symptoms.
SupportedI. ADHD must be associated with EF weaknesses.
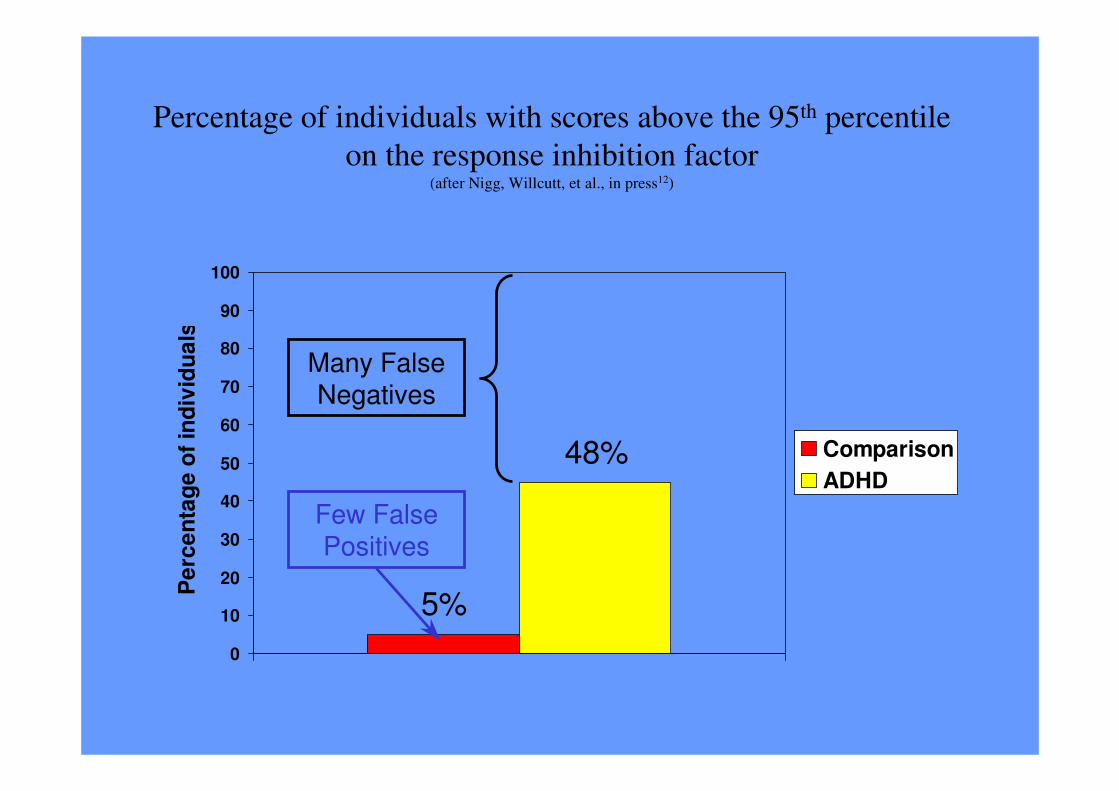
Percentage of individuals with scores above the 95th percentile
on the response inhibition factor(after Nigg, Willcutt, et al., in press12)
0
10
20
30
40
50
60
70
80
90
100
Pe
rce
nta
ge
of
ind
ivid
ua
ls
Comparison
ADHD
5%
48%
Few False Positives
Many False Negatives

Testing the EF model of ADHD:
Criteria for a core deficit
ResultCriterion
Not supported
Supported
IV. EF deficits must be present in most with ADHD and
absent in most without ADHD.
Not SupportedIII. The EF deficit must be large enough to be a core
deficit.
SupportedII. EF weaknesses must not be explained by group
differences in IQ or comorbid symptoms.
SupportedI. ADHD must be associated with EF weaknesses.

Testing the EF model of ADHD:
Criteria for a core deficit
ResultCriterion
V. EF deficits must be co-heritable with ADHD
Not supported
Supported
IV. EF deficits must be present in most with ADHD and
absent in most without ADHD.
Not SupportedIII. The EF deficit must be large enough to be a core
deficit.
SupportedII. EF weaknesses must not be explained by group
differences in IQ or comorbid symptoms.
SupportedI. ADHD must be associated with EF weaknesses.
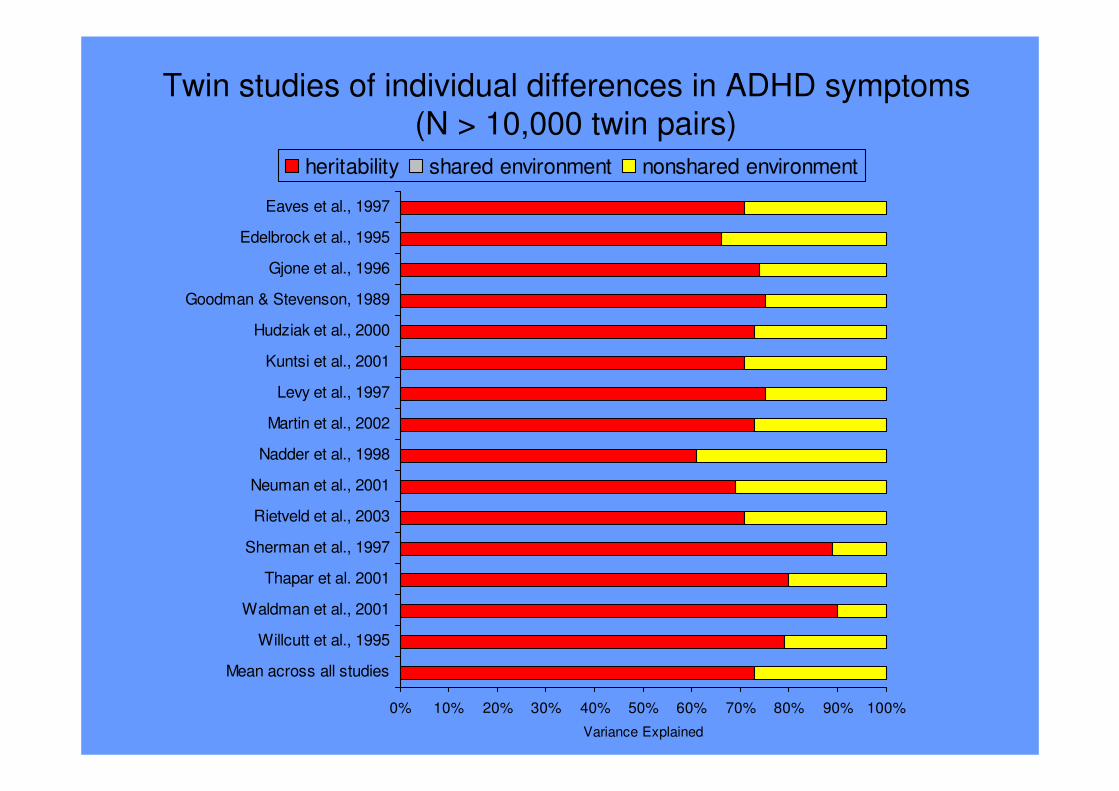
0% 10% 20% 30% 40% 50% 60% 70% 80% 90% 100%
Mean across all studies
Willcutt et al., 1995
Waldman et al., 2001
Thapar et al. 2001
Sherman et al., 1997
Rietveld et al., 2003
Neuman et al., 2001
Nadder et al., 1998
Martin et al., 2002
Levy et al., 1997
Kuntsi et al., 2001
Hudziak et al., 2000
Goodman & Stevenson, 1989
Gjone et al., 1996
Edelbrock et al., 1995
Eaves et al., 1997
Variance Explained
heritability shared environment nonshared environment
Twin studies of individual differences in ADHD symptoms(N > 10,000 twin pairs)
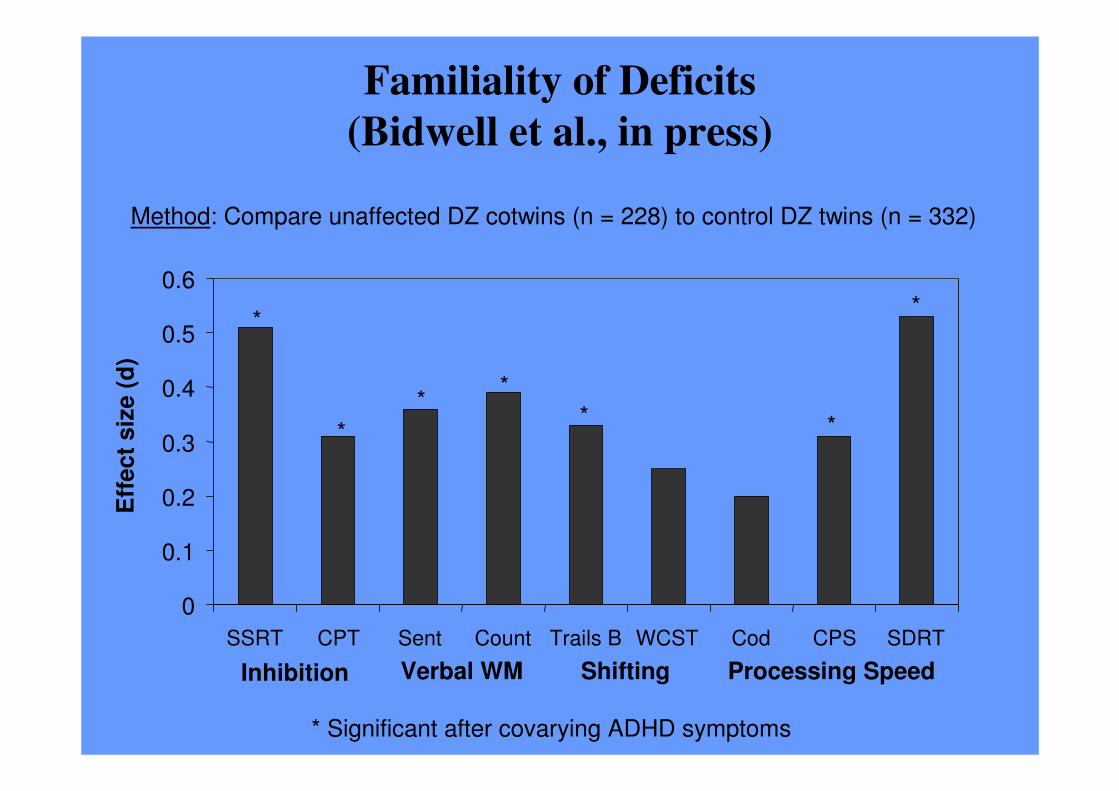
* Significant after covarying ADHD symptoms
Familiality of Deficits
(Bidwell et al., in press)
Method: Compare unaffected DZ cotwins (n = 228) to control DZ twins (n = 332)
Eff
ect
siz
e (
d)
*
*
**
* *
*
Inhibition Verbal WM Shifting Processing Speed
0
0.1
0.2
0.3
0.4
0.5
0.6
SSRT CPT Sent Count Trails B WCST Cod CPS SDRT
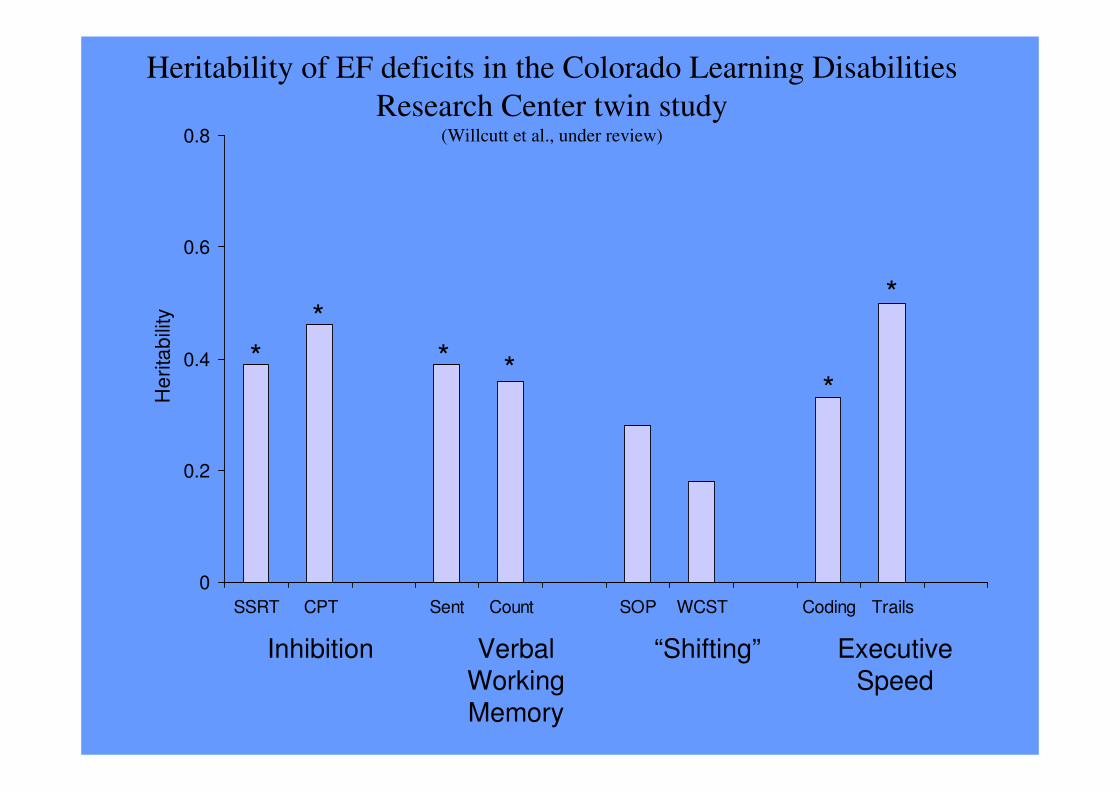
Heritability of EF deficits in the Colorado Learning Disabilities
Research Center twin study(Willcutt et al., under review)
0
0.2
0.4
0.6
0.8
SSRT CPT Sent Count SOP WCST Coding Trails
He
rita
bili
ty
Inhibition Verbal Working Memory
Executive Speed
“Shifting”
*
*
***
*

Bivariate heritability of ADHD symptoms and EF factor scores
0
0.2
0.4
0.6
Inhibition Verbal WM Shifting Executive Speed
Biv
ari
ate
he
rita
bili
ty
DSM-IV inattention DSM-IV hyperactivity-impulsivity
**
*
*

Testing the EF model of ADHD:
Criteria for a core deficit
ResultCriterion
Supported, but
small common
genetic effect
V. EF deficits must be co-heritable with ADHD
Not supported
Supported
IV. EF deficits must be present in most with ADHD and
absent in most without ADHD.
Not SupportedIII. The EF deficit must be large enough to be a core
deficit.
SupportedII. EF weaknesses must not be explained by group
differences in IQ or comorbid symptoms.
SupportedI. ADHD must be associated with EF weaknesses.

Did diagnostic heterogeneity attenuate the effect?
Why didn’t we find a core EF deficit?
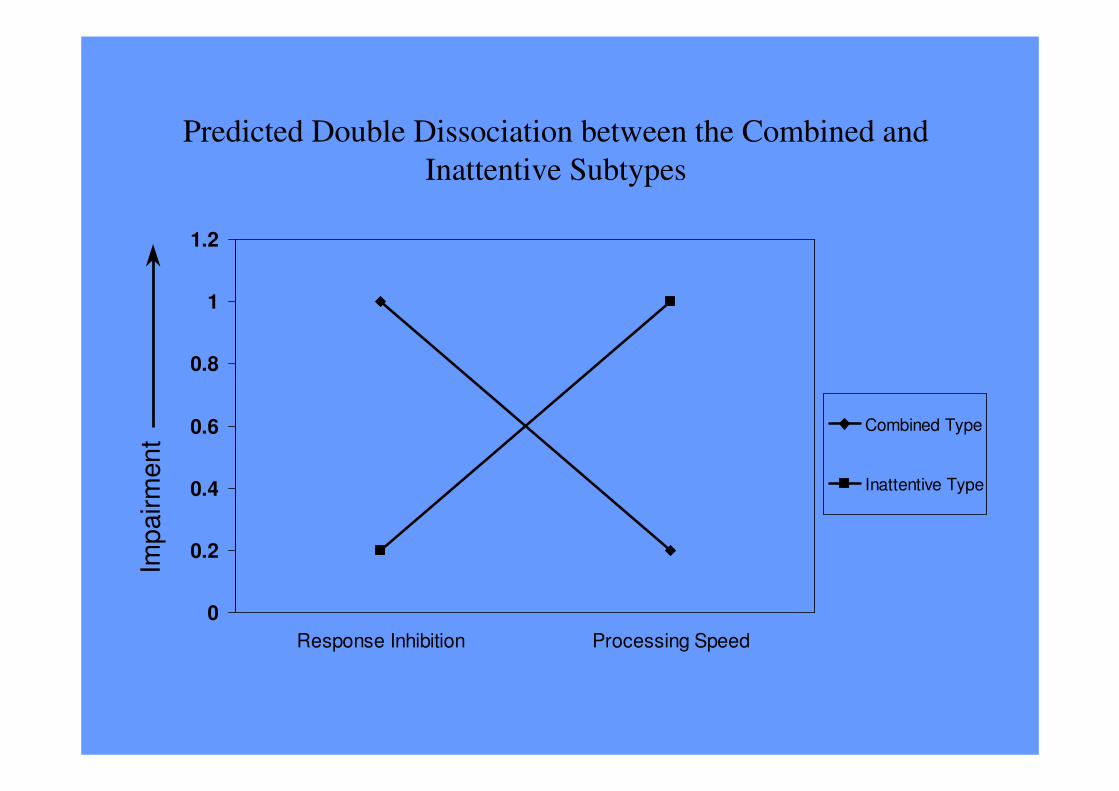
Predicted Double Dissociation between the Combined and
Inattentive Subtypes
0
0.2
0.4
0.6
0.8
1
1.2
Response Inhibition Processing Speed
Combined Type
Inattentive Type
Imp
airm
en
t
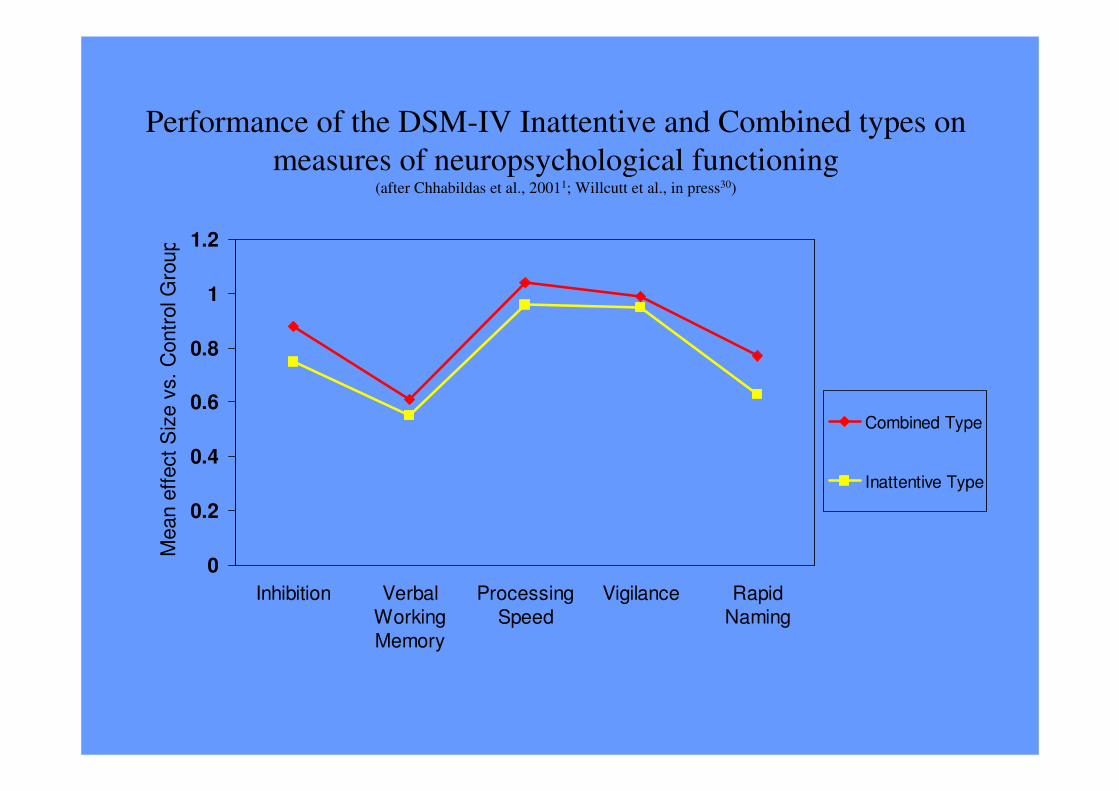
Performance of the DSM-IV Inattentive and Combined types on
measures of neuropsychological functioning(after Chhabildas et al., 20011; Willcutt et al., in press30)
0
0.2
0.4
0.6
0.8
1
1.2
Inhibition Verbal
Working
Memory
Processing
Speed
Vigilance Rapid
Naming
Mean e
ffect
Siz
e v
s.
Contr
ol G
roup
Combined Type
Inattentive Type

Meta-analysis of performance of the DSM-IV subtypes on measures of
neuropsychological functioning(10 studies; Willcutt et al., under review25)
-0.2
-0.1
0
0.1
0.2
0.3
0.4
0.5
0.6
0.7
0.8
Inhibition Verbal
Working
Memory
Processing
Speed
Vigilance Rapid
Naming
Planning Motor
Mean e
ffect
Siz
e v
s.
Contr
ol G
roup
CombinedType
InattentiveType
Hyp/ImpType

Figure 3: Estimated Marginal Means of "Pure" ADD vs. Combined Type
-1.5
-1.25
-1
-0.75
-0.5
-0.25
0
0.25
0.5
0.75
1
1.25
1.5
Response Inhibition Working Memory
Z S
core
ADD Combined Type

A paradigm shift:
The need for a multifactorial model
• ADHD is not attributable to a single core deficit in EF or anything else.
• EF deficits are one important part of a model that includes several other
weaknesses.
• Other possible weaknesses:
– Delay Aversion: hypersensitivity to delay expressed as behaviors devoted to
minimizing the experience of delay (Sonuga-Barke, 2003)
– Arousal (“state”) regulation: fluctuations in arousal/activation lead to suboptimal
performance (Sergeant et al., 2003)
– Cognitive Speed
• Naming speed (Rucklidge & Tannock, 2002)
• Processing speed (Willcutt et al., in press)
– Temporal processing
• Durations > 2 seconds (Barkley et al., 2001)
• Durations < 1 second (Castellanos & Tannock)
• Some weaknesses may be shared with comorbid disorders and some may be
specific to ADHD.
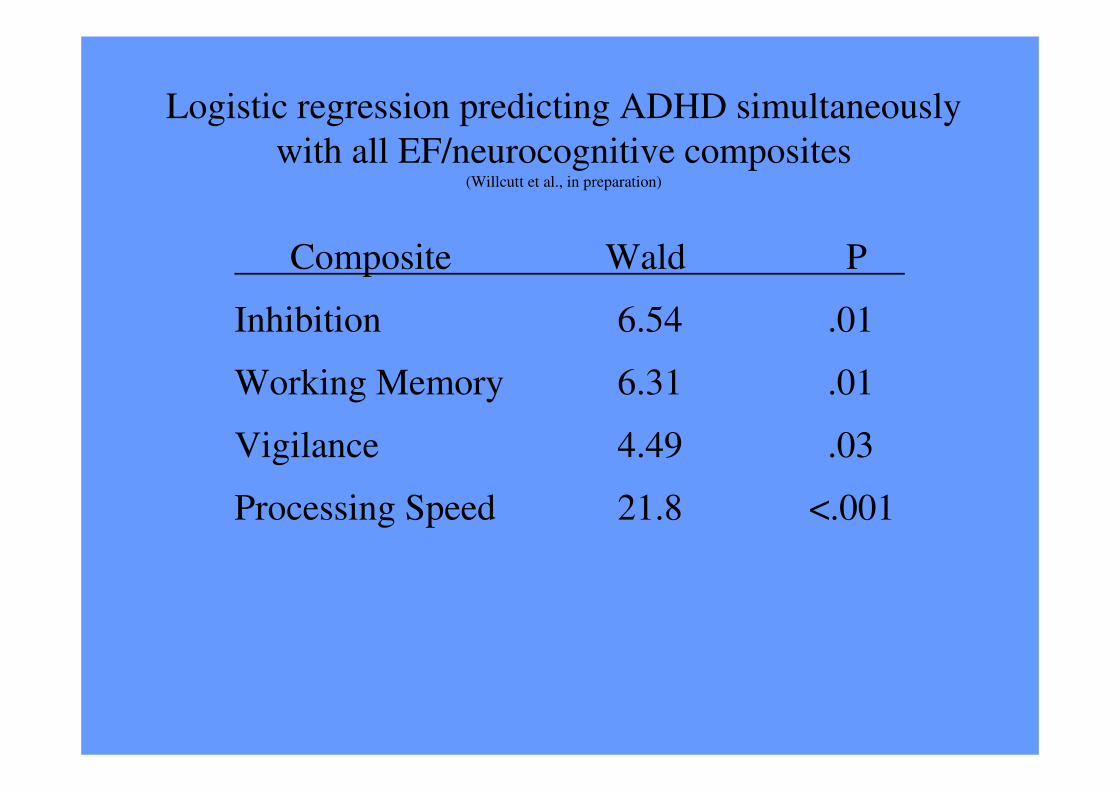
Logistic regression predicting ADHD simultaneously
with all EF/neurocognitive composites(Willcutt et al., in preparation)
Composite Wald P
Inhibition 6.54 .01
Working Memory 6.31 .01
Vigilance 4.49 .03
Processing Speed 21.8 <.001

Number of neurocognitive deficits exhibited by
children with and without ADHD
(Domains assessed: inhibition, set shifting, processing speed, vigilance)
0
10
20
30
40
50
60
70
80
0 1 2 3 4
Number of Deficits (> 1 SD)
Pe
rce
nta
ge
of
ind
ivid
ua
ls
Comparison
ADHD

Tests of Motivational Effects in CLDRC
A. Motivational Inhibition (Hartung, in preparation)
1. Newman’s Go No Go Commissionsd= .38*
2. Doors task d= .15, ns
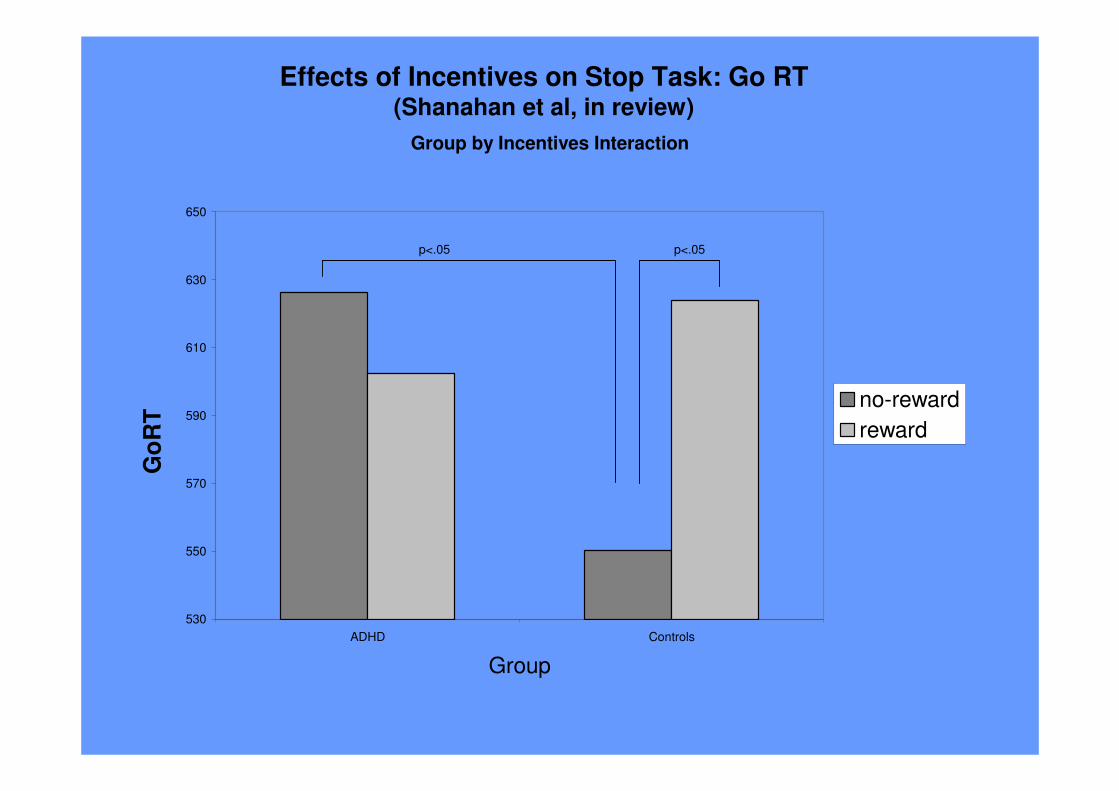
B. Manipulating Incentives on Stop Task(Shanahan et al., in revision)No group x incentives interaction
C. Delay Aversion : Effects in younger age group
D. Orbital Frontal Tasks (Object Reversal and Gambling)Evidence for multiple deficits

Effects of Incentives on Stop Task: SSRT (Shanahan et al., in review)
Main effect of Group (F (1, 54) = 5.12, p < .05
No Main effect of Reward
No Group by Reward Interaction
300
0
50
100
150
200
250
ADHD Controls
No Reward
Reward
530
550
570
590
610
630
650
ADHD Controls
Group
no-reward
reward
p<.05 p<.05
Effects of Incentives on Stop Task: Go RT(Shanahan et al, in review)
Group by Incentives InteractionG
oR
T

Delay Aversion Results in CLDRC: Age Differences
8-11 years
Controls (n=129) 31.9 (5.4)ADHD (n=65) 30.5 (5.1)
d= .26, p<.10
12-18 years
Controls (n=70) 32.9 (5.7)ADHD (n=29) 35.2 (5.2)
d= -0.43, p=.06

Group Differences in Executive and Motivational TasksTask F (1,70) p
value
Inhibition
SSRT 11.45 p<.001
GDS-Commission Errors 3.27 p=.07
Motivational
CGT- Quality of Decision Making 13.5 p<.001
CGT- Deliberation Time 3.89 p=.05
Object Reversal - Total Errors 5.2 p<.05
Object Reversal - Total Points 3.9 p=.05
Object Reversal - Total Trials 5.79 p<.05
Note. Children with ADHD performed significantly worse on all of these variables.
Note. When Full Scale IQ was covaried from the analyses, the same overall
pattern remained.

Single versus Multiple Deficits
0
5
10
15
20
25
30
35
40
45
ADHD Control
Group
Perc
en
t o
f G
rou
p w
ith
Defi
cit
Inhibition Only
Orbital Only
Double Deficit
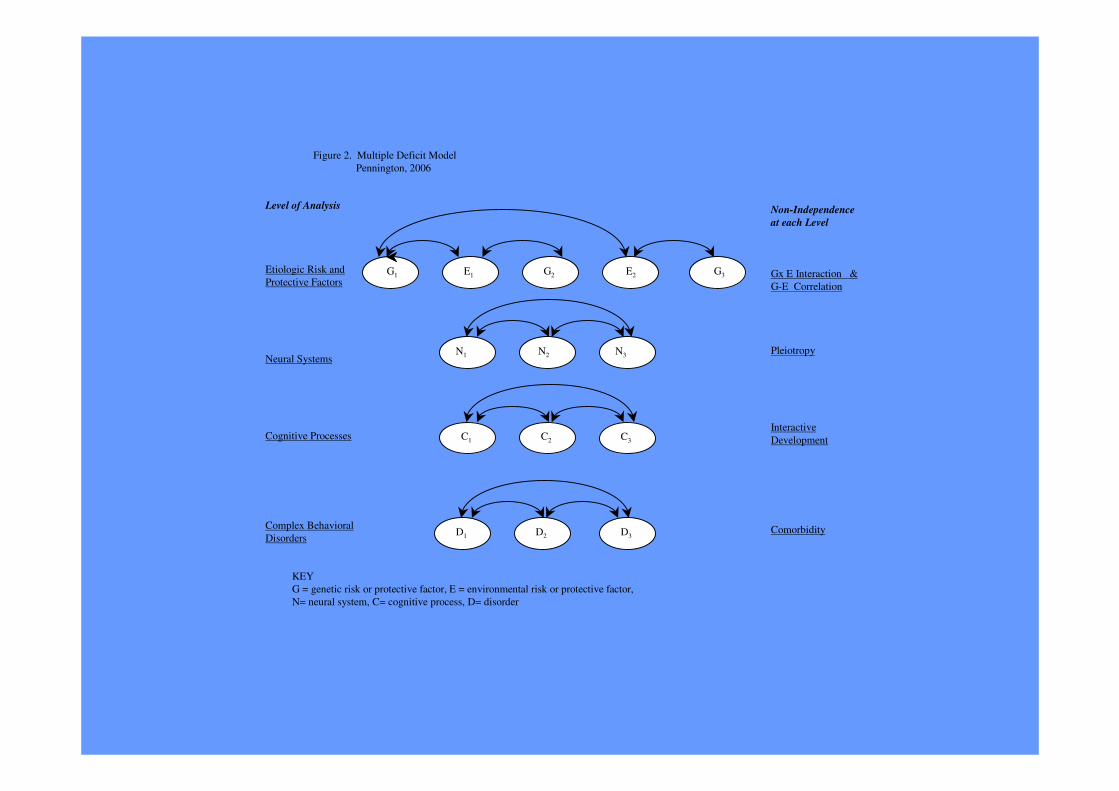
Figure 2. Multiple Deficit Model
Pennington, 2006
Level of Analysis
Etiologic Risk and
Protective Factors
Neural Systems
Cognitive Processes
Complex Behavioral
Disorders
Non-Independence
at each Level
Gx E Interaction &
G-E Correlation
Pleiotropy
Interactive
Development
Comorbidity
G1 E1 G2 E2 G3
N1 N2 N3
C1 C2 C3
D1 D2 D3
KEY
G = genetic risk or protective factor, E = environmental risk or protective factor,
N= neural system, C= cognitive process, D= disorder
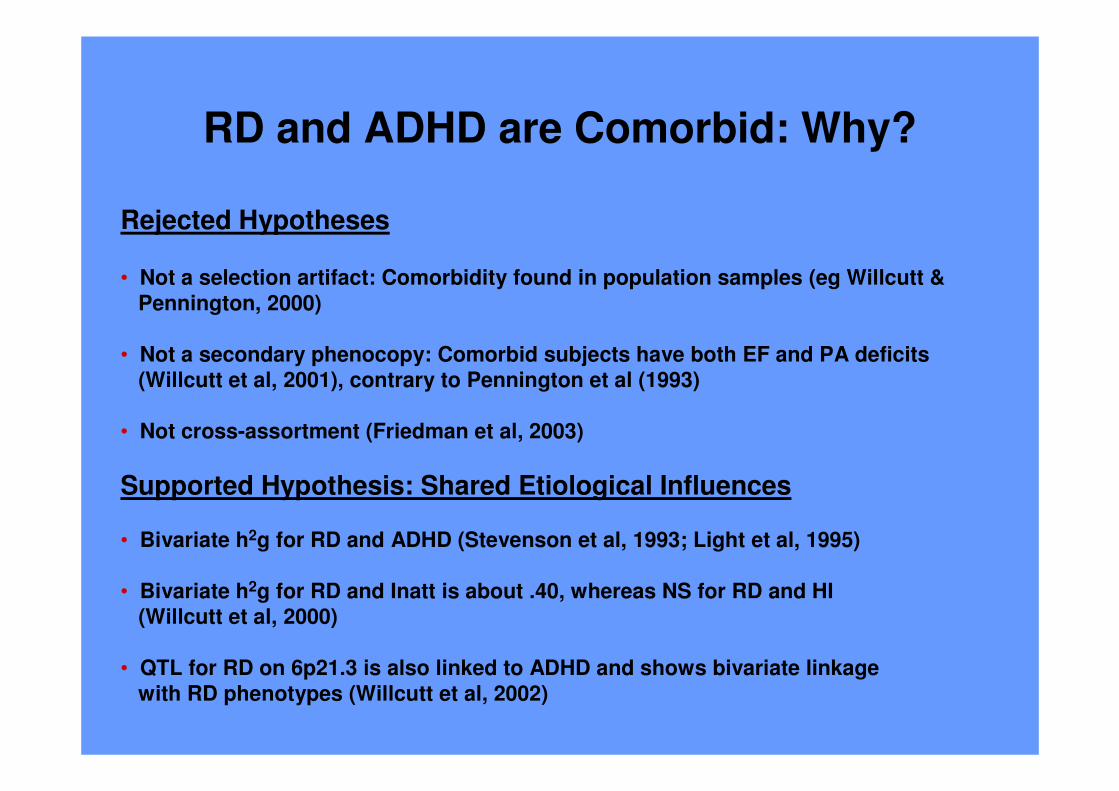
RD and ADHD are Comorbid: Why?
Rejected Hypotheses
• Not a selection artifact: Comorbidity found in population samples (eg Willcutt &
Pennington, 2000)
• Not a secondary phenocopy: Comorbid subjects have both EF and PA deficits(Willcutt et al, 2001), contrary to Pennington et al (1993)
• Not cross-assortment (Friedman et al, 2003)
Supported Hypothesis: Shared Etiological Influences
• Bivariate h2g for RD and ADHD (Stevenson et al, 1993; Light et al, 1995)
• Bivariate h2g for RD and Inatt is about .40, whereas NS for RD and HI(Willcutt et al, 2000)
• QTL for RD on 6p21.3 is also linked to ADHD and shows bivariate linkage
with RD phenotypes (Willcutt et al, 2002)

0
0.5
1
1.5
2
2.5
3
3.5
4
t
D6S
291
D6S
439
P = .001
D6S
461
D6S
276
D6S
105
D6S
306
D6S
258
D6S
1019
6pter 6cen5 cM
Linkage of ADHD to markers on chromosome 6
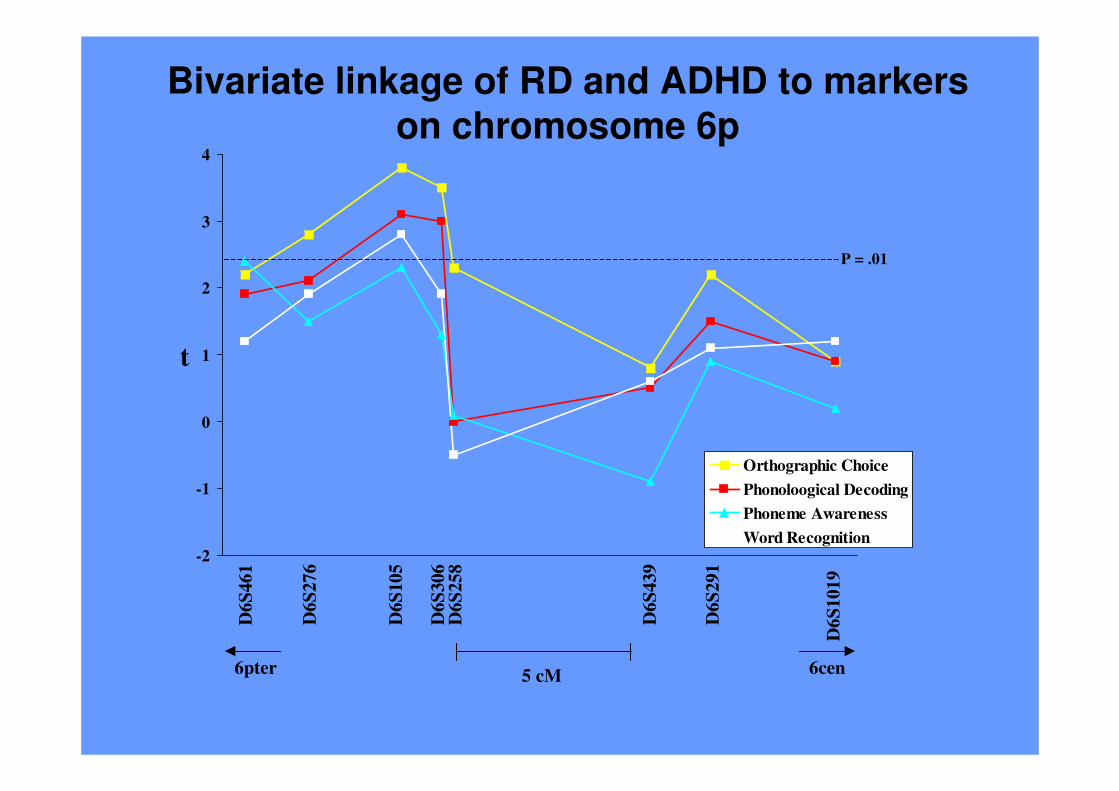
-2
-1
0
1
2
3
4
t
Orthographic Choice
Phonoloogical Decoding
Phoneme Awareness
Word Recognition
D6
S291
D6
S439
P = .01D
6S
461
D6
S276
D6
S105
D6
S306
D6
S258
D6
S101
9
Bivariate linkage of RD and ADHD to markers
on chromosome 6p
6pter 6cen5 cM
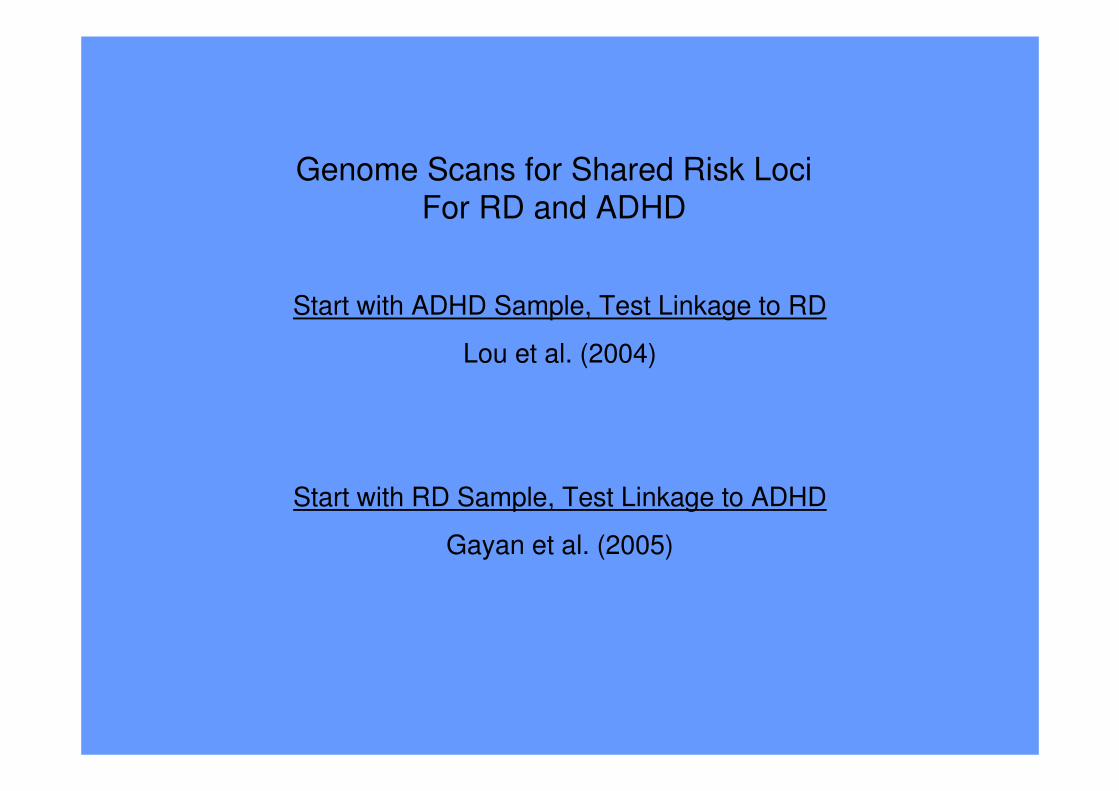
Genome Scans for Shared Risk Loci For RD and ADHD
Start with ADHD Sample, Test Linkage to RD
Lou et al. (2004)
Start with RD Sample, Test Linkage to ADHD
Gayan et al. (2005)

Possible Locations of Genes That InfluenceRD, ADHD, or both RD and ADHD
RD
R+A
R+A
RD
RD
RDRD
RD
R+A
RD
AD R+A
AD
AD
AD
R+A R+A
AD
R+A
R+A
RD
RD RDR+A
AD

MeasuresLatent Variable Measures Used to Predict Latent Variable_____________________________________________________________________________Reading Ability Time limited word recognition task, PIAT Reading Recognition,
& PIAT Spelling
Inattention Symptoms Mother, Father, Teacher, & Examiner Ratings
Hyperactive/Impulsive Symptoms Mother, Father, Teacher, & Examiner Ratings
PA Phoneme Deletion (% correct, blocks 1 & 2), Pig Latin test, & the Lindamood Auditory Conceptualization task
VR Information, Similarities, Vocabulary, & Comprehension fromthe WISC-R
WM Nonword Repetition, Digit Span (Forward & Backward), Sentence Span & Counting Span
Inhibition Gordon Diagnostic System commission errors (Vigilance & Distractibility), & Stop Signal Reaction Time from the Stop Task
PS WISC-R Coding, WISC-III Symbol Search, Colorado Perceptual Speed Task,Identical Pictures, Trailmaking Test, Rapid Automatized Naming Task (Colors, Numbers, Letters, & Pictures) & Stroop Task (Word Naming & Color Naming)
_____________________________________________________________________________________Note. For ADHD, mean severity ratings from each rater were used as the indicators. This strategy allows for more variance than the more typical
strategy of defining ADHD using symptom counts.
Note. Errors from the same instrument (e.g., WISC Coding and Symbol Search) were allowed to correlate in both measurement models.

ResultsMeasurement Model
The best fitting measurement model was one which created separate latent variables for the continuous symptoms of
inattention and symptoms of hyperactivity/impulsivity (χ2 /df= 2.303, CFI= 0.986, RMSEA=0.045). The measurement model for the latent variables of the the cognitive constructs was also a good fitting model (χ2 /df=
3.187, CFI= 0.915, RMSEA=0.059).
Full SEM ModelThe full SEM model was also a good fit (χ2 /df= 2.63, CFI= 0.918, RMSEA=0.05
PA
VR
WM
PS
Inhibition
Reading
Ability
Symptoms off
Inattention
Symptoms
of Hyperactivity/ Impulsivity
0.33**
0.28**
0.59*
-0.28*
0.46*
0.44**

Summary of Results and Discussion
� This model accounted for 82% of the variance in RD, 39% of the variance in
symptoms of inattention, and 22% of the variance in symptoms of
hyperactivity/impulsivity.
� Furthermore, it reduced the relationship between RD and inattention symptoms from
a zero-order correlation of -0.425 to a non-significant partial correlation of -0.08, which
implies that PS explains a significant amount of their overlap.
� It also reduced the relationship between RD and hyperactivity/impulsivity from -
0.215 to -0.12, suggesting that PS partially explains this relationship.
� Contrary to prediction, WM did not contribute uniquely to either RD or ADHD
symptoms.
� These results indicate that PS is a shared cognitive risk factor for RD and ADHD,
especially between RD and Inattention symptoms.
� Moreover, by using latent traits of symptoms of inattention and
hyperactivity/impulsivity and their neuropsychological predictors, we were able to
explain a much greater amount of the variance (24-39%) of the symptoms of ADHD
than is typically found in the literature (10-12%).

Correlations Among Constructs(N=444)
Inhibition Processing Speed SDRT
Delay Aversion .05 .05 .03
SDRT .46 .43Processing Speed .37
Bold = p<.01

Predicting ADHD Symptoms(N=444)
Adjusted R2 R2 Change p
Processing Speed .135 .137 .000Inhibition .174 .041 .000SDRT .187 .015 .006Delay Aversion .191 .006 <.10

Conclusions
1. No single cognitive deficit model of ADHD appears adequate.
2. DSM-IV subtypes are not cognitively distinct, nor is pure Inattentive subtype.
3. Some combinations of executive and motivational deficits appearpromising, but more work is needed.
4. A multiple cognitive deficit model helps explain ADHD’s comorbidity
with dyslexia.
5. More work is needed on relations among key constructs: executiveinhibition, state regulation, and delay aversion.