a n a g en t -b ased mod el of food -b orn e di seases u n ... · 3 a ut ho r s : so me o f t he a...
TRANSCRIPT
See discussions, stats, and author profiles for this publication at: https://www.researchgate.net/publication/318926854
An Agent-based Model of Food-borne Diseases Under Climate Change
Scenarios in Mexico City - The Risk of Street-food in a Warming City
Conference Paper · July 2017
DOI: 10.5220/0006484404740479
CITATIONS
0
READS
42
3 authors:
Some of the authors of this publication are also working on these related projects:
Manejo de los recursos hídricos en México considerando el impacto del cambio climático. View project
Radiative tranfer in planetary atmospheres View project
Bernardo Bastien
University of California, Davis
14 PUBLICATIONS 1 CITATION
SEE PROFILE
Elysse Bautista
Fundación Mexicana Para La Salud, A.C.
3 PUBLICATIONS 0 CITATIONS
SEE PROFILE
Carlos Gay Garcia
Universidad Nacional Autónoma de México
157 PUBLICATIONS 1,022 CITATIONS
SEE PROFILE
All content following this page was uploaded by Bernardo Bastien on 30 November 2017.
The user has requested enhancement of the downloaded file.

An agent-based model of food-borne diseases under climate changescenarios in Mexico City
The risk of street-food in a warming city
Bastien-Olvera, B. 1, Bautista-Gonzalez, E. 2, Gay-Garcia, C.3,41 Geography Department, University College London, London, United Kingdom.
2 Department of Epidemiology and Public health, University College London, London, United Kingdom.3Centro de Ciencias de la Atmosfera, Universidad Nacional Autonoma de Mexico, Mexico City, Mexico.
4Programa de Investigacion en Cambio Climatico, Universidad Nacional Autonoma de Mexico, Mexico City, [email protected], [email protected], [email protected]
Keywords: food-borne disease, climate change, food safety, public health, resilience, urban mitigation and adaptation,agent-based model
Abstract: Food is a conventional vehicle for pathogens to reach and infect new hosts. Distinctively, street food is a majorsource of food-borne diseases and climate change effects will intensify this by increasing the mean surfacetemperature and thus, the microorganisms growth rate. Through this research we present a preliminary agent-based model that simulates at various levels the dynamic of street-food consumers and food-borne diseaseunder climate change scenarios, using tunable parameters such as hygiene level, microorganisms growth rateand number of consumers. The results show that the model has the potential to be a useful tool for optimizingdecision-making and urban planning strategies related to health and climate change.
1 INTRODUCTION
Street food is an array of food characterized by itspreparation and consumption in public places i.e.parks or streets (Von Holy and Makhoane, 2006). It isgenerally affordable and conveniently located near theworking district in cities, which makes it the most ac-cessible source of food for people in lower and middlesocio-economic positions (FAO, 2011). Regardlessof consumers being aware of the low hygienic stan-dards of the stalls and the vendors unsanitary cook-ing practices (Bakic H., 2014), the working class findsstreet food more affordable and less time-consumingin comparison to eating in a restaurant or bringingfood from home (Duhau and Giglia, 2007).
The street food stalls have been present in Mex-ico City since ancient times. However, it was at theend of the XIX century that great rates of migrationfrom rural to urban areas, driven by economic oppor-tunities, increased the diversity and proliferation ofthis particular activity (Barbosa C., 2010). Street foodvending in Mexico City is also an economic responseto the low employability rates and salary, represent-ing a large portion of the informal economy (Duhauand Giglia, 2007) and constituting a large source of
income for families in lower socio-economic posi-tions(WHO, 2010). Nonetheless, this ancestral cul-tural food source is disregarded by the governmentand continues to be part of the informal economy andin consequence an antecedent of food-borne diseases.
Food has been through time a conventional vehi-cle for pathogens (bacteria, virus, parasites) to reachand infect new hosts (Newell et al., 2010) and ac-cording to WHO (2010), the improper infrastructureof the street food stalls and the inadequate handlingof the food are the principal drivers of the microor-ganisms growth and thus food-borne diseases. Com-bined with the lack of piped water, street vendorsgenerate improper sanitation practices that promotefood contamination. In addition, the lack of elec-tricity to refrigerate food in the informal food stallsenhances the growing rate of microorganisms lead-ing to risk-setting-levels of bacterial population in thefood. Hence, the microbiological safety of food re-mains a dynamic situation heavily influenced by mul-tiple factors along the food chain from the farm to thefork (Newell et al., 2010), placing higher health risksamong the most vulnerable groups i.e. children, el-derly and immunocompromised population.
Moreover, food-borne disease will be intensified

by climate change through multiple factors impact-ing food safety including: changes in temperature andprecipitation patterns (Tirado et al., 2010). In addi-tion, climate change will also affect socio-economicaspects related to food systems such as: agriculture,global trade, demographics and behavioral lifestyleswhich influence food safety (Newell et al., 2010;Tirado et al., 2010). In consequence, climate change,the increasing transient human population, globalmarkets and antibiotic resistance will turn food-bornediseases into a global health threat. However, this re-search will focus only on the environmental condi-tions the food is cooked, sold and consumed. Othersteps in the supply chain will be disregarded.
The current anthropogenic climate change is shift-ing the spatial distribution, range and intensity of cli-mate parameters such as temperature and precipita-tion. In the street food consumption context, changesin mean temperatures will intensify the street food-borne diseases by intensifying the microorganismsgrowth.
Laboratory research on different species of bacte-ria have demonstrated that their growth rates increaseproportionally with temperature, within a range of 0◦
C and 70◦ C (Acai et al., 2015; Alvarez-Ordoneset al., 2008; Schaechter et al., 1958). All withinthe range of surface air temperatures in Mexico City.Therefore an increase of the surface temperature inMexico City would lead to augmenting rates of bac-terial growth in street food. The projected surfacetemperature in Mexico City under the four representa-tive concentration pathways (Van Vuuren et al., 2011)is expected to escalate on average from 1 to 5◦C by2100.
2 MODEL DESCRIPTION
Our model was created using Netlogo (Wilensky,1999) and it represents the dynamic of a typical work-ing area in Mexico City during lunch time. It is a sam-ple of 100 persons (agents) that move through differ-ent street-food stalls (food-patches) each day. Eachfood-patch has a different level of microorganismsthat could potentially get sick to the persons that con-sume their food, and the microorganism levels growas a function of the mean daily temperature (Figure1).
Each simulation is ran for 36500 times-steps un-der the four different climate change scenarios, repre-senting a projection of the number of cases in the nextone hundred years.
The variables of the model are: the overall Hy-giene of the street-food stalls, the growth rate value
Figure 1: Agent-based model world with agents (black fig-ures), street-food stalls (red patches) and neutral area (bluepatches).
of the microorganisms as a function of temperature,and the climate change scenario that will determinethe temperature evolution through time.
2.1 Street-food stalls representation
The stalls are represented by the red patches of theABM (Figure 1). Each stall patch has a parameterthat describes the amount of microorganisms in thefood, which is given by
ask food-patches [ifelse random 100 > Hygiene[set level_micro random-normal-in-bounds
(100 - Hygiene) 10 0 100set pcolor 19 - (7 * level_micro) / 100][set level_micro random-normal-in-bounds 5
5 0 100set pcolor 19 - (7 * level_micro) / 100]
]
The variable Hygiene is a user dimension-less input, which is used to set the level of mi-croorganisms in each food-patch. The functionrandom-normal-in-bounds a b c d take a ran-dom number from the normal distribution with meanvalue a, standard deviation b and inside the bounds[c,d]. pcolor sets the intensity of red as a functionof the microorganisms level. The latter is truth for thepatches that comply with the condition random 100> Hygiene, all other food-patches have microorgan-isms levels given by random-normal-in-bounds 5

5 0 100.The level of microorganisms will grow as a func-
tion of temperature as represented below
set growth 1 + micro growth rate * tempask food-patches [set level_micro level_micro * growthif level_micro > 100[set level_micro 100]set pcolor 19 - (7 * level_micro) / 100 ;;]
The variable micro growth rate is a user de-fined value that represents how much the microorgan-isms growth as a function of the mean daily tempera-ture (temp).
Moreover, the microorganisms level is restartedevery seven days, representing that on weekends thestreet-food stalls re-supply their food with the baselevel of microorganisms than before.
2.2 Temperature scenarios
The temperature evolves through the time given theclimate change scenario chose by the user. The tem-perature scenarios were obtained by the mean val-ues over Mexico City of the CMIP5 models (Tayloret al., 2012) under the RCPs 2.6, 4.5, 6.0 and 8.5(Van Vuuren et al., 2011). In order to work with asimple expression for the temperature evolution, weobtained the polynomial equations that fitted the tem-perature data. Moreover, in order to simulate the sea-sonal dynamic, we added to the polynomial equationsa sine wave with amplitude of 2◦C and noise given byrandom-normal-in-bounds 0 1 -10 10.
2.3 Illness representation
Each time step certain amount of consumers, definedby the user, is positioned in a food-patch, where itis going to compare its immunity to the level of mi-croorganisms. If the level is greater than the agentimmunity, then it will be considered to get sick. Thiscomputation is done using random numbers from thenormal distributions as shown below
ask turtles [ifelse consumers > random 100[ move-to-empty-one-of food-patches][move-to-empty-one-of work-patches]
]ask turtles-on food-patches [ifelse level_micro >
random-normal-in-bounds immunity 100 100 [set sick 1
set ill ill + 1set color green]
[set sick 0]]
3 EXPERIMENTS
Several experiments were performed with themodel in order to test its scope and limitations. Sincethe aim of this model is to be used as a decision-making tool given the specific conditions of the pop-ulation to be modeled, it is important that our modelresponses make sense.
We used data from a previous study performed inMexico city (Estrada-Garcia et al., 2002) in order toset the hygiene level on the model. The hygiene levelwas set to 60% for all the experiments, meaning thataround 40% of the street-food stalls have a microor-ganisms level M generated by the normal distributionrandom-normal-in-bounds 40 10 0 100, the rest60% had a microorganisms level around 5. The im-munity of the persons was set to 60, meaning, thatthey need a level of 60 microorganisms in the stall inorder to get sick.
One of the main variables that should be cali-brated according to the specific pathogens that causethe main food poisoning in the population of interest,is the microorganism growth rate as a function of tem-perature. This growth rate is defined in section 2 andcan be rewritten as M = M ∗ (1+mgr∗T ) where M isthe level of microorganisms, mgr is a microorganismgrowth rate scalar and T is the daily mean tempera-ture.
The mgr scalar changes the intensity in whichtemperature impacts the number of food poisoningcases. Figure 2 shows the number of food poison-ing cases as a function of mgr and controlling forall the other parameters. In this case, the temper-ature scenario was the RCP8.5, and it can be seenthat the temperature trend is shown only until mgr isgreater than 0.004. As many studies have shown, thetemperature is an important controlling factor for thepathogens’ growth rate (Duan et al., 2015; Ratkowskyet al., 1982; Koseki and Isobe, 2005), so in the follow-ing experiments we will use mgr = 0.004.
Moreover, as stated in section 2, our model hasthe ability to represent the temperature seasonal cycleover the climate change signal. This cycle, as pointedout by some authors (Yoshikura, 2015), is a very im-portant driver of the internal dynamic of food poi-soning and bacterial growing. Figure 3 (top) showshistorical data from 2010 to 2015 of surface meantemperature and total food poisoning cases in Mex-ico City, as it is observed, there is a correlation and
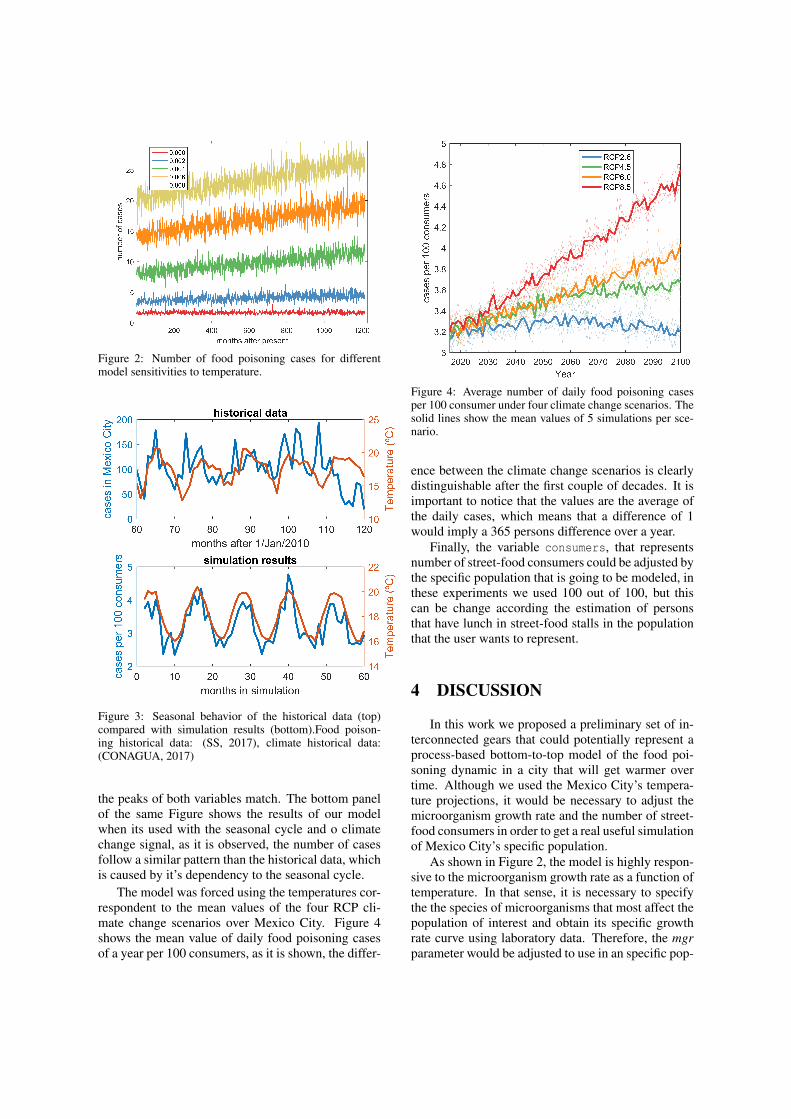
Figure 2: Number of food poisoning cases for differentmodel sensitivities to temperature.
Figure 3: Seasonal behavior of the historical data (top)compared with simulation results (bottom).Food poison-ing historical data: (SS, 2017), climate historical data:(CONAGUA, 2017)
the peaks of both variables match. The bottom panelof the same Figure shows the results of our modelwhen its used with the seasonal cycle and o climatechange signal, as it is observed, the number of casesfollow a similar pattern than the historical data, whichis caused by it’s dependency to the seasonal cycle.
The model was forced using the temperatures cor-respondent to the mean values of the four RCP cli-mate change scenarios over Mexico City. Figure 4shows the mean value of daily food poisoning casesof a year per 100 consumers, as it is shown, the differ-
Figure 4: Average number of daily food poisoning casesper 100 consumer under four climate change scenarios. Thesolid lines show the mean values of 5 simulations per sce-nario.
ence between the climate change scenarios is clearlydistinguishable after the first couple of decades. It isimportant to notice that the values are the average ofthe daily cases, which means that a difference of 1would imply a 365 persons difference over a year.
Finally, the variable consumers, that representsnumber of street-food consumers could be adjusted bythe specific population that is going to be modeled, inthese experiments we used 100 out of 100, but thiscan be change according the estimation of personsthat have lunch in street-food stalls in the populationthat the user wants to represent.
4 DISCUSSION
In this work we proposed a preliminary set of in-terconnected gears that could potentially represent aprocess-based bottom-to-top model of the food poi-soning dynamic in a city that will get warmer overtime. Although we used the Mexico City’s tempera-ture projections, it would be necessary to adjust themicroorganism growth rate and the number of street-food consumers in order to get a real useful simulationof Mexico City’s specific population.
As shown in Figure 2, the model is highly respon-sive to the microorganism growth rate as a function oftemperature. In that sense, it is necessary to specifythe the species of microorganisms that most affect thepopulation of interest and obtain its specific growthrate curve using laboratory data. Therefore, the mgrparameter would be adjusted to use in an specific pop-
ulation. Moreover, the microorganisms growth ratemight be affected by other factors that should be im-plemented in future versions of the model, such asaccess to public toilets, running water and electricityfor food refrigeration.
Also, as it is observed in Figure 3, the seasonal cy-cle is a strong driver in the number of food-poisoningcases. In these experiments we made up the seasonalcycle with a sinusoidal wave and noise, however, itis possible to use the general circulation models’ re-sults as data that directly feed the model temperatureparameter in order to have more realistic estimations.An added benefit of doing so would be the represen-tation of the frequency and intensity of heat-waves,which are also determinant in food-poisoning peaks.
The model is also able to change the number ofconsumers out of 100 persons. Thus, it can be seen asa parameter of the socio-economic level of the popu-lation that the user wants to simulate.
Finally the hygiene parameter is crucial in themodel. It will determine the initial microorganismslevels. Hygiene levels is a variable we can control forand one which local decision-makers have influenceon. Therefore, in hygiene relies the opportunity forimprovement by increasing access to piped potablewater, public toilets, electricity and health promotioneducation.
The lack of accurate and longterm monitoring dataon aetiology and occurrences of food-borne diseaseswas the main limitation for a further validation of thismodel. The rates reported were taken from the avail-able Mexican morbidity data reported monthly from2007 to 2015, so this would only be used to validatethe present behavior as done in Figure 3. Validationof the climate change signal reflected in the diseaseswould not be possible due to the short period of timeretrieved. However, other important issues could bepointed out in the future such as the reflection of heat-waves on the diseases rate.
Future research might involve also the precipita-tion parameter to describe better the proper environ-ment for microbial growth. Also, it is important thatthe parameters are calibrated according to the healthinequalities of the population that the user wants tosimulate such as socio-economic status, gender, eth-nicity and age. Additional, efforts should be placed inreducing underestimation of cases (due to lack of self-report) and biologically recognizing the aetiology ofthe disease.
5 CONCLUSIONS
The model presented here was constructed using re-search in several fields such as microbiology, health,urban dynamics, and climate change. It is known thatclimate change will enhance the rate of change of sev-eral processes, in this case, by scaling up the basicinfluence of temperature in microorganisms growth,which adding up to the dynamic of a global-southsocio-economic vulnerable population, will result ina greater health risks than the health sector might beprepared for facing.
Historically, the street food business has been veryflexible and is able to adapt very quickly to economicrealities. Therefore, with the correct utilization ofmodels like this, street food adaptation and mitigationprojects should not represent an unreachable chal-lenge.
It is common for the global south to adopt knowl-edge coming for research in other countries. Nonethe-less, that knowledge does not always reflect the com-plex reality that people live in middle and low incomecountries. For that reason, our model allows the userto calibrate the parameters according to the popula-tion of interest.
Finally, future work will include important spatialdynamics that will make the most of the utilization ofABM to this particular problem, such as the represen-tation of actual public urban spaces where street-foodconsumption takes place. Also, agents will count withindividual decision mechanisms in order to avoid pre-viously visited stalls whose food made them sick.
The ultimate goal of this project is to have a modelthat incorporates information of the state-of-the-artresults on public health, microbiology, urban dynamicand climate change, which would be of great impor-tance in a city from the global south that has limitedbudget to face climate change effects in the incomingdecades.
ACKNOWLEDGEMENTS
We thank the Programa de Investigacion en CambioClimatico of the Universidad Nacional Autonoma deMexico for the support to present this work.

REFERENCES
Acai, P., Valik, L., Medved’ova, A., and Rosskopf, F.(2015). Modelling and predicting the simultaneousgrowth of escherichia coli and lactic acid bacteria inmilk. Food Science and Technology International,22(6):475–484.
Alvarez-Ordones, A., Fernandez, A., Lopez, M., Arenas,R., and Bernardo, A. (2008). Modifications in mem-brane fatty acid coposition of salmonella typhimuriumin response to growth conditions and their effect onheat resistance. International Journal of Food Micro-biology, (123):212–219.
Bakic H., T. (2014). A taste of precarity. Lancuage, legit-imacy, and legality among Mexican street food ven-dros, chapter 4, pages 83–97. Routledge, London andNew York.
Barbosa C., M. (2010). Trabajadores en las calles de laciudad de mexico: subsistencia, negociacin y pobrezaurbana en tiempos de la revolucion.
CONAGUA (2017). Secretarıa de salud, gobierno demexico. www.gob.mx/conagua, [Accessed: 2017-05-10].
Duan, H., Tan, F., Yi, X., Zhang, H., Hou, M., and Mon-aghan, J. E. (2015). A predictive model of differenttemperature growth of escherichia coli in fresh-cut let-tuce based on matlab7. 0.
Duhau, E. and Giglia, A. (2007). Globalizacion e informal-idad en la ciudad de mexico. practicas de consumoy movilidad. Trace. Travaux et recherches dans lesAmeriques du Centre, (51):28–43.
Estrada-Garcia, T., Cerna, J., Thompson, M., and Lopez-Saucedo, C. (2002). Faecal contamination and entero-toxigenic escherichia coli in street-vended chili saucesin mexico and its public health relevance. Epidemiol-ogy and infection, 129(01):223–226.
FAO (2011). Resumen del debate no. 73. In Alimentos deventa callejera: el camino a seguir para una mejorseguridad alimentaria y nutricion. 26 de septiembreal 21 de octubre de 2011.
Koseki, S. and Isobe, S. (2005). Prediction of pathogengrowth on iceberg lettuce under real temperature his-tory during distribution from farm to table. Inter-national Journal of Food Microbiology, 104(3):239–248.
Newell, D. G., Koopmans, M., Verhoef, L., Duizer, E.,Aidara-Kane, A., Sprong, H., Opsteegh, M., Lange-laar, M., Threfall, J., Scheutz, F., et al. (2010). Food-borne diseasesthe challenges of 20years ago still per-sist while new ones continue to emerge. Internationaljournal of food microbiology, 139:S3–S15.
Ratkowsky, D., Olley, J., McMeekin, T., and Ball, A.(1982). Relationship between temperature and growthrate of bacterial cultures. Journal of Bacteriology,149(1):1–5.
Schaechter, M., Maloe, O., and Kjeldgaard, N. O. (1958).Dependency on medium and temperature of cel sizeand chemical composition during balanced growth ofsalmonella typhimurium. Journal of gen. Microbiol-ogy, 19:592–606.
SS (2017). Secretarıa de salud, gobierno de mexico.www.gob.mx/salud/archivo/, [Accessed: 2017-05-10].
Taylor, K. E., Stouffer, R. J., and Meehl, G. A. (2012).An overview of cmip5 and the experiment design.Bulletin of the American Meteorological Society,93(4):485.
Tirado, M., Clarke, R., Jaykus, L., McQuatters-Gollop, A.,and Frank, J. (2010). Climate change and food safety:A review. Food Research International, 43(7):1745–1765.
Van Vuuren, D. P., Edmonds, J., Kainuma, M., Riahi, K.,Thomson, A., Hibbard, K., Hurtt, G. C., Kram, T.,Krey, V., Lamarque, J.-F., et al. (2011). The represen-tative concentration pathways: an overview. Climaticchange, 109:5–31.
Von Holy, A. and Makhoane, F. (2006). Improving streetfood vending in south africa: Achievements andlessons learned. International journal of food micro-biology, 111(2):89–92.
WHO (2010). Basic steps to improve safety of street-vended food. international food safety authorities net-work (infosan). Technical report, INFOSAN Informa-tion Note.
Wilensky, U. (1999). Netlogo.Yoshikura, H. (2015). Attack rate in food poisoning: Or-
der in chaos. Japanese journal of infectious diseases,68(5):394–406.
View publication statsView publication stats