a neural-evidence pooling approach to predict urban sprawl ... · sriperumpudur taluk which has...
TRANSCRIPT
INTERNATIONAL JOURNAL OF GEOMATICS AND GEOSCIENCES
Volume 5, No 3, 2015
© Copyright by the authors - Licensee IPA- Under Creative Commons license 3.0
Research article ISSN 0976 – 4380
Submitted on August 2012 published on September 2012 459
A neural-evidence pooling approach to predict urban sprawl using
multi-temporal remote sensing data Menaka Chellasamy1, Udhayakumar Chinnasamy 2, Suresh Kumar Ramaswamy3 1- Institute of Remote Sensing, College of Engineering, Chennai – 600025, India
2- Department of Information Technology, College of Engineering, Chennai – 600025, India [email protected]
ABSTRACT
This paper introduces a dynamic neural network based technique to predict the urban growth in Sriperumbudur taluk, India. The novelty of this technique is integration of neural network and theory of evidence to predict future growth which does not require any definition of input parameters, spatial rules or large dataset that involves expert knowledge and time consuming manual work for preparation. First, Land Use Land Cover (LULC) images were obtained by classifying LANDSAT TM satellite image of 30m spatial resolution captured in the year 1991, 2000 and 2009. Multi-Layer-Perceptron (MLP) neural network is used as a classifier. Second, five spatial metrics namely Shannon’s entropy, aggregation index, density, nuclearity, and proximity are derived around each non-urban pixel in 2009 by considering 7x7 window of spatial unit in the LULC images of the three years. Next, these metrics are fed to Focused Time Delay Neural Network (FTDNN) and the metrics for year 2018 are predicted. Finally, evidence pooling is applied to the predicted metrics to identify whether the non-urban pixels in 2009 changes to urban pixel in the year. The predicted results shows that 12.5% of non-urban LULC mainly agriculture and wasteland in 2009 will change to urban land use in 2018. In order to test the performance of the proposed technique, urban land use in 2009 is predicted using LULC images of 1991 and 2000 and compared with actual pixels transformed to urban land use in 2009 from 2000. The predicted result is found to be 81.28 % accurate with spatial autocorrelation of 0.90. The proposed method is also compared with conventional model SLEUTH and found to be 2.56 % more accurate with 0.19 increases in spatial correlation. The results potentially help the city planners and developers to have prior visualization of future urban sprawl in the study area for effective city planning.
Keywords: Urban planning, remote sensing, urban sprawl, spatial metrics, time series prediction, neural network.
1. Introduction
Change in a particular land use or land cover is caused by many factors like human activities, culture, economy, policy makers, planners and environment (Houghton 1994). This modification or transformation causes may create both positive and negative impacts on the environment. Urban sprawl is one such example that increases the economy of the city but also becomes a threatening factor by encroaching agricultural land in larger scale and also causing devoid of water quantity, electricity and other basic amenities. Urban and transportation planning plays an imperative role in development of any nation, said by (Alberti 1999). But by converting the vegetation land into industries and urban areas, the availability of food becomes less, affecting the food chain and food web (Verburg et al. 1999). Three main negative impacts of urban sprawl are environmental degradation, city degradation and social degradation. The planning and growth of a city should be in such a

A neural-evidence pooling approach to predict urban sprawl using multi-temporal remote sensing data
Menaka Chellasamy
International Journal of Geomatics and Geosciences
Volume 5 Issue 3, 2015 460
way that it should increase the economy, trade, public health etc. rather than decreasing them. Urban growth prediction is therefore a fundamental component for the management and planning of a city to have a prior knowledge for sustainable development.
Many models for urban growth prediction, such as CLUE - Conversion of Land Use and its Effects (de Koning et al. 1999), Cellular automata: SLEUTH - Slope, Land use, Exclusion, Urban extent, Transportation and Hillshade (Esnard and Yang 2002), SAMBA (Castella et al. 2005b), Geographic Information Systems (GIS) based models (Hilferink and Rietveld 1999) etc., have been developed. However, there exists some drawback in the mentioned models. The disadvantage of CLUE model is its incapability of representation of data for different scale in regional level (Verburg et al. 1999). In SLEUTH model identification of neighbourhood functions and definition transition rules are being done through expert’s knowledge, which introduces error in the results due to lack of quantitative understanding between land use and driving factors (Pontius Jr et al. 2001). Problem faced by SAMBA model is it is unable to capture the entire diversity of Land Use Land Cover (LULC) at provincial scale (Castella et al. 2005a). In GIS based models, definition of prediction rules applied to the spatial metrics are quite difficult and requires deep knowledge about the study area. It also requires large dataset to derive different spatial metrics that influences the urban growth (Pijanowski et al. 2005). 1.1. Neural network for urban growth modelling
In recent era, the advent of computational power has led ecologists and other beneficiaries to think a step ahead ie to mimic the human brain by making the systems think artificially. These systems called Neural Networks (NN) act as a powerful tool for analysis even if the underlying relationship between the variables is poorly known (Aitkenhead et al. 2003). NN has been used for modeling and predicting urban growth and showed high accurate prediction when compared with conventional models. Also it can model any non-linear relationships exist between the input-output values. It is capable of fabricating generalizable systems in the field of land cover change models applicable for wide range of study area (Nauck and Kruse 1997; Reed and Marks 1998). Static and dynamic are two categories in to which neural networks can be classified. The former one has contained no delays and the output is calculated directly from the input through feed-forward connections. In later the output depends not only on the current input to the network, but also on the previous inputs, outputs, or states of the network. The Land Transformation Model (LTM) is a forecasting model classified that uses static NN (Theobald and Hobbs 1998). It uses Artificial Neural Networks (ANN), GIS, geostatistical and remote sensing techniques. But one of main issues within ANNs is the selection of different parameters to construct the network. Different heuristics such as number of nodes, number of layers, initial learning rate, momentum, number of iterations strongly influence the nature of output. Currently, trial and error is employed to determine the optimum parameters which adds additional delay to the already time consuming process (Kavzoglu and Mather 2003). Two important characteristics of dynamic neural network that make them suitable for predicting time-series relationships and time-varying pattern modeling (urban growth modelling) are: 1) ability to learn from examples without prior knowledge of the regularities in data 2) ability to generalize from a previous state to a new one by modifying their behavior in response to new information (Pijanowski et al. 2005). Among the dynamic NN, Focused Time-Delay Neural Networks (FTDNN) is less complex and required limited time cycles compared to other time delay NN (Weigend 1994). The growth of the urban is highly non-

A neural-evidence pooling approach to predict urban sprawl using multi-temporal remote sensing data
Menaka Chellasamy
International Journal of Geomatics and Geosciences
Volume 5 Issue 3, 2015 461
linear throughout the time and to model the non-linear characteristic of urban sprawl, FDTNN non-linear predictor is believed to train the network faster and easy with less prediction error (Weigend 1994). This is because the tapped delay line with focused memory structure in the input layer of the network and it contains no feedback loops or adjustable parameters (Demuth and Beale 1993). In this paper, the use of neural network for automatic predicting of urban growth using time series LULC images without difficulty of defining any spatial rules or input parameters is illustrated. The method proposed in this study is based on integration of FTDNN and theory of evidences (explained later). Details about study area, data used, the proposed methodology and results are presented as different sections in the following.
2. Study area and data used
The study area is chosen based on the preliminary investigation of urban growth patterns in Sriperumpudur taluk which has rapid urban development resulting large LULC change in the last decade. Sriperumbudur is an industrial town/taluk, located in Kanchipuram district, the northeast of Tamil Nadu state, (Figure 1). It is in proximity to Chennai (capital of Tamil Nadu) and located around 13˚1’ N and 79˚51’E to 13˚3’ and 80˚11’. Since 2000, Sriperumbudur has seen rapid industrialization, attracting huge investments due to its proximity to Chennai port, infrastructure growth and availability of quality manpower. As of 2008, Sriperumbudur is a special economic zone with more than $2 billion invested by companies like Flextronics, Foxconn, Jabil, Dell, Hyundai and Samsung. The works are to be carried out by the Airports Authority of India that includes the creation of a parallel runway, taxiways, aprons and new passenger terminal buildings. The city planning leads to migration of rural areas into urban causing lack of basic infrastructure due to increase in population exceeding the actual capacity in the particular area. Hence the proposed methodology is implemented for Sriperumbudur taluk to have an idea of spatial distribution urban land use in the year 2018.
Figure 1: Study area map
Remote sensing provides us multi-temporal satellite data which helps in monitoring LULC changes in the particular area especially urban land use change. LANDSAT TM (Path/Row:

A neural-evidence pooling approach to predict urban sprawl using multi-temporal remote sensing data
Menaka Chellasamy
International Journal of Geomatics and Geosciences
Volume 5 Issue 3, 2015 462
142-51) image of the study area with spatial resolution of 30m for different years namely 1991, 2000 and 2009 is used for the study. The images are already geometrically and atmospherically corrected. Since the images were free from bad lines, haze, cloud and shadows, noise and distortion, no further processing was necessary. Survey of India topographic maps No: 56K/7 in the scale 1:50,000 are used to prepare LULC, exclusion, urban extent and transport layer for SLEUTH model. SRTM DEM of 30m resolution for the study area is downloaded from NASA to develop slope, hillshade layer for implementing SLEUTH. Topographic maps are used to collect reference and validation data samples for LULC classification and urban prediction.
3. Methodology
The proposed methodology (Figure 2) includes 1) LULC classification using Multi-Layer-Perceptron (MLP) neural network 2) Calculation of metrics of urban sprawl around each non-urban pixel that emphasis urban pixels in the classified image of the year 1991, 2000 and 3) Implementation of FTDNN for predicting urban sprawl metrics around non-urban pixel for year 2018 and 4) Integration of the predicted metrics using evidence pooling to predict the pixel transforming to urban in future. Erdas Imagine 8.5 is used for taking training and test sets for classification and prediction. Matlab 7.6 software is used implementing NNs, derivation of metrics and evidence pooling.
Figure 2: Workflow of the FTDNN and evidence pooling based urban sprawl prediction
3.1. Land Use Land Cover Classification
Parametric image classifiers like maximum likelihood classification make assumptions from the training data and hence a non-parametric approach is used in this study. Artificial Neural Network (ANN) is gaining importance among researchers in the field of non-linear mapping and hence ANN based classification is performed based on the spectral values from LANDSAT TM data. MATLAB 7.6, image processing software was used for the classification. Using ERDAS IMAGINE software 900 pixels were selected as the training data on the 1991, 2000 and 2009 TM images (150 pixels for each class). The training data is exported to the Matlab to run ANN for classification. Multi-Layer-Perceptron (MLP) neural network with back-propagation learning algorithm was applied in the classification with a

A neural-evidence pooling approach to predict urban sprawl using multi-temporal remote sensing data
Menaka Chellasamy
International Journal of Geomatics and Geosciences
Volume 5 Issue 3, 2015 463
learning rate of 0.3, momentum of 0.3, epoch of 10,000 and a structure of 6:10:10:1 for classifying spectral information, which refers to number of nodes in input, hidden and output layer, respectively. Six classes were mapped, namely, water, Agricultural land, Scrubland, wasteland, road and urban (including residential, industrial, and commercial areas) based on the capability of image interpretation of the TM. The classification error matrix with 50 samples of test pixels for each class was constructed for the land-cover classification for 1991, 2000 and 2009 images.
3.2. Derivation of urban sprawl metrics
Urban sprawl metrics that characterize the urban growth pattern are used for prediction of sprawl which makes this study a unique from others since these metrics are always used to quantify the urban growth in the existing literatures (Almeida et al. 2007; Galster et al. 2001). These metrics are derived for each pixel using LULC images after converting them to images having two classes namely urban and non-urban. Pixels belonging to water class are excluded from the three images. The spatial unit of window size 7x7 is considered around each non-urban pixel and the metrics namely Shannon’s entropy, Aggregation index, Density, Proximity, and Nuclearity are calculated within the window.
Shannon’s entropy: Shannon’s entropy (Hn) is the measure of the degree of dispersion or concentration of a random geographical variable, i.e. the urban pixel in terms of urban sprawl (Li and Yeh 2004). Shannon’s entropy is calculated using the formula:
(3.2.1)
where Pi is the probability or proportion of occurrence of a urban pixel in the ith spatial unit out of units within 7x7 window, and it is given by:
(3.2.2)
where Xi total number of urban pixels in the 7x7 window. The distribution of the urban pixel which indirectly signifies population and property in the spatial unit is estimated by entropy. Aggregation Index: The Aggregation Index (AI) indicates how often pair of patches of the same class shows up side by side on each pixel (Almeida et al. 2007). For this study all the urban pixels within each spatial window are considered to compute the connectivity between urban pixels. This gives us the idea about the presence of urban cluster within the window. Higher AI represents the presence of urban cluster within the spatial unit. The formula for AI is given by:
(3.2.3) where gi is the number of adjacencies between pixels of urban class in ith , 7x7 window and maxg is the maximum number of adjacencies between pixels of urban class.
Density: Density is an index which is used to examine the homogeneity/dispersion of any spatial phenomena, like urbanization (Galster et al. 2001). In other words density represents the distribution of urban growth within the spatial unit. Formula to calculate Density is:
(3.2.4)

A neural-evidence pooling approach to predict urban sprawl using multi-temporal remote sensing data
Menaka Chellasamy
International Journal of Geomatics and Geosciences
Volume 5 Issue 3, 2015 464
where Di is the density of urban class with in ith 7x7 window, Ui is the total number of urban pixels within ith 7x7 window, Xi is the total number of urban pixels in the window. Proximity to the transportation lines (Ki): In order to analyse the influence of the transportation lines (e.g. highways), percentage of urban pixels influenced by the neighbouring road pixel within the spatial unit of size 7x7 is calculated (Galster et al. 2001). Ki is expressed in relation to the degree of proximity to transportation lines. The higher was the values of Ki between two years of observation, the higher was the degree of urbanization in the spatial unit. If no road pixel is present in the window then ki will be assigned 0.
Percentage of urban influenced by the road between the year A and B is calculated as:
(3.2.5) Where Ki is the percentage of urban influenced due to proximity to road, UBi is the total number of urban pixels within the window in the year B and UAi is the total number of urban pixel in the year A (for e.g. A= 1991 and B= 2000 for our case) and ri is the number of road pixels present within ith window.
Nuclearity (Ni): Nuclearity tells us the amount of mono nuclear urban development within the area considered (Galster et al. 2001).This metric gives us the rate of spontaneous urban growth within the window which may breed to urban cluster in forth coming year. So nuclearity plays a major role in predicting urban growth.
It is given by: (3.2.6) where Ni is the nuclearity within each ith 7x7 window, ni is number of mono urban nuclei with in ith 7x7 window, Xi is the total number of urban pixels in the window. 3.3. Time series prediction using FTDNN
The urban sprawl metrics that are explained in the previous section are derived from the LULC images of three years namely 1991, 2000 and 2009. Metrics derived have been normalized to the range of 0~1 and used for providing the training data sets needed for the development of the FTDNN. Each metric derived for LULC data 0f 1991, 2000 and 2009 are converted into linear array. Focused Time Delay Neural Network (FTDNN) is basically dynamic feed-forward network with a tapped delay line only at the input layers. It belongs to the group of focused networks in which the dynamics appears only at the input layer of a static multi-layer feed- forward network, making it suitable for time series prediction (Weigend 1994). FTDNN is said to consist of a memory structure and non-linear associator. The memory structure is a time delay line which containing the ‘p’ most recent inputs generated by the delay element represented by the operator ‘D’. The associator is the conventional feed-forward network. Relevant past information is hold by the memory structure and the associator uses the memory to predict future occasions. In this study three time series inputs of years 1991, 2000 and 2009 with delay element of 9 years is used and the FTDNN predicts for the year 2018. FTDNN training: Figure 3 depicts the architecture of a FTDNN explaining its structure and different transfer functions used for prediction. The FTDNN for prediction has to be developed and implemented for each metric. The number of iterations needed during the

A neural-evidence pooling approach to predict urban sprawl using multi-temporal remote sensing data
Menaka Chellasamy
International Journal of Geomatics and Geosciences
Volume 5 Issue 3, 2015 465
training procedure of the network depends on the structure of the network and the number of tapped delay line and transfer functions to achieve the target Mean Square Error (MSE).
Figure 3: Architecture of FTDNN showing prediction of density metric for 2018
using density metric of 1991, 2000 and 2009.
In this study, Levenberg-Marquardt learning process is used in the network by which MSE of 0.0001 can be achieved. The FTDNN model successfully achieved the target MSE after 52 iterations with lesser time for training. After training, the network is tested with the few samples. The test error is also calculated and both training and testing error are cross checked to see the difference between them. A well trained network with acceptable generalization difference of error with test data is obtained and the complete set of all the urban driving metrics driving are passed through the same architecture and best training weights and biases. The network will predict the value of metrics for the year 2018. These predicted values around non-urban pixel of 2009 are considered as evidences and evidence pooling is applied to find which among them changes to urban pixels in 2018.MSE is the sum of squares of the error between the network output (YP) and the desired response (YO) on the training data set and defined as:
(3.3.1)
3.4. Integration of metrics using Evidence Pooling
Evidence pooling also called as Endorsement theory (Cohen 1985) is usually used to handle the situations that involve multiple sources to come to a conclusion. It can work with incomplete and uncertain information and expresses the degree of acceptance and ignorance for particular information for decision making. Based on the outputs from the NNs, the beliefs are provided with names and are ranked depending on the degree of evidence acceptance and ignorance given by the probabilities: Conclusive-belief (Positive: [0.9-1], Negative: [0-0.1]), Prima-facie (Positive: [0.8-0.9], Negative: [0.1-0.2]), Strong (Positive: [0.7-0.8], Negative: [0.2-0.3]), Weak (Positive: [0.5-0.6], Negative: [0.3-0.4]) and Contradictory (0.4-0.5). Evidences of various strengths are integrated according to set of heuristics (Aitkenhead et al. 2003) by combining the belief and disbelief to create conclusions against each class: Definite (conclusive evidence), Confident (prima facie evidence), Likely (strong evidence), Indicated (weak evidence) and Contradictory (equally balanced/no evidence). The output of 5 different evidences (predicted values of 5 metrics) ranges from [0-

A neural-evidence pooling approach to predict urban sprawl using multi-temporal remote sensing data
Menaka Chellasamy
International Journal of Geomatics and Geosciences
Volume 5 Issue 3, 2015 466
1] obtained from FTDNN. These evidences for a non-urban pixel are combined together to produce one among the above mentioned conclusions to decide urban and non-urban class for pixels in the year 2018. The hypothesis with the highest priority among two classes namely urban and non-urban is said to be the clear winner. There are many factors influencing urban growth (Esnard and Yang 2002) such as transportation, urban cluster, urban nuclei etc., It is possible to identify which metrics contributed strongly to make a final conclusion thereby this approach also aids to identify the factors that may influence the future urban growth. Non-urban pixels in 2009, whose metrics producing conclusion of definite and confident positive are assigned to urban class in 2018. Type of LULC is checked for pixel producing likely positive conclusion and for the non-urban pixel belonging to agricultural land use will be assigned to urban class and other pixels are non-urban in 2018. An example to illustrate this integration by considering four different cases is shown in Table 1. In case no. 1, the highest positive evidence is obtained from the proximity metric hence conclusion of definite positive for urban class is obtained for this pixel. This implies that the probability of this non-urban pixel seems to be definite positive to change in to urban class that is influenced by transportation. Similar kind of interpretation can be done for case 2 and 3. Whereas in case 4. The highest negative evidence of negative prima-facie is obtained from Shannon’s entropy and nuclearity which leads to a conclusion of confident negative for urban class. Hence the pixel will be assigned as non-urban class in 2018. Table 1: Illustration of evidence pooling based on predicted metrics of 2018 for urban class
(PV: Predicted Value)
Col. Names
Case No.
1 2 3 4
PV
Evidences
PV
Evidences
PV
Evidences
PV
Evidences
Shannon’s entropy
0.712
Strong
positive
0.429
Contradictory
0.404
Contradictory
0.153
Negative
prima facie
Aggregation Index
0.527
Weak
positive
0.747
Strong
positive
0.846
Positive prima-facie
0.228
Strong Negative
Density
0.201
Strong
negative
0.546
Weak positive
0.925
Positive
conclusive
0.203
Strong negative
Proximity
0.912
Positive
conclusive
0.541
Weak positive
0.931
Positive
conclusive
0.311
Weak negative
Nuclearity
0.515
Weak
positive
0.486
Contradictory
0.246
Strong Negative
0.100
Negative
prima facie
Conclusion
Definite positive
Likely positive
Definite positive
Confident negative
Output class
Urban
Urban
Urban
Non-urban
Factors
influencing
urban growth
Transportation
Urban cluster (city)
Transportation and urban
cluster
-

A neural-evidence pooling approach to predict urban sprawl using multi-temporal remote sensing data
Menaka Chellasamy
International Journal of Geomatics and Geosciences
Volume 5 Issue 3, 2015 467
3.5. Comparison with SLEUTH model
SLEUTH is a pattern based model developed by the USGS and researchers at the Universities of California, Santa Barbara. SLEUTH is a CA model of urban growth and land use change which couples of two CA’s together and calibrates for historical time sequences using Geo-computational methods. This method produce simulations results using different combinations of parameter values, and then compare each result with real historical data to determine the best matching combination. The SLEUTH model simulates change from non-urban to urban, based on local factors (e.g.: topography, existing urban and roads), temporal factors, and random factors. SLEUTH model simulates four type of growth: (1) Spontaneous, (2) New spreading Centre, (a) Edge, and (4) Road-influenced. The model is implemented in CYGWIN platform in windows operating system. A list of the input layers is prepared using ArcGIS version 9.1. The model is calibrated through a brute force Monte Carlo method and urban land use for 2009 is predicted using input layers from 1991 and 2000. The predicted output is compared with the output of the proposed methodology and actual output using PCM and spatial correlation. Though new methods for urban sprawl prediction have been developed, SLEUTH is the model which has been widely used and able to map urban sprawl influenced by different factors. Hence comparison is focused between SLEUTH and proposed model and not with other existing NN based models.
4. Results and discussion
4.1. LULC classification
The classification of LANDSAT TM obtained in 1991, 2000 and 2009 utilizes MLP network and BP learning algorithm for training and classifying. The classifier produced the results (Figure 4) having accuracy more than 90% (overall classification accuracy of 1991: 92.0%, 2000: 94.6% and 2009: 95.6%). Development of the taluk induced large changes in LULC in villages namely Keeranallur, Thirumudivakkam, Vadamangalam and Nattarasampattu. The number of population of the study area was 78089 in 1991 and increased to 902126 in 2009. It is noted that during the entire study period from 1991 to 2009, the urban area is found to expand from 12.70% to 22.6% of the total study area, doubling in 18 years approximately. Especially 7% of increase in urban landuse is observed in Orathur due to the establishment of Hyundai car company in 1999 and 4.3% of increase in urban land use is observed in Navaloor due to the construction like Nokia, Saint-Gobian and Samsung etc.,. On the other hand, the proportion of agricultural land decreased from 51.1% to 36.3% changing into wasteland and urban in the study area. 31% of wasteland is observed to change into urban from 1991 to 2009 turning this suburban town in to a large industrial hub.
Metrics around non-urban pixels in 2009 are predicted for the year 2018 based on time series criteria by FTDNN using 250 training samples for each. Final urban land use for 2018 (Figure 5a) is obtained after integrating the evidences from the predicted metrics. Mostly the land use belongs to wasteland and agricultural lands are expected to be converted in to urban in 2018. Totally 12065 non-urban pixels are expected to be transformed to urban in the year 2018 and the percentage of urban land use in 2018 may increases to 35.1%. Most of the wastelands in nearby villages to Navaloor, vadamangalam and keeranallur is found to be transformed in to urban which does not has basic amenities like proper drainage system, hospitals etc.

A neural-evidence pooling approach to predict urban sprawl using multi-temporal remote sensing data
Menaka Chellasamy
International Journal of Geomatics and Geosciences
Volume 5 Issue 3, 2015 468
Figure 4: Land Use Land Cover images of the study area for input observation period based on Multi-Layer-Perceptron neural classifier
Figure 5: (a) Urban land use in 2018 predicted based on the proposed methodology
(b) Average value of urban sprawl metrics calculated within 20x20 spatial
windows at different locations.
A neural-evidence pooling approach to predict urban sprawl using multi-temporal remote sensing data
Menaka Chellasamy
International Journal of Geomatics and Geosciences
Volume 5 Issue 3, 2015 469
Maps of the derived metrics are not shown and discussed due to page limitation. Rather the derived urban sprawl metrics are analysed and discussed in the selected areas for better understanding. The derived metrics are useful to categorize the predicted urban growth such as growth influenced by road, urban cluster, urban nuclei etc. Mean value of the five metrics value within spatial unit of 20x20 at four different areas where predominant transformation is observed is shown in the Figure 5b. Value of Shannon’s entropy values within the four spatial units are above 0.5 which implies the progression of the sprawl in a particular area. Lesser values would signify that an area is becoming less fragmented and homogenously covered, thus, further occurrence of urban land use should not happen.
Higher the entropy for the pixel, the pixel is likely to become urban which means that the development can occur in the particular spatial unit. The higher value of AI within the spatial unit of Kollacheri and Arrampakkam village implies urban sprawl is possible due to its proximity to urban cluster. The higher density within the window explains the higher occurrence of present urban land use which increases the probability of transforming near non-urban to urban class. Mean density value higher than 0.5 is noted in Kollacheri, Seerumangadu and Arrampakkam. Main urban nuclei present a more stable behaviour, with mild oscillations. Mean value of proximity is higher in Kollacheri and Seerumangadu villages due its neighbourhood with Asian Highway (AH 45) and two or more state highways. Higher nuclearity within the spatial unit of Kunnam village is observed which implies that higher probability to change non-urban pixel in to urban pixel exists because of more number of fragmented individual houses within the area. Proximity value is lower in Kunnam village because of the absence of national highways in its neighbourhood but the area has enough rural and urban roads nearby which could not be mapped in LANDSAT image of 30m spatial resolution.
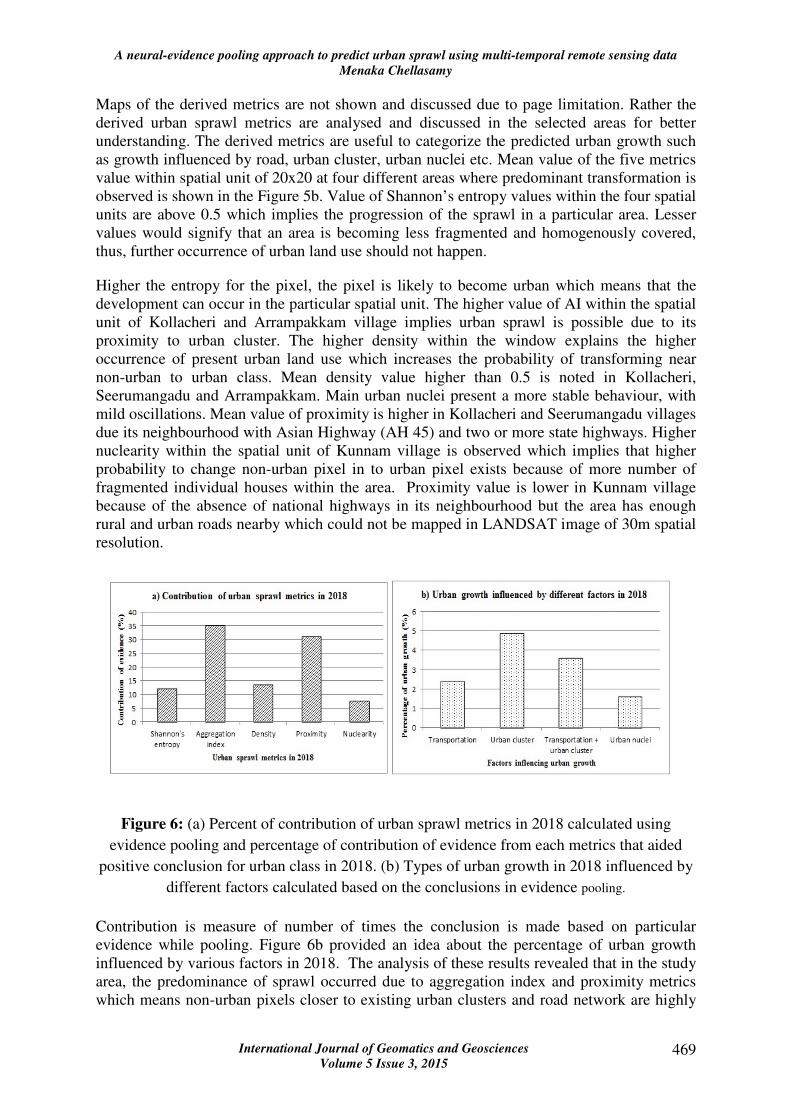
Figure 6: (a) Percent of contribution of urban sprawl metrics in 2018 calculated using
evidence pooling and percentage of contribution of evidence from each metrics that aided
positive conclusion for urban class in 2018. (b) Types of urban growth in 2018 influenced by
different factors calculated based on the conclusions in evidence pooling.
Contribution is measure of number of times the conclusion is made based on particular evidence while pooling. Figure 6b provided an idea about the percentage of urban growth influenced by various factors in 2018. The analysis of these results revealed that in the study area, the predominance of sprawl occurred due to aggregation index and proximity metrics which means non-urban pixels closer to existing urban clusters and road network are highly

A neural-evidence pooling approach to predict urban sprawl using multi-temporal remote sensing data
Menaka Chellasamy
International Journal of Geomatics and Geosciences
Volume 5 Issue 3, 2015 470
expected to transform to urban class. Within 12.5 % of increase in urban land use from 2009 to 2018, 4.9% of urban land use is due to urban cluster. 3.6 % of urban landuse are found to be influenced by both nearby transportation and urban. In addition to an airport in Chennai city, plan for a second airport in Sriperumbudur, near Chennai was announced in the year 2009. Facilities in Sriperumbudur, should be capable of handling up to 5 million people annually. Also announcement of rail line connecting Kanchipuram-Sriperumbudur-Avadi-Gummipoondi is done from the central government. This may also result in expansion of new settlement area. Before commencing all development projects, the available resources in the study area should be thoroughly checked so that new urban land uses do not create negative impacts on environment in the study area.
Figure 7: (a). Actual urban land use derived from LULC image of 2009 based on neural classifier, (b) SLEUTH model based predicted urban land use in 2009, (c) FTDNN and evidence pooling based predicted land use in 2009.
4.3. Model accuracy assessment
Assessment of model helps in determining whether the proposed model gives the effective result in relation to present day data. The set of LULC images of 1991 and 2000 are used to predict urban growth in the study area during 2009. The predicted result is compared with the actual transformation of non-urban to urban land use using LULC image of 2009 accurate produced by MLP which is 95.6% using Percent Correct Match and spatial correlation. The model is also compared with the predicted output of the conventional model SLEUTH.

A neural-evidence pooling approach to predict urban sprawl using multi-temporal remote sensing data
Menaka Chellasamy
International Journal of Geomatics and Geosciences
Volume 5 Issue 3, 2015 471
Figure 7 shows the actual urban land use and predicted urban land use by proposed and SLEUTH model. Higher PCM of 81.28% and correlation value of 0.90 is achieved by the proposed technique in relation to the actually transformed pixels to urban land use compared to SLEUTH model which achieved PCM of 78.72% and Spatial correlation of 0.71. Defining transition rules and modelling always have a problem of difficulty in SLEUTH model. CA based model is designed to simulate and predict urban land use change in real situations that are generally based on the utilization of statistical techniques to compute the land use change probabilities. In contrast to this method, FTDNN arise as an alternative to assess such probabilities by means of non-parametric approaches. Defining parameter values for assessing the relative importance of the intra-urban land use change drivers in SLEUTH model is done upon basis of trial and error approaches, and 78.72 % prediction match is obtained which is lower than FTDNN.
5. Conclusion
A new approach to predict the urban growth based on potential use of multi-temporal remotely sensed imagery without difficulty of defining transition rules or parameter is presented in this study for urban growth prediction in Sriperumbudur taluk. The prediction technique utilizes Focused Time Delay Neural Network (FTDNN) and evidence pooling and reduces the prediction error compared to the SLEUTH model and allowed quantifying different types of future urban growth. The predicted results shows that agricultural land use is depleting with increase in urban land use where the city planners has to take necessary steps to tackle this changes in LULC and avoid negative impacts in the study area. It is still questionable whether the selected spatial variables and parameters are adequate for predicting the urban growth and further study is needed. Suitable methodology to quantify socio-economic factors including population data which also play important roles in urban growth should also be studied and adopted in the model. The delay lines in FTDNN are constant in this study which involved satellite images having equal temporal period. This is not always possible in absence of such kind of data having same temporal period. In the future study FTDNN with variable delay lines will be developed and tested for prediction.
Acknowledgement
We are very much thankful to the Management and Institute of Remote Sensing in College of
Engineering for their support and assistance to carry out this work.
6. References
1. Aitkenhead, M., McDonald, A., Dawson, J., Couper, G., Smart, R., Billett, M., Hope, D., & Palmer, S. (2003), A novel method for training neural networks for time-series prediction in environmental systems. Ecological modelling, 162, pp 87-95.
2. Alberti, M. (1999), Modeling the urban ecosystem: a conceptual framework.
Environment and Planning B, 26, pp 605-630.
3. Almeida, C.M.d., Alves, C.D., Pereira, M.N., Miglioranza, E., Tomás, L.R., Epiphanio, J.C.N., Galvão, L.S., & Fonseca, L.M.G. (2007), Morphological metrics and unsupervised neural networks to analyse urban sprawl and intercity commuting. Simpósio Brasileiro de Sensoriamento Remoto, 13 (SBSR), pp 5059-5066.

A neural-evidence pooling approach to predict urban sprawl using multi-temporal remote sensing data
Menaka Chellasamy
International Journal of Geomatics and Geosciences
Volume 5 Issue 3, 2015 472
4. Castella, J.-C., Boissau, S., Trung, T.N., & Quang, D.D. (2005a), Agrarian transition and lowland–upland interactions in mountain areas in northern Vietnam: application of a multi-agent simulation model. Agricultural systems, 86, pp 312-332.
5. Castella, J.-C., Trung, T.N., & Boissau, S. (2005b), Participatory simulation of land-
use changes in the northern mountains of Vietnam: the combined use of an agent-based model, a role-playing game, and a geographic information system. Ecology and Society, 10, p 27.
6. Cohen, P.R. (1985), Heuristic reasoning about uncertainty: an artificial intelligence
approach. In: University of Massachusetts
7. de Koning, G.H., Verburg, P.H., Veldkamp, A., & Fresco, L. (1999), Multi-scale modelling of land use change dynamics in Ecuador. Agricultural systems, 61, pp 77-93.
8. Demuth, H., & Beale, M. (1993). Neural network toolbox for use with MATLAB
9. Esnard, A.-M., & Yang, Y. (2002), Descriptive and comparative studies of the 1990
urban extent data for the New York Metropolitan Region. URISA Journal, 14, pp 57-62.
10. Galster, G., Hanson, R., Ratcliffe, M.R., Wolman, H., Coleman, S., & Freihage, J.
(2001). Wrestling sprawl to the ground: defining and measuring an elusive concept. Housing policy debate, 12, pp 681-717.
11. Hilferink, M., & Rietveld, P. (1999), Land Use Scanner: An integrated GIS based
model for long term projections of land use in urban and rural areas. Journal of Geographical Systems, 1, pp 155-177.
12. Houghton, R. (1994). The worldwide extent of land-use change. BioScience, pp 305-
313.
13. Kavzoglu, T., & Mather, P. (2003). The use of backpropagating artificial neural networks in land cover classification. International Journal of Remote Sensing, 24, pp 4907-4938.
14. Li, X., & Yeh, A.G.-O. (2004). Analyzing spatial restructuring of land use patterns in
a fast growing region using remote sensing and GIS. Landscape and Urban planning, 69, pp 335-354.
15. Nauck, D., & Kruse, R. (1997).A neuro-fuzzy method to learn fuzzy classification
rules from data. Fuzzy sets and Systems, 89, pp 277-288.
16. Pijanowski, B.C., Pithadia, S., Shellito, B.A., & Alexandridis, K. (2005). Calibrating a neural network‐based urban change model for two metropolitan areas of the Upper Midwest of the United States. International Journal of Geographical Information Science, 19, pp 197-215.

A neural-evidence pooling approach to predict urban sprawl using multi-temporal remote sensing data
Menaka Chellasamy
International Journal of Geomatics and Geosciences
Volume 5 Issue 3, 2015 473
17. Pontius Jr, R.G., Cornell, J.D., & Hall, C.A. (2001). Modeling the spatial pattern of land-use change with GEOMOD2: application and validation for Costa Rica. Agriculture, Ecosystems & Environment, 85, pp 191-203.
18. Reed, R.D., & Marks, R.J. (1998). Neural smithing: supervised learning in
feedforward artificial neural networks: MIT Press.
19. Theobald, D.M., & Hobbs, N.T. (1998), Forecasting rural land-use change: a comparison of regression-and spatial transition-based models. Geographical and Environmental Modelling, 2, pp 65-82.
20. Verburg, P.H., De Koning, G., Kok, K., Veldkamp, A., & Bouma, J. (1999). A spatial
explicit allocation procedure for modelling the pattern of land use change based upon actual land use. Ecological modelling, 116, pp 45-61.
21. Weigend, A.S. (1994). Time series prediction: forecasting the future and
understanding the past. Santa Fe Institute Studies in the Sciences of Complexity