a new analytical tool for forex trading1 - ecomod.net apsari, aghnia - ecomod 1017.pdfa new...
TRANSCRIPT

1
ANewAnalyticalToolforForexTrading1
ImanGunadi,ApsariDharmesti,AghniaYurizkanti2
PreliminaryDraftJune2017
AbstractPredictingcurrencymovementisveryimportantforinvestorswhofaceexchangeraterisksintheirinvestments.Unfortunately,themostofexistingtoolsthatareusedasaguidancedonotcontainanyinformationaboutthefuture.Mostexistingtoolsusepastperformanceinpredicting thresholdsor supportand resistance levels.Theydonot take intoaccountinvestors’ reviewson economic forecasts ormarket dealers’ sense in predictingmarketevents.Tofillthisgap,thisstudytrytobuildanalternativeanalyticaltooltosetsupportand resistance levels that is more consistent with economic and market forecasts oroutlooks.Thisstudyusesomesimulationanalysesandcomparativestudiesusingseveralcountries(Brazil,India,Indonesia,Malaysia,Philippine,Russia,ThailandandTurkey)dataandthencombine those data with some market analyst reviews related to those countries toproduceanewanalyticaltool.Usingdatafrom2014until2016,thestudyfoundthatthenewanalyticaltoolperformsbetterthanexistingtools.Therefore,itcanbeusedasamoreappropriateguidanceforinvestorsforreducingcurrencyriskintheirinvestments.
JELClassificationNumbers:E44,E47,F31,F37,G11
Keywords:forextrading,bollingerband
1TheviewsexpressedinthisWorkingPaperarethoseoftheauthor(s)anddonotnecessarilyrepresentthoseofBankIndonesiaorBankIndonesia’spolicy.WorkingPapersdescriberesearchinprogressbytheauthor(s)andarepublishedtoelicitcommentsandtofurtherdebate.2TheauthorsareDeputyDirector,ManagerandAssistantManager,respectively,intheMonetaryManagementDepartmentofBankIndonesia.TheauthorswouldliketothankreviewersinseveraldepartmentsofBankIndonesiaforextensivecomments.Allremainingerrorsareours.

2
I. Introduction
Nowadays,investorsaremuchmoresmarterthantheywereinthepast.Ininvestingtheir
capital,theywillinvestinseveralportfoliosinseveralfinancialmarketsinseveralcountriesto
gain an optimum return. As they can involve in severalmarkets, investors have an ability to
arbritageamongthosemarkets.Capitalcantransformfromoneportfoliotootherportfoliosand
fromone currency to other currencies. As a consequence, capitalmoves very fast from one
financialmarkettoanotherintheformofanycurrencies.Inoneday,ahugeamountofmoney
andmillion transactionsare involved in financialmarkets.Alongwithhigherpotential return,
investingtheirmoneyinmanymarketsinmanycountries,investorswillalsofacesomerisksthat
leadtoalowerreturn.Evenmore,theirmoneywillshrinkiftheyinvestcarelessly.
Therearemanyrisksinfinancialmarkets,suchascreditrisk,marketrisk,interestraterisk,
liquidityrisk,policyrisk,operationalrisk,currencyriskandsoon.Oneofthemostcommonrisks
in investment is currency risk. Fluctuation in currency rates can causeprofitor losswhenan
investorhasexposureto foreigncurrencyor in foreign-currency-traded investmentsalthough
thecurrencyvalueinwhichtheunderlyinginstrumentisregistereddoesnotchanges.Currency
riskitselfdefinedasthepotentialriskoflossfromexchangeratefluctuation.Inordertolower
currencyrisk,investorscandohedgingorothertechniquedesigntooffsetanycurrencyrelated
gains or loses (Kuepper, 2017).Normally, a combination of forex forwards and options let on
investors to fixcurrency riskwithin tolerable levelsas longaspremiumsare reasonable.This
hedging techniques are not continually powerful, though diversification into many major
currenciescanhelplimitthisrisk.

3
Toavoidlosstheirmoney,investorswillcollectallrelevantinformationtoenhancereturn
for their investments. Information is very important to decide howmuchmoney should be
investedinoneportfoliooranother.Informationalsowilltellinvestorswhichmarketsaregoing
to be bullish or bearish. In general, information can be devided into two factors, namely
sentiment factor (rumours) and fundamental factor. These two factors influence markets
frequentlyandgivesignificantimpactonreturnofinvestments.However,investorscouldalso
bedefinedintotwotypes,namelylongterminvestorsandshortterminvestors.Usually,longor
mediuminvestorswillconcernaboutfundamentalfactorsofmarketsandcountrieswherethey
invest.Theydoesnotreallyconcernaboutsentimentfactorsbecausetheyinvestinalongperiod.
In contrary, short term investorswill concernboth fundamental and sentiment factors.
Thesetypesofinvestorsmovestheirinvestmentsfromonemarkettoothermarketquiterapidly.
Theywillcometoinvestinportfoliousuallyinashortperiodwhichdependmostlyongoodnews
in themarket. This condition could lead currencymovement toone sidebecauseof herding
behaviourof investors.Also inashortterm,theycouldmovetotheoppositedirectionifbad
newssuddenlyappearorthepreviousgoodnewsdonotmeettheirexpectations.Thissituation
makescurrencyswingandalsocalledahighcurrencyvolatility.
Inordertoanalysecurrencymovement, investorshaveanumberoftoolsforpredicting
currencymovement. Ingeneral,asanadditiontoglobalmarketview, investorsmostlyadopt
severaltechniqueswhicharewidelyavailableinfinancialmarketfortechnicalmethodsuchas
Bollingerband,MACD3andmanyothers.However,inpredictingdailycurrencymovement,most
3MACD=movingaverageconvergenceanddivergence

4
ofexistingtoolsdonothaveacapabilitytodothejob.Inaddition,itisverydifficulttobuilda
sophisticatedmodeltosupportforextrading.Thus,usingcharts,paterns,simplecalculationsand
othersimpletoolsthatareabletobeproducedquicklyarethemostpreferable.
Almostall analytical tools areable tobea risk guideline for investorswho investusing
particularcurrency.Forexample,wheninvestorsinvesttheirmoneyinonecountry,theycanuse
Bollingerbandtomeasurecurrencyriskoftheinvestment.Theyalsocanseehowclosecurrent
currencyleveltoitssupportingorresistancelevel.Thisinformationisusedtodecidewhether
they have to make portfolio adjustment or not. However, most available tools using past
performanceinpredictingsupportandresistancelevel.Thoseexistingtoolsdoesnottakeinto
accountinformationneededfor investorsthathavebeenmentionabove.Furthermore,those
existing tools alsoneglect current condition, fundamental economy,peer countries’ currency
movement and so on. Most available tools do not cover analyst review or dealer sense in
predictingmarket event. Hence, it needs some adjustment to get themore suitable tools in
predictingfutureevent.
Therefore,thispaperfocusonhowtocombinehistoricaldatawithmarketforecastand
informationincludingfundamentalandsentimentfactorsinordertobuildanewanalyticaltool.
Therefore, thisnewanalytical tool isexpected togivea forecastof currencymovement.This
alternative tool couldbesimilarordifferentwith theexisting tools suchasBollingerbandor
others.Itdependsonhowamarketanalyst’sviewabouttheoutlookofmarkets.Ifthemarketis
abouttoconsolidatethenthisnewtoolcouldbesimilarwithBollingerbandorothers.Hence,
thisnewanalytical toolneedstobetestedwithempiricalstudiesusingdataset fromseveral
countries.Inthisstudy,datafromsomeemergingcountriesareusedforseveralreasons.Apart

5
fromthetechnicalissuessuchasaccessibilityofthedata,thoseobservedcountriesshowedquite
similarreactiontomarketsentimentsincurrencymovement.
Thisstudywillevaluatewhethertherealcurrencymovementfromobservedcountriesare
movinginsidethenewtool.Inevaluatingthosemovement,thisstudywilluseasetofdatafrom
January2014toDecember2016.Thus,thisstudywillaccommodatemarketviewfromanalystin
believingtheircurrencymovementagainstUSDinoneprobabilitywhichcoveredtheirviewfrom
globalanddomesticfactors.
Thisstudywillbedividedintoseveralparts.Afterintroductionatthefirstpart,thisstudy
willexploresomeliteratureswhichpresentedsomeexistingtoolsforforextradingbandatthe
secondpart.Thirdpartwillexplainedthemethodologyusedinthisempiricalstudy.Fourthpart
willtalkaboutthedatathatusedinthisstudy.Inthispartalsowilldiscussabouttheresultofthe
exerciseddata.Then,fifthpartisaconclusion.
II. LiteratureStudies
Inthefinancialmarket,eitherstockmarketorcurrencymarket,peoplecommonlymixed
a chartistwith technical analyst.A chartist analyzesprice chartsonly,while technical analyst
studiestechnicalindicatorsderivedfrompricechangesinadditiontothepricechart.4According
tothatdefinition,technicalanalystscrutinizesthepriceactionofthefinancialmarketsinsteadof
thefundamentalfactorsthatseemtoaffectmarketprices.Itisbecausethereisbelievethatall
4CreditSuisse,TechnicalAnalysis–Explained,GlobalTechnicalResearchandBehavioralFinance.Zurich:(https://www.credit-suisse.com/pwp/pb/pb_research/technical_tutorial_de.pdf)

6
the relevant market information is reflected (or discounted) in the price. There are several
technical analysis thatare commonlyusedby investors. These technical analyses showsome
resistanceandsupportlevelsforhistoricaldata.Someofthemusepattern(triangles,flagsand
doublebottoms)todetermineresistanceandsupportlevels(seefigure1).Therestofthemusing
econometricsorsimplymathematicapproach,suchasmovingaverageincludingBollingerBand
andMACD,stochastic,index5andothers.
Figure1.ExampleofPatterninTechnicalAnalysis
Source:http://www.mrao.cam.ac.uk/~mph/Technical_Analysis.pdf
OneofthemostpopulartechnicalanalysisinforeignexchangemarketisBollingerband.
BasicallyBollingerBandprovidestradingbandforinvestorandanswerswhetherpricesaretoo
highortoolowonarelativebasis.Bollinger(1992)explainedthatBollingerbandareplottedtwo
standarddeviationsaboveandbelowasimplemovingaverage.Bollingerbandshows foreign
5RelativeStrengthIndex.

7
exchange move within corridor on daily basis. Usually, Bollinger band is used to look at a
momentum of currency’s movement at one period. Therefore we can predict whether the
observedcurrencyhasatendencytocontinueatcurrentmoveorithasreachedasupportor
resistancelevel.Inthiscase,theobserversdonothaveanycapabilitytobreakthelevel.
Figure2.BollingerBandinTechnicalAnalysis
(source:Bloomberg2017)
Bollinger(2001)statedthatstandardBollingerBandformulasasfollows:
𝑈𝑝𝑝𝑒𝑟𝑏𝑎𝑛𝑑 = 𝑀𝑖𝑑𝑑𝑙𝑒𝑏𝑎𝑛𝑑 + 2 ∗ 𝑠𝑡𝑎𝑛𝑑𝑎𝑟𝑑𝑑𝑒𝑣𝑖𝑎𝑡𝑖𝑜𝑛
𝑀𝑖𝑑𝑑𝑙𝑒𝑏𝑎𝑛𝑑 = 20𝑝𝑒𝑟𝑖𝑜𝑑𝑚𝑜𝑣𝑖𝑛𝑔𝑎𝑣𝑒𝑟𝑎𝑔𝑒
𝐿𝑜𝑤𝑒𝑟𝑏𝑎𝑛𝑑 = 𝑀𝑖𝑑𝑑𝑙𝑒𝑏𝑎𝑛𝑑 − 2 ∗ 𝑠𝑡𝑎𝑛𝑑𝑎𝑟𝑑𝑑𝑒𝑣𝑖𝑎𝑡𝑖𝑜𝑛

8
Accordingtoitscalculationbase,BollingerBandsometimesisusedtoidentifyperiodwherehigh
volatilityor lowvolatilityhappened.Thewidthof thebandsgetnarrowerduring lessvolatile
periodandviceversa.Hence,itcanidentifiedperiodwhenpricesareatextremeandpossibly
unstablelevels.
Other popular technical analysis in foreign exchange market is Moving Average
ConvergenceDivergence(MACD).Thismethodwasdevelopedin1970sbyGeraldAppelasan
indicatorofthechangeinasecurity’sunderlyingpricetrend(Grimes,2012).MACDcommonly
calculatedbytheformulaasfollows;
𝑀𝐴𝐶𝐷𝐿𝑖𝑛𝑒 = 12𝑑𝑎𝑦𝐸𝑀𝐴 − 26𝑑𝑎𝑦𝐸𝑀𝐴
𝑆𝑖𝑔𝑛𝑎𝑙𝐿𝑖𝑛𝑒 = 9𝑑𝑎𝑦𝐸𝑀𝐴𝑜𝑓𝑀𝐴𝐶𝐷𝐿𝑖𝑛𝑒
𝑀𝐴𝐶𝐷𝐻𝑖𝑠𝑡𝑜𝑔𝑟𝑎𝑚 = 𝑀𝐴𝐶𝐷𝐿𝑖𝑛𝑒 − 𝑆𝑖𝑔𝑛𝑎𝑙𝐿𝑖𝑛𝑒
EMAstandsforexponentialmovingaveragewhicharesimilartomovingaverage,exceptthat
moreweightaregiventothelatestdata.Consequently,thistypeofmovingaveragetakesfaster
torecentpricechangesthatsimplemovingaverage.Thus,theinteraction,whethercrossoveror
divergence,betweenMACDlineandsignallinethattechnicalanalystlookfor.Assuggestedby
its name, MACD is distressed with the convergence and divergence of the two exponential
movingaverages.Hence,themainpurposesoftheanalysisistoidentifyturningpointsinatrend
byfocusingonitsdivergenceandconvergence.

9
Figure3.MovingAverageConvergenceDivergence(MACD)inTechnicalAnalysis
(source:Bloomberg2017)
Relative Strength Index (RSI) is an analysis developed by J.WellesWilder, to identify
overbought and oversold conditions by measuring velocity of security’s price movement
(Hayden,2004).Fortechnicalanalystsortraders,usingRSItorecognizepotentialturningpoints
helpsthemtomakeentryorexitdecision.ThevaluesofRSIarecalculatedfromeitherclosing
pricesoryields.Hayden(2004)describedthereareonlytwoequationinvolvedinRSIcalculation.
Thefirstparttoobtainisthevalueofrelativestrength(RS)whichistheratiooftheaverageup
closestotheaveragedownclosesover“n”periodsasfollows,
𝑅𝑆 =𝐴𝑣𝑒𝑟𝑎𝑔𝑒𝑜𝑓 𝑁H H𝑑𝑎𝑦𝑠𝑐𝑙𝑜𝑠𝑒𝑠𝑈𝑝𝐴𝑣𝑒𝑟𝑎𝑔𝑒𝑜𝑓 𝑁H H𝑑𝑎𝑦𝑠𝑐𝑙𝑜𝑠𝑒𝑠𝐷𝑜𝑤𝑛

10
Hence,theRSIcalculationcanbedescribebytheequationasfollows,
𝑅𝑆𝐼 = 100 −1001 + 𝑅𝑆
Figure4.RelativeStrengthIndex(RSI)inTechnicalAnalysis
(source:Bloomberg2017)
Other technical analysis that can be used is candlestick charting. Candlestick charting
originallyisJapanesetechnicalanalysisforricetraderinthe17thcentury.Manytradersbelief
thatcandlestickchartingtechniqueaccuratelyreflectsshort-termoutlooks.Moreoveritblend
perfectlywithnearlyallthetraders’commontechnicalanalysismethods.

11
Candlestickisformbyputtingtogetheropening,high,lowandclosingpriceofthedayin
oneverticalline.Whentheopeningpriceishigherthanclosingpricethenafilledcandlestickis
drawnwithdark color, usually black.On the contrary,when theopeningprice is lower than
closingpricethenahollowcandlestickisformed.Thelines,whichcanbeshortorlong,aboveor
belowthecandlerepresentsthehighorlowpricerangeandtheselinesareknownasseveral
names(shadows,tails,wicks).Thecandlemayormaynothaveshadows,tailsorwicks.
Figure5.CandlestickGraph
(Source:Bloomberg2017)
Apatterncanbeformedbyoneorseveralcandlesticks,butnotmorethanfive6.Mostof
the time, candle patterns show reversal patterns but they also help in projecting trends. A
6http://www.optionsuniversity.com/CandlestickSecrets/Book/candlesticksecrets.pdf

12
reversalpatternshowsthatthedirectionofastockisgoingtocurtailitsflowandattimesthis
conveysthatanuptrendordowntrendwillreverseitscourse
Incandlestick,Darsonoetal(2017)explainedthatDojiwasformedincandlestickchart
whenopeninglevelandclosinglevelareatthepricelevel.Dojiisthemostfamouscandlestick
amongalldifferentkindsofcandlesticksandDojiStaristhemostfamousDojipatternsinceits
reliabilityistoshowreversalsign.However,sometraderbeliefthatDojicandlesticksignaland
patternsaresometimestricky,thusaddinganothertoolstothechartcanavoidfalsesignal.In
combiningDojicandlestickandBollingerBands,traderlooksforDojicandlestickwhichhitthe
upperbandorlowerbandasaconfirmedreversalsignforthecurrencyorsecuritiesmovement.
Figure6.CombinationofDojiCandlestickandBollingerBandConfirmingReversalTrend
(Source:Investopedia2017)

13
III. Methodology
Theapproachusedinthenewmethodofdeterminingthetradingbandorexchangerate
corridor beginswithusing the exchange rateof thehighest and lowest transaction from the
previousperiodtodeterminetheexchangerateisexpectedtohappen(expectedexchangerate).
Hencetheexpectedexchangeratewouldbeusedasthereferenceforexchangeratecorridor.
Expectedexchangeratecanbedescribedinthefollowingequation.
(1) 𝑋 = 𝐻. ℎ + 𝐿 1 − ℎ
Where𝐻isthehighesttransactionrateofthepreviousperiod,𝐿isthelowesttransactionrate
ofthepreviousperiod,ℎrepresentstheprobabilityofcurrencydepreciationagainsttheUSDand
𝑋representstheexpectedexchangerate.Sinceℎrepresentsprobability,thenumberofℎcanbe
variedfrom0to1.
Furthermore,thisstudyusingthenumberofexpectedexchangeratetocalculatethe
widthofhalftradingband.Halfthewidthofthetradingbandwhichisdenotedby𝑌is
representedfromthefurthestdistancebetweentheexpectedexchangerate(𝑋)withthevalue
ofthehighesttransactionrate(𝐻)orlowesttransactionrate(𝐿).Thehalfwidthofthecorridor
canberepresentedbythefollowingequation.
(2) 𝑌 = max{𝐻 − 𝑋, 𝑋 − 𝐿}
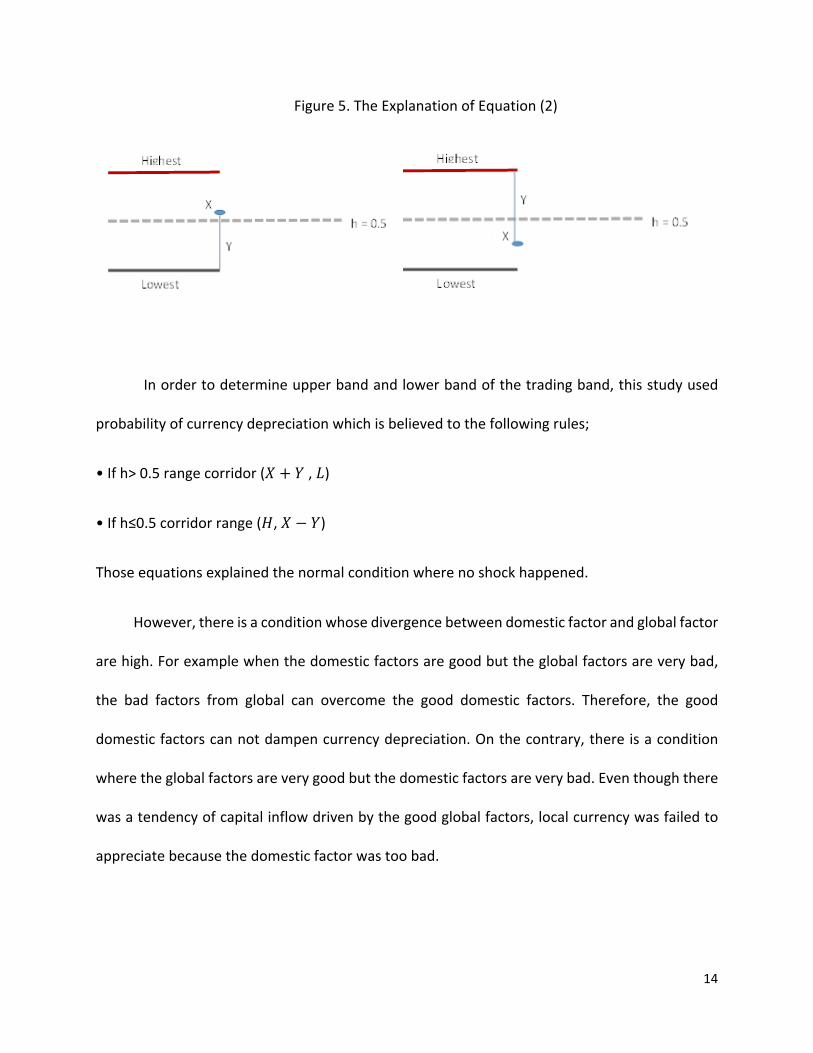
Thefollowingfiguregavetheideaofequation(2).
14
Figure5.TheExplanationofEquation(2)
Inordertodetermineupperbandandlowerbandofthetradingband,thisstudyused
probabilityofcurrencydepreciationwhichisbelievedtothefollowingrules;
•Ifh>0.5rangecorridor(𝑋 + 𝑌,𝐿)
•Ifh≤0.5corridorrange(𝐻,𝑋 − 𝑌)
Thoseequationsexplainedthenormalconditionwherenoshockhappened.
However,thereisaconditionwhosedivergencebetweendomesticfactorandglobalfactor
arehigh.Forexamplewhenthedomesticfactorsaregoodbuttheglobalfactorsareverybad,
the bad factors from global can overcome the good domestic factors. Therefore, the good
domesticfactorscannotdampencurrencydepreciation.Onthecontrary,thereisacondition
wheretheglobalfactorsareverygoodbutthedomesticfactorsareverybad.Eventhoughthere
wasatendencyofcapitalinflowdrivenbythegoodglobalfactors,localcurrencywasfailedto
appreciatebecausethedomesticfactorwastoobad.

15
Therefore,therewasaneedtoadjustthevalueofℎfromequation(1).Inthiscase,ℎwas
determinebytwofactors,globalanddomestic.Hence,ℎmightlessthanzeroorevenhigherthan
1.Symbolℎ∗willrepresentsthenewℎoradjusteddepreciationfactor.
Inordertocapturecurrencydepreciationfactorfrombothdomesticsideandglobalside,the
depreciationfactoristhesumofdomesticandglobalfactor.Hence,thedepreciationfactorcan
berepresentedbythefollowingequation.
(3) ℎ∗ = ℎU + ℎV
Whereℎ∗standsforadjusteddepreciationfactor,ℎU standsfordomesticdepreciationfactor
andℎVstandsforglobaldepreciationfactor.Thus,equation(1)becameadjustedasfollows
(4) 𝑋 = 𝐻. ℎ∗ + 𝐿 1 − ℎ∗
IV. DataandAnalysis
Data
ThisstudyusingseveralsetofdailydatafromemergingcountriessuchasBrazil,Malaysia,
Mexico,India,Indonesia,Philippine,ThailandandTurkeyfromJanuary2014toDecember2016.
Apartfromthetechnicalissuessuchasaccessibilityofthedata,thoseobservedcountriesshowed
quitesimilarreactiontomarketsentimentsincurrencymovement.
Next,equation(1)needsthevalueofprobabilityofcurrencydepreciationwhichrepresents
by ℎ. Instead of using continuous variables, this study used discrete variables to facilitate
classification market condition following investor’s pattern. This study classified ℎ to five

16
numbers (0.2; 0.4; 0.6; 0.8; 1.0) based on investor’s belief to depreciation of local currency.
Wheremarketisexpectedinconsolidationcondition,ℎissetto0.6.Meanwhile,ifexchangerate
is expected to appreciate, ℎis set to 0.2 (highly appreciation) or 0.4 (appreciation). And if
exchangerateisexpectedtodepreciate,ℎissetto0.8(depreciation)or1.0(highlydepreciation).
Prediction ℎHighlyappreciation 0.2
Appreciation 0.4Consolidation 0.6Depreciation 0.8
Highlydepreciation 1.0Table1.ℎbasedoninvestor’sbelief
Then,sinceℎ∗mightbeinnegativeterritoryorhigherthan1,itrequiredtransformation
probability of currency depreciation for global and domestic sentiments. Instead of using
continuous variables, this study used discrete variables to facilitate classification market
conditionfollowinginvestor’spattern.Thisstudyclassifiedglobalsentiments,ℎV,tofivenumbers
(0.2;0.4;0.6;0.8;1.0)basedoninvestor’sbelieftodepreciationoflocalcurrency.Wheremarket
isexpectedinconsolidationcondition,ℎVissetto0.6.Meanwhile,ifexchangerateisexpected
toappreciate,ℎVissetto0.2(highlyappreciation)or0.4(appreciation).Andifexchangerateis
expectedtodepreciate,ℎVissetto0.8(depreciation)or1.0(highlydepreciation).
Prediction ℎVHighlyappreciation 0.2
Appreciation 0.4Consolidation 0.6Depreciation 0.8
Highlydepreciation 1.0Table2.ℎVbasedoninvestor’sbelief

17
Domestic sentiments are influenced by economic factors, politic factors, and other
domesticfactors.Inthisempiricalstudy,weusedGDP,CPI,andTradeBalancethatareavailable
and obtained easily from data provider, such as Bloomberg. Political factors were not used
becauserelativelydifficulttoobtain.Then,thesethreeeconomicdataareprocessedtogetℎU.
First,thisstudycalculatedaverageandstandarddeviationforGDP,CPI,andTradebalance.This
studyused1and½standarddeviation.Second,thisstudyclassifiedeachdatatosixcategories
(1,2,3,4,5,6)basedondeviationbetweenvalueofdataandtheiraverage.
Deviation GDP CPI TradeBalanceAbove1Std.Dev 6 1 6+½–1Std.Dev 5 2 50–+½Std.Dev 4 3 40–-½Std.Dev 3 4 3-½–-1Std.Dev 2 5 2Below-1Std.Dev 1 6 1
Table3.ValueofDeviation
Intable3,weseethatthereisadifferenceindeterminethevalueofdeviationbetween
CPIandotherdata(GDPandTradeBalance).IthappenedbecausewhenvalueofGDPandTrade
balance are above average (positive deviation), then itwill contributes positive sentiment to
exchangerate.Incontrary,forCPI,whenvalueofCPIareaboveaverage(positivedeviation),then
it will contributes negative sentiment to exchange rate. Third step, value of deviation are
summedbasedonweightofeachdata.Specifically,thisstudyweight50:30:20forGDP:CPI:Trade
Balance.Thoseweightingisusedbasedoninvestor’sviewwhichseeGDPgivemoreimpactto
exchange rate than CPI and Trade Balance. Then the value that has been weighted are
transformedtoℎU whichisdividedasfollows:

18
Table4.ℎU value
ℎU is a correction factor of ℎV, as example, if investor predicts exchange rate will
depreciate,sothevalueofℎVis0.8whiledomesticdataisimproved,sothevalueofℎU is-0.2.
Then,ℎ∗,usingequation(3),is0.6.
ProposedBand
1stSimulation
In order to get proposed band, this study conducting two calculation in all observed
countries,using theequation (1)and (2)andusingequation (4)and (2).Themaindifference
between these two groups is the type of probability of currency depreciation using in the
equation.Group1whichconductingcalculationusingequation(1)and(2),usingtheprobability
ofcurrencydepreciationbasedoninvestor’sbeliefwhichwasrepresentedbyℎ.Ontheother
hand,group2conductingcalculationusingequation(4)and(2)usingequation(3)asmodified
currency depreciation factor or ℎ∗. Since, this study would compare the result with simple
BollingerBand,Group1andGroup2usedhighest-lowestexchangerateinpreviousmoving20
WeightedValueofdeviation
ℎU
6 -0,35 -0,24 -0,13 02 0,11 0,2

19
days.Thus,asacontrolgroupthestudycalculatedupperbandandlowerbandusingBollinger
Bandmethodwith20daysmovingaverageinallobservedcountries.
Byplottingtheupperandlowerbandoftheexchangeratetogetherwiththeexchangerate
happened in the observed period, this study found the number of exchange rate happened
outsidetheproposedband.Hence,accordingtotheresults,theproposedbandusingstandard
probabilityofcurrencydepreciationgave thebesteventoferrorsamongotherobservations.
Only Malaysia and Russia gave best result in proposed band using modified probability of
currencydepreciation.
Table5.Resultfrom1stSimulation
2ndSimulation
Second simulation in this study is conducted by the samemethodwith 1st simulation.
However,thissimulationexercisingthreedifferentlengthformovingaverageforBollingerBand
and moving highest-lowest exchange rate for proposed band. There are three groups of

20
observationthatweusedinthisstudy.GroupAusinghighestandlowestexchangerateinthe
last30daysinexercisingproposedband.GroupBusinghighestandlowestexchangerateinthe
previous60daysinexercisingproposedband.Lastly,groupCusinghighestandlowestexchange
rate in theprevious90days inexercisingproposedband.Thus, asa control group the study
calculatedupperbandand lowerbandusingBollingerBandmethodwith30,60and90days
movingaverageinallobservedcountries
Byplottingtheupperandlowerbandoftheexchangeratetogetherwiththeexchangerate
happened in the observed period, this study found the number of exchange rate happened
outsidetheproposedband.Hence,accordingtotheresults,theproposedbandusingstandard
probabilityofcurrencydepreciationgavethebesteventoferrorsamongotherobservations.
Table6.ExchangeRateHappenedOutsideTradingBandin30daysMovingHighestandLowest
ExchangeRate

21
Table7.ExchangeRateHappenedOutsideTradingBandin60daysMovingHighestandLowestExchangeRate
Table8.ExchangeRateHappenedOutsideTradingBandin90daysMovingHighestandLowestExchangeRate
Althoughproposedbandwithunadjustedℎgivebestresult ineventoferror ingeneral,
therearesomecountrieswhichgivedifferent result.MalaysiaandRussiagotworse result in

22
eventoferrorbyusing30daysmovinghighestlowestexchangerate,IndonesiaandRussiagot
worse result in event of error by using 60 days moving highest lowest exchange rate, and
Indonesiagotworseresultineventoferrorbyusing90daysmovinghighestlowestexchange
rate. Moreover, the longer moving highest lowest exchange rate, the better event of error
producedbyproposedband.
However,thereareseveralpointstobeconsideredinthisstudy.Firstly,inimplementing
thisstudy,intensediscussionamongexpertsandcomprehensiveanalysisareneededinorderto
determineconfidencelevelofcurrencymovement(ℎ).Secondly,sinceeverycurrencyhasitsown
sensitivitytorespondeventinthemarket,determinationofℎneedtobeimprovedtomakeitin
linewiththecountriesconditionsinsteadofarbitrarydetermination.Thirdly,intheeventoflow
andstagnantvolatilityinthepastnormalobservationperiod,longerobservationperiodcanbe
appliedinordertodetermineforextradingband.
V. Conclusion
Hence,theexerciseinthepreviouspartbringsustheconclusion:
a. Accordingtothesampleandmethodologyusingbythisstudy,proposedbandproduceslower
percentageoferrorthanexistingtool.
b. Existing tool using historic data while proposed band also adds investor’s market view
component in its calculation. Therefore, proposed band can be used to enhance tools in
forecastingcurrencymovementsinceinvestor’smarketviewcanbeaccommodatedinthis
method.

23
c. Economicviewoftheinvestorbecomesacrucialdeterminantfactorindeterminingtheupper
andlowerbandinproposedband. It isbecausewiththesamedatatheresultsmaydiffer
dependingonthevalueofℎ.
d. The use of longer period in the calculation produces lower number of error. However,
another consequences of longer period is proposed band become wider. Therefore the
determinationofperiodusedinthecalculationbecomeinvestor’sownpreference.
e. ℎ∗shouldgivebetterresultineventoferrorsinceitscomponentsaremoredetails.However,
accordingtotheexercisehaddoneinthisstudy,theexerciseusingℎ∗doesnotshowbetter
result.Itmightbehappenedbecausethisstudyusingsimplificationandarbitrarilymethodin
determiningℎU bysimplificationindeterminingcomponentsandweight.Thus,therespond
given by each countries should be different.While this study using arbitrarilymethod in
determininghg.However,usingtheproperwayofmethodindeterminingℎ∗mightbetime
consuming.
Basedonthelimitationandconclusionofthestudy,furtherresearchneededtoenhance
thisstudyinsomeaspects:
1. Indeterminingthevalueofℎ,especiallyforℎ,andℎVthisstudyusedarbitrarilymethod
insteadofsophisticatedmethod.Therefore,thereisanopportunityforfurtherresearch
indeterminingthevalueofℎ.
2. In determining the value of ℎU, this study used only three economic data as its
components,CPI,GDPandTradeBalance.Moreover,thisstudyusedarbitrarilymethod
inorder todetermineweight for thosecomponentsofℎU.Thisconditionneeds tobe
elaboratedinfurtherresearch.

24
VI. Referrences
1. Bollinger,John.2001.BollingeronBollingerBand.NewYork:McGrawHill.
2. Bollinger,John.1992.UsingBollingerBands.Stock&CommoditiesV.10:2(47-51)
3. Darsono,SitiAstiyah,R.EkiRahman,TriSubandoro2017.PasarValutaAsing:Teoridan
Praktik.Jakarta:BankIndonesia
4. Grimes,Adam.2012.TheArtandScienceofTechnicalAnalysis:MarketStructure,Proce
Action, and Trading Strategies. Wiley Online Library. Retrieved from
http://onlinelibrary.wiley.com/doi/10.1002/9781119202837.app2/pdf
5. Hayden,John.2004.RSI:TheCompleteGuide.Greenville:TradersPressInc.
6. Kuepper, Justin. 2017.What Is Currency Risk? Currency Risk and How toManage It.
Retrieved from https://www.thebalance.com/g00/what-is-currency-
risk1978927?i10c.referrer=https%3A%2F%2Fwww.google.co.id%2F
7. Mishkin,FredericS.2004.TheEconomicsofMoney,BankingandFinancialMarkets.7th
Edition,PearsonAddisonWesley.
8. Ribnikar,Ivan.2004.ExchangeRateRegimesandMonetaryArrangements.
9. Sarno, Lucio and Mark Taylor. 2002. The Economics of Exchange Rates. Cambridge:
CambridgeUniversityPress.
10. Stone, Mark, Herald Anderson and Romain Veyrune. (2008, March). Exchange Rate
Regimes: Fix or Float? Finance and Development, 45 (1) Retrieved from
http://www.imf.org/external/pubs/ft/fandd/2008/03/basics.htm

25
11. ---. Managed exchange rate system over fixed or floating. 2010. Retrieved from
http://www.discusseconomics.com/foreign-exchange/managed-exchange-rate-system-
over-fixed-or-floating/.
12. ----. TechnicalAnalysis - Explained. Zurich, Switzerland:Global TechnicalResearchand
BehavioralFinance-CreditSuisse.
13. ----. Technical Analysis. 2011. Retrieved from
http://www.mrao.cam.ac.uk/~mph/Technical_Analysis.pdf
14. -----.MovingAverageConvergence–Divergence(MACD),TechnicallySpeaking.Retrieved
from https://www.aaii.com/computerized-investing/article/moving-average-
convergence-divergence-macd.pdf