a new approach for customer clustering by integrating the ... · customer clustering analysis. this...
TRANSCRIPT

`
A New Approach for Customer Clustering by Integrating the LRFM Model and Fuzzy Inference System
Ali Alizadeh Zoeram1, AhmadReza Karimi Mazidi2
1. Department of Management, Faculty of Economics & Administrative Sciences, Ferdowsi University of Mashhad; Researcher at ACECR: Academic Center for Education, Culture and Research-Khorasan
Razavi, Mashhad, Iran 2. Department of Management, Faculty of Economics & Administrative Sciences, Ferdowsi University of
Mashhad; Researcher at Boshra Research Institute, Mashhad, Iran
(Received: September 25, 2017; Revised: March 6, 2018; Accepted: March 15, 2018)
Abstract
This study aimed at providing a systematic method to analyze the characteristics of customers’ purchasing behavior in order to improve the performance of customer relationship management system. For this purpose, the improved model of LRFM (including Length, Recency, Frequency, and Monetary indices) was utilized which is now a more common model than the basic RFM model apt for analyzing the customer lifetime value. Since the RFM model does not take the customers’ loyalty into consideration, the LRFM model has instead been applied for making amendments. Contrary to most of the past studies in which the statistical clustering techniques were used besides the RFM or LRFM model, the current study has provided the possibility of clustering analysis by importing the LRFM indices into the framework of a fuzzy inference system. The results obtained for a wholesale firm based on the proposed approach indicated that there was a significant difference between clusters in terms of the four indices of LRFM. Therefore, this approach can be well utilized for clustering the customers and for studying their characteristics. The strong point of this approach compared to the older ones is its high flexibility, because in which it is not needed to re-cluster the customers and to reformulate the strategies when the number of customers is increased or decreased. Finally, after analyzing the attributes of each cluster, some suggestions on marketing strategies were made to be compatible with clusters, and totally, to improve the performance of customer relationship management system.
Keywords
Customer Relationship management, Customer Lifetime Value, LRFM Model, Customer Clustering Analysis, Fuzzy Inference System. Corresponding Author, Email: [email protected]
Iranian Journal of Management Studies (IJMS) http://ijms.ut.ac.ir/ Vol. 11, No. 2, Spring 2018 Print ISSN: 2008-7055 pp. 351-378 Online ISSN: 2345-3745
DOI: 10.22059/ijms.2018.242528.672839

352 (IJMS) Vol. 11, No. 2, Spring 2018
Introduction
Today’s new economy is widely focused on better service providing, and the present age is called as the customer oriented economy by most of the analysts; an approach by adopting which the organizations are forced to establish long-term relationships with their customers rather than interacting temporarily (Gupta et al., 2006; Chen, 2006). Accordingly, in the highly competitive markets in which most firms are customer oriented, the CRM system is subsequently complicated. The Pareto Principle, also known as the 80:20 rule, suggests that 20℅ of each company’s customers are corresponded for 80% of its transactions, profit, and even its problems (Kumar, 2010). Considering this issue, many experts believe that companies should not incur extra costs to acquire any customer at any profitability level; instead, they should make an optimal use of their restricted resources in order to acquire and retain the key customers (Blattberg, Gary, & Jacquelyn, 2001). Therefore, a large number of previous studies have focused more on allocation of marketing resources (Blattberg & Deighton, 1996) and on impact of marketing strategies on future value of the attracted customers (Gupta et al., 2006; Gupta & Zeithaml, 2006).
Most of the companies have understood that customer databases are very important assets (Jones, Mothersbaugh, & Beatty, 2000) that could be used to analyze the customer characteristics in order to formulate the appropriate marketing strategies and to customize them (Kim, Suh, & Hwang, 2003). The RFM (Recency, Frequency, Monetary indices) is one of the models for analyzing the customer characteristics based upon customer data mining, which has a long history of being applied in the direct marketing (Wei, Lin, Weng, & Wu, 2012; Kafashpoor & Alizadeh, 2012).
Despite being used in so many studies, according to some researchers, the basic RFM model cannot effectively distinguish between the different customers based on the length of their relationship (Reinartz & Kumar, 2000). The length of the relationship means the interval between the first and the last purchases of a certain customer. Given this issue, the current study attempts to analyze the
A New Approach for Customer Clustering by Integrating the LRFM Model and … 353
customer characteristics using the four-dimensional LRFM model (Chang & Tsay, 2004) derived from the basic RFM model and customer clustering analysis. This model is considered as a data mining tool in the CRM system (Ngai, Xiu, & Chau, 2009) in which L represents for the length of the relationship.
Even though most LRFM-based researches have drawn on statistical clustering techniques, the current research opens a new way for customer clustering analysis by drawing on Fuzzy Inference System (FIS). In other words, previous studies have clustered the customers by means of statistical techniques; while in the current paper, the customer clustering is performed based on LRFM indices within the framework of an FIS. This highly flexible system provides a definition of clusters based on all the possible combinations of the four LRFM dimensions and determines the status of each of the given customers within the different clusters.
The proposed approach provides a basis for identifying the customer characteristics, selecting the appropriate marketing strategies, and optimally allocating the resources to improve the performance of CRM system.
Literature Review
Customer Relationship Management
Though the emergence of CRM, commonly known as a significant approach in business, dates back to the 1990s, it still does not have a unique accepted definition (Ngai, 2005; Ling & Yen, 2001). New definitions of CRM have much considered it as a comprehensive and strategic process used for maximizing the customer value (Ngai, Xiu, & Chau, 2009). Accordingly, Parvatiyar and Sheth (2001) defined the CRM as an all-inclusive strategic process of attraction, retention and partnership of the selected customers with regard to the generated value for both the company and the customer. Similarly, Kumar and Reinartz (2006) defined the CRM as a strategic process of selecting the customers of high profitability and interacting with them to optimize their current and future value for the organization.

354 (IJMS) Vol. 11, No. 2, Spring 2018
A CRM system is divided into three general dimensions by Mishra and Mishra (2009): Operational, analytical, and collaborative CRM. The first part is focused on automation of business processes (He, Xu, Huang, & Deng, 2004), or in another sense of the word, supports the administrative processes. The second one analyzes the customers’ behavioral characteristics in line with the CRM strategies by utilizing data mining tools (Mishra & Mishra, 2009) for effectively allocating the resources to the profitable customers cluster. The last one comes to build relationships as well as to coordinate and collaborate with customers ensuring their future contact with the company through telephone, electronic post, website, etcetera (Teo, Devadoss, & Pan, 2006).
We are of the opinion that, amongst the above mentioned dimensions, the analytical CRM plays a pivotal role; particularly, for analyzing the Customer Lifetime Value (CLV). The customer lifetime is comprised of three distinct phases: 1) attracting the customers by identifying the status of potential and actual customers; 2) increasing the customers’ value by recognizing the CLV and customizing the products and services to comply with the customers’ needs; and 3) retaining the good customers by identifying the loyal customers and formulating the appropriate marketing strategies and programs for them as well as for those who are more likely to leave the company (Snoeck, 2012). The strategy of customer relationship management has been of great research interests of academicians, to such an extent that more than 600 studies have been conducted only during the years 1997 to 2001 (Romano, 2001).
Customer Lifetime Value Analysis CLV is one of the most widely used approaches in analytical CRM which can be utilized as a CRM tool for analyzing the customers’ characteristics and behaviors (Krstevski & Mancheski, 2016). There is a variety of definitions for CLV. Kotler (2003) has defined CLV as the Net Present Value (NPV) that can be acquired during a customer’s lifetime. Accordingly, a profitable customer is a person or a company whose earning flow is greater than the costs spent on attracting, selling

A New Approach for Customer Clustering by Integrating the LRFM Model and … 355
to, and servicing. Kumar and Shah (2004) have also defined CLV as the expected value of a company from interacting with a customer from now until a certain point in the future. Generally, in the last two decades, a surge of studies on CLV have been conducted (e.g., Gupta et al., 2006; Kahreh, Tive, Babania, & Hesan, 2014; Rust, Lemon, & Zeithaml, 2004; Verhoef, Franses, & Hoekstra, 2001, Vigneau, Endrizzi, & Qannari, 2011; Xu, Tang, & Yao, 2008), citing this notion along with similar terms such as customer value, lifetime value, customer equity, and customer profitability (Hwang, Jung, & Suh, 2004).
As most experts believe (e.g., Blattberg, Gary, & Jacquelyn, 2001; Gupta et al., 2006; Castéran, Meyer-Waarden, & Reinartz, 2017), rather than paying costs for obtaining any customer with any level of profitability, companies should allocate their limited resources to worthier customers. In doing so, CLV has increasingly been valued as an important aspect of marketing (Donkers, Verhoef, & Jong, 2007; Venkatesan & Kumar, 2004; Verhoef et al., 2001; Kumar & Pansari, 2016). Creating customer value in alignment with decision making can promote the worth of a company. As yet researchers have introduced and applied a variety of methods for the analysis of CLV, namely, the RFM and LRFM models which are depicted below.
RFM and LRFM Models
The RFM is one of the most well-known methods used for customer value analysis and customer clustering (Chang, Huang, & Wu, 2010; Chen, 2012; Zalaghi & Varzi, 2014), and essentially provides desirable statistical data for such purposes. It was originally introduced by Hughes (1994) with a three-dimensional framework comprised of recency (i.e., recent transaction time), frequency (i.e., buying frequency) and monetary (i.e., monetary value) indices. Recency refers to the number of days or months since the last purchase was made in a given time period. Frequency is defined as the number of purchases in a certain time period. Monetary refers to the total amount of money spent during a specific period of time (Kafashpoor & Alizadeh, 2012).

356 (IJMS) Vol. 11, No. 2, Spring 2018
The RFM model has been applied in industry and direct marketing for more than 30 years, mostly due to its simplicity (Gupta et al., 2006). This model is grounded on the analysis of customer’s past behavior and assumes that those with a desirable value for each of the model’s indices are the best customers as long as their future behavior is the same as the past (Keiningham, Aksoy, & Bejou, 2006). Miglautsch (2000) drew on this model to open a way for figuring out the CLV. In addition, Hu and Jing (2008) performed customer segmentation in aftersales firms via the RFM model. They classified relevant customers into 8 clusters using K-means clustering method, and ultimately, after analyzing customer characteristics, determined their lifetime value in each cluster. Moreover, this model was utilized for analyzing the customer value in an outfitter (Wu, Chang, & Lo, 2009). After collecting data, the customers were clustered into 6 groups via K-Means method using RFM indices, and customers’ characteristics within the clusters were analyzed using CLV analysis; suggestions were made on the implementation of promotion programs which were proportional to different customer clusters.
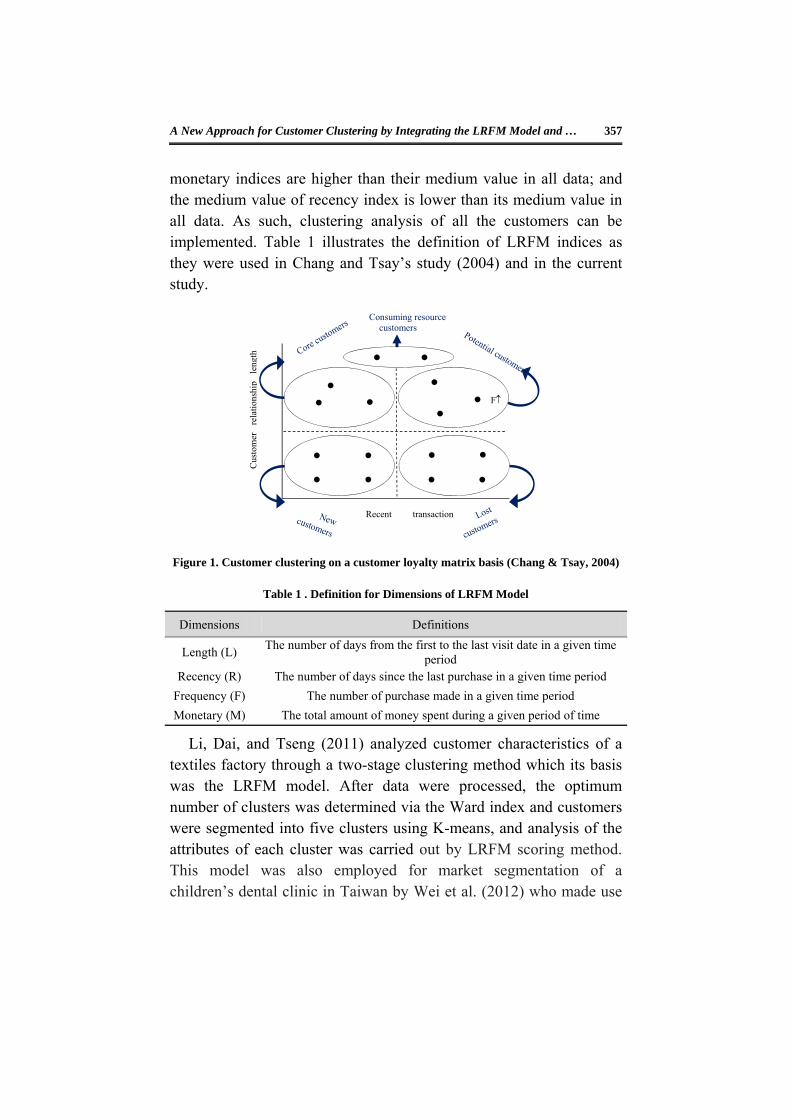
As many researchers postulate (e.g., Daoud, Amine, Bouikhalene, & Lbibb, 2015; Chow & Holden, 1997; Kao, Wu, Chen, & Chang, 2011), the basic RFM model never copes with customer loyalty, which principally refers to the relationship between customer and company. This model, as Reinartz and Kumar (2000) posit, is unable to make distinctions between the customers of long-term relationship and those of short-term whilst rise in the length of the relationship will improve customer loyalty. Considering this fact, Chang and Tsay (2004) added another dimension (i.e., customer relationship length) to the initial RFM model and developed a new one in which the customers are classified into 5 groups and 16 clusters based on different combinations of LRFM indices (see Figure 1). In this model, the symbol (↑) stands for a temporal index whose medium value in the cluster is higher than its medium value in all data, and the symbol (↓) refers to an index which its medium value in the cluster is lower than that in all data. For instance, in the cluster of high value loyal customers (LRFM ↑↓↑↑), the medium values of length, frequency, and
A New Approach for Customer Clustering by Integrating the LRFM Model and … 357
monetary indices are higher than their medium value in all data; and the medium value of recency index is lower than its medium value in all data. As such, clustering analysis of all the customers can be implemented. Table 1 illustrates the definition of LRFM indices as they were used in Chang and Tsay’s study (2004) and in the current study.
Figure 1. Customer clustering on a customer loyalty matrix basis (Chang & Tsay, 2004)
Table 1 . Definition for Dimensions of LRFM Model
Definitions Dimensions
The number of days from the first to the last visit date in a given time period
Length (L)
The number of days since the last purchase in a given time period Recency (R)
The number of purchase made in a given time period Frequency (F)
The total amount of money spent during a given period of time Monetary (M)
Li, Dai, and Tseng (2011) analyzed customer characteristics of a textiles factory through a two-stage clustering method which its basis was the LRFM model. After data were processed, the optimum number of clusters was determined via the Ward index and customers were segmented into five clusters using K-means, and analysis of the attributes of each cluster was carried out by LRFM scoring method. This model was also employed for market segmentation of a children’s dental clinic in Taiwan by Wei et al. (2012) who made use
● ● F
●
● ●
● ● ●
● ●
● ●
●
●
●
●
Cus
tom
er
rela
tions
hip
leng
th
Recent transaction
Consuming resource customers
358 (IJMS) Vol. 11, No. 2, Spring 2018
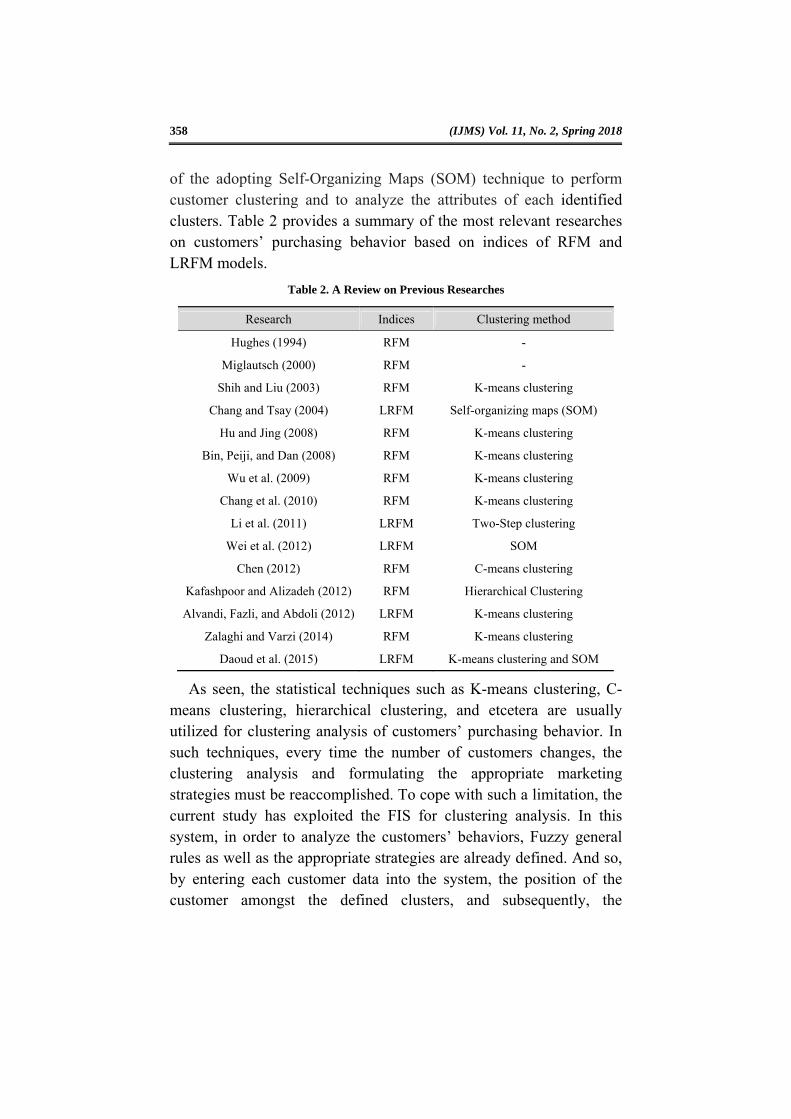
of the adopting Self-Organizing Maps (SOM) technique to perform customer clustering and to analyze the attributes of each identified clusters. Table 2 provides a summary of the most relevant researches on customers’ purchasing behavior based on indices of RFM and LRFM models.
Table 2. A Review on Previous Researches
Research Indices Clustering method
Hughes (1994) RFM -
Miglautsch (2000) RFM -
Shih and Liu (2003) RFM K-means clustering
Chang and Tsay (2004) LRFM Self-organizing maps (SOM)
Hu and Jing (2008) RFM K-means clustering
Bin, Peiji, and Dan (2008) RFM K-means clustering
Wu et al. (2009) RFM K-means clustering
Chang et al. (2010) RFM K-means clustering
Li et al. (2011) LRFM Two-Step clustering
Wei et al. (2012) LRFM SOM
Chen (2012) RFM C-means clustering
Kafashpoor and Alizadeh (2012) RFM Hierarchical Clustering
Alvandi, Fazli, and Abdoli (2012) LRFM K-means clustering
Zalaghi and Varzi (2014) RFM K-means clustering
Daoud et al. (2015) LRFM K-means clustering and SOM
As seen, the statistical techniques such as K-means clustering, C-means clustering, hierarchical clustering, and etcetera are usually utilized for clustering analysis of customers’ purchasing behavior. In such techniques, every time the number of customers changes, the clustering analysis and formulating the appropriate marketing strategies must be reaccomplished. To cope with such a limitation, the current study has exploited the FIS for clustering analysis. In this system, in order to analyze the customers’ behaviors, Fuzzy general rules as well as the appropriate strategies are already defined. And so, by entering each customer data into the system, the position of the customer amongst the defined clusters, and subsequently, the
A New Approach for Customer Clustering by Integrating the LRFM Model and … 359
appropriate strategy are determined. Therefore, compared to other clustering statistical techniques, FIS is having more flexibility and functionality.
Fuzzy Inference System
The term "fuzzy sets" was initially coined in an article published by Zadeh (1965) exactly with the same title. Contrary to the classical sets, a fuzzy set has no certain boundaries, and accordingly, fuzzy logic or reasoning of fuzzy sets, contradicts the logic of crisp numbers (Klir & Yuan, 1995). FIS is a computational framework based upon fuzzy sets, if-then rules, and fuzzy reasoning through which the mapping from given inputs to outputs is formulated by fuzzy logic (Opresnik, Fiasché, Taisch, & Hirsch, 2017). FIS was first employed by Mamdani and Assilian (1975) to synthesize linguistic control rules for human operators’ experiences. Since then, the system has been applied to a wide range of fields.
As demonstrated by Figure 2, an FIS has 5 major components (Foong, Chee, & Wei, 2009): 1) input variables fuzzification process, where the degrees of membership in each of the fuzzy sets are assigned to inputs using membership functions, 2) application of fuzzy operators: fuzzy operators (i.e., OR & AND) are used for combining the truth degrees of the components and producing a value as the truth degree of the given proposition, the resultant (crisp) value obtained from this process is applied to the output function, 3) application of the implication method, where the value obtained from the previous stage is transformed and converted into a fuzzy set using a function based on the defined rules, 4) aggregation of the outputs, a process in which the fuzzy sets representing the outputs from each of the rules are combined and put into a fuzzy set framework; in other words, the output of this process is fuzzy sets per output variable, and 5) defuzzification: since the resultant product of the prior stage is a limited range of output values, it is necessary to obtain a crisp value for output in order to make the final decision; this is what the defuzzification process does.

360 (IJMS) Vol. 11, No. 2, Spring 2018
Figure 2. Components of the FIS (Foong et al., 2009)
Research method
Research Framework
The current study has integrated the LRFM model into an FIS framework in order to render customer clustering analysis for market segmentation. Our proposed approach was applied to 210 customers of a glass and crystal dishes wholesale company, titled as Quds Crystal & Glass Commercial Company located in Razavi Khorasan Province, northeast of Iran. Figure 3 shows the executive framework of this research. As evident from this process, first of all, the indices of the LRFM model (Length, Recency, Frequency, and Monetary) for each customer are extracted from customer database. Afterwards, these data are entered into the designed FIS, and customers are classified into different clusters within a framework based upon the system output. After validating the clustering, the characteristics of the customers of each cluster are analyzed. Ultimately, marketing strategies suited to customers in each cluster are suggested on the basis of market segmentation. The following gives a more detailed account of this process.
Figure 3. Framework of the study
Crispy Input
Crispy Output
Fuzzy Inference Engine
Rule Base
Fuzzy Operator
(AND/ OR)
Implication Operator
Aggregative Operator Defuzzifier Fuzzifier
Customers’ data
Extracting
Fuzzy Inference System
Customer clustering
Customer characteristic analysis
Segment marketing

A New Approach for Customer Clustering by Integrating the LRFM Model and … 361
Defining and Extracting the LRFM Indices
The timescale considered for the extraction of LRFM indices from the company’s customer database was from March 23 in 2012 to March 20 in 2015. This study took into account the following definitions for these indices: The length index referred to as the time interval (number of days) between the first and the last purchases by the customer within the given timescale; the recency index as the time interval (day) between the last purchase and by the end of the mentioned timescale; the frequency index defined as the number of times purchase was made by the customer within the above timescale; and monetary index as the sum of the amount of money spent by the customer (on the basis of Iran’s monetary unit, in million Rial) for purchasing within the given timescale. Table 3 illustrates the descriptive statistics of collected data.
Table 3. Descriptive Statistics of LRFM
Monetary (M)
Frequency (F)
Recency (R)
Length (L)
6507 224 344 355 Min 3 1 1 15 Max
220.76 18.11 73.84 150.9 Average
688.65 33.8 85.81 103.77 Standard deviation
Designing the Fuzzy Inference System
This paper made use of the software program MATLAB R2014a to design the adopted Mamdani-type FIS. To set the initial parameters for designing the system, the following methods were used: The Min inference method for AND operator, Min method for implication, Max method for aggregation, and Mean of Maximum (MoM) method for defuzzification. The fuzzy logic controller of MoM defuzzification method, at first, reveals the scaled function of having the greatest membership degree, and then, it specifies a typical numerical value for that membership function. This value is the average of values corresponding to the membership degree at which the function was scaled. The inputs for the designed inference system included length, recency, frequency, and monetary indices and the output of this

362
system The wdefined
Definin
For defdimenseach diaccordifollowimembe
was a scoreways througd are as follo
ng the memb
fining the msions), a lowimension viing to viewing table ership functi
Figu
Len
Rece
Frequ
Mon
L
Fr
e. Figure 4 gh which sows.
Figure 4. T
bership func
membershipw limit (Lowia a one-sidpoints of thand figureions.
ure 5. Member
ngth
ency
uency
etary
Length
requency
displays ansystem inpu
The fuzzy infer
ctions of the
p functions w) and a higded trapezoihe companye represen
rship functions
Fuzzy Inference(mamdani)
(IJMS) Vo
overall schuts, rules,
rence system
system inpu
of the systgh limit (Upidal membe
y’s main decnt the def
s for LRFM in
S
ol. 11, No. 2, Sp
heme of the and output
uts
tem inputs p) were defiership functcision makefinitions of
dices
Score
Monetary
Recency
pring 2018
system. ts were
(LRFM fined for tion and ers. The f these

A New Approach for Customer Clustering by Integrating the LRFM Model and … 363
Table 4. Describing the Membership Functions for Inputs
Numerical parametersInputs
Up (U)Low (L)
(100,200,355,-)(-,15,100,200)Length (L) (60,90,344,-)(-,1,60,90)Recency (R) (10,30,244,-)(-,1,10,30,30)Frequency (F)
(120,320,6507,-)(-,3,120,320) Monetary (M)
Defining the fuzzy rules of the system
In order to define the attributes of clusters, Chang and Tsay’s (2004) classification was utilized. They identified 16 clusters within a 5-group framework based upon different combinations of LRFM dimensions. Table 5 shows the details based on which the clusters are defined as well as the attributes of each cluster. The fifth column of the table demonstrates the status of each of the LRFM indices.
Table 5. Describing the Groups and Clusters
Cluster Type
LRFM Cluster name Cluster Group name Group
LFM High value loyal customers C1
Core customers 1 LM Platinum customers C2
LF High frequency buying
customers C3
LRFM Potential loyal customers C4
Potential customers
2 LRM Potential consumption
customers C5
LRF Potential high frequency
customers C6
FM High value new customers C7
New customers 3 M
Spender promotion customers
C8
F Frequency promotion
customers C9
Uncertain Uncertain new customers C10 RFM High value lost customers C11
Lost customers 4 RM
Consumption lost customers
C12
RF Frequency lost customers C13 R Uncertain lost customers C14
L Low consumption cost
customers C15 Consuming
resource customers
5 LR
High consumption cost customers
C16
364 (IJMS) Vol. 11, No. 2, Spring 2018
In the basic RFM model, the symbols of (↑) and (↓) has been respectively used for the values higher and lower than the average; however, in this study, the symbol (↑) stands for the status of a given index as being placed in the high class (Up) and the symbol (↓) as being placed in the low class (Low). The type of the clusters is also determined with respect to the status of the items. For instance, the items of L, F, and M took the status of (↑) in Cluster 1; thereby, this cluster being designated as LFM.
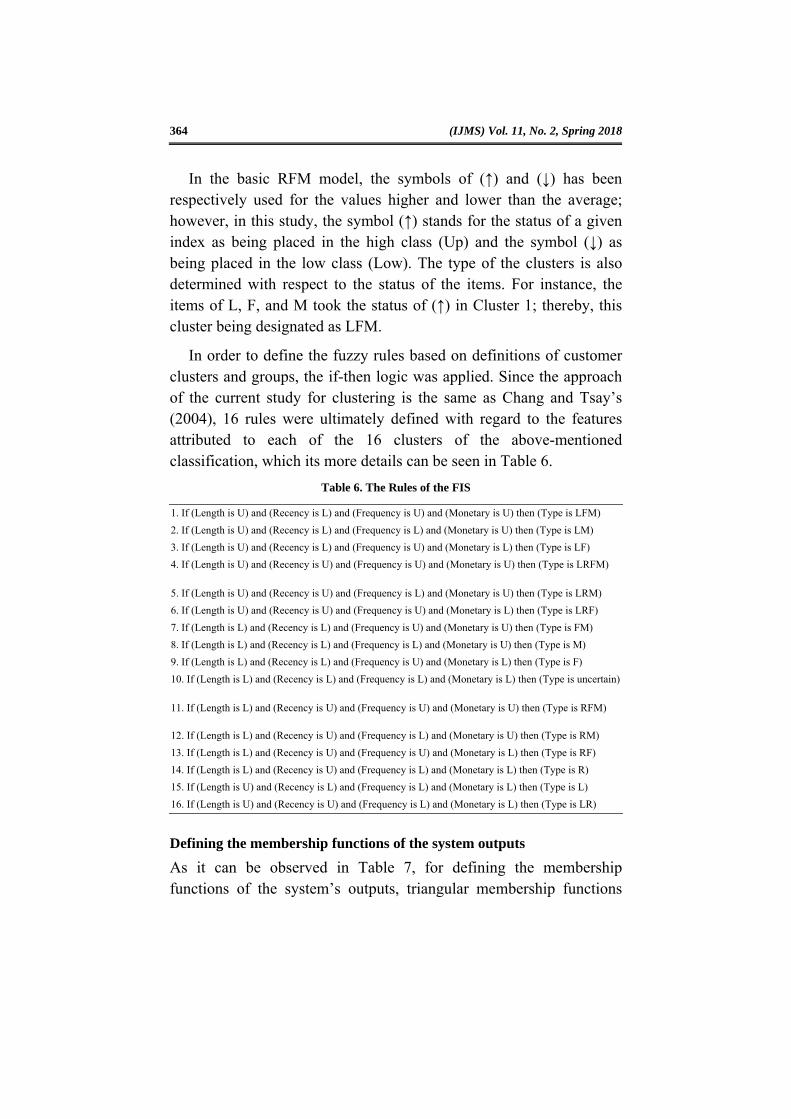
In order to define the fuzzy rules based on definitions of customer clusters and groups, the if-then logic was applied. Since the approach of the current study for clustering is the same as Chang and Tsay’s (2004), 16 rules were ultimately defined with regard to the features attributed to each of the 16 clusters of the above-mentioned classification, which its more details can be seen in Table 6.
Table 6. The Rules of the FIS
1. If (Length is U) and (Recency is L) and (Frequency is U) and (Monetary is U) then (Type is LFM)
2. If (Length is U) and (Recency is L) and (Frequency is L) and (Monetary is U) then (Type is LM)
3. If (Length is U) and (Recency is L) and (Frequency is U) and (Monetary is L) then (Type is LF)
4. If (Length is U) and (Recency is U) and (Frequency is U) and (Monetary is U) then (Type is LRFM)
5. If (Length is U) and (Recency is U) and (Frequency is L) and (Monetary is U) then (Type is LRM)
6. If (Length is U) and (Recency is U) and (Frequency is U) and (Monetary is L) then (Type is LRF)
7. If (Length is L) and (Recency is L) and (Frequency is U) and (Monetary is U) then (Type is FM)
8. If (Length is L) and (Recency is L) and (Frequency is L) and (Monetary is U) then (Type is M)
9. If (Length is L) and (Recency is L) and (Frequency is U) and (Monetary is L) then (Type is F)
10. If (Length is L) and (Recency is L) and (Frequency is L) and (Monetary is L) then (Type is uncertain)
11. If (Length is L) and (Recency is U) and (Frequency is U) and (Monetary is U) then (Type is RFM)
12. If (Length is L) and (Recency is U) and (Frequency is L) and (Monetary is U) then (Type is RM)
13. If (Length is L) and (Recency is U) and (Frequency is U) and (Monetary is L) then (Type is RF)
14. If (Length is L) and (Recency is U) and (Frequency is L) and (Monetary is L) then (Type is R)
15. If (Length is U) and (Recency is L) and (Frequency is L) and (Monetary is L) then (Type is L)
16. If (Length is U) and (Recency is U) and (Frequency is L) and (Monetary is L) then (Type is LR)
Defining the membership functions of the system outputs
As it can be observed in Table 7, for defining the membership functions of the system’s outputs, triangular membership functions
A New Approach for Customer Clustering by Integrating the LRFM Model and … 365
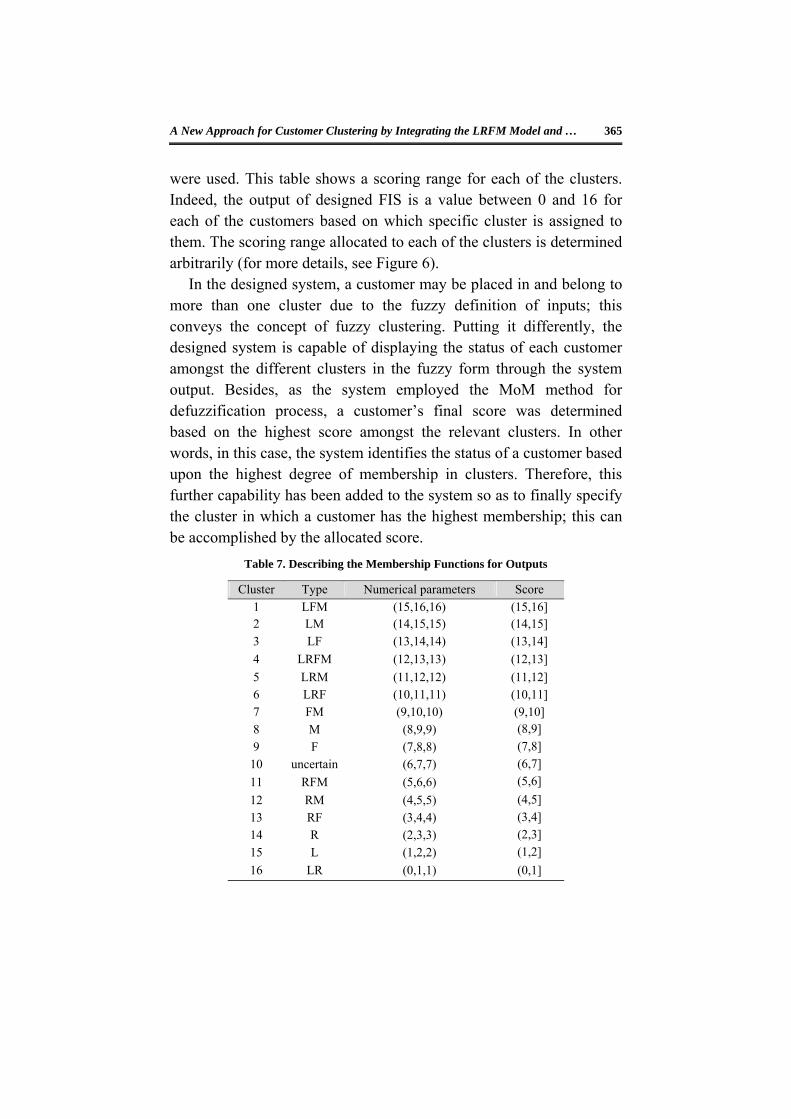
were used. This table shows a scoring range for each of the clusters. Indeed, the output of designed FIS is a value between 0 and 16 for each of the customers based on which specific cluster is assigned to them. The scoring range allocated to each of the clusters is determined arbitrarily (for more details, see Figure 6).
In the designed system, a customer may be placed in and belong to more than one cluster due to the fuzzy definition of inputs; this conveys the concept of fuzzy clustering. Putting it differently, the designed system is capable of displaying the status of each customer amongst the different clusters in the fuzzy form through the system output. Besides, as the system employed the MoM method for defuzzification process, a customer’s final score was determined based on the highest score amongst the relevant clusters. In other words, in this case, the system identifies the status of a customer based upon the highest degree of membership in clusters. Therefore, this further capability has been added to the system so as to finally specify the cluster in which a customer has the highest membership; this can be accomplished by the allocated score.
Table 7. Describing the Membership Functions for Outputs
Score Numerical parameters Type Cluster
(15,16] (15,16,16) LFM 1 (14,15] (14,15,15) LM 2
(13,14] (13,14,14) LF 3
(12,13] (12,13,13) LRFM 4
(11,12] (11,12,12) LRM 5 (10,11] (10,11,11) LRF 6 (9,10] (9,10,10) FM 7 (8,9] (8,9,9) M 8 (7,8] (7,8,8) F 9 (6,7] (6,7,7) uncertain10 (5,6] (5,6,6) RFM 11 (4,5] (4,5,5) RM 12 (3,4] (3,4,4) RF 13 (2,3] (2,3,3) R 14 (1,2] (1,2,2) L 15
(0,1] (0,1,1) LR 16

366
Experi
Accon LRFthe comFIS is i
Frequen
Recen
Monet
Sco
re
Sco
re
Sco
re
Figure 6.
imental Re
ording to thFM model impany undeillustrated v
Figure 7
ncy
ncy
tary
Membership f
esults
he above ein order to
er study. Thvia three-dim
7. The status of
Recency
Length
Length
functions for o
explanationsanalyze the
he status of Lmensional d
f LFRM dimen
F
M
M
Sco
re
Sco
re
Sco
re
(IJMS) Vo
outputs (custom
s, an FIS we customersLRFM indi
diagrams in
nsions for desi
Frequency
Monetary
Monetary
ol. 11, No. 2, Sp
mer score)
was designeds’ characterices in the dFigure 7.
gned FIS
Recency
Frequen
Length
pring 2018
d based istics of
designed
y
ncy
h
A New Ap
In eachvalues designeof the Createddisplayin the L
an elev
and fre
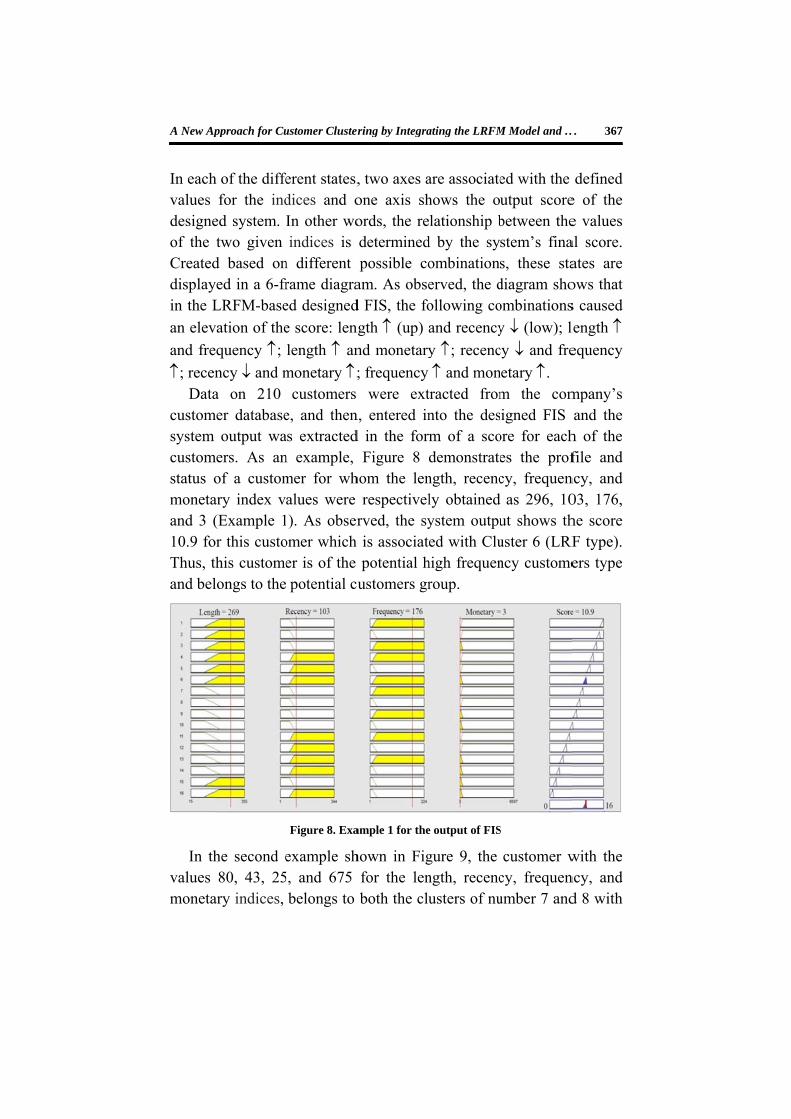
; receData
customsystem customstatus omonetaand 3 (10.9 foThus, tand bel
In thvalues moneta
pproach for Cu
h of the diffefor the ind
ed system. two given
d based onyed in a 6-frLRFM-base
vation of the
equency ;
ncy and ma on 210
mer databaseoutput wa
mers. As anof a customary index v(Example 1
or this custothis customelongs to the
he second e80, 43, 25
ary indices,
ustomer Cluster
erent states,dices and oIn other woindices is
n different rame diagraed designed
e score: leng
length an
monetary ;customers
e, and thenas extractedn example, mer for whalues were
1). As obseromer which er is of the potential cu
Figure 8. Exa
example sh5, and 675
belongs to
ring by Integra
, two axes aone axis shords, the redeterminedpossible co
am. As obsed FIS, the fo
ngth (up) a
nd monetary
; frequency were ext
n, entered ind in the form
Figure 8 hom the len
respectivelrved, the syis associatpotential h
ustomers gr
ample 1 for the
hown in Figfor the lenboth the clu
ating the LRFM
are associatehows the olationship b
d by the syombinationserved, the dollowing co
and recency
y ; recenc
and montracted fromnto the desm of a scodemonstrate
ngth, recencly obtained ystem outpued with Clu
high frequenroup.
e output of FIS
gure 9, the ngth, recencusters of nu
M Model and …
ed with the utput scorebetween thestem’s finas, these stadiagram shoombinations
y (low); l
cy and fre
netary . m the comigned FIS
ore for eaches the profcy, frequen
as 296, 10ut shows thuster 6 (LRFncy custome
S
customer wcy, frequenumber 7 and
… 367
defined e of the e values al score. ates are ows that s caused
length
equency
mpany’s and the
h of the file and
ncy, and 03, 176, he score
RF type). ers type
with the ncy, and d 8 with

368
differenHavingplaced this cusand to t
Afteoutput results.placed mentionPotentilost cucurrentvalues the clusvalue fand m1,14,16
Accof custlowest identifito be thgreates
nt membersg a higher
in this clusstomer, therthe new cus
er entering were analy As evidentin Clusters
ned earlierial loyal customers. Cot research wpertaining sters based for the rece
monetary in6, and 1. ording to retomers (42(2 people;
ied as to be he type of st number of
ship degreesmembershi
ster. This isreby belongstomers grou
Figure 9. Exa
customers’ yzed. Tablet, amongst s 4, 11 andr, no custoustomers, hionsidering were ultimato LRFM don the high
ency index, ndices were
esults, Clust people; 20.95℅). Inthe type of pender promf customers
s indicatingip degree is affirmed bging to the hup.
ample 2 for the
informatioe 8 gives athe studied d 13. In ot
omer belonigh value lothese explaately segmedimensions hest value fo
and maxime respectiv
ter 10 accom20℅) and Cn other wordf uncertain nmotion custs, the order
(IJMS) Vo
g the fuzzy n Cluster 7by the scorhigh value n
e output of FIS
n, the scorea report oncustomers,
ther words,nged to theost customeanations, thented into were deter
or the lengtmum valuesely associa
mmodates tCluster 8 ads, most ofnew customtomers. In tof clusters w
ol. 11, No. 2, Sp
clustering c7, the custoe 9.84 alloc
new custome
S
es obtained n analysis o none of th, for the coe followingers, and free customer13 clusters
rmined for h index, the
s for the freated with
the highest accommodaf the custom
mers and the terms of havwas as follo
pring 2018
concept. omer is cated to
mers type
d by FIS of these hem was ompany
g types: equency rs in the s. Mean each of
e lowest equency clusters
number ates the mers are
least as ving the ows: 10,

A New Approach for Customer Clustering by Integrating the LRFM Model and … 369
14, 15, 16, 1, 9, 12, 3, 7, 5, 2, 6, and 8. As for analysis of the customer groups, 11.91℅ of customers were placed in Group 1 (core customers), 4.29℅ in Group 2 (potential customers), 29.52℅ in Group 3 (new customers), 24.76℅ in Group 4 (lost customers) and 29.52℅ in Group 5 (consuming resource customers). Therefore, the highest number of customers belonged to the groups of new customers and consuming resource customers, and the lowest number to the potential customers group.
Table 8. Results of Customer Clustering in the FIS
Value in group (%)
Value in cluster
(%)
Average Cluster Group Monetary
(M) Frequency
(F) Recency
(R) Length
(L)
25 (11.91) 14 (6.66) 213.55 25.16 63.26 1227.48 C1
1 4 (1.9) 170.04 40.87 27.87 406.86 C2 7 (3.33) 149.95 49.47 22.95 207.70 C3
9 (4.29) 0 - - - - C4
2 5 (2.38) 160.05 41.33 29.33 399.46 C5 4 (1.9) 149.20 48.41 20.75 98.35 C6
62 (29.52)
6 (2.86) 172.00 32.46 38.54 519.34 C7
3 2 (0.95) 150.71 45.28 21.18 144.01 C8 12 (5.71) 149.02 56.52 15.65 70.40 C9 42 (20) 136.41 73.69 10.56 44.26 C10
52 (24.76)
0 - - - - C11
4 11 (5.24) 141.07 63.87 13.48 85.89 C12 0 - - - - C13
41 (19.52) 138.42 88.16 8.81 31.09 C14
62 (29.52) 39 (18.57) 138.85 81.08 9.53 36.78 C15
5 23 (10.95) 138.79 88.06 8.74 30.05 C16
210 (100%) 210 (100%) Sum
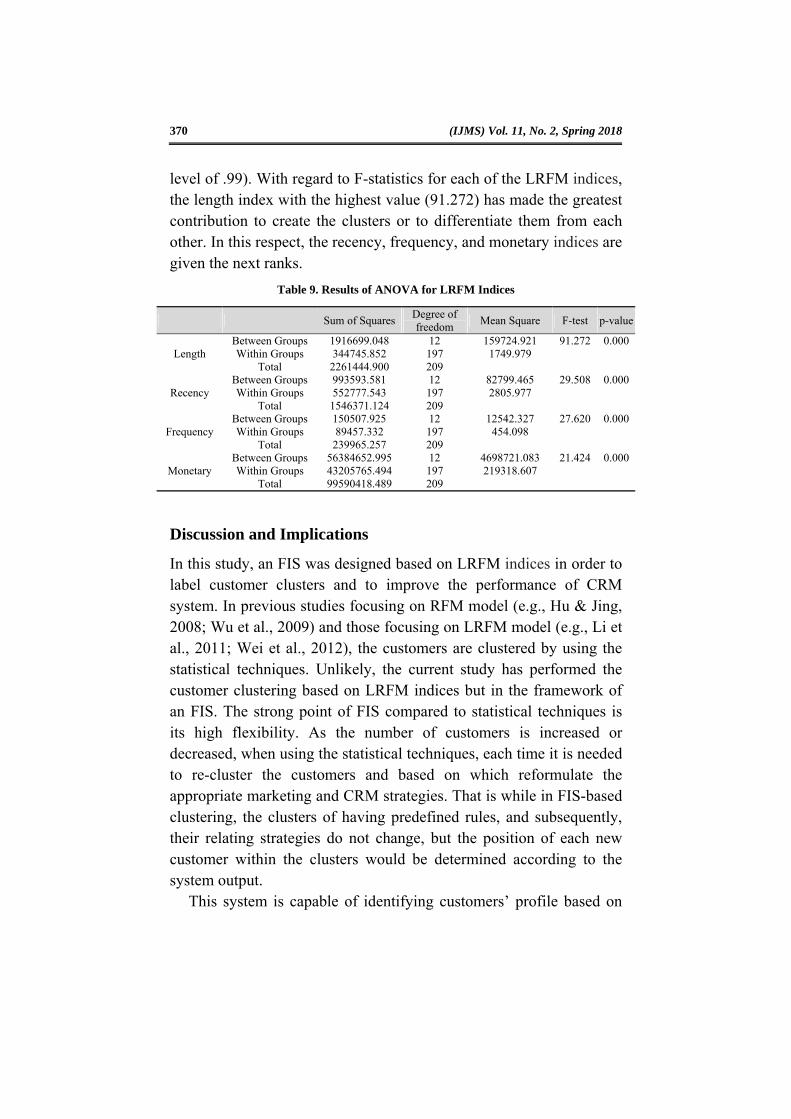
In order to validate the performed clustering, the ANOVA
technique was conducted to evaluate the significance of difference in the mean value of length, recency, frequency, and monetary indices between the different clusters. Previously, we checked normality of clusters and made sure that we face with clusters of having normal distribution, because all the kurtosis and skewness coefficients were placed in allowed range of ±2. Referring to this, we were authorized to use this technique results which are shown in Table 9. As it can be seen and given this fact that the p-value for all the LRFM indices is less than .01, this hypothesis that the mean value of LRFM indices significantly differ between clusters was confirmed (at confidence
370 (IJMS) Vol. 11, No. 2, Spring 2018
level of .99). With regard to F-statistics for each of the LRFM indices, the length index with the highest value (91.272) has made the greatest contribution to create the clusters or to differentiate them from each other. In this respect, the recency, frequency, and monetary indices are given the next ranks.
Table 9. Results of ANOVA for LRFM Indices
Sum of Squares Degree of freedom
Mean Square F-test p-value
Length Between Groups 1916699.048 12 159724.921 91.272 0.000 Within Groups 344745.852 197 1749.979
Total 2261444.900 209
Recency Between Groups 993593.581 12 82799.465 29.508 0.000 Within Groups 552777.543 197 2805.977
Total 1546371.124 209
Frequency Between Groups 150507.925 12 12542.327 27.620 0.000 Within Groups 89457.332 197 454.098
Total 239965.257 209
Monetary Between Groups 56384652.995 12 4698721.083 21.424 0.000 Within Groups 43205765.494 197 219318.607
Total 99590418.489 209
Discussion and Implications
In this study, an FIS was designed based on LRFM indices in order to label customer clusters and to improve the performance of CRM system. In previous studies focusing on RFM model (e.g., Hu & Jing, 2008; Wu et al., 2009) and those focusing on LRFM model (e.g., Li et al., 2011; Wei et al., 2012), the customers are clustered by using the statistical techniques. Unlikely, the current study has performed the customer clustering based on LRFM indices but in the framework of an FIS. The strong point of FIS compared to statistical techniques is its high flexibility. As the number of customers is increased or decreased, when using the statistical techniques, each time it is needed to re-cluster the customers and based on which reformulate the appropriate marketing and CRM strategies. That is while in FIS-based clustering, the clusters of having predefined rules, and subsequently, their relating strategies do not change, but the position of each new customer within the clusters would be determined according to the system output.
This system is capable of identifying customers’ profile based on

A New Approach for Customer Clustering by Integrating the LRFM Model and … 371
the status of LRFM indices so as to pinpoint their place within one of the 16 clusters created from different combinations of these indices, and within the five customer groups including the core customers, potential customers, new customers, lost customers, and consuming resource customers. By entering the index values for each customer, the designed system has the ability to both exhibit a customer’s status between different clusters in fuzzy form and determine the cluster in which the customer has the highest membership degree using the allocated score.
By implementing this system for clustering the customers of Quds Crystal and Glass Company, they were ultimately put into 13 clusters and it was recognized that the following three customer types did not exist for the company: Potential loyal customers, high value lost customers, and frequency lost customers. Out of the studied customers, 11.9℅ were placed in core customers group, 4.29℅ in potential customer, 29.52℅ in new customers, 24.76℅ in lost customers, and 29.52℅ in consuming resource customers. As evident, most of the company’s customers belong to the types of new customers and consuming resource customers. With a closer look, they were put in the following clusters based on the population density respectively: 20℅ in the uncertain new customers cluster, 19.52℅ in the uncertain lost customers, 18.57℅ in low consumption cost customers, 6.66℅ in high value loyal customers, 5.71℅ in frequency promotion customers, 5.24℅ in consuming lost customers, 3.33℅ in high frequency buying customers, 2.86℅ in high value new customers, 2.38℅ in the potential consumption customers, 1.9℅ in each of the clusters of platinum customers, and .95℅ in the potential high frequency customers cluster.
The analysis of customers’ characteristics for each cluster will contribute to adopt the appropriate marketing strategies in line with the company’s CRM system. On the other hand, implementing the marketing strategies compatible with each cluster will result in optimal allocation of resources. In other words, by putting away the policy of applying the same marketing strategies, and instead, by implementing the effective strategies compatible with each cluster

372 (IJMS) Vol. 11, No. 2, Spring 2018
considering the customers’ characteristics we can save the company’s financial resources and improve the effectiveness of allocating the other resources as well.
Grounded on this, we recommend the company to further focus on those belonging to the core customers group and attempt to retain such customers via developing suitable interaction facilities and promotional tools, because they are the worthiest or gold customers. Furthermore, since the recency index has been low in the potential customers group, the company should discover the reason for such a distance by contacting through telephone, email, fax, and etcetera, and come to solve the problem using the leverages like informative advertisements. In terms of new customers group, we suggest that more attention should be paid to high value new customers and loyalty would be inspired by providing them with transactional satisfaction. In addition, by considering special volume discounts consistent with the status of customers in Cluster 3 (high frequency buying customers), Cluster 6 (potential high frequency customers), and Cluster 9 (frequency promotion customers), the value of monetary index for these customer types can be increased. Even though the customers in other groups are less worthy, they should not be treated with incuriosity; rather, various studies and analyses are required for understanding their behavioral attributes given their identified clusters. Overall, the proposed approach of this study can provide an outline for understanding and analyzing the characteristics of different customers and for selecting the appropriate marketing strategies in order to improve the performance of CRM system.

A New Approach for Customer Clustering by Integrating the LRFM Model and … 373
References
Alvandi, M., Fazli, S., & Abdoli, F. S. (2012). K-Mean clustering method for analysis customer lifetime value with LRFM relationship model in banking services. International Research Journal of Applied and Basic Sciences, 3(11), 2294-2302.
Bin, D., Peiji, S., & Dan, Z. (2008, December). Data mining for needy students identify based on improved RFM model: A case study of university. Proceedings from the International Conference on Information Management, Innovation Management and Industrial Engineering (ICIII), 1, 244-247.
Blattberg, R. C., & Deighton, J. (1996). Managing marketing by the customer equity Test. Harvard Business Review, 75(4), 136-144.
Blattberg, R. C., Gary, G., & Jacquelyn, S. T. (2001). Customer equity: Building and managing relationships as valued assets. Boston, Massachusetts: Harvard Business School Press.
Castéran, H., Meyer-Waarden, L., & Reinartz, W. (2017). Modeling customer lifetime value, retention, and churn. In Handbook of Market Research (pp. 1-33). Springer International Publishing.
Chang, E. C., Huang, H. C., & Wu, H. H. (2010). Using K-means method and spectral clustering technique in an outfitter’s value analysis. Quality & Quantity, 44(4), 807-815.
Chang, H. H., & Tsay, S. F. (2004). Integrating of SOM and K-means in data mining clustering: An empirical study of CRM and profitability evaluation. Journal of Information Management, 11(4), 161-203.
Chen, X. (2006). Customer lifetime value: An integrated data mining approach (Master thesis). Lingnan University.
Chen, T. (2012). The RFM–FCM approach for customer clustering. International Journal of Technology Intelligence and Planning, 8(4), 358-373.
Chow, S., & Holden, R. (1997). Toward an understanding of loyalty: The moderating role of trust. Journal of Management Issues, 9(3), 275-298.
Daoud, R. A., Amine, A., Bouikhalene, B., & Lbibb, R. (2015).
374 (IJMS) Vol. 11, No. 2, Spring 2018
Customer segmentation model in e-commerce using clustering techniques and LRFM model: The case of online stores in Morocco. International Journal of Computer and Information Engineering, 9(8), 2000-2010.
Donkers, B., Verhoef, P. C., & Jong, M. G. D. (2007). Modeling CLV: A test of competing models in the insurance industry. Quantitative Marketing and Economics, 5(2), 163-190.
Foong, K. C., Chee, C. T., & Wei, L. S. (2009, April). Adaptive network fuzzy inference system (ANFIS) handoff algorithm. Proceedings from ICFCC 2009 International Conference on Future Computer and Communication, 195-198.
Gupta, S., Hanssens, D., Hardie, B, Kahn, W., Kumar, V., Lin, N., & Sriram, N. R. S. (2006). Modeling customer lifetime value. Journal of Service Research, 9(2), 139-155.
Gupta, S., & Zeithaml, V. (2006). Customer metrics and their impact on financial performance. Marketing Science, 25(6), 718-739.
He, Z., Xu, X., Huang, J. Z., & Deng, S. (2004). Mining class outliers: Concept, algorithms and applications in CRM. Expert Systems with Applications, 27(4), 681-697.
Hu, W., & Jing, Z. (2008, December 10-11). Study of segmentation for auto services companies based on RFM model. Proceedings from the 5th International Conference on Innovation and Management. Maastricht, The Netherlands.
Hughes, A. M. (1994). Strategic database marketing. Chicago: Probus Publishing Co.
Hwang, H., Jung, T., & Suh, E. (2004). An LTV model and customer segmentation based on customer value: A case study on the wireless telecommunication industry. Expert Systems with Applications, 26(2), 181-188.
Jones, M. A., Mothersbaugh, D. L., & Beatty, S. E. (2000). Switching barriers and repurchase intentions in services. Journal of Retailing, 76(2), 259-374.
Kafashpoor, A., & Alizadeh Z. A. (2012). Application of Fuzzy Delphi Analytical Hierarchy Process (FDAHP) and Hierarchical Cluster Analysis (HCA) in RFM model for measuring the customer life
A New Approach for Customer Clustering by Integrating the LRFM Model and … 375
time value. New Marketing Research Journal, 2(3), 51-68. Kahreh, M. S., Tive, M., Babania, A., & Hesan, M. (2014). Analyzing
the applications of Customer Lifetime Value (CLV) based on benefit segmentation for the banking sector. Procedia-Social and Behavioral Sciences, 109, 590-594.
Kao, Y. T., Wu, H. H., Chen, H. K., & Chang, E. C. (2011). A case study of applying LRFM model and clustering techniques to evaluate customer values. Journal of Statistics and Management Systems, 14(2), 267-276.
Keiningham, T. L., Aksoy, L., & Bejou, D. (2006). Approaches to measurement and management of customer value. Journal of Relationship Marketing, 5(2), 37-54.
Kim, J., Suh, E.-H., & Hwang, H. (2003). A model for evaluating the effectiveness of CRM using the balanced scorecard. Journal of Interactive Marketing, 17(2), 5-19.
Klir, G., & Yuan, B. (1995). Fuzzy sets and fuzzy logic (Vol. 4). New Jersey: Prentice Hall.
Kotler, P. (2003). Marketing management (11th ed.). Upper Saddle River, NJ: Prentice-Hall.
Krstevski, D., & Mancheski, G. (2016). Managerial accounting: Modeling customer lifetime value- An application in the telecommunication industry. European Journal of Business and Social Sciences, 5(1), 64-77.
Kumar, V. (2010). Customer relationship management. John Wiley & Sons, Ltd.
Kumar, V., & Pansari, A. (2016). National culture, economy, and customer lifetime value: Assessing the relative impact of the drivers of customer lifetime value for a global retailer. Journal of International Marketing, 24(1), 1-21.
Kumar, V., & Reinartz, W. (2006). Customer relationship management: A data based approach. New York: John Wiley.
Kumar, V. & Shah, D. (2004). Building and sustaining profitable customer loyalty for the 21st century. Journal of Retailing, 80(4), 317-329.
Li, D.-C., Dai, W.-L., & Tseng, W.-T. (2011). A two-stage clustering

376 (IJMS) Vol. 11, No. 2, Spring 2018
method to analyze customer characteristics to build discriminative customer management: A case of textile manufacturing business. Expert Systems with Application, 38(6), 7186-7191.
Ling, R., & Yen, D .C. (2001). Customer relationship management: An analysis framework and implementation strategies. Journal of Computer Information Systems, 41(3), 82-97.
Mamdani, E. H. & Assilian, S. (1975). An experimental in linguistic synthesis with a fuzzy logic controller. International Journal of Man-Machine Studies, 7(1), 1-13.
Miglautsch, J. R. (2000). Thoughts on RFM scoring. Journal of Database Marketing, 8(1), 67–72.
Mishra, A., & Mishra, D. (2009). Customer relationship management: Implementation process perspective. Acta Polytechnica Hungarica, 6(4), 83-99.
Ngai, E. W. T. (2005). Customer relationship management research (1992-2002): An academic literature review and classification. Marketing Intelligence Planning, 23(6), 582-605.
Ngai, E. W. T., Xiu, L., & Chau, D. C. K. (2009). Application of data mining techniques in customer relationship management: A literature review and classification. Expert Systems with Applications, 36(2), 2592-2602.
Opresnik, D., Fiasché, M., Taisch, M., & Hirsch, M. (2017). An evolving fuzzy inference system for extraction of rule set for planning a product–service strategy. Information Technology and Management, 18(2), 131-147.
Parvatiyar, A., & Sheth, J. N. (2001). Customer relationship management: Emerging practice, process and discipline. Journal of Economic and Social Research, 3(2), 1-34.
Reinartz, W. J., & Kumar, V. (2000). On the profitability of long-life customers in a noncontractual setting: An empirical investigation and implications for marketing. Journal of Marketing, 64(October), 17–35.
Romano, N. C. (2001). Customer relationship management research: An assessment of sub field development and maturity.
A New Approach for Customer Clustering by Integrating the LRFM Model and … 377
Proceedings from the 34th Hawaii International Conference on System Sciences.
Rust, R. T., Lemon, K., & Zeithaml, V. (2004). Return on marketing: using customer equity to focus marketing strategy. Journal of Marketing, 68(1), 109-26.
Shih, Y.-Y.., & Liu, C-Y. (2003). A method for customer lifetime value ranking: Combining the analytic hierarchy process and clustering analysis. Database Marketing & Customer Strategy Management, 11(2), 159–172.
Snoeck, S. M. J. (2012). Customer value models in the energy market understanding the role of acquisition and retention effects. Groningen, the Netherlands: University of Groningen.
Teo, T. S. H., Devadoss, P., & Pan, S. L. (2006). Towards a holistic perspective of customer relationship management implementation: A case study of the housing and development board. Decision Support Systems, 42(3), 1616-1627.
Venkatesan, R., & Kumar, V. (2004). A customer lifetime value framework for customer selection and resource allocation strategy. Journal of Marketing, 68(4), 106-125.
Verhoef, P., Franses, P., & Hoekstra, J. (2001). The impact of satisfaction and payment equity on cross-buying: A dynamic model for a multi-service provider. Journal of Retailing, 77(3), 359-78.
Vigneau, E., Endrizzi, I., & Qannari, E. M. (2011). Finding and explaining clusters of consumers using the CLV approach. Food Quality and Preference, 22(8), 705-713.
Wei, J.-T., Lin, S.-Y., Weng, C.-C., & Wu, H.-H. (2012). A case study of applying LRFM model in market segmentation of a children’s dental clinic. Expert Systems with Application, 39(5), 5529-5533.
Wu, H.-H., Chang, E.-C., & Lo, C.-F. (2009). Applying RFM model and K-means method in customer value analysis of an outfitter. Proceedings from International Conference on Concurrent Engineering, New York.
Xu, P., Tang, X., & Yao, S. (2008). Application of circular laser vision sensor (CLVS) on welded seam tracking. Journal of Materials
378 (IJMS) Vol. 11, No. 2, Spring 2018
Processing Technology, 205(1), 404-410. Zadeh, L. A. (1965). Fuzzy sets. Information and Control, 8(3), 338-
353. Zalaghi, Z., & Varzi, Y. (2014). Measuring customer loyalty using an
extended RFM and clustering technique. Management Science Letters, 4(5), 905-912.