a new approach in petrophysical rock typing
TRANSCRIPT
1
A New Approach in Petrophysical Rock Typing
Abouzar Mirzaei-Paiaman1,*, Mehdi Ostadhassan2, Reza Rezaee3, Hadi Saboorian-Jooybari4,
Zhangxin Chen4
1 Department of Petroleum Engineering, National Iranian South Oil Company, Ahvaz, Iran
2 Petroleum Engineering Department, University of North Dakota, Grand Forks, ND 58201, USA
3 Department of Petroleum Engineering, Curtin University, Perth 6151, Australia
4 Department of Chemical and Petroleum Engineering, Schulich School of Engineering, University of Calgary, 2500
University Drive NW, Calgary, AB, Canada T2N 1N4
*Corresponding author: [email protected], Tel.:+989168014851
Abstract
Petrophysical rock typing in reservoir characterization is an important input for successful
drilling, production, injection, reservoir studies and simulation. In this study petrophysical rock
typing is divided into two major categories: 1) a petrophysical static rock type (PSRT): a
collection of rocks having the same primary drainage capillary pressure curves or unique water
saturation for a given height above the free water level, 2) a petrophysical dynamic rock type
(PDRT): a set of rocks with a similar fluid flow behavior. It was shown that static and dynamic
rock types do not necessarily overlap or share petrophysical properties, regardless of wettability.
In addition, a new index is developed to define PDRTs via the Kozeny-Carman equation and
Darcy’s law. We also proposed a different index for delineation of PSRTs by combining the
Young–Laplace capillary pressure expression and the Kozeny-Carman equation. These new
indices were compared with the existing theoretical and empirical indices. Results showed that
our indices are representatives of previously developed models which were also tested with
mercury injection capillary pressure, water-oil primary drainage capillary pressure, and water-oil
relative permeability data on core plugs from a highly heterogeneous carbonate reservoir in an
Iranian oil field. This study enabled us to modify the conventional J-function to enhance its
capability of normalizing capillary pressure data universally.
Key words: petrophyisics, rock typing, hydraulic flow unit, Kozeny-Carman, reservoir
characterization
1. Introduction
Petrophysical rock typing has a wide variety of applications such as: drilling (e.g., prediction of
high mud-loss intervals), production (e.g., potential production zones, locating perforations,
diversion system design in acidizing, and prediction of high injectivity zones) (Roque et al.,

2
2017, Oliveira et al., 2016), reservoir studies (net-pay cut-off definition) (Kolodzie, 1980,
Saboorian-Jooybari, 2017), representative sample selections for special core analysis (SCAL)
tests (Siddiqui et al., 2006, Serag El Din et al., 2014, Mirzaei-Paiaman and Saboorian-Jooybari,
2016), permeability prediction in uncored intervals (Amaefule et al., 1993, Abbaszadeh et al.,
1996, Davies and Vessell, 1996, Soto et al., 2001, Taslimi et al., 2008, Askari and Behrouz,
2011, Sokhal et al., 2016, Chen and Yao, 2017, Zhang et al. 2018, Wang et al. 2018), and
defining saturation functions for static and dynamic reservoir models (Mirzaei-Paiaman et al.,
2015, Askari and Behrouz, 2011). Generally the literature core-based petrophysical rock typing
methods can be classified into three separate categories.
Methods that utilize permeability, porosity and connate water saturation to some extent.
Excluding the cut-off based methods (Rebelle, 2014) other ones are either empirical such
as: Winland r35 (Kolodzie, 1980), Pittman equations (Pittman, 1992) and 𝑟𝑝35 (Aguilera,
2002) or theoretical: FZI by Amaefule et al. (1993) and FZI* (FZI-Star) by Mirzaei-
Paiaman et al. (2015).
Methods based on capillary pressure (𝑃𝑐) data such as a J-function, the empirical 𝑃𝑐
grouping technique, parameterization (Thomeer, 1960; Xu and Torres-Verdín, 2013; Lin
et al., 2015) and measured r35 (Kolodzie, 1980).
The spontaneous imbibition rate-driven method of FZI** or FZI-Double Star (Mirzaei-
Paiaman and Saboorian-Jooybari, 2016)
Among the above methods, the first category has caught major interest in industry and academia
since its indices do not require prior knowledge of capillary pressure and/or relative permeability
data. However, similar indices have been proposed that need SCAL-driven parameters
(Nooruddin and Hossain, 2011; Izadi and Ghalambor, 2013), which makes their use much
difficult. The theoretical and empirical indices are summarized in Table 1. The theoretical
indices are mainly based on the generalized form of the Kozeny-Carman equation. Empirical
methods have established a correlation between porosity, permeability, and a representative pore
throat radius which is derived from mercury injection capillary pressure (MICP) data (Purcell,
1949). Such a specific pore throat radius has been introduced as an index for characterizing pore
geometry in such a way that it dominates fluid flow. However, several shortcomings exist which
led us to study them further and provide an enhanced definition (index):

3
In reality more than one pore throat size dominates fluid flow (usually a class of pore
throat radii controls the flow).
The presumed mathematical form of an equation that is used for a multiple regression
analysis is subjective to the statistical analysis that has been used.
Each publication has reported a different pore throat radius that controls the flow.
In each study, for the same pore throat radius, different regression constants have been
obtained.
Table 1 Empirical and theoretical petrophysical rock typing indices
Author(s) Type Data/basis Index Comments
Winland
(Kolodzie, 1980)
Empirical A mixed collection of sandstones and carbonates on Weyburn, Spindle and
Hidalgo fields in USA
Log(r35)= −0.996+ 0.588 Log(k)− 0.864 Log (ϕ)
Hereafter, k is
permeability in mD, ϕ is effective
porosity in fraction and ri is a
representative pore throat radius measured at
mercury saturation of 𝑖%. All indices
in this work are expressed in
microns
Kolodzie (1980) Empirical Spindle field shaly sandstone Log(r35)= −0.9008+ 0.5547 Log(k)− 0.9033 Log (ϕ)
-
Pittman (1992) Empirical 202 sandstones from 14 formations from Ordovician to Tertiary
Log(r20)= −0.388+ 0.519 Log(k)− 0.303 Log (ϕ)
-
Log(r25)= −0.496+ 0.531 Log(k)− 0.350 Log (ϕ)
Jaya et al. (2005) Empirical 273 sandstones and 42 limestones from Indonesian reservoirs
Log(r15)= 0.293 + 0.694 Log(k)− 3.604 (ϕ)
For sandstones
Log(r15)= 0.549 + 0.883 Log(k)− 4.399 (ϕ)
For limestones
Ngo et al. (2015) Empirical
Sandstone and carbonate rocks from Cuu Long and Song Hong basins in
Vietnam
Log(r55)= 25.9814− 2.6118 Log(k)+ 23.3716 Log (ϕ)
For sandstones
Log(r20)= −1.4946+ 0.8155 Log(k)− 1.5788 Log (ϕ)
For carbonates
Aguilera (2002) Empirical The empirical relationship between
MICP and k
ϕ developed by
Kwon and Pickett (1975) using 2500 sandstone and carbonate samples from
Log(r35)= −0.4743+ 0.45 Log(k)− 0.45 Log (ϕ)
-

4
30 different formations in North America
Amaefule et al.
(1993)
Theoretical Generalized form of Kozeny-Carman
equation 𝐹𝑍𝐼 =
0.0314 √k
ϕ
ϕ
1−ϕ
FZI is flow zone
indicator. The numerator was named RQI or
reservoir quality index
Jongkittinarukorn
and Tiab (1997)
Theoretical Application of several published shaly sand models
SZI =
0.0314 √k
ϕ
ϕm
SZI is shale zone indicator. In this
model, m depends
on the type of the
shale in the system (1.5 for sand
reservoirs, 2.5 for laminated shale and
structural shale, and 3.5 for
dispersed shale)
Nooruddin and
Hossain (2011)
Theoretical The generalized form of Kozeny-
Carman equation combined with two other equations which one relates tortuosity to formation resistivity
factor and porosity and the other one relates formation resistivity factor to
lithology factor and cementation exponent, m, (i.e. Archie’s equation)
FZIM =
0.0314 √k
ϕ
ϕm
1−ϕ
FZIM is a modified
FZI
Izadi and
Ghalambor (2013)
Theoretical The generalized form of Kozeny-Carman equation and by taking into
account the irreducible (or connate) water saturation, Swc
MFZI
=
0.0314 √k
ϕ × √1 − Swc
ϕ
1−ϕ(1 − Swc)2
MFZI is a modified FZI. The numerator
was referred to modified RQI
Ferreira et al.
(2015)
Theoretical The base form of Kozeny-Carman equation combined with Young–
Laplace capillary pressure equation RQI∗ = 0.0314 √
k
ϕτ
RQI* is a modified form of RQI and τ
is hydraulic tortuosity
This study Theoretical The base form of Kozeny-Carman
equation combined with Young–Laplace capillary pressure equation
𝑃𝑆𝑅𝑇𝐼 = 0.0314√k
ϕFsτ
PSRTI is an index
for characterization of PSRTs and Fs is
the shape factor
Theoretical The base form of Kozeny-Carman equation and Darcy’s law FZI∗ = 0.0314√
k
ϕ
FZI∗ (FZI-Star) is a
modified FZI for delineation of
PDRTs
We divide petrophysical rock typing into two categories of petrophysical static rock typing and
petrophysical dynamic rock typing. Despite the differences that exist between petrophysical
dynamic rock types (PDRTs) and petrophysical static rock types (PSRTs), these two have often
been considered the same without a proper distinction. In many occasions the terms such as a
petrophysical rock type, flow unit, and hydraulic flow unit (HFU) have interchangeably been
used without any universal definition. Gholami and Mohaghegh (2009) presented an overview of
different definitions that are used in the literature which are mostly qualitative and do not
differentiate between PSRTs and PDRTs.

5
We quantitatively define a PSRT as a collection of rocks with the same primary drainage
capillary pressure curves or unique water saturation for a given height above the free water level
(FWL). Identification of PSRTs is necessary in saturation-height calculations where the goal is to
calculate water saturation at different heights above the FWL. Our definition naturally implies
that any rock typing index that is developed from the drainage capillary pressure concept is only
applicable to static rock typing. We further define a PDRT (or HFU) as a class of rocks with
similar fluid flow behavior. Since the criterion “similar fluid flow behavior” is qualitative, it
would not be incorrect to use Darcy’s law to present an equivalent quantitative criterion.
Delineation of PDRTs is critical in assigning saturation functions to simulation/dynamic models
or whenever the purpose is to distinguish between flow capacity of rocks (e.g., perforation
placement and mud-loss prediction).
Researchers have assumed that rocks with the same drainage capillary pressure curves have
similar fluid flow behaviors (e.g. Saboorian-Jooybari et al. 2010, Izadi and Ghalambor, 2013,
Ferreira et al., 2015). This means that, regardless of wettability, static and dynamic rock types
are considered as one entity. However, it will be shown later, depending on the complexity of a
porous medium, this definition will fail, especially in carbonate rocks. Therefore, rocks within
one PSRT may represent separate PDRTs and vice versa. We emphasize that pore/network
geometry is the main reason for different static and dynamic characteristics which must be taken
into consideration for rock typing. Differentiation between static and dynamic rock types led us
to develop separate indices to define PSRTs and PDRTs.
2. Results
2.1. Index for dynamic rock typing
We took two separate approaches to develop an index for characterization of PDRTs. We will
first provide an overview of the basic and generalized forms of the Kozeny-Carman equation
since the FZI methods by Amaefule et al. (1993), Nooruddin and Hossain (2011) and Izadi and
Ghalambor (2013) were based on this equation. This is followed by derivation of a new index
which is a general solution that integrates FZI, FZIM and MFZI. Our second approach utilizes
Darcy’s law for single and multiphase flow. Based on Darcy’s law we quantitatively defined the
criterion of “the same fluid flow behavior” to generate an index for petrophysical dynamic rock
typing.
2.1.1. The Kozeny-Carman Equation

6
It is well understood that pore and network geometrical attributes control fluid flow. Any
petrophysical rock typing index should contain such attributes including: a pore body size and
shape, a pore throat size, an aspect ratio, a coordination number and pore arrangements. While
these attributes can be determined for each sample individually for rock typing (Davies and
Vessel, 1996), relationships between these micro-scale attributes and macro-scale easy-to-
measure parameters (i.e., porosity and permeability) can be made by theoretical studies. In this
regard, the Kozeny-Carman equation is a relationship which connects micro-scale attributes with
permeability and porosity. It is based on assuming a porous medium as a bundle of capillary
tubes (Kozeny, 1927; Carman, 1937) and is derived by equating Hagen-Poissoulle’s and Darcy’s
laws to establish a fundamental relationship between macroscopic properties of a porous medium
and microscopic attributes (pore characteristics). We refer to this equation as “the base form of
Kozeny-Carman”:
k = ϕrmh
2
Fsτ
Equation 1
in which rmh is the effective or mean hydraulic unit radius (defined as the ratio of a cross-
sectional area to a wetted perimeter), τ is the hydraulic tortuosity (defined as the ratio of actual
or microscopically-travelled length La to the system straight or macroscopic length L) (Shen and
Chen, 2007; Yun et al. 2008; Cai et al., 2014; ), and Fs is the shape factor introduced to account
for non-circular capillary tubes (Fs = 2 for a circular tube). In this equation the group rmh
2
Fsτ
includes microscopic properties and describes geological characteristics of sedimentary rocks.
The relationship between the mean hydraulic radius, rmh, the surface area per unit grain volume,
Sgv, and porosity can be expressed as (Kozeny, 1927; Carman, 1937):
rmh =1
Sgv(
ϕ
1 − ϕ)
Equation 2
According to this equation a microscopic property (rmh) is decomposed into a microscopic
property ( Sgv) and a macroscopic one (ϕ). Substituting Equation 2 in Equation 1 generates “the
generalized form of Kozeny-Carman” as:
k =ϕ3
(1 − ϕ)2(
1
FsτSgv2
)

7
Equation 3
In the resulting equation the group FsτSgv2 also contains microscopic properties of rocks.
Amaefule et al. (1993) rearranged this equation as:
Log (RQI) = Log (ϕ
1 − ϕ) + Log(FZI)
Equation 4
where RQI and FZI, both in µm, are defined as:
RQI = 0.0314 √k
ϕ
Equation 5
FZI =RQI
ϕ
1−ϕ
=1
√FsτSgv
Equation 6
Since the aforementioned microscopic properties are initially unknown for each rock, Amaefule
et al. (1993) presented a single variable called FZI. However, the problem raises if 𝐹𝑍𝐼 =1
√FsτSgv
can perfectly characterize different zones in terms of their flow characteristics. If it is assumed
that a porous medium contains layers of uniform spheres, the surface area per unit grain volume,
Sgv, can be written as:
Sgv =6
Dp
Equation 7
where Dp is the particle or grain diameter. Inserting Equation 7 in Equation 6 gives:
FZI =RQI
ϕ
1−ϕ
=Dp
6√Fsτ
Equation 8
In terms of microstructure characteristics of porous media this equation shows that FZI is a
function of a grain diameter, a shape factor, and hydraulic tortuosity. The quantity of direct
interest in the fluid flow through porous media is not a property of the solid component (e.g., a
grain diameter) but rather a property of pores (e.g., a pore size). In fact, we are interested to
know the corresponding pore space rather than the matrix volume. A closer look at Equation 1

8
reveals that rmh
2
Fsτ is the correct bundle of microstructural attributes of sedimentary rocks. In
addition to the shape factor (Fs) and hydraulic tortuosity (τ), rmh
2
Fsτ contains rmh which is the
quantity of direct interest in the fluid flow through porous media. Hence, if fluid properties
remain unchanged, Hagen-Poissoulle’s equation results in rmh
2
Fsτ to vary between the
v
dp/dx values
of different rock types (v is the fluid velocity or interstitial velocity and dp
dx is the pressure change
per unit length of a porous medium). Consequently, the term v
dp/dx can be used to characterize
fluid flow behavior of a rock. Previously, we used rmh
2
Fsτ as the correct flow zone indicator and to
create Equation 1 as below (Mirzaei-Paiaman et al., 2015):
FZI∗ = 0.0314√k
ϕ=
rmh
√Fsτ
Equation 9
In this equation FZI∗ (FZI-Star) in µm is the correct flow zone indicator.Thus, rocks with similar
FZI* show similar fluid flow behavior as a single PDRT. The numerical value of FZI* can be
calculated using Equation 9 for each rock with known measured porosity and permeability
values. Furthermore, graphically a plot of 0.0314√k versus √ϕ on a log-log scale becomes a
straight line with the slope of unity for rock samples within one PDRT or HFU. The intercept of
a unit-slope straight line with the coordinate ϕ = 1 is the FZI*. Likewise, samples with different
FZI* lay on a series of parallel unit-slope straight lines. Therefore, to predict permeability in un-
cored sections, the following equation can be used:
k = 1014 ϕ(FZI∗)2
Equation 10
k/ϕ for reservoir rock characterization, or as Amaefule et al. (1993) called it RQI, has been used
in the petroleum industry for decades. Besides it has been used in the Leverett J-function for
normalizing capillary pressure data. This term is also known as a process or delivery speed for
reservoir zonation (Chopra, 1988; Chopra et al., 1989; Aguilera, 2004). Xu and Torres-Verdín
(2012) used RQI to classify hydraulic rock types based on core measurements. The identified
hydraulic rock types were then used to rank saturation-dependent capillary pressure and relative
permeability data. Despite the different names for this group, this term only indicates the flow

9
deliverability potential of a rock. Thus, we use the term FZI* to directly define the ability of this
index to characterize the flow deliverability of the zone of interest.
2.1.2. Darcy’s law for single and multi-phase flow
One-dimensional flow of a single phase fluid in a homogeneous rock can be written by Darcy’s
law as:
u = −k
µ
dp
dx
Equation 11
where u is a velocity and µ is the fluid viscosity. In this equation, u is often referred to as the
Darcy velocity. The fluid velocity or interstitial velocity v is related to the Darcy velocity
through porosity to show the fraction of the total rock volume available for flow:
u = vϕ
Equation 12
Inserting Equation 12 in Equation 11 results in:
v
dp/dx= −
k
ϕ
1
µ
Equation 13
As stated before, in this equation the term v
dp/dx can be used to characterize fluid flow behavior
of rocks. Thus, systems with similar fluid flow characteristics are expected to have identical
v
dp/dx. In the above equation
k
ϕ and µ account for rock and fluid properties, respectively. If µ
remains constant then k
ϕ is the only parameter that controls fluid flow. Accordingly, for single
phase flow, Darcy’s law shows that FZI* becomes the most appropriate petrophysical rock
typing index that characterizes flow zones. In multiphase flow, Darcy’s law for water, oil and gas
can be expressed as:
vw
dpw/dx= −
kew
ϕ
1
µw= −
kkrw
ϕ
1
µw
Equation 14
vo
dpo/dx= −
keo
ϕ
1
µo= −
kkro
ϕ
1
µo
Equation 15
10
vg
dpg/dx= −
keg
ϕ
1
µg= −
kkrg
ϕ
1
µg
Equation 16
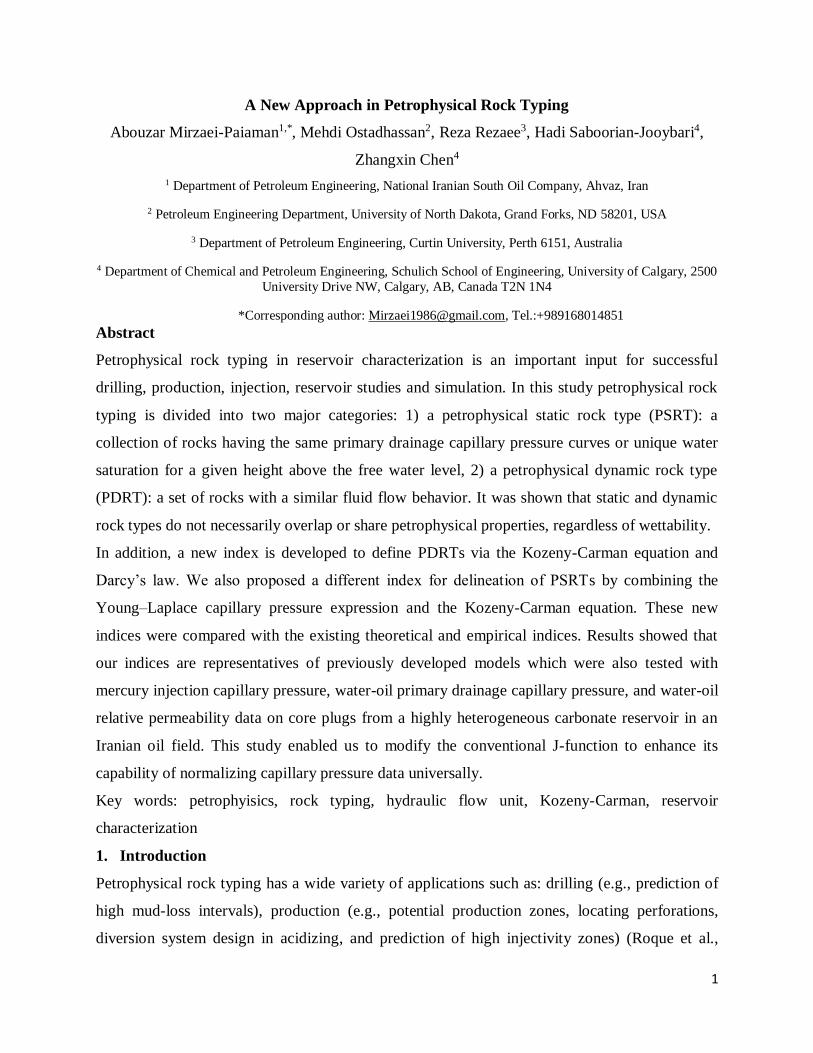
where subscripts w, o and g denote water, oil and gas, respectively, ke is effective permeability,
and kr is relative permeability. Thus, systems with similar multiphase flow characteristics are
expected to have equal vw
dpw/dx,
vo
dpo/dx and
vg
dpg/dx. If fluid properties remain constant then
ke
ϕ or
kkr
ϕ is the only parameter that controls fluid flow. This means rocks with similar flow
characteristics can show similar 𝑘𝑘𝑟
𝜙. This becomes very important in reservoir characterization
when analyzing SCAL data to identify different PDRTs. Although 𝑘𝑟 is a function of saturation,
FZI* can be considered as the petrophysical rock typing index that characterizes flow zones in
multiphase flow. Later in this manuscript we will use field data of a highly heterogeneous
carbonate formation in the southwestern part of Iran to show that PDRTs can be identified by
FZI* with distinct 𝑘𝑘𝑟
𝜙 versus saturation curves.
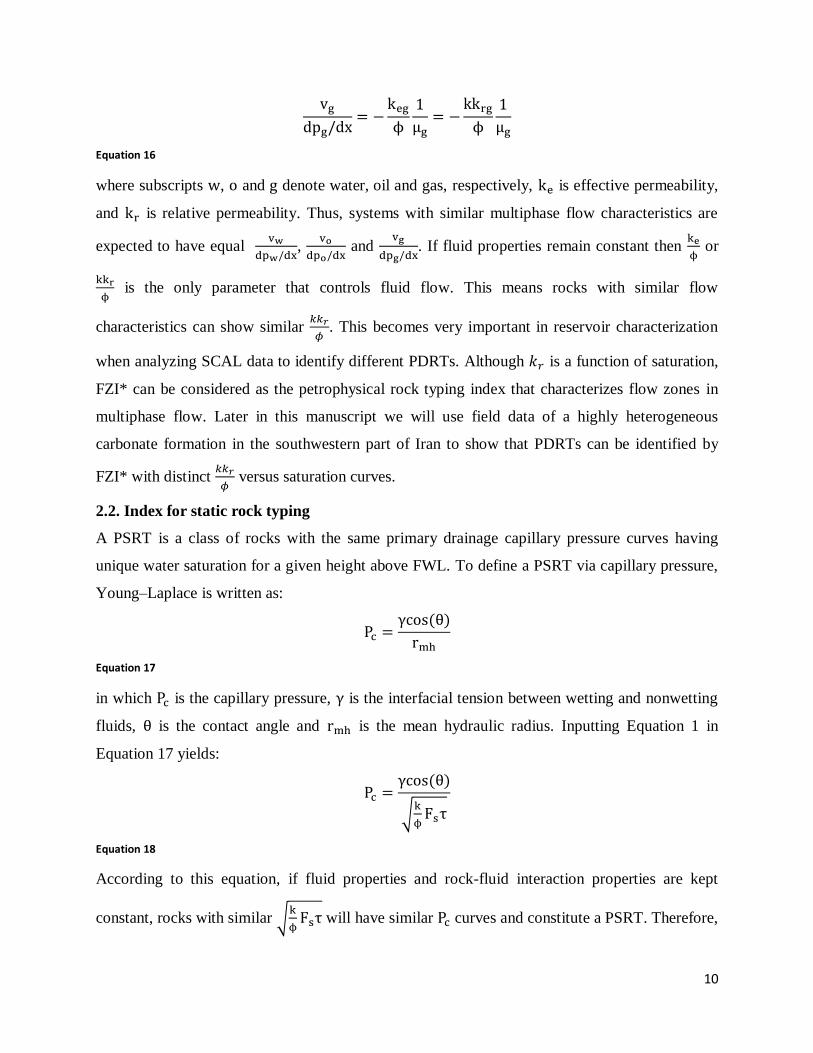
2.2. Index for static rock typing
A PSRT is a class of rocks with the same primary drainage capillary pressure curves having
unique water saturation for a given height above FWL. To define a PSRT via capillary pressure,
Young–Laplace is written as:
Pc =γcos (θ)
rmh
Equation 17
in which Pc is the capillary pressure, γ is the interfacial tension between wetting and nonwetting
fluids, θ is the contact angle and rmh is the mean hydraulic radius. Inputting Equation 1 in
Equation 17 yields:
Pc =γcos (θ)
√k
ϕFsτ
Equation 18
According to this equation, if fluid properties and rock-fluid interaction properties are kept
constant, rocks with similar √k
ϕFsτ will have similar Pc curves and constitute a PSRT. Therefore,

11
the correct PSRT indicator (PSRTI) in 𝝻m is 0.0314√k
ϕFsτ or FZI∗√Fsτ . In the petroleum
industry, if Fsτ is not measured for each rock individually, then FZI* is the only parameter that
may be used. Though, its accuracy depends on complexity of pore geometry. If all rocks have a
similar Fsτ value then FZI* would be sufficient for static rock typing. However, the assumption
of the same Fsτ may not happen always, and thus FZI* should be used with caution. The term
Fsτ that appears in PSRTI can be determined from MICP experiments (Purcell, 1949). Then a
correlation can be established to predict its value from well log data if lab measurements are not
available. Geostatistical techniques can be used to calculate a saturation-height to determine
initial water saturation in geologic models.
2.3.Relationship between PSRT and PDRT
In order to define the relationship between PSRT and PDRT, it is assumed that all fluid and rock-
fluid interaction properties are kept constant. In such a case, a porous medium is considered as a
bundle of capillary tubes which enables us to use the Kozeny-Carman equation. We consider two
different scenarios: 1) two porous media with similar capillary pressure curves (i.e., forming one
PSRT) but exhibiting different flow characteristics (i.e., falling in different PDRTs), and 2) two
porous media with different capillary pressure curves (i.e., not in one PSRT) but exhibiting
similar flow characteristics (i.e., in one PDRT). The first case scenario is shown in Figure 1
where both media have a length 𝐿. Medium A is comprised of two circular straight capillary
tubes (i.e., 𝜏 = 1) of radius 𝑟 while medium B is characterized by a single circular tortuous
capillary tube with radius 𝑟 and 𝜏 = 2. Because of a similar hydraulic radius and porosity, these
two porous media will have similar capillary pressure-liquid saturation curves and constitute a
single PSRT. However, the Kozeny-Carman equation yields 𝑘
𝜙=
𝑟2
4 for system A and
𝑘
𝜙=
𝑟2
16 for
system B reflecting different PDRTs. In the second scenario which is depicted in Figure 2, both
media have length 𝐿. Porous medium A is made up of four circular tortuous capillary tubes (i.e.,
𝜏 = 2) of radius 𝑟 while porous medium B is characterized by a single circular tortuous capillary
tube with radius 2𝑟 and 𝜏 = 2. Because of different hydraulic radii, these two porous media
exhibit different capillary pressure-liquid saturation curves and constitute two different PSRTs.
The Kozeny-Carman equation yields 𝑘
𝜙=
𝑟2
4 for both systems making them one PDRT.

12
Figure 1 Schematic representation of two porous media with similar capillary pressure curves (i.e. forming one PSRT) but exhibiting different flow characteristics (i.e. forming different PDRTs)
Figure 2 Schematic representation of two porous media with different capillary pressure curves (i.e. not in one PSRT) but exhibiting similar flow characteristics (i.e. forming one PDRT)
2.4. Relationship between empirical indices and FZI* and PSRTI
The presented index in this study for identification of PSRT (𝑃𝑆𝑅𝑇𝐼 = 0.0314√k
ϕFsτ) can be
written as:
Log(PSRTI) = Log(0.0314√Fsτ) + 0.5 Log(k) − 0.5 Log(ϕ)
Equation 19
Similarly, the FZI* for study of PDRTs can be expressed as:
Log(FZI∗) = −1.50307 + 0.5 Log(k) − 0.5 Log(ϕ)
Equation 20
Interestingly the mathematical forms of these two equations reveal that previous empirical
indices retain similar forms. Therefore, if the general index for petrophysical rock typing has the
following form, the literature empirical indices will optimize the associated constants 𝐶1, 𝐶2 and

13
𝐶3 as shown in Table 2 with the exception of Jaya et al. (2005) where a different mathematical
form was used for multiple regression analysis:
Log(index) = 𝐶1 + 𝐶2 Log(k) + 𝐶3 Log(ϕ)
Equation 21
It is worth mentioning that 𝐶1 in the case of PSRTI varies for each rock sample.
Table 2 Different indices and their constants
Author(s) Index 𝐶1 𝐶2 𝐶3
Winland (Kolodzie,
1980) 𝑟35 −0.996 0.588 −0.864
Kolodzie (1980) 𝑟35 −0.9008 0.5547 −0.9033
Pittman (1992) r20 −0.388 0.519 −0.303
r25 −0.496 0.531 −0.350
Ngo et al. (2015) r55 25.9814 −2.6118 23.3716
r20 −1.4946 0.8155 −1.5788
Aguilera (2002) r35 −0.4743 0.45 −0.45
This study PSRTI Log(0.0314√Fsτ) 0.5 −0.5
FZI* −1.50307 0.5 −0.5
2.5. Case Study
To check and compare different petrophysical rock typing indices, a carbonate oil reservoir in
the southwestern Iran has been used. The Albian-Campanian Bangestan group, containing Ilam
and Sarvak Formations, in Ahvaz field (Figure 4) is one of the most giant Middle Eastern
hydrocarbon reservoirs. In this study core-plug data of five wells were provided by National
Iranian South Oil Company (NISOC). Thin section petrographic studies depict that the
lithofacies can be classified using Dunham’s (1962) classification, as majorly packstone and
grainstone, occasionally wackstone and rarely mudstone (Figure 3). Diagenetic processes in this
reservoir have significantly altered the original rock fabric through dissolution (creating vuggy,
moldic, channel and micro-fracture secondary porosity types), compaction (dissolution seams
and stylolites), dolomitization and cementation.
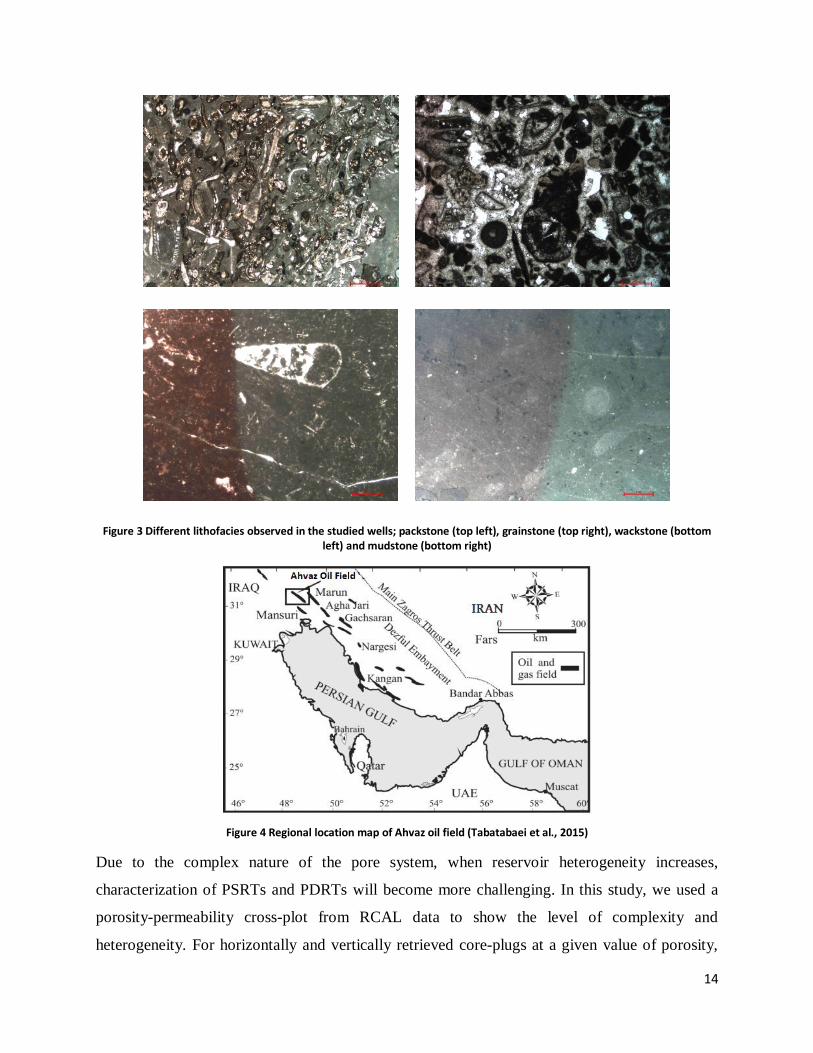
14
Figure 3 Different lithofacies observed in the studied wells; packstone (top left), grainstone (top right), wackstone (bottom left) and mudstone (bottom right)
Figure 4 Regional location map of Ahvaz oil field (Tabatabaei et al., 2015)
Due to the complex nature of the pore system, when reservoir heterogeneity increases,
characterization of PSRTs and PDRTs will become more challenging. In this study, we used a
porosity-permeability cross-plot from RCAL data to show the level of complexity and
heterogeneity. For horizontally and vertically retrieved core-plugs at a given value of porosity,

15
permeability varies over several orders of magnitude proving the highly heterogeneous
characteristics of the reservoir understudy (Figure 5).
Figure 5 Porosity-permeability cross-plot from RCAL study for horizontal (left) and vertical (right) core-plugs
A collection of various data including: MICP, water-oil primary drainage capillary pressure, and
water-oil relative permeability, strongly dependent on pore geometry and microstructural
characteristics, are integrated and analyzed to compare different petrophysical rock typing
indices. Rock samples within a PSRT must show similar primary drainage capillary pressure
curves (either MICP or water-oil) forming an individual cluster. Since more than one PSRT is
expected, several clusters representing several PSRTs appear. Furthermore, rocks within one
PDRT must show similar fluid flow behavior (i.e., dynamic state). Therefore, fluid flow data are
needed to confirm petrophysical dynamic rock typing indices. Previously, we (Mirzaei-Paiaman
and Saboorian-Jooybari, 2016) acquired the rate of spontaneous imbibition recovery for
validating the FZI** (FZI-Double Star) index whereas in this study water and oil relative
permeability data are used. Totally, 34 MICP, 66 water-oil primary capillary pressure, and 62
water-oil relative permeability tests were conducted on horizontal and vertical plugs with
porosities and permeabilities varying from 0.05 to 0.26 and 0.14 to 122.67 mD, respectively.
2.5.1. PSRTs using capillary pressure data
2.5.1.1. MICP data
We evaluate the ability of FZI*, FZI and Winland r35 in identification of PSRTs. PSRTI was
excluded since it requires the knowledge of rock microstructures (i.e., Fsτ). Such microstructural
data can be determined for each sample by integration of MICP curves as described by Purcell
(1949). However when MICP curves are utilized for verifying the performance of different
indices, Fsτ should be determined from other independent sources of data such as petrographic
0.001
0.01
0.1
1
10
100
1000
10000
0 0.05 0.1 0.15 0.2 0.25 0.3 0.35
Per
mea
bili
ty (m
D)
Porosity (decimal)
Horizontal plugs
0.001
0.01
0.1
1
10
100
1000
0 0.05 0.1 0.15 0.2 0.25 0.3 0.35
Per
mea
bili
ty (m
D)
Porosity (decimal)
Vertical plugs
16
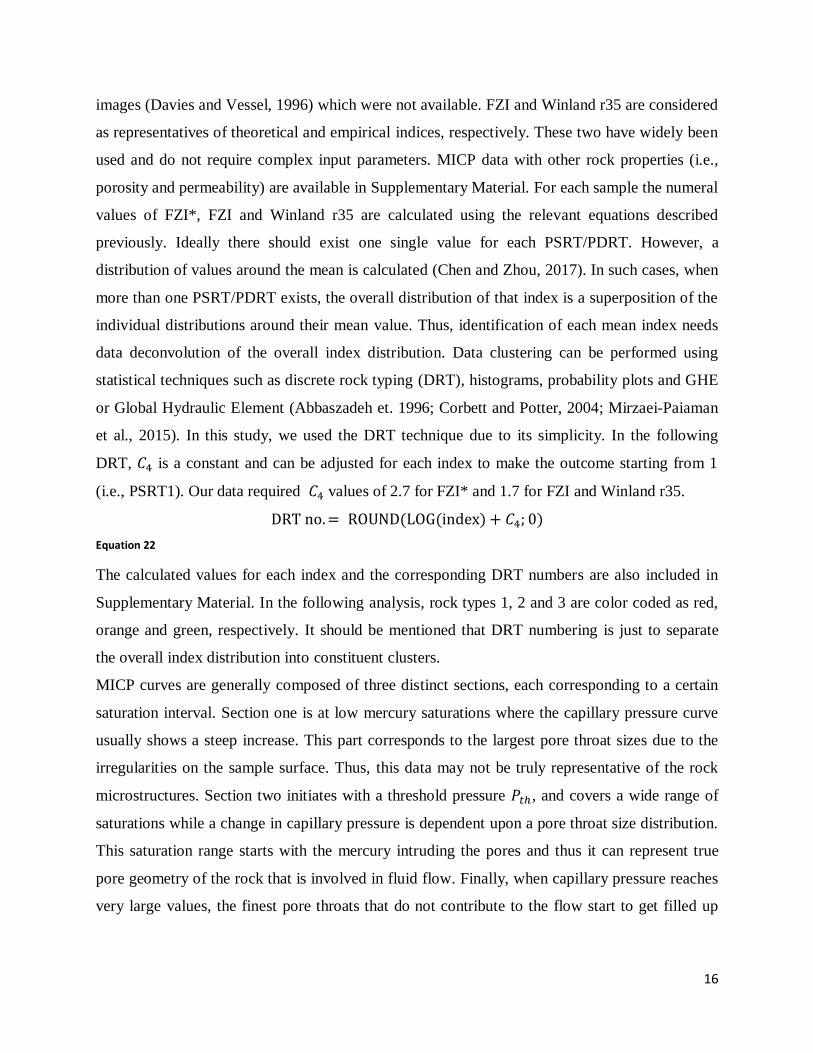
images (Davies and Vessel, 1996) which were not available. FZI and Winland r35 are considered
as representatives of theoretical and empirical indices, respectively. These two have widely been
used and do not require complex input parameters. MICP data with other rock properties (i.e.,
porosity and permeability) are available in Supplementary Material. For each sample the numeral
values of FZI*, FZI and Winland r35 are calculated using the relevant equations described
previously. Ideally there should exist one single value for each PSRT/PDRT. However, a
distribution of values around the mean is calculated (Chen and Zhou, 2017). In such cases, when
more than one PSRT/PDRT exists, the overall distribution of that index is a superposition of the
individual distributions around their mean value. Thus, identification of each mean index needs
data deconvolution of the overall index distribution. Data clustering can be performed using
statistical techniques such as discrete rock typing (DRT), histograms, probability plots and GHE
or Global Hydraulic Element (Abbaszadeh et. 1996; Corbett and Potter, 2004; Mirzaei-Paiaman
et al., 2015). In this study, we used the DRT technique due to its simplicity. In the following
DRT, 𝐶4 is a constant and can be adjusted for each index to make the outcome starting from 1
(i.e., PSRT1). Our data required 𝐶4 values of 2.7 for FZI* and 1.7 for FZI and Winland r35.
DRT no. = ROUND(LOG(index) + 𝐶4; 0)
Equation 22
The calculated values for each index and the corresponding DRT numbers are also included in
Supplementary Material. In the following analysis, rock types 1, 2 and 3 are color coded as red,
orange and green, respectively. It should be mentioned that DRT numbering is just to separate
the overall index distribution into constituent clusters.
MICP curves are generally composed of three distinct sections, each corresponding to a certain
saturation interval. Section one is at low mercury saturations where the capillary pressure curve
usually shows a steep increase. This part corresponds to the largest pore throat sizes due to the
irregularities on the sample surface. Thus, this data may not be truly representative of the rock
microstructures. Section two initiates with a threshold pressure 𝑃𝑡ℎ, and covers a wide range of
saturations while a change in capillary pressure is dependent upon a pore throat size distribution.
This saturation range starts with the mercury intruding the pores and thus it can represent true
pore geometry of the rock that is involved in fluid flow. Finally, when capillary pressure reaches
very large values, the finest pore throats that do not contribute to the flow start to get filled up

17
with mercury. The latest data also do not truly represent the effective microstructures of the
sample. In this study, we have focused on section two of the capillary pressure curve.
Figure 6 displays the MICP curves and the resulting PSRTs by FZI, FZI* and Winland r35
methods. FZI* and Winland r35 predict three PSRTs while FZI predicts only two clusters.
According to the Young-Laplace capillary pressure equation, capillary pressure is proportional to
the reciprocal of rmh meaning that as rmh decreases, Pc increases. Therefore, MICP curves of
PSRTs with smaller DRT numbers should place above the MICP curves of PSRTs with larger
DRT numbers. With a comparison of three plots in Figure 6, a better performance of FZI* in
identification of PSRTs is concluded. PSRT with DRT=1 (red color) situates above, PSRT with
DRT=3 (green color) is in the lowest region of the plot and PSRT with DRT=2 (orange) appears
in-between. FZI fails completely to identify PSRTs and the predicted PSRTs by this method do
not form distinct clusters. Winland r35 results in a better data clustering than FZI, and worse than
FZI*. It was found that FZI* has a better performance than other techniques; however, its ability
to identify PSRTs was not as expected. Also, the FZI* plot exhibits some MICP curves that do
not follow the anticipated trends which means some rocks identified by FZI* as PSRT1 will fall
in the PSRT2 cluster. The reasons for such behavior will be discussed later in text.

18
Figure 6 The MICP curves and the resulting PSRTs by FZI* (top), FZI (middle) and Winland r35 (bottom)
Assuming that a porous medium is a bundle of circular tubes, MICP curves can be converted to
incremental mercury saturation vs. a pore throat radius through the Young-Laplace capillary
pressure equation. The resulting curves are shown in Figure 7 where PSRTs that are predicted by
each index are also shown. In this figure the data of aforementioned sections two and three of
MICP curves are only used. Ideally each PSRT must have similar pore throat size distributions;
therefore, in this figure it is expected to observe distinct clusters. Comparison of different plots
in this figure reveals that FZI* has a significantly better performance than FZI and Winland r35.
Winland r35, despite inferior performance than FZI*, is more accurate than FZI in identifying
PSRTs.
0.1
1
10
100
1000
10000
100000
0 20 40 60 80 100
Ca
pill
ary
pre
ssu
re (
psia
)
Mercury saturation (%)
0.1
1
10
100
1000
10000
100000
0 20 40 60 80 100
Ca
pill
ary
pre
ssu
re (
psia
)
Mercury saturation (%)
0.1
1
10
100
1000
10000
100000
0 20 40 60 80 100
Ca
pill
ary
pre
ssu
re (
psia
)
Mercury saturation (%)
FZI*
FZI
r35

19
Figure 7 The incremental mercury saturation vs. pore throat radius curves and the resulting PSRTs by FZI* (top), FZI (middle)
and Winland r35 (bottom)
To investigate the relationship between different indices and the threshold pressure (Pth) this
parameter was obtained for each MICP curve as well. Donaldson (1991) proposed extrapolation
of a capillary pressure curve to mercury saturation of 100% to determine the threshold pressure.
Katz and Thompson (1986) took the inflection point on a MICP curve to represent the threshold
pressure. In this study on the log-log plot of capillary pressure vs. saturation, the intersection of
two fitted straight lines through the data points on two separate sides of the inflection point is
considered as the threshold pressure. An example is shown in Figure 8 and the calculated
threshold pressures are listed in Supplementary Material.
Figure 9 explains the relationship between different indices and the threshold pressure. As 𝑃𝑡ℎ
increases the indices should decrease. Here we compare the indices from two separate
0
5
10
15
20
25
30
0.001 0.01 0.1 1 10 100
Incre
am
enta
l M
erc
ury
Satu
ration (%
)
Pore Throat size (µm)
FZI
0
5
10
15
20
25
30
0.001 0.01 0.1 1 10 100
Incre
am
enta
l M
erc
ury
Satu
ration (%
)
Pore Throat size (µm)
FZI*
r35
0
5
10
15
20
25
30
0.001 0.01 0.1 1 10 100
Incre
am
enta
l M
erc
ury
Satu
ration (%
)
Pore Throat size (µm)
r35

20
perspectives, 1) in terms of the correlation coefficient FZI* has the highest 𝑅2 = 0.44, Winland
r35 is the next (𝑅2 = 0.30) and FZI with 𝑅2 = 0.11 stands the last, 2) with respect to the 𝑃𝑡ℎ
range for each PSRT, where the PSRTs identified by FZI* have distinct ranges and the PSRTs
by FZI have almost similar ranges. Considering Winland r35, PSRT1 and PSRT2 express
significant overlapping.
To further investigate the relationship between different indices and other major parameters of
capillary pressure curves, we fit Thomeer’s (1960) model to our MICP data. Although the quality
of match cases was not acceptable overall, we tried to obtain the Thomeer geometrical factor
from the matches. We were not able to establish any meaningful relationship between the indices
and geometrical factor which might be due to the complex pore structure of the samples caused
by severe digenetic processes.
Figure 8 Graphical representation of the procedure used to determine threshold pressure from MICP data
0.1
1
10
100
1000
10000
100000
0.01 0.1 1
Cap
illar
y p
ress
ure
(psi
a)
Mercury saturation (decimal)
Threshold pressure

21
Figure 9 The relationship between different indices and the threshold pressure
We also obtained the experimentally measured r35 for each sample (see Supplementary
Material). Various indices are also plotted vs. measured r35s and shown in Figure 10.
Considering Winland r35, the correlation coefficient is 0.55 confirming non-universality and
strong locality of such empirical equations. Interestingly, FZI* had a similar 𝑅2 while FZI
resulted in the lowest 𝑅2= 0.20.
y = 0.85x-0.45
R² = 0.44
0.01
0.10
1.00
1 10 100 1000
FZI*
(mic
ro m
)Threshold pressure (psia)
PSRT1
PSRT2
PSRT3
Trendline
y = 2.07x-0.21
R² = 0.11
0.10
1.00
10.00
1 10 100 1000
FZI (
mic
ro m
)
Threshold pressure (psia)
PSRT1
PSRT2
Trendline
y = 5.82x-0.42
R² = 0.30
0.10
1.00
10.00
1 10 100 1000
r35
(mic
ro m
)
Threshold pressure (psia)
PSRT1
PSRT2
PSRT3
Trendline

22
Figure 10 The relationship between different indices and the measured r35
2.5.1.2. Water-oil primary drainage capillary pressure data
We evaluate the accuracy of FZI*, FZI, Winland r35 and also MFZI to identify PSRTs. Sample
properties are summarized in Supplementary Material. FZI*, FZI, Winland r35 and MFZI and
the corresponding DRT numbers with 𝐶4 = 1.7 for MFZI are calculated using the equations
described previously. Figure 11 depicts the capillary pressure curves and the resulting PSRTs
obtained by each method. FZI*, Winland r35 and MFZI provided us with three PSRTs while FZI
identifies only two. Water-oil primary drainage capillary pressure experiments are performed by
oil displacing water from the properly cleaned 100% water-saturated samples until the
irreducible water saturation is achieved. Generally, rocks with lower PSRT values (i.e., tighter
rocks with low permeability) should exhibit higher irreducible water saturations than those with
higher PSRT values. Similarly, it is found from capillary pressure curves that tighter PSRTs
y = 0.07x + 0.13R² = 0.55
0.01
0.10
1.00
0.01 0.10 1.00 10.00
FZI*
(mic
ro m
)
Measured r35 (micro m)
PSRT1
PSRT2
PSRT3
Trendline
y = 0.27x + 0.92R² = 0.20
0.10
1.00
10.00
0.01 0.10 1.00 10.00
FZI
(mic
ro m
)
Measured r35 (micro m)
PSRT1
PSRT2
Trendline
y = 0.68x + 0.91R² = 0.55
0.10
1.00
10.00
0.01 0.10 1.00 10.00
r35
(m
icro
m)
Measured r35 (micro m)
PSRT1
PSRT2
PSRT3
Trendline

23
yield higher water saturations. In another words, at a given water saturation, tighter PSRTs
require higher capillary pressure values. Such phenomenon leads to water-oil primary drainage
capillary pressure curves of tighter PSRTs to position on the right side of the higher DRT values
of PSRTs. Figure 11 proves a better performance of FZI* in identification of PSRTs compared to
other methods. It is expected that rocks within PSRT of DRT=1 (red color) appear at the right
side of other two PSRTs, DRT=3 (green color) on the left side of the plot and DRT=2 (orange)
in-between. It was observed that FZI and MFZI fail in identification of PSRTs and the predicted
PSRTs do not form distinct clusters. Also, MFZI performed significantly poorer than FZI. The
Winland r35 index resulted in a better data clustering than FZI and MFZI, but inferior than FZI*.
Similar to the MICP case, although FZI* generates a considerably better result than other
techniques, its ability to identify PSRTs was not as expected.
Figure 11 The water-oil primary drainage capillary pressure curves and the resulting PSRTs by FZI* (top left), FZI (top right), MFZI (bottom right) and Winland r35 (bottom left)
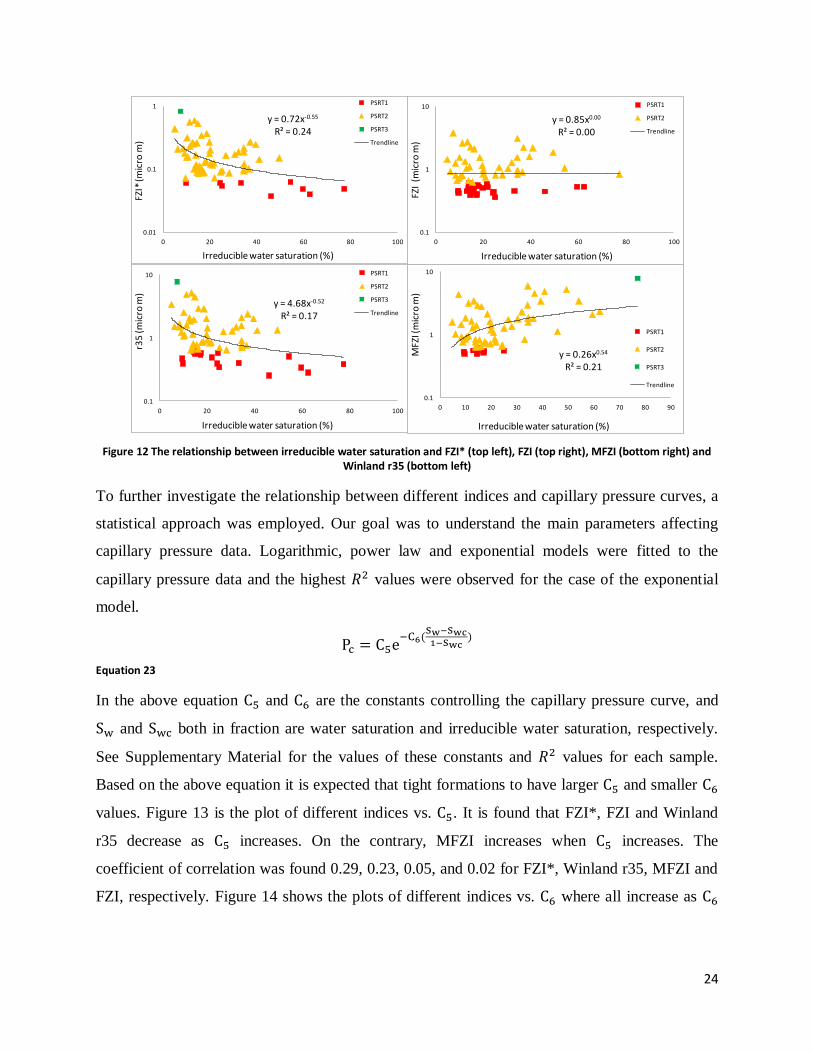
To study the relationship between different indices and irreducible water saturation, the plots in
Figure 12 are generated. As stated before, for similar wettability tighter rocks have a greater
irreducible water saturation. Thus, it is predictable that as irreducible water saturation increases,
the indices decrease. This was only observed for FZI* and Winland r35 with correlation
coefficients of 0.24 and 0.17, respectively. MFZI exhibited a reverse (increasing) trend than
FZI* and winland r35.
0
50
100
150
200
250
300
0 20 40 60 80 100
Ca
pilla
ry p
ressu
re (
psia
)
Water saturation (%)
FZI
0
50
100
150
200
250
300
0 20 40 60 80 100
Ca
pilla
ry p
ressu
re (
psia
)
Water saturation (%)
r35
0
50
100
150
200
250
300
0 20 40 60 80 100
Ca
pilla
ry p
ressu
re (
psia
)
Water saturation (%)
0
50
100
150
200
250
300
350
0 20 40 60 80 100
Ca
pilla
ry p
ressu
re (
psia
)
Water saturation (%)
FZI*
MFZI
24
Figure 12 The relationship between irreducible water saturation and FZI* (top left), FZI (top right), MFZI (bottom right) and Winland r35 (bottom left)
To further investigate the relationship between different indices and capillary pressure curves, a
statistical approach was employed. Our goal was to understand the main parameters affecting
capillary pressure data. Logarithmic, power law and exponential models were fitted to the
capillary pressure data and the highest 𝑅2 values were observed for the case of the exponential
model.
Pc = C5e−C6(
Sw−Swc1−Swc
)
Equation 23
In the above equation C5 and C6 are the constants controlling the capillary pressure curve, and
Sw and Swc both in fraction are water saturation and irreducible water saturation, respectively.
See Supplementary Material for the values of these constants and 𝑅2 values for each sample.
Based on the above equation it is expected that tight formations to have larger C5 and smaller C6
values. Figure 13 is the plot of different indices vs. C5. It is found that FZI*, FZI and Winland
r35 decrease as C5 increases. On the contrary, MFZI increases when C5 increases. The
coefficient of correlation was found 0.29, 0.23, 0.05, and 0.02 for FZI*, Winland r35, MFZI and
FZI, respectively. Figure 14 shows the plots of different indices vs. C6 where all increase as C6
y = 0.72x-0.55
R² = 0.24
0.01
0.1
1
0 20 40 60 80 100
FZI
(mic
ro m
)
Irreducible water saturation (%)
PSRT1
PSRT2
PSRT3
Trendline
y = 0.85x0.00
R² = 0.00
0.1
1
10
0 20 40 60 80 100
FZI
(mic
ro m
)
Irreducible water saturation (%)
PSRT1
PSRT2
Trendline
y = 4.68x-0.52
R² = 0.17
0.1
1
10
0 20 40 60 80 100
r35
(mic
ro m
)
Irreducible water saturation (%)
PSRT1
PSRT2
PSRT3
Trendline
y = 0.26x0.54
R² = 0.21
0.1
1
10
0 10 20 30 40 50 60 70 80 90M
FZI (
mic
ro m
)Irreducible water saturation (%)
PSRT1
PSRT2
PSRT3
Trendline

25
increases. The coefficient of correlation was found 0.29, 0.28, 0.24 and 0.16 for Winland r35,
FZI*, FZI and MFZI, respectively.
Figure 13 Different indices vs. C5.FZI* (top left), FZI (top right), MFZI (bottom right) and Winland r35 (bottom left)
Figure 14 Different indices vs. C6. FZI* (top left), FZI (top right), MFZI (bottom right) and Winland r35 (bottom left)
2.5.2. PDRTs
y = 14.78x-0.89
R² = 0.29
0.01
0.1
1
0 200 400 600 800 1000 1200
FZI *
(mic
ro m
)
C5
PSRT1
PSRT2
PSRT3
Trendline
y = 2.27x-0.19
R² = 0.02
0.1
1
10
0 200 400 600 800 1000 1200
FZI
(mic
ro m
)
C5
PSRT1
PSRT2
Trendline
y = 99.11x-0.87
R² = 0.23
0.1
1
10
0 200 400 600 800 1000 1200
Emp
iric
al r
35
(m
icro
m)
C5
PSRT1
PSRT2
PSRT3
Trendline
y = 0.17x0.39
R² = 0.05
0.1
1
10
0 200 400 600 800 1000 1200
MFZ
I (m
icro
m)
C5
PSRT1
PSRT2
PSRT3
Trendline
y = 0.002x2.586
R² = 0.278
0.01
0.1
1
0 2 4 6 8 10 12
FZI *
(mic
ro m
)
C6
PSRT1
PSRT2
PSRT3
Trendline
y = 0.02x2.14
R² = 0.24
0.1
1
10
0 2 4 6 8 10 12
FZI
(mic
ro m
)
C6
PSRT1
PSRT2
Trendline
y = 0.01x2.94
R² = 0.29
0.1
1
10
0 2 4 6 8 10 12
r35
(mic
ro m
)
C6
PSRT1
PSRT2
PSRT3
Trendline
y = 0.04x2.06
R² = 0.16
0.1
1
10
0 2 4 6 8 10 12
MFZ
I (m
icro
m)
C6
PSRT1
PSRT2
PSRT3
Trendline

26
To compare different indices in characterizing PDRTs, water-oil relative permeability
experiments were carried out. Sample properties, FZI*, FZI, Winland r35 and MFZI and DRT
values are calculated and presented in Supplementary Material. As explained earlier, PDRT is
defined as a collection of rocks having similar fluid flow characteristics. Thus when dealing with
water-oil displacement experiments, keeping all other factors constant, rocks within one PDRT
must have similar 𝑘𝑒𝑤
𝜙 (or
𝑘𝑘𝑟𝑤
𝜙) and
𝑘𝑒𝑜
𝜙 (or
𝑘𝑘𝑟𝑜
𝜙) values. Moreover, rocks with a higher DRT
number should appear on the upper region of 𝑘𝑒𝑤
𝜙 and
𝑘𝑒𝑜
𝜙 vs. water saturation cross-plots. Figure
15 and Figure 16 display PDRTs by each method using effective permeability data. FZI* and
Winland r35 predicted three PDRTs whereas FZI and MFZI yielded two. FZI* showed the best
performance in data clustering especially with water effective permeability. This can be due to
the oil-wet characteristic of larger pores. In Winland r35, PDRT 1 and PDRT2 overlapped
partially, especially with oil effective permeability data. FZI and MFZI did not generate any
distinct PDRT.
Figure 15 The 𝐤𝐞𝐰
𝛟 vs. water saturation curves and the resulting PDRTs by FZI* (top left), FZI (top right), MFZI (bottom right)
and Winland r35 (bottom left)
0.01
0.1
1
10
100
1000
0 10 20 30 40 50 60 70 80 90 100
kew
/ (m
D)
Water saturation (%)
FZI*
0.01
0.1
1
10
100
1000
0 10 20 30 40 50 60 70 80 90 100
kew
/ (m
D)
Water saturation (%)
0.01
0.1
1
10
100
1000
0 10 20 30 40 50 60 70 80 90 100
kew
/ (m
D)
Water saturation (%)
FZI
r35MFZI
0.01
0.1
1
10
100
1000
0 10 20 30 40 50 60 70 80 90 100
ke
w/
(mD
)
Water saturation (%)
MFZI

27
Figure 16 The 𝐤𝐞𝐨
𝛟 vs. water saturation curves and the resulting PDRTs by FZI* (top left), FZI (top right), MFZI (bottom right)
and Winland r35 (bottom left)
Effective permeabilities at 𝑆𝑤𝑐, residual oil saturation (𝑆𝑜𝑟), and (𝑘𝑒
𝜙)𝑤=(
𝑘𝑒
𝜙)𝑜 points reflect pore
geometry. Hence, their relationship with different indices can be investigated further. These data
points are also presented in Supplementary Material for each sample. Figure 17 depicts different
indices vs. 𝑘𝑒𝑤
𝜙 at 𝑆𝑜𝑟 . In terms of the correlation coefficients, FZI* has the highest 𝑅2 of 0.91,
followed by 0.89, 0.57 and 0.50 for Winland r35, MFZI and FZI, respectively. Furthermore, we
realized FZI* outperforms other methods by generating distinct PDRTs.
0.000001
0.00001
0.0001
0.001
0.01
0.1
1
10
100
0 10 20 30 40 50 60 70 80 90 100
keo
/ (m
D)
Water saturation (%)
0.000001
0.00001
0.0001
0.001
0.01
0.1
1
10
100
0 10 20 30 40 50 60 70 80 90 100
ke
o/
(mD
)
Water saturation (%)
0.000001
0.00001
0.0001
0.001
0.01
0.1
1
10
100
0 10 20 30 40 50 60 70 80 90 100
ke
o/
(mD
)
Water saturation (%)
FZI* FZI
MFZIr35
0.000001
0.00001
0.0001
0.001
0.01
0.1
1
10
100
0 10 20 30 40 50 60 70 80 90 100
ke
o/
(mD
)
Water saturation (%)
MFZI

28
Figure 17 The relationship between different indices and the 𝐤𝐞𝐰
𝛟 at 𝐒𝐨𝐫. FZI* (top left), FZI (top right), MFZI (bottom right) and
Winland r35 (bottom left)
The plot of different indices vs. 𝑘𝑒𝑜
𝜙 at 𝑆𝑤𝑐 is displayed in Figure 18. The correlation coefficients
were calculated 0.90, 0.85, 0.42 and 0.50 for FZI*, Winland r35, FZI and MFZI, respectively,
which confirms the best performance by FZI* compared to other methods. In addition, all indices
were plotted vs. 𝑘𝑒
𝜙 at the cross-over saturation point in Figure 19. FZI* with the highest 𝑅2 of
0.86 provided us with the best PDRTs in comparison to Winland r35, FZI and MFZI with
correlation coefficients of 0.84, 0.49 and 0.55, respectively.
y = 0.07x0.40
R² = 0.91
0.00
0.10
0.20
0.30
0.40
0.50
0.60
0.70
0.80
0.90
0.1 1 10 100 1000
FZI*
(mic
ro m
)
Kew/ at end point (mD)
PDRT1
PDRT2
PDRT3
Trendline
y = 0.55x0.26
R² = 0.50
0.00
0.50
1.00
1.50
2.00
2.50
3.00
3.50
4.00
4.50
0.1 1 10 100 1000
FZI (
mic
ro m
)
Kew/ at end point (mD)
PDRT1
PDRT2
Trendline
y = 0.50x0.44
R² = 0.89
0.00
1.00
2.00
3.00
4.00
5.00
6.00
7.00
8.00
9.00
0.1 1 10 100 1000
r35
(mic
ro m
)
Kew/ at end point (mD)
PDRT1
PDRT2
PDRT3
Trendline
y = 0.76x0.30
R² = 0.57
0.00
1.00
2.00
3.00
4.00
5.00
6.00
0.1 1 10 100 1000M
FZI (
mic
ro m
)Kew/ at end point (mD)
PDRT1
PDRT2
Trendline

29
Figure 18 The relationship between different indices and the 𝐤𝐞𝐨
𝛟 at 𝐒𝐰𝐜. FZI* (top left), FZI (top right), MFZI (bottom right) and
Winland r35 (bottom left)
Figure 19 The relationship between different indices and the 𝐤𝐞
𝛟 at cross-over point. FZI* (top left), FZI (top right), MFZI
(bottom right) and Winland r35 (bottom left)
y = 0.06x0.40
R² = 0.90
0.00
0.10
0.20
0.30
0.40
0.50
0.60
0.70
0.80
0.90
0.1 1 10 100 1000
FZI*
(mic
ro m
)
Keo/ at end point (mD)
PDRT1
PDRT2
PDRT3
Trendline
y = 0.48x0.24
R² = 0.42
0.00
0.50
1.00
1.50
2.00
2.50
3.00
3.50
4.00
4.50
0.1 1 10 100 1000
FZI (
mic
ro m
)
Keo/ at end point (mD)
PDRT1
PDRT2
Trendline
y = 0.37x0.43
R² = 0.85
0.00
1.00
2.00
3.00
4.00
5.00
6.00
7.00
8.00
9.00
0.1 1 10 100 1000
r35
(mic
ro m
)
Keo/ at end point (mD)
PDRT1
PDRT2
PDRT3
Trendline
y = 0.65x0.28
R² = 0.50
0.00
1.00
2.00
3.00
4.00
5.00
6.00
0.1 1 10 100 1000M
FZI (
mic
ro m
)
Keo/ at end point (mD)
PDRT1
PDRT2
Trendline
y = 0.12x0.42
R² = 0.86
0.00
0.10
0.20
0.30
0.40
0.50
0.60
0.70
0.80
0.90
0.01 0.1 1 10
FZI*
(m
icro
m)
Ke/ at cross-over point (mD)
PDRT1
PDRT2
PDRT3
Trendline
y = 0.75x0.28
R² = 0.49
0.00
0.50
1.00
1.50
2.00
2.50
3.00
3.50
4.00
4.50
0.01 0.1 1 10
FZI (
mic
ro m
)
Ke/ at cross-over point (mD)
PDRT1
PDRT2
Trendline
y = 0.82x0.45
R² = 0.84
0.00
1.00
2.00
3.00
4.00
5.00
6.00
7.00
8.00
9.00
0.01 0.1 1 10
r35
(mic
ro m
)
Ke/ at cross-over point (mD)
PDRT1
PDRT2
PDRT3
Trendline
y = 1.07x0.31
R² = 0.55
0.00
1.00
2.00
3.00
4.00
5.00
6.00
0.01 0.1 1 10
MFZ
I (m
icro
m)
Ke/ at cross-over point (mD)
PDRT1
PDRT2
Trendline

30
We studied the relationship between different indices and parameters governing on water-oil 𝑘𝑒
𝜙
curves. We found that power-law and logarithmic functions will result in the best 𝑅2 values for
𝑘𝑒𝑤
𝜙 and
𝑘𝑒𝑜
𝜙, correspondingly. The equations of these functions are as follows:
kew
ϕ= C7(
Sw − Swc
1 − Sor − Swc)C8
Equation 24
keo
ϕ= C9Ln (
Sw − Swc
1 − Sor − Swc)
Equation 25
in which C7, C8 and C9 are constants. The values of C7 and C9 and the associated 𝑅2 values can
be found in Supplementary Material. We were not able to delineate any meaningful trend
between C8 and the indices. Figure 20 is the indices vs. C7 and shows they increase as C7
increases. The coefficient of correlation was calculated 0.91, 0.89, 0.59, and 0.52 for FZI*,
Winland r35, MFZI and FZI, respectively. Figure 21 is the cross-plot of different indices vs. C9.
The indices increase as C9 increases with correlation coefficients of 0.84, 0.80, 0.45 and 0.38 for
FZI*, Winland r35, MFZI, and FZI, correspondingly.
Figure 20 Different indices vs. C7. FZI* (top left), FZI (top right), MFZI (bottom right) and Winland r35 (bottom left)
y = 0.08x0.40
R² = 0.91
0.00
0.10
0.20
0.30
0.40
0.50
0.60
0.70
0.80
0.90
0.1 1 10 100 1000
FZI*
(mic
ro m
)
C7
PDRT1
PDRT2
PDRT3
Trendline
y = 0.56x0.27
R² = 0.52
0.00
0.50
1.00
1.50
2.00
2.50
3.00
3.50
4.00
4.50
0.1 1 10 100 1000
FZI (
mic
ro m
)
C7
PDRT1
PDRT2
Trendline
y = 0.52x0.44
R² = 0.89
0.00
1.00
2.00
3.00
4.00
5.00
6.00
7.00
8.00
9.00
0.1 1 10 100 1000
r35
(mic
ro m
)
C7
PDRT1
PDRT2
PDRT3
Trendline
y = 0.78x0.30
R² = 0.59
0.00
1.00
2.00
3.00
4.00
5.00
6.00
0.1 1 10 100 1000
MFZ
I (m
icro
m)
C7
PDRT1
PDRT2
Trendline

31
Figure 21 Different indices vs. C9. FZI* (top left), FZI (top right), MFZI (bottom right) and Winland r35 (bottom left)
3. Discussion
Geological significance of FZI*
In clastic rocks, when the initial state of pores is not altered by diagenesis, grains will be
subspherical. In this regard, when the grains are larger, both pores and pore throat sizes increase
(Rashid et al., 2015). However, carbonates will undergo a significant level of diagenesis which
modifies original intact pore networks. This will make proposing a unique relationship between a
grain size and a pore size/pore throat size very difficult. Based on our theoretical analysis, FZI
that is derived from the general form of the Kozeny-Carman equation contains the term that
represents a grain diameter, 𝐷𝑝, whereas fluid flow is not directly related to solid matrix
properties. On the contrary, FZI* contains the properties of a pore network which makes it
superior to FZI. The Nooruddin and Hussain (2011) and Izadi and Ghalambor (2013) models are
also based on the general form of the Kozeny-Carman equation, which makes them venerable to
this problem. Additionally, the model by Nooruddin and Hussain (2011) does not consider the
tortuosity properly in determining the rock types. It should also be noted that the Nooruddin and
Hussain (2011) model is more complicated than the original FZI approach considering its
dependency on a cementation factor, which usually needs SCAL measurements. In addition, the
y = 0.80x0.25
R² = 0.38
0.00
0.50
1.00
1.50
2.00
2.50
3.00
3.50
4.00
4.50
0.01 0.1 1 10
FZI (
mic
ro m
)
C9
PDRT1
PDRT2
Trendline
y = 0.91x0.46
R² = 0.80
0.00
1.00
2.00
3.00
4.00
5.00
6.00
7.00
8.00
9.00
0.01 0.1 1 10
r35
(mic
ro m
)
C9
PDRT1
PDRT2
PDRT3
Trendline
y = 0.13x0.42
R² = 0.84
0.00
0.10
0.20
0.30
0.40
0.50
0.60
0.70
0.80
0.90
0.01 0.1 1 10
FZI*
(mic
ro m
)
C9
PDRT1
PDRT2
PDRT3
Trendline
y = 1.15x0.29
R² = 0.45
0.00
1.00
2.00
3.00
4.00
5.00
6.00
0.01 0.1 1 10M
FZI (
mic
ro m
)
C9
PDRT1
PDRT2
Trendline
32
connate water saturation which is a function of wettability may have an adverse effect on
evaluating a petrophysical rock type developed by Izadi and Ghalambor (2013).
Effective porosity vs. connected porosity
In a porous medium where a variety of pore throat sizes exist, only a portion of the total
connected pore spaces effectively contributes to the flow. This portion constitutes a class of
larger pore throats and causes other smaller pore throats to have a minimal impact on
permeability. If the porosity that is derived from the total connected pore spaces is called
connected porosity, then the portion of this connected porosity that has a role in fluid flow is
effective porosity. This is the porosity that is considered in flow equations and FZI*. Though,
connected porosity instead of effective porosity is usually measured in the lab. This problem can
be addressed if MICP data are acquired (Rabiller, 2017). In carbonate rocks such substitution of
porosity values may introduce a significant error to the results due to the strong influence of
diagenesis on pore-network geometry and heterogeneity. This can be one of the reasons of
abnormal MICP and water-oil primary drainage capillary pressure data when clustering with
FZI*. Besides, another main factor that may cause such deviation is that FZI* was employed
instead of PSRTI to delineate PSRTs. This means the term √Fsτ was not considered in
evaluations.
Relative permeability curves
A common understanding in rock typing studies has historically been that rocks within one
PDRT should exhibit similar relative permeability 𝑘𝑟 data (i.e., 𝑘𝑟 vs 𝑆𝑤 curves). Through an
extensive search in the literature, one cannot find any scientific reasoning for it. Additionally,
since relative permeability is a normalized parameter and varies between zero and one,
establishing a robust relationship between PDRTs and relative permeability will become very
challenging (see Figure 22). Our analysis shows that 𝑘𝑒
𝜙 vs 𝑆𝑤 should be plotted to reveal different
rock type clusters. For the samples studied here, a mixed-wet characteristic was observed. In this
case, smaller pores remain water-wet while larger oil-wet pores will control the flow. Finally, we
assumed all rocks studied are oil-wet, which is not an incorrect assumption, considering the oil-
wet nature of most carbonate rocks (Mirzaei-Paiaman et al., 2013).

33
Figure 22 The krw and kro vs. water saturation curves and the resulting PDRTs by FZI*
J-function and its modification
One of the main contributions of this study is proposing a modification for the conventional J-
function. So far, it’s believed that 𝑘
𝜙 in the J-function is sufficient to model rock microstructure
to normalize the capillary pressure data. However, researchers have pointed out that the J-
function is not recommended for carbonate rock characterization and have proposed additional
refinements and restrictions (e.g., applying lithology type and texture information) (Brown,
1951, Rebelle et al., 2014). This denotes that an additional term should be added to the J-function
to enhance its applicability in characterizing microstructures and normalizing capillary pressure
data. Our analysis also showed that when fluid and rock-fluid interaction properties remain
constant, rocks with similar √k
ϕFsτ or FZI∗√Fsτ will present similar Pc behavior and constitute
one PSRT. This is a strong indication that the J-function should be modified to include the term
√Fsτ . Saboorian-Jooybari et al. (2010) and then Ferreira et al. (2015) presented a modified J-
function which incorporates a hydraulic tortuosity term, τ. Considering what is argued, the
modified J-function that is superior to the conventional one and suitable for variety of
microstructures can be written as:
0.000001
0.00001
0.0001
0.001
0.01
0.1
1
0 10 20 30 40 50 60 70 80 90 100
kro
Water saturation (%)
0.01
0.1
1
0 10 20 30 40 50 60 70 80 90 100krw
Water saturation (%)

34
J =Pc
γcos (θ)√
k
ϕFsτ
Equation 26
Conclusions
In this study, we studied static and dynamic rock types separately and showed that these two do
not necessarily overlap and thus a new index should independently be developed to define each
one. We proposed new rock typing indices that can be used for various petrophysical, drilling,
production, injection, reservoir studies and simulation purposes. This also enabled us to modify
the conventional J-function to enhance its capability in defining capillary pressure data from
various rock types. The new models were validated with an extensive laboratory analysis
including MICP, capillary pressure, and relative permeability data on core plugs from a
carbonate reservoir. Based on data analysis and mathematical manipulations the following
conclusions can be made:
A PDRT can be defined as rock units with a similar fluid flow behavior. From the
physical stand point, it can be referred to rocks under similar v
dp/dx conditions.
An index for characterization of PDRTs, known as FZI*, can be developed by using
either the fundamental form of the Kozeny-Carman equation or Darcy’s law for single
and multi-phase flow systems.
A PSRT can be defined as those rocks types that have identical primary drainage
capillary pressure data. This idea can be extended to presenting unique water saturation
for a given height above the FWL.
An index to study PSRTs, known as PSRTI, was developed by combining the Young-
Laplace capillary pressure equation with the Kozeny-Carman expression.
It can be concluded that by keeping all other petrophysical factors constant and only
considering pore-network structure, PSRTs do not necessarily overlap with PDRTs.
Depending on the complexity of pore-network geometry there may be a large discrepancy
between these two definitions.
From this study and based on an extensive comparison of existing models, it can be
deduced that almost all empirical indices for rock typing have a similar mathematical

35
format. They are defined in such a way to be considered as the special solution of a
general universal equation of our proposed model.
Using the FZI* and without any prior knowledge of petrographic, depositional or
diagenetic information the PDRTs and PSRTs, we were able to successfully characterize
one of the most heterogeneous carbonate reservoirs in the southwest of Iran.
The J-function was modified based on the new indices by adding microstructural
parameters to better represent capillary pressure in highly heterogeneous rock types.
Acknowledgement
Abouzar Mirzaei-Paiaman thanks National Iranian South Oil Company (NISOC) and National Iranian Oil Company
(NIOC) for permission to publish this work.
References
Abbaszadeh, M., Fujii, H., Fujimoto, F., 1996. Permeability Prediction by Hydraulic Flow Units -Theory and
Applications. SPE Formation Evaluation 11, 263–271.
Aguilera, R. 2002. Incorporating capillary pressure, pore throat aperture radii, height above free-water table,
and Winland r35 values on Pickett plots. AAPG Bulletin, v. 86, no. 4 (April 2002), pp. 605–624
Aguilera, R., 2004, Integration of geology, petrophysics, and reservoir engineering for characterization of
carbonate reservoirs through Pickett plots, AAPG Bulletin, v. 88, no. 4, p. 433-446.
Amaefule, J.O., Altunbay, M., Tiab, D., Kersey, D.G., Keelan, D.K., 1993. Enhanced reservoir description
using core and log data to identify hydraulic flow units and predict permeability in uncored intervals/wells. In:
SPE Annual Technical Conference and Exhibition, 3-6 October, Houston, Texas.
Archie, G. E., 1952, Classification of carbonate reservoir rocks and petrophysical considerations, AAPG
Bulletin, v. 36, p. 278-298.
Askari, A.A., Behrouz, T., 2011. A Fully Integrated Method for Dynamic Rock Type Characterization
Development in One of Iranian Off-Shore Oil Reservoir. Journal of Chemical and Petroleum Engineering,
University of Tehran, Vol. 45, No.2, PP. 83-96
Brown, H.W. 1951. Capillary pressure investigations. Petroleum Transactions, AIME, vol. 192, 67-74.
Cai, J., Perfect, E., Cheng, CL., Hu. X. 2014. Generalized modeling of spontaneous imbibition based on Hagen–
Poiseuille flow in tortuous capillaries with variably shaped apertures. Langmuir, 30 (18), 5142-5151
Carman, P.C., 1937. Fluid flow through granular beds. Trans. Inst. Chem. Eng. 15, 150-166.
Chen, X., and Yao, G. 2017. An improved model for permeability estimation in low permeable porous media
based on fractal geometry and modified Hagen-Poiseuille flow. Fuel 210, 748–757.
Chen, X., and Zhou, Y. 2017. Applications of digital core analysis and hydraulic flow units in petrophysical
characterization. Advances in Geo-energy Research. Vol. 1, No. 1, p. 18-30, doi: 10.26804/ager.2017.01.02.
Chopra, A.K. 1988. Reservoir Descriptions Via Pulse Testing: A Technology Evaluation. SPE-17568-MS,
International Meeting on Petroleum Engineering, 1-4 November, Tianjin, China. DOI
Chopra, A.K., Stein, M.H., Ader, J.C. 1989. Development of reservoir descriptions to aid in design of EOR
projects. SPE-16370-PA, SPE Reservoir Engineering 4(2), 143-150.
Corbett, P.W.M., and Potter, D.K. 2004. Petrotyping: a basemap and atlas for navigating through permeability
and porosity data for reservoir comparison and permeability prediction. International Symposium of the Society
of Core Analysts held in Abu Dhabi, UAE, 5-9 October, 2004. SCA2004-30
Davies, D.K., Vessell, R.K. 1996. Identification and Distribution of Hydraulic Flow Units in a Heterogeneous
Carbonate Reservoir: North Robertson Unit, West Texas. SPE-35183-MS. DOI https://doi.org/10.2118/35183-
MS
Donaldson, E.C., Ewall, N., and Singh, B. 1991. Characteristics of capillary pressure curves. Journal of Petroleum Science and Engineering/ Volume 6, Issue 3, November 1991, Pages 249-261.

36
Dunham, R. J., 1962, Classification of carbonate rocks according to depositional texture, in W. E. Ham, ed.,
Classification of carbonate rocks, American Association of Petroleum Geologists Memoir 1, p. 108-121
Ferreira, F.C., Booth, R., Oliveira, R., Carneiro, G., Bize-Forest, N., and Wahanik, H. 2005. New Rock-
Typing Index Based on Hydraulic and Electric Tortuosity Data for Multi-Scale Dynamic Characterization of
Complex Carbonate Reservoirs. SPE-175014-MS, SPE Annual Technical Conference and Exhibition, 28-30
September, Houston, Texas, USA. DOI https://doi.org/10.2118/175014-MS
Gholami, V.,Mohaghegh, S., 2009. Intelligent Upscaling of Static and Dynamic Reservoir Properties. SPE-
124477-MS, SPE Annual Technical Conference and Exhibition, 4-7 October, New Orleans, Louisiana.
Izadi, M., Ghalambor, A., 2013. New approach in permeability and hydraulic-flow unit determination. SPE
Reserv. Eval. Eng. 16 (3), 257-264.
Jaya, I., Sudaryanto, A., Widarsono, B. 2005. Permeability Prediction Using Pore Throat and Rock Fabric: A
Model from Indonesian Reservoirs. SPE-93363-MS, SPE Asia Pacific Oil and Gas Conference and Exhibition,
5-7 April, Jakarta, Indonesia. DOI https://doi.org/10.2118/93363-MS
Jongkittinarukorn, K., and Tiab, D. 1997. Identification of flow units in shaly sand reservoirs. Journal of
Petroleum Science and Engineering 17, 237-246.
Katz, A.J., and Thompson, A.H. 1986. Quantitative prediction of permeability and electrical conductivity in
porous rock. SEG Technical Program Expanded Abstracts 1986: pp. 6-7. DOI
Kolodzie, S. 1980. Analysis of pore throat size and use of the Waxman-Smits equation to determine OOIP in
Spindle field, Colorado. SPE-9382-MS, SPE Annual Technical Conference and Exhibition, 21-24 September,
Dallas, Texas. DOI https://doi.org/10.2118/9382-MS
Kozeny, J., 1927. ber kapillare Leitung des Wassers im Boden, Sitzungsberichte.Royal Academy of Science
Vienna, Proc. Class I, 136, 271–306.
Kwon, B. S., and G. R. Pickett, 1975, A new pore structure model and pore structure interrelationships: Society
of Professional Well Log Analysts 16th Annual Logging Symposium, 4-7 June 1975, pages 1-14.
Lin, B., Chen, M., and Pang, H. 2015. Modeling pore size distribution of southern Sichuan shale gas reservoirs.
Journal of Natural Gas Science and Engineering Volume 26, Pages 883-894.
Mirzaei-Paiaman A, Saboorian-Jooybari H. 2016. A method based on spontaneous imbibition for
characterization of pore structure: application in pre-SCAL sample selection and rock typing. J Nat Gas Sci Eng 35:814–25. http://dx.doi.org/10.1016/j.jngse.2016.09.023.
Mirzaei-Paiaman, A., Saboorian-Jooybari, H., Pourafshari, P., 2015. Improved method to identify hydraulic
flow units for reservoir characterization. Energy Technol. 3 (7), 726-733.
Mirzaei-Paiaman, A., Masihi, M., Standnes, D.C. (2013) Index for characterizing wettability of reservoir rocks
based on spontaneous imbibition recovery data. Energy Fuels 27: 7360 –7368, DOI:
dx.doi.org/10.1021/ef401953b
Ngo, V.T., Lu, V.D., Nguyen, M.H., Hoang, T.M., Nguyen, H.M., and Le, V.M. 2015. A Comparison of
Permeability Prediction Methods Using Core Analysis Data. SPE-175650-MS, SPE Reservoir Characterisation
and Simulation Conference and Exhibition, 14-16 September, Abu Dhabi, UAE.
Nooruddin, H., Hossain, M., 2011. Modified Kozeny-Carmen correlation for enhanced hydraulic flow unit
characterization. J. Petroleum Sci. Eng. 80, 107-115.
Oliveira, G.P., Roque, W.L., Araújo, E.A., Diniz, A.A.R., Simões, T.A., Santos, M.D. 2016. Competitive
placement of oil perforation zones in hydraulic flow units from centrality measures. Journal of Petroleum
Science and Engineering, 147, 282-291. DOI https://doi.org/10.1016/j.petrol.2016.06.008
Pittman, E. D., 1992, Relationship of porosity and permeability to various parameters derived from mercury
injection-capillary pressure curves for sandstone: AAPG Bulletin, 76, 191-198.
Purcell, W. R., 1949, Capillary pressures-their measurement using mercury and the calculation of permeability
therefrom, American Institute of Mechanical Engineers, Petroleum Transaction, AIME, T.P. 2544, pages 39-48.
Rabiller, P., 2017. Combining porosimetry and Purcell permeability modeling to calibrate FZI and define a
dynamic permeability cut-off. International Symposium of the Society of Core Analysis, Vienna, Austria, 27-30
August 2017.
Rashid, F., Glover, P.W.J., Lorinczi, P., Hussein, D., Collier, R., Lawrence, J. 2015. Permeability prediction in tight carbonate rocks using capillary pressure measurements. Marine and Petroleum Geology 68, 536-550.
Rebelle, M. 2014. Rock-typing In Carbonates: A Critical Review Of Clustering Methods. SPE-171759-MS,
Abu Dhabi International Petroleum Exhibition and Conference, 10-13 November, Abu Dhabi, UAE.

37
Roque, W.L., Oliveira, G.P., Santos, M.D., and Simões, T.A. 2017. Production zone placements based on
maximum closeness centrality as strategy for oil recovery. Journal of Petroleum Science and Engineering, 156,
430-441. DOI: 10.1016/j.petrol.2017.06.016
Saboorian-Jooybari, H., 2017. A structured mobility-based methodology for quantification of net-pay cutoff in
petroleum reservoirs. SPE-183643-PA. SPE Reservoir Evaluation & Engineering, 20 (02), 1-17.
Saboorian-Jooybari, H., Mowazi, G.H., Jaberi, S.R., 2010. A New Approach for Rock Typing Used in One of the Iranian Carbonate Reservoir (A Case Study). In: Paper SPE 131915 Presented at the International Oil and
Gas Conference and Exhibition, Beijing, China, 8-10 June.
Serag El Din, S., Dernaika, M.R., and Kalam, Z. 2014. Integration of Petrophysical SCAL Measurements for
Better Understanding Heterogeneity Effects in Carbonates: Case Study Using Samples from a Super Giant Field
in Abu Dhabi. IPTC-17572-MS, International Petroleum Technology Conference, 19-22 January, Doha, Qatar.
Shen, L. and Chen, Z. 2007. Critical review of the impact of tortuosity on diffusion, Chemical Engineering
Science 62, 3748-3755.
Siddiqui, S., Okasha, T.M., Funk, J.J., and Al-Harbi, A.M. 2006. Improvements in the selection criteria for the
representative special core analysis samples. SPE-84302-PA, SPE Reservoir Evaluation & Engineering, 9 (6),
647-653. DOI https://doi.org/10.2118/84302-PA
Sokhal, A., Benmalek, S., and Ouadfeul, S. 2016. Rock Type and Permeability Prediction using Flow Zone Indicator with an application to Berkine Basin (Algerian Sahara). , SEG International Exposition and 86th
Annual Meeting, 16-21 October, Dallas, Texas. Pages 3068-3072
Soto, R.B., Garcia, J.C. Torres, F., and Perez, G.S. 2001. Permeability Prediction Using Hydraulic Flow Units
And Hybrid Soft Computing Systems. SPE-71455-MS, SPE Annual Technical Conference and Exhibition, 30
September-3 October, New Orleans, Louisiana. DOI https://doi.org/10.2118/71455-MS
Tabatabaei, S.M.E., Kadkhodaie-Ilkhchi, A., bHosseini, Z., bAsghari Moghaddam, A., 2015. A hybrid
stochastic-gradient optimization to estimating total organic carbon from petrophysical data: A case study from
the Ahwaz oilfield, SW Iran. Journal of Petroleum Science and Engineering, Volume 127, Pages 35-43.
Taslimi, M., Bohloli, B., Kazemzadeh, E., and Kamali, M.R. 2008. Determining Rock Mass Permeability in a
Carbonate Reservoir, Southern Iran Using Hydraulic Flow Units and Intelligent Systems. 2nd IASME / WSEAS
International Conference on GEOLOGY and SEISMOLOGY (GES '08), Cambridge, UK, February 23-25. Pages 132-139
Thomeer, J. H., 1960, Introduction of a pore geometrical factor defined by the capillary pressure curve, JPT,
March, p. 73-77.
Thomeer, J.H.M. 1960. Introduction of a Pore Geometrical Factor Defined by the Capillary Pressure Curve. J
Pet Technol 12 (3): 73-77. SPE-1324-G. http://dx.doi.org/10.2118/1324-G
Wang, F., Lian, P., Jiao, L., Liu, Z., Zhao, J., and Gao, J. 2018. Fractal analysis of microscale and nanoscale
pore structures in carbonates using high-pressure mercury intrusion. Geofluids, available at
https://www.hindawi.com/journals/geofluids/aip/4023150/
Xu, C., and Torres-Verdín, C. 2012, Saturation-height and invasion consistent hydraulic rock typing using
multi-well conventional logs. SPWLA 53rd Annual Logging Symposium, June 16-20, 2012 Cartagena,
Colombia
Xu, C., Torres-Verdín, C. 2013. Pore System Characterization and Petrophysical Rock Classification Using a
Bimodal Gaussian Density Function. Math Geosci DOI 10.1007/s11004-013-9473-2
Yun, M., Yu, B., Xu, P., Cai, J. 2008. Fractal analysis of power-law fluid in a single capillary. Chinese Physics
Letters, 25 (2), 616-619.
Zhang, P., Lu, S., Li, J., Zhang, J., Xue, H., Chen, C. Permeability evaluation on oil-window shale based on
hydraulic flow unit: A new approach. Advances in Geo-Energy Research, 2018, 2(1): 1-13, doi:
10.26804/ager.2018.01.01.