a new approach to intraoperative blood transfusion …
TRANSCRIPT

A NEW APPROACH TO INTRAOPERATIVE BLOOD TRANSFUSION PREPARATION:
Using data as our guide Anne Que, CRNA, MS MGH- Department of Anesthesia, Critical Care and Pain Medicine
Division of General Surgery- CRNA Team Leader

OUTLINE
I. Background A. Decrease unnecessary Transfusion B. Optimize the preparation
II. Data- MGH and National III. Strategy IV. Case report V. Impact VI. Further Studies

• Joint Commission • Choosing Wisely • #1 ranked journal in the world

Blood transfusion targeted at the Overuse Summit.
• Blood transfusion is the most commonly
performed procedure in US hospitals
Five most overused procedures:
1. Blood transfusions 2. Heart vessel stents 3. Ear tubes 4. Antibiotics for the common cold 5. Early induction of labor without indication
Joint Commission Overuse Summit (October, 2012)
S. Frank, MD (Johns Hopkins)

Randomized Trials: – all supporting Hb triggers of 7 or 8 g/dL
•Carson JL, et al: NEJM 2011 – Elderly orthopedic surgery patients •Hebert PC, et al: NEJM 1999 – Critically ill MICU patients •Hajjar LA, et al: JAMA 2010 – Cardiac surgery patients
•Lacroix J, et al: NEJM 2007 – Critically ill PICU patients •Villanueva C, et al: NEJM 2013 – Severe GI Bleeding
•Holst LB, et al: NEJM 2014 – Septic Shock •Robertson CS. et al: JAMA 2014 – Traumatic Brain Injury •Murphy GJ, et al: NEJM 2015 – Cardiac surgery patients
Eight Landmark Randomized Clinical Trials Supporting Hb Triggers of 7-8 g/dL
(Less is More)
Courtesy of Steve Frank, MD

Clinical Event Risk / Unit
Johns Hopkins
cases/year
United States
cases/year
Allergic/Urticaria 1 in 100 600 150,000RBC Alloimmunization 1 in 100 600 150,000TACO 1 in 100 600 150,000
TRALI 1 in 5,000 12 3,000Hemolytic Rxn 1 in 6,000 10 2,500Wrong Unit Given 1 in 15,000 4 1,000
Hepatitis B 1 in 200,000 0.3 75Hepatitis C 1 in 2,000,000 0.03 7.5HIV 1 and HIV 2 1 in 2,000,000 0.03 7.5
Three Categories of Risks / Adverse Effects from Blood Transfusion
Common Not so Rare Rare
} } }

Red Blood Cells Stored ≥35 Days are Associated with
Adverse Outcomes in High-risk Patients (Goel R, et al, Transfusion 2016)
≥28 days
≥35 days
Courtesy of Steve Frank, MD

Frank SM, et al. Variability in blood and blood component utilization as assessed by an anesthesia information management system. Anesthesiology 2012;117:99-106

0
1
2
3
4
5
6
7
8
Death Infection Thrombotic Renal Respiratory MI
% o
f P
ati
ents
Bloodless Patients
P=0.046
P=0.08
P=0.39
P=0.86 P=0.21 P=0.93
294 Jehovah’s Witness Patients vs. Propensity Matched Controls
Risk-adjusted Clinical Outcomes in Patients Enrolled
in a Bloodless Program Frank SM, et al Transfusion, 2014

P=0.09
3,000
5,000
7,000
9,000
11,000
13,000
15,000
17,000
Total Charges Total Costs Direct Costs
Bloodless Patients
Control Patients
$
P=0.02
P=0.02
Risk-adjusted Clinical Outcomes in Patients Enrolled
in a Bloodless Program Frank SM, et al Transfusion, 2014

Johnson DJ et al. Anesthesiology, 2015
The 50/50 rule
Dose of Blood and Mortality after Massive Transfusion
50% mortality after 50 RBC units

Society of Critical Care Medicine
American Society of Anesthesiologists American Society of Hospital Medicine American Society of Hematology American Association of Blood Banks
5 Societies have aims to Reduce unnecessary transfusion
S. Frank, MD (Johns Hopkins)

PROCESSES AROUND BLOOD PREPARATION
1. Explaining transfusion risk and obtaining informed consent 2. Pre-transfusion examination & clerical routine 3. Phlebotomizing & delivering patient’s blood specimen to blood bank &
central lab 4. Patient blood testing in central lab & analyzing results - routine &
emergency 5. Controlling & storing components in hospital blood bank 6. ABO/Rh-typing new patients 7. ABO/Rh-typing control 8. Antibody screening 9. Cross matching manual distribution of components and controlling delivery
received at transfusion site 10. Return deliveries of unused components 11. Cleaning transfusion site & disposing waste 12. Administering and monitoring transfusion

DIAGNOSTIC DATA
14
Survey: Department Of Anesthesia, RNs, Surgery N=41

PROCESS MAP
Draw BBS
Active BBS T&C NEED
T&S ?
YES
NO
In PATA Intra-Op In Surgeon’s Office
Send To PATA
YES YES Send to OR
Blood Check
NO
No plans to transfuse in
OR
Transfuse?
YES
NO
Transfuse
No blood draw
NO
Phone Screen Evaluation

Baseline Variability
0%
20%
40%
60%
80%
100%
2014-1 2014-2 2014-3 2014-4 2014-5 2014-6 2014-7 2014-8 2014-9 2014-102014-112014-12 2015-1 2015-2
Percen
tageofT&
SObtaine
d
Months
PercentageofTypeandScreenSamplesObtainedforLaparoscopicHysterectomyProceduresN=533(p-chart,3sigma)
BaselineMean %T&S LowerControlLimit UpperControlLimit
• Lack of guidelines • Evolution of surgical techniques
• Laparoscopy • Robotic • Hemostatic techniques (surgical or agents)
• Over-ordering becomes commonplace

PRELIMINARY DATA
¢ Laparoscopic Hysterectomy ¢ Open Hysterectomy ¢ Laparoscopic Appendectomy ¢ Laparoscopic Cholecystectomy ¢ Hernia Repair ¢ Cystoscopy ¢ Liver resection

DATA: HYSTERECTOMY CASES
0"
100"
200"
300"
400"
500"
600"
700"
Total" T&S" T&C" Transfused"
616"529"
133"
6"
#"Cases"
Laparoscopic"Hysterectomy"Cases"over"14"months"
0"
100"
200"
300"
400"
500"
600"
Total" T&S" T&C" Issued" Transfused"
562" 539"
208"157"
68"
#"Cases"
Vaginal"and"Total"Abdominal"Hysterectomy"Cases"182013"to"682015"
T&S ordered
T&C ordered
Issued Transfused
96% 37% 28% 12%
T&S ordered
T&C ordered
Transfused
86% 21% 1%

DATA: HIGH VOLUME PROCEDURES
LaparoscopicCholecystectomy
LaparoscopicAppendectomy InguinalHernia
LaserLithotripsyandCystoscopy
Total 1487 876 1531 665
TypeandScreen 625 530 132 94
TypeandCross 45 12 10 15
Transfusion 6 0 0 1
0
250
500
750
1000
1250
1500 L
apar
osco
pic
Ch
olec
yste
ctom
y
Lap
aros
copi
c A
ppen
dect
omy
Ingu
inal
Her
nia
Las
er L
ith
otri
psy
and
Cys
tosc
opy
# o
f P
ati
ents
Booked Procedure
High Volume Procedures at MGH Jan 2013 to June 2015
Total
Type and Screen
Type and Cross
Transfusion

55%#42%#
3%# 0%#
Laparoscopic)Cholecystectomy)No#BBS# Type#and#Screen# Type#and#Cross# Transfused#
91%$
8%$
1%$
Inguinal(Hernia(No$BBS$ Type$and$Screen$ Type$and$Cross$ Transfused$
84%$
14%$
2%$ 0.15%$
Laser&Lithotripsy&and&Cystoscopy&No$BBS$ Type$and$Screen$ Type$and$Cross$ Transfused$
DATA: HIGH VOLUME PROCEDURES
38%$
61%$
1%$
Laparoscopic)Appendectomy)No$BBS$ Type$and$Screen$ Type$and$Cross$ Transfused$

DATA: LIVER RESECTION COUNTS (2013-15)
0"
20"
40"
60"
80"
100"
120"
140"
160"
180"
200"
Total" T&S" T&C" Issued" Transfused" Returned"
192" 187"174"
163"
31"
158"
#"Ca
ses"
Liver"Resec-on"Cases"112013"to"612015"
T&S ordered
T&C ordered
Issued Transfused
97% 91% 84% 16%

RBC USAGE: TRANSFUSED VS. RETURNED
36%
64%
Open Hysterectomy
Units Transfused
Units Returned
Units Issued
Units Transfused
Units Returned
Returned
Hyst 457 166 291 64%
Liver 576 112 459 80%
20%
80%
Liver Resection

NEXT STEPS: v Examine transfusion rates for high volume, low risk
procedure at MGH v Teach the use of the SSBOS within EPIC to various
work flows: Surgery, Peri-operative nursing, Anesthesia and Blood Bank
v Audit the use of SSBOS for optimization v Capture data for the development of large-scale
transfusion measures v Explore possibility of an algorithmic approach to
determine transfusion risk
CONCLUSIONS: v Routine preoperative type and screen and cross-matching
for certain procedures may be a misuse of resources v Decreasing the routine ordering of T&S through PATA
provided minimal change v Development of this methodology for other procedures is
a slow process v Adoption of a new electronic health record provided an
opportunity to implement a preparation for transfusion guideline
Anne M. Que, CRNA, MS CRNA Team Leader- Division of General Surgery Department of Anesthesia, Critical Care and Pain Medicine
Decreasing Variability in Blood Transfusion Preparation for Laparoscopic Hysterectomy Procedures
CL 0.780
UCL0.962
LCL0.599
0%
20%
40%
60%
80%
100%
120%
2014
-1
2014
-2
2014
-3
2014
-4
2014
-5
2014
-6
2014
-7
2014
-8
2014
-9
2014
-10
2014
-11
2014
-12
2015
-1
2015
-2
2015
-3
2015
-4
2015
-5
2015
-6
2015
-7
2015
-8
2015
-9
2015
-10
2015
-11
2015
-12
2016
-1
2016
-2
2016
-3
%Type
andS
creen
MonthofSurgery
PercentofTypeandScreenSamplesDrawnPre-operativelyforLaparoscopicHysterectomyp-Chart3-sigma
BaselineandInterventionData1/1/15-3/31/16
%TypeandScreen BaselineMean UpperControlLimit LowerControlLimit
Results:
• PATA decreased Pre-op orders of T&S
• Anesthesia providers decreased drawing of pre-op T&S
• GYN surgeons agreeable to holding off routine drawing
Intervention
CPIP Graduation
MASSACHUSETTS GENERAL HOSPITAL

Anesthesiology, June, 2013
Algorithm to create guidelines- SSBOS
*Ho
pk
ins S
tud
y
*Hopkins Study

First updated blood order schedule in 30 years, and first ever based on actual blood utilization data

EPIC

STANDARD SURGICAL BLOOD ORDER SCHEDULE (SSBOS)
¢ Institute-specific updated schedule done at Johns Hopkins to guide pre-operative blood ordering
¢ Primary blood ordering categories: � “no T/S or T/C” � “T/S” � “T/C”
¢ Important caveats: � Data from one institution � Intra-operative transfusion data included but does
not take into account postoperative transfusion
Frank SM, Oleyar MJ, Ness PM, Tobian AAR. Reducing Unnecessary Preoperative Blood Orders and Costs by Implementing an Updated Institution-specific Maximum Surgical Blood Order Schedule and a Remote Electronic Blood Release System. Anesthesiology. 2014;121(3):501-509.

THE “WHAT IF” SCENARIO…
<5% transfused

THE “WHAT IF” SCENARIO…
<5% transfused
Uncrossmatched blood
CASE (EMILY NAOUM, MD, RESIDENT CASE CONFERENCE)
¢ 20 year old woman presents for an I&D of a LLE wound with vac placement

CASE CONTINUED
¢ PMH: pedestrian struck 3 months ago, otherwise healthy � Multiple fractures
¢ PSH: tibia/fibula fracture fixation, skin graft, muscle flap
¢ Medications: Oxycodone PRN ¢ NKDA

CASE CONTINUED ¢ Physical Exam:
� Height 5’1’’ Weight 50 kg � Reassuring airway exam � Unremarkable CV, respiratory, abdominal, and neurological
exam
¢ Laboratory Studies

CASE CONTINUED
¢ Outside Imaging per Orthopedic Surgery Note: � Recent CT scan shows the back of the tibial
fracture with large anterior defect; repair and the wound clearly go down into the tibial shaft

WHO SHOULD GET A BLOOD BANK SAMPLE?
¢ Partners Surgical Blood Ordering Schedule

HOW MIGHT I FIND RECOMMENDATIONS FOR MY PATIENT IN THE ALL-KNOWING EPIC?

INTRAOPERATIVE COURSE
¢ GA, LMA ¢ EBL 30 mL ¢ IVF 1000 mL LR

SURGICAL HAND-OFF TO PACU NURSE
¢ I&D of left leg wound ¢ Placement of wound vac

PACU COURSE

PACU COURSE

PACU COURSE CONTINUED
¢ IV Access: 20g R AC, 18 g L wrist ¢ Surgical team notified ¢ Blood bank notified – sample sent from PACU

RETURN TO OR
¢ EBL 600 mL ¢ IVF: 2250 mL LR ¢ 3 units pRBCs ~ 800 mL ¢ UOP 300 mL
¢ Surgical Procedure: vac removal, wound exploration, packing with surgicel, ligation of vessels x 3, “diffuse non-surgical bleeding”
¢ Transferred to ICU intubated and sedated post-operatively

WHAT ARE THE ACTUAL RISKS OF GIVING UNCROSSMATCHED BLOOD?
¢ Risk of having antibody: 2-11% ¢ Risk of antibody being clinically significant: 0.6
to 6.4% ¢ Risk of having clinical reaction
� Delayed hemolytic transfusion reactions: 0.4% � Alloimmunization: 1.8 to 8.6%
¢ When emergency transfusion is needed to a patient who does not have a “current” pre-transfusion type: � O negative red cell units if the recipient is a female under
the age of 50 years, or a male under the age of 18 years; � O positive red cell units for all other patients; and � Conversion to the patient’s ABO and Rh type and
type as soon as that can be determined. Gehrie, EA., Torney CA. The Influence of Clinical and Biological Factors on Transfusion-Associated Non-ABO Antigen Alloimmunization: Responders,
Hyper-Responders, and Non-Responders. Transfusion Medicine and Hemotherapy 41.6 (2014): 420–429.

FUTURE DIRECTION
¢ Balance cost and safety ¢ Use of data
� Retrospective � Institution-specific � Goal-directed � Use-specific
¢ Use of technology

• Automatic • SSBOS • Surgery/Anesthesia/BB
Booking of Surgery
• Intra-op • Risk of transfusion
Clinical Decision Tool
• Validation • Learning • Quality Metrics
Prediction Analytics
NEXT STEPS:
v Stratify historical transfusion data per procedure
v Identify procedures where T&S in unnecessary
v Gather characteristics from procedures with likelihood of transfusion to identify correlations
v Build transfusion database and model
v In parallel, integrate SSBOS into EPIC
v Validate model v Ensure reporting tools in EPIC
captures data
IDEAL PROCESS DESIGN

Monthly number of RBC units w/ preceding Hgb > 8
54%
Change in RBC Utilization for 10 Surgical Services
IMPACT “Efficacy of Education Followed by Computerized Provider Order Entry with Clinician Decision Support to Reduce Red Blood Cell Utilization”
Zuckerberg GS, et al. TRANSFUSION, 2015

POST EPIC IMPLEMENTATION

IMPACT PROCESSES AROUND BLOOD PREPARATION
1. Explaining transfusion risk and obtaining informed consent 2. Pre-transfusion examination & clerical routine 3. Phlebotomizing & delivering patient’s blood specimen to blood bank &
central lab 4. Patient blood testing in central lab & analyzing results - routine &
emergency 5. Controlling & storing components in hospital blood bank 6. ABO/Rh-typing new patients 7. ABO/Rh-typing control 8. Antibody screening 9. Cross matching manual distribution of components and controlling delivery
received at transfusion site 10. Return deliveries of unused components 11. Cleaning transfusion site & disposing waste 12. Administering and monitoring transfusion

Potential savings $211,448 / year

MGH Partners-NSH
JSLS (2010)
22.10 16.04 30.00 v Does not include Instrumentation
v Maimonides Hospital
Approximate Costs of T&S
$9,921.79 Lap Hyst Procedures $13,812.50 Lap Cholecystectomies $55,000 (JSLS)- Hernias/Appendectomies/Cholecystectomies
Ghirardo SF, Mohan I, Gomensoro A, Chorost MI. Routine Preoperative Typing and Screening: A Safeguard or a Misuse of Resources. JSLS. 2010;14:395-398.
IMPACT

DURING THE STUDY PERIOD, 293 PATIENTS UNDERWENT LAPAROSCOPIC CHOLECYSTECTOMY, 123 LAPAROSCOPIC INGUINAL HERNIA REPAIR AND 116 DIAGNOSTIC LAPAROSCOPY (EXCLUDING GYNAECOLOGICAL LAPAROSCOPY)
Fig. 1: Pre-operative G&S and peri-operative transfusion status
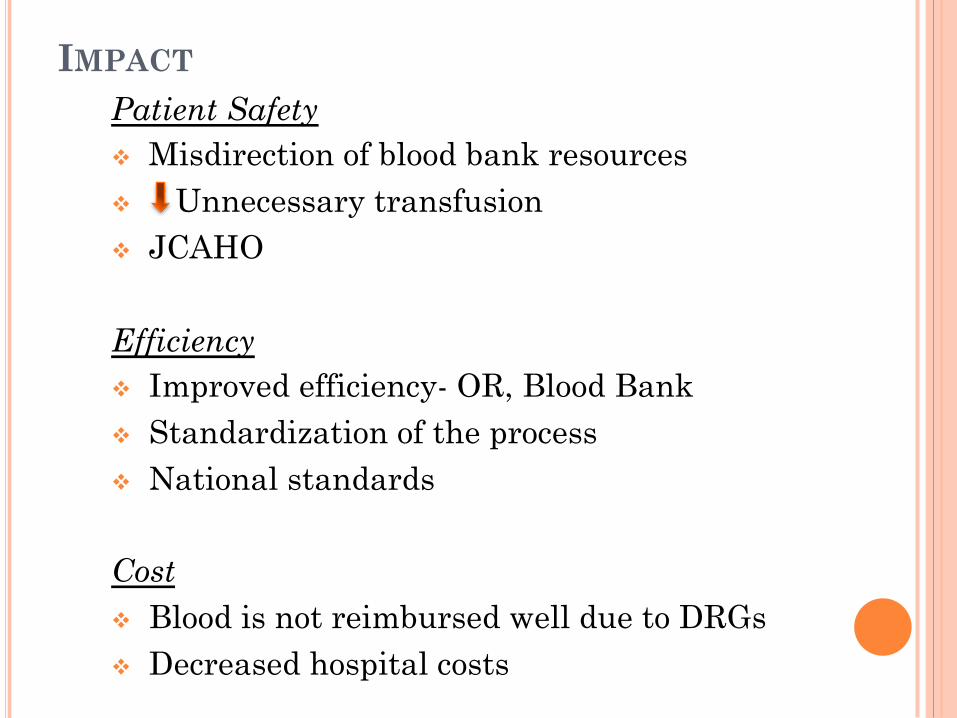
IMPACT Patient Safety v Misdirection of blood bank resources v Unnecessary transfusion v JCAHO Efficiency v Improved efficiency- OR, Blood Bank v Standardization of the process v National standards Cost v Blood is not reimbursed well due to DRGs v Decreased hospital costs

Based on these data, the total cost of RBC transfusion per patient transfused in the surgical setting of this hospital was US$ 3433. The total cost of a unit of RBC was US$ 1,158 (2007 value), of which, indirect overhead, total transfusion process cost, weighted average acquisition cost and direct overhead cost per unit accounted for 40.6%, 34.0%, 21.5% and 3.9%, respectively.
April 2010 of Transfusion study findings confirm that annual expenditures on blood and transfusion-related activities for surgical patients are significant resource drains—costing between $1.6 to $6.0 million per hospital surveyed.
~~~~~
Shander, A., Hofmann, A., Ozawa, S., & Javidroozi, M. (2008). The True Cost of Red Blood Cell Transfusion in Surgical Patients. Blood, 112(11), 3045. Accessed November 15, 2016. Retrieved from http://www.bloodjournal.org/content/112/11/3045.

ACKNOWLEDGEMENTS u Jeanine Wiener-Kronish, MD u Steve Frank, MD u Wilton Levine, MD u Marcela del Carmen, MD u Aalok Agarwala, MD, MBA u Keith Lillemoe, MD u Elizabeth Mort, MD u Daniel Yeh, MD u David Chang, PhD u Mary Bourbonniere, RN, PhD u Sara E. Dolan Looby, PhD u Sunny Dzik, MD u Rob Makar, MD, PhD u Bill Driscoll u Milcho Nikolov u Kent Eliason u Daniel Morash, MBA u Ann Schwartz, CRNA, MS u Gautam Goel, PhD u Victoria Carballo u Emily Naoum, MD

REFERENCES Arbous MS, Meursing AEE, van Kleef JW, et al. Impact of anesthesia management characteristics on severe morbidity and mortality. Anesthesiology. 2005;102(2):257-268. Orkin FK, Longnecker DE. Orkin F.K., Longnecker D.E. Orkin, Fredrick K., and David E. Longnecker.Chapter 25. Anesthesia Risk. In: Longnecker DE, Brown DL, Newman MF, Zapol WM. Longnecker D.E., Brown D.L., Newman M.F., Zapol W.M. Eds. David E. Longnecker, et al.eds. Anesthesiology, 2e. New York, NY: McGraw-Hill; 2012. http://accessanesthesiology.mhmedical.com/content.aspx?bookid=490&Sectionid=40114708. Accessed July 27, 2015. Frank, SM, Rothchild JA, Masear CG, Rivers, RJ, Merritt WT, Savage WJ, Ness, PM: Optimizing Preoperative Blood Ordering with Data Acquired from an Anesthesia Information Management System. Anesthesiology 2013; 118:1286-97. Goodnough, LT, Shieh, L, Hadhazy, E, Cheng, N, Khari, P, Maggio, P: Improved blood utilization using real-time clinical decision support. Transfusion 2014; 54:1358-1365. Simpao AF, Ahumada LM, Rehman MA. Big data and visual analytics in anaesthesia and health care. Br J Anaesth 2015. Gálvez JA, Ahumada L, Simpao AF, et al. Visual analytical tool for evaluation of 10-year perioperative transfusion practice at a children’s hospital. J Am Med Inform Assoc 2014; 21:529–34. Introduction to SAS. UCLA: Statistical Consulting Group. From http://www.ats.ucla.edu/stat/sas/notes2/ (accessed November 24, 2007). Ghirardo SF, Mohan I, Gomensoro A, Chorost MI. Routine Preoperative Typing and Screening: A Safeguard or a Misuse of Resources. JSLS. 2010;14:395-398. Shander, A., Hofmann, A., Ozawa, S., & Javidroozi, M. (2008). The True Cost of Red Blood Cell Transfusion in Surgical Patients. Blood, 112(11), 3045. Accessed November 15, 2016. Retrieved from http://www.bloodjournal.org/content/112/11/3045. Stonemetz, J. L., Allen, P. X., Wasey, J., Rivers, R. J., Ness, P. M., & Frank, S. M. (2014). Development of a risk-adjusted blood utilization metric. Transfusion, 54(10 Pt 2), 2716-2723. Zuckerberg, G. S., Scott, A. V., Wasey, J. O., Wick, E. C., Pawlik, T. M., Ness, P. M., & ... Frank, S. M. (2015). Efficacy of education followed by computerized provider order entry with clinician decision support to reduce red blood cell utilization. Transfusion, (7), 1628.