a new approach to perfrom analysis of milk components into
TRANSCRIPT
AfiLab™“A new approach to perform analysis of
milk components incorporatingstatistical methods adapted in a real time
sensor”Gil Katz, Niv Pinsky
Impact of new technologies on performance recording and genetic evaluation
36th ICAR Session and Inter bull Meeting 16-20 June 2008
2
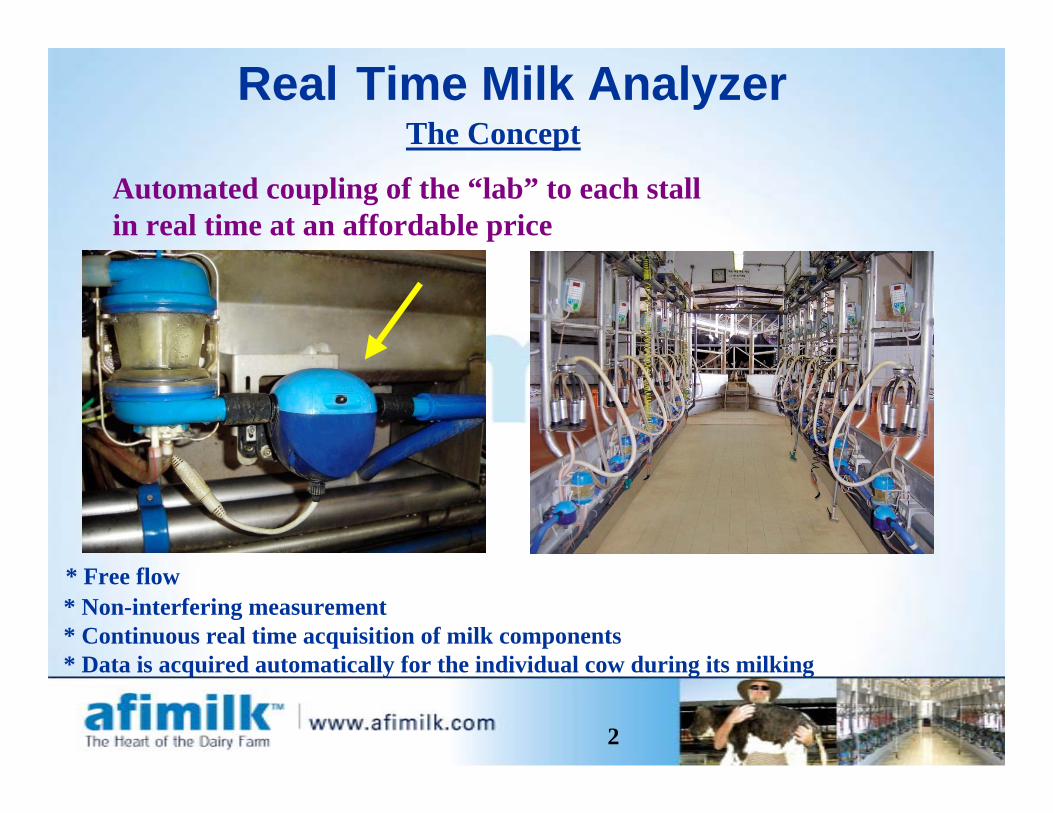
* Free flow * Non-interfering measurement * Continuous real time acquisition of milk components * Data is acquired automatically for the individual cow during its milking
Automated coupling of the “lab” to each stallin real time at an affordable price
Real Time Milk AnalyzerThe Concept
3
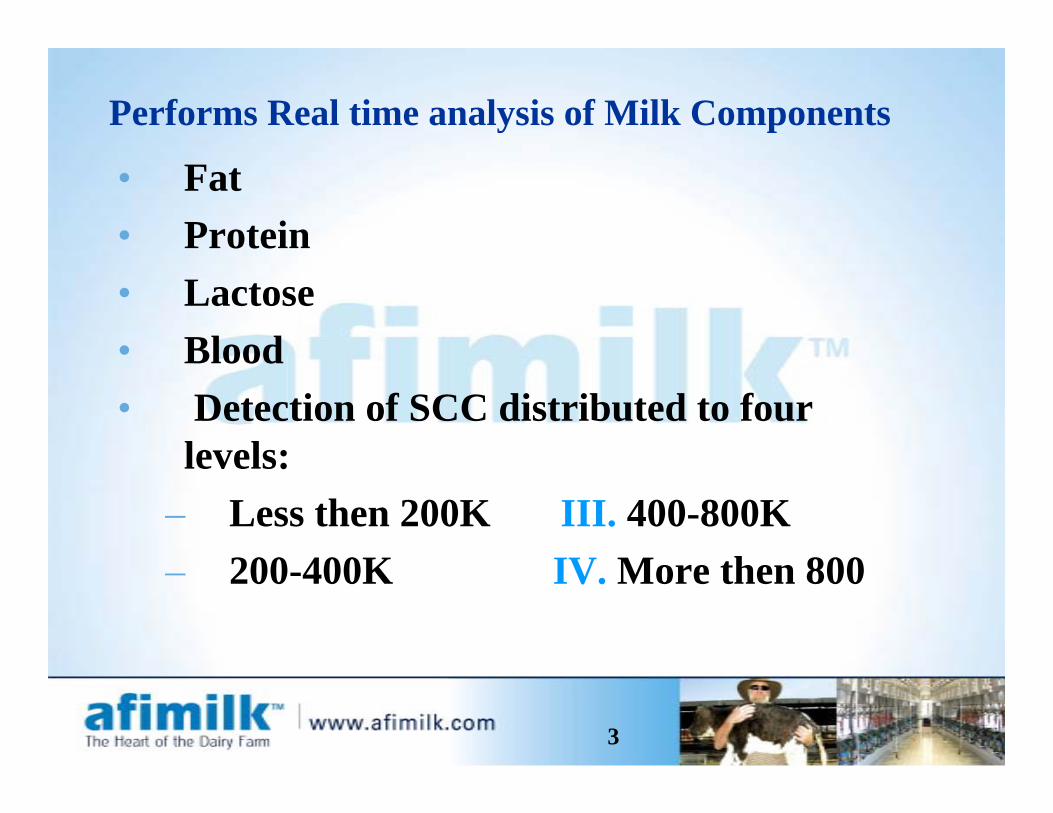
• Fat• Protein• Lactose• Blood• Detection of SCC distributed to four
levels:– Less then 200K III. 400-800K– 200-400K IV. More then 800
Performs Real time analysis of Milk Components
4
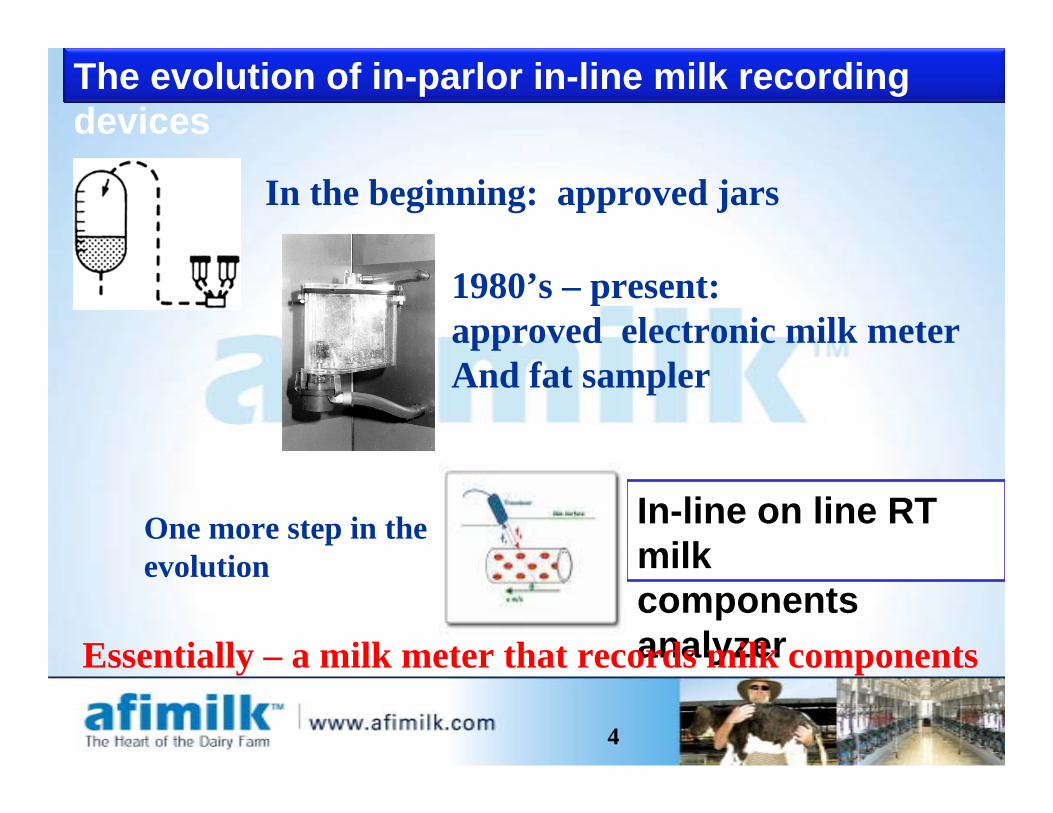
The evolution of in-parlor in-line milk recordingdevices
In the beginning: approved jars
1980’s – present:approved electronic milk meterAnd fat sampler
In-line on line RTmilkcomponentsanalyzerEssentially – a milk meter that records milk components
One more step in the evolution
5
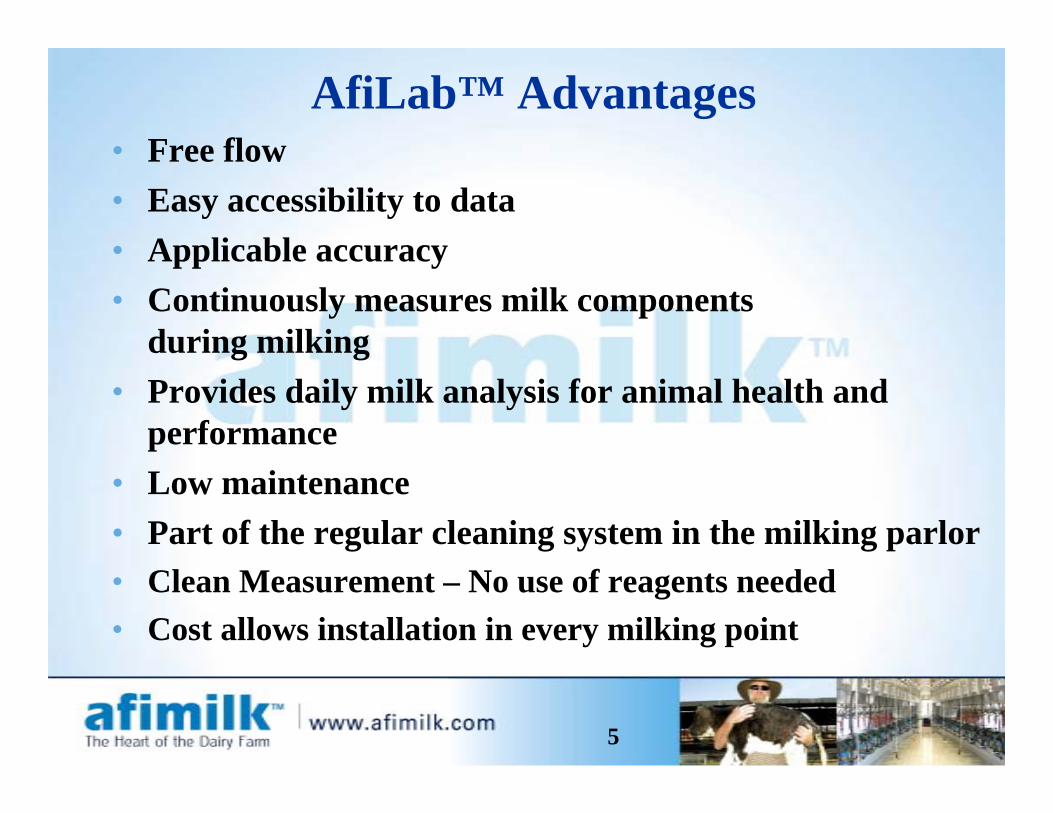
• Free flow• Easy accessibility to data• Applicable accuracy• Continuously measures milk components
during milking• Provides daily milk analysis for animal health and
performance• Low maintenance• Part of the regular cleaning system in the milking parlor• Clean Measurement – No use of reagents needed• Cost allows installation in every milking point
AfiLab™ Advantages
6
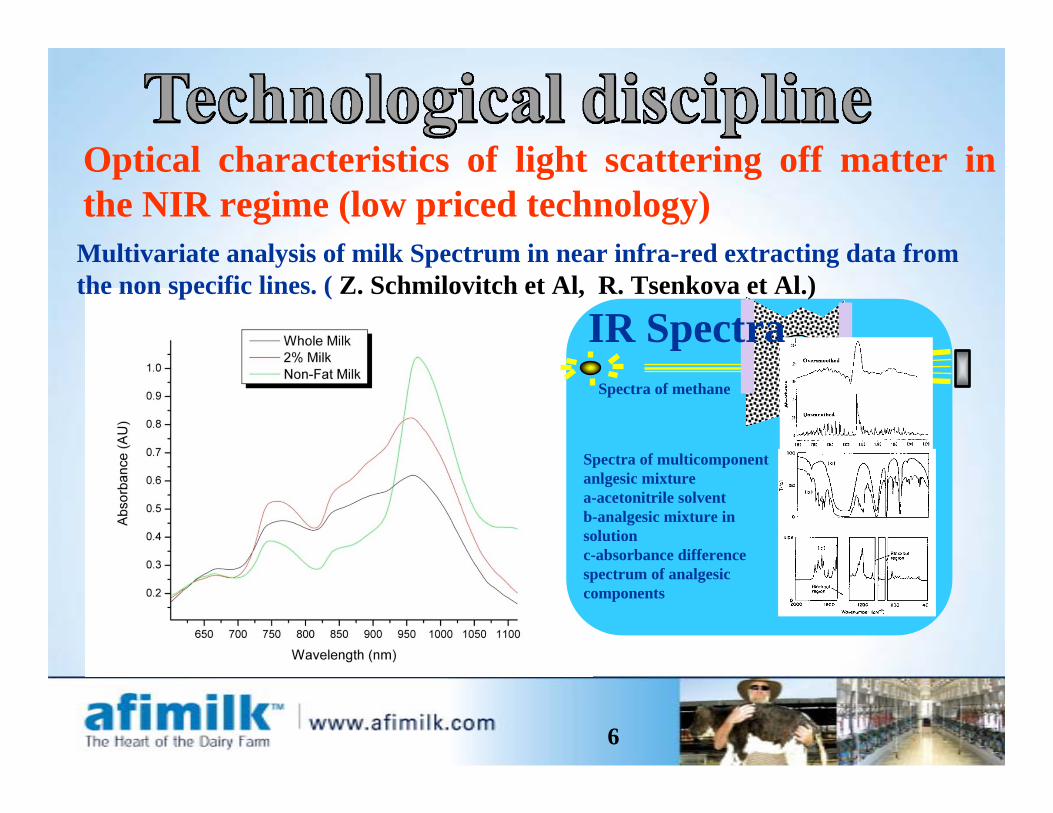
Optical characteristics of light scattering off matter inthe NIR regime (low priced technology)Multivariate analysis of milk Spectrum in near infra-red extracting data fromthe non specific lines. ( Z. Schmilovitch et Al, R. Tsenkova et Al.)
Spectra of multicomponentanlgesic mixturea-acetonitrile solventb-analgesic mixture insolutionc-absorbance differencespectrum of analgesiccomponents
Spectra of methane
IR Spectra
7
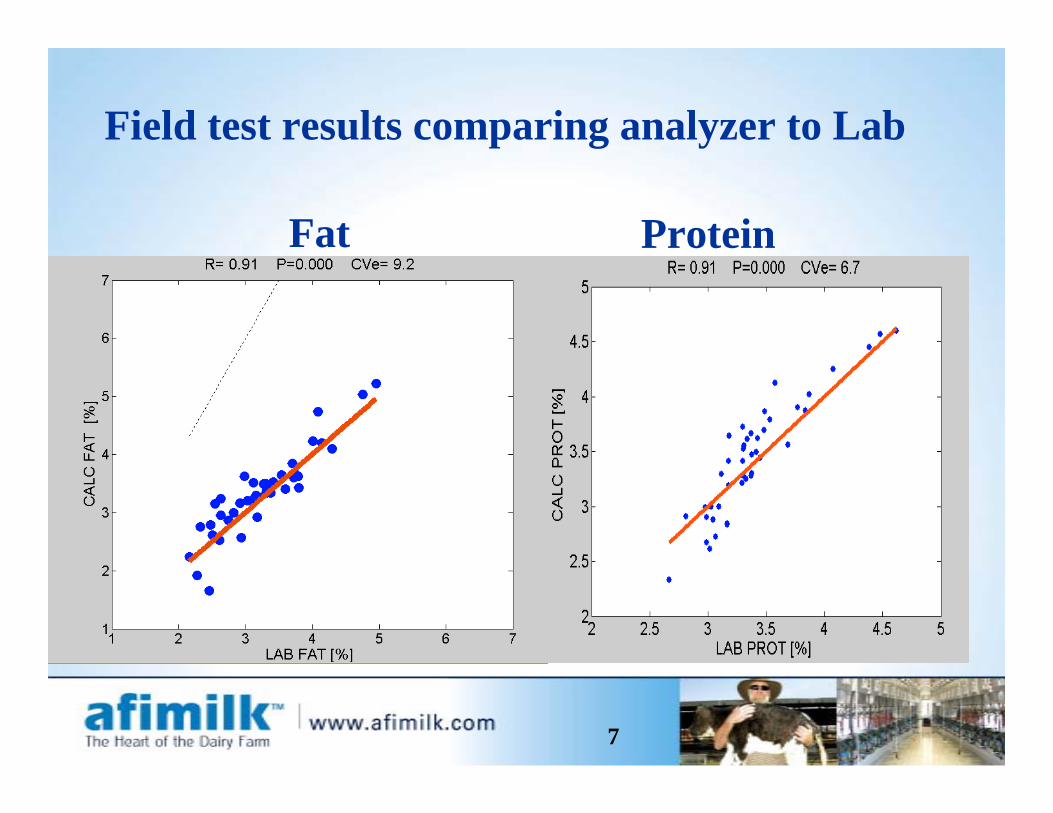
Field test results comparing analyzer to Lab
Protein Fat
8
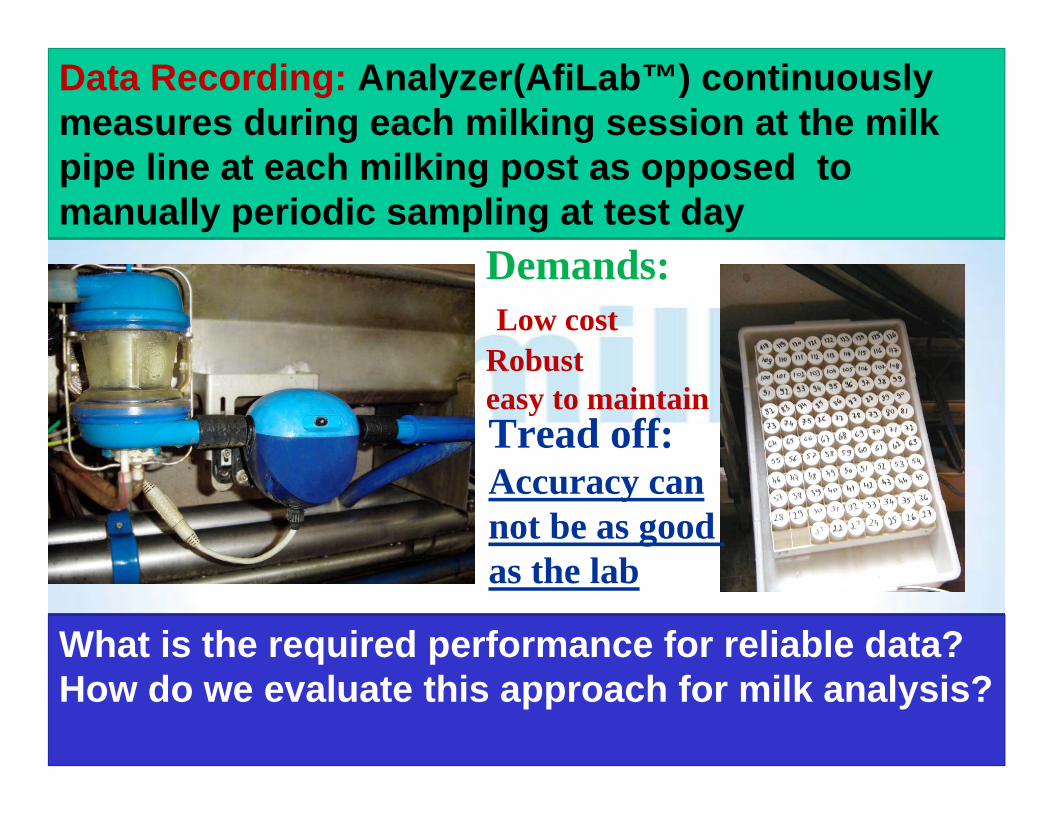
Data Recording: Analyzer(AfiLab™) continuouslymeasures during each milking session at the milkpipe line at each milking post as opposed tomanually periodic sampling at test day
What is the required performance for reliable data?How do we evaluate this approach for milk analysis?
Demands: Low costRobusteasy to maintainTread off:Accuracy cannot be as good as the lab
9
6%
5%
Days30
XiRefL
XP
XiA%Fat
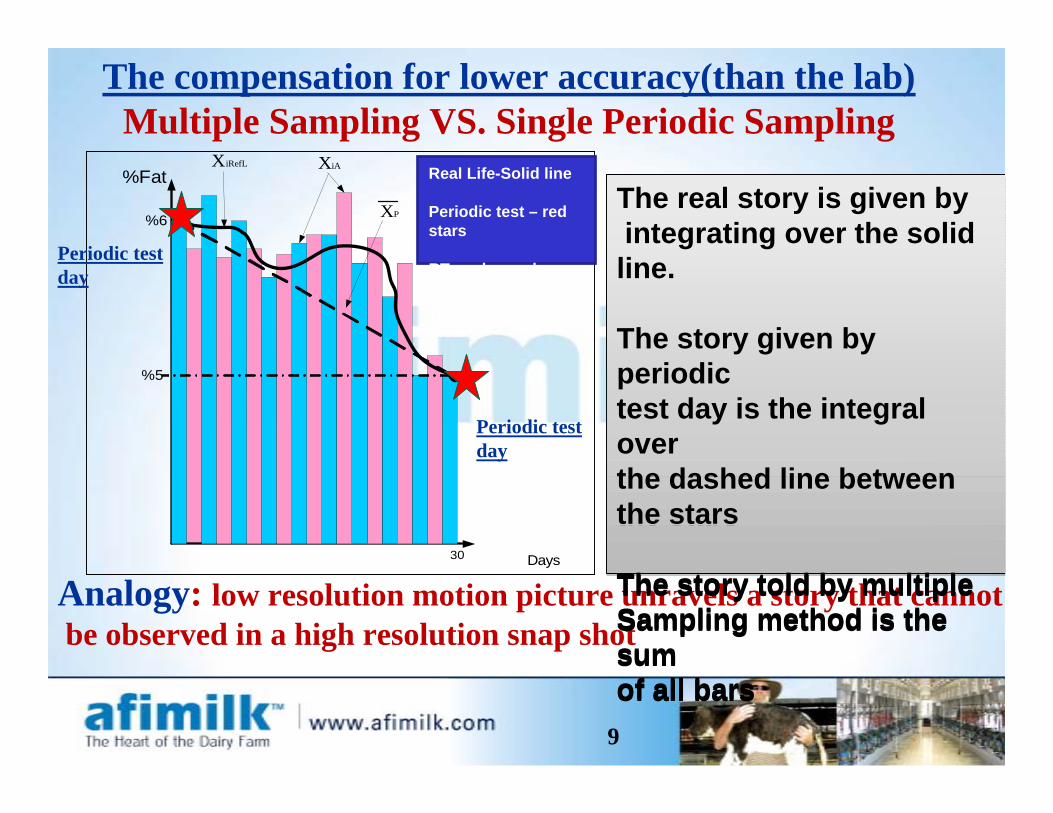
The compensation for lower accuracy(than the lab)Multiple Sampling VS. Single Periodic Sampling
Periodic testday
Real Life-Solid line
Periodic test – redstars
RT analyzer - bars
Analogy: low resolution motion picture unravels a story that cannot be observed in a high resolution snap shot
The real story is given by integrating over the solidline.
The story given byperiodictest day is the integraloverthe dashed line betweenthe stars
The story told by multipleSampling method is thesumof all bars
The real story is given by integrating over the solidline.
The story given byperiodictest day is the integraloverthe dashed line betweenthe stars
The story told by multipleSampling method is thesumof all bars
Periodic testday

* What is the accuracy required from a multi sampling measuring device for a reliable representation of the periodic test day??????????
10
What are the factors that will determine it?* Duration between test days* Total variance between samples of the individual* The average variance of all samples for a given duration
Can we evaluate all milk analysis methods withThe same approach?
The variance of the measuring system must be smaller than thevariance of the measured ensemble in the given time
The variance of the measuring system must be smaller than thevariance of the measured ensemble in the given time
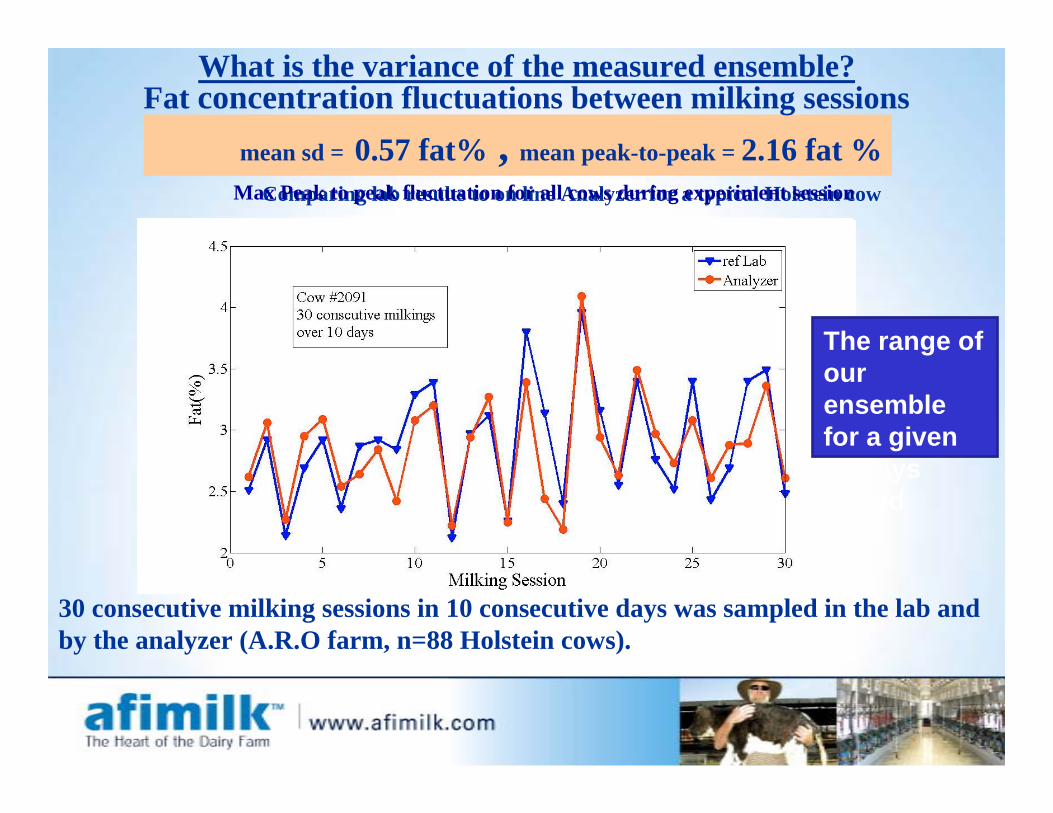
mean sd = 0.57 fat% , mean peak-to-peak = 2.16 fat %Comparing lab results to on line Analyzer for a typical Holstein cow
30 consecutive milking sessions in 10 consecutive days was sampled in the lab andby the analyzer (A.R.O farm, n=88 Holstein cows).
Max Peak to peak fluctuation for all cows during experiment session
What is the variance of the measured ensemble?Fat concentration fluctuations between milking sessions
The range ofourensemblefor a given10 daysperiod
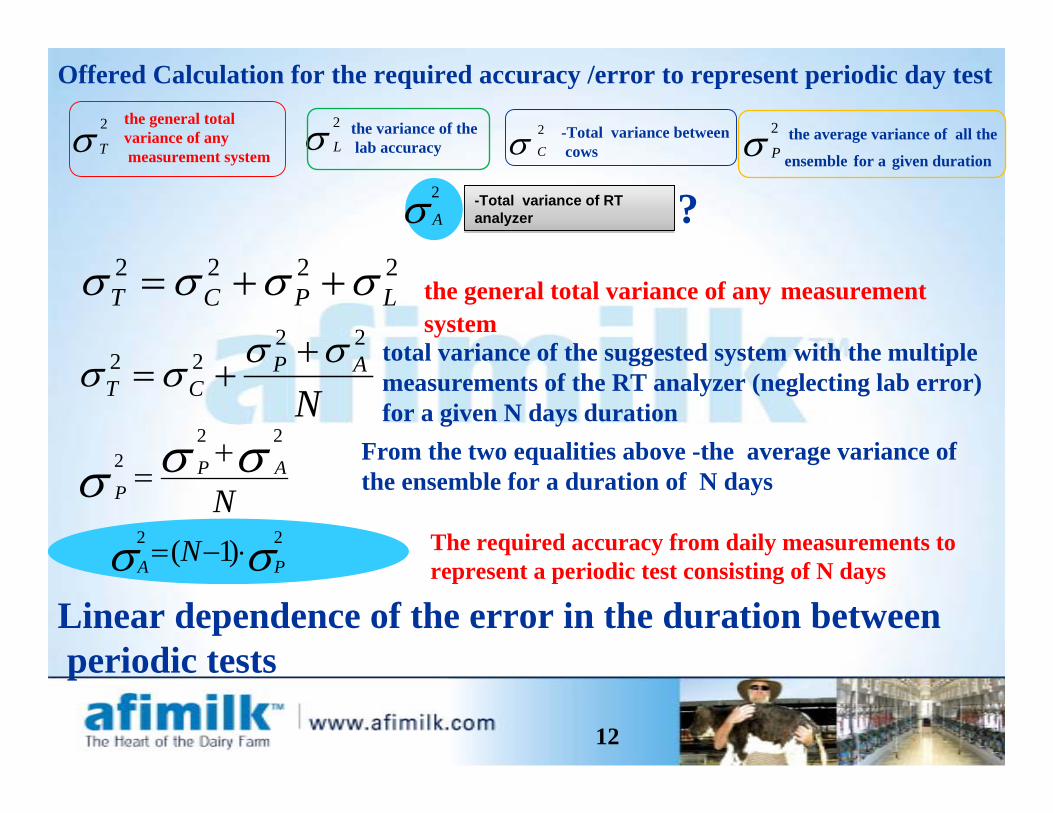
Offered Calculation for the required accuracy /error to represent periodic day test
12
2222LPCT σσσσ ++=
NAP
CT
2222 σσσσ ++=
NAP
Pσσσ
222 +=
σσ 22 )1( PA N ⋅−=
σ 2
Lσ 2
T σ 2
C σ 2
P
σ 2
A
the general totalvariance of any measurement system
the average variance of all the
ensemble for a given duration
the variance of the lab accuracy
-Total variance of RTanalyzer-Total variance of RTanalyzer
The required accuracy from daily measurements torepresent a periodic test consisting of N days
-Total variance between cows
total variance of the suggested system with the multiplemeasurements of the RT analyzer (neglecting lab error)for a given N days duration
?
the general total variance of any measurementsystem
From the two equalities above -the average variance ofthe ensemble for a duration of N days
Linear dependence of the error in the duration between periodic tests

13
Evaluating On-line Milk Analysis system
Reliable ID system, Milk meter and milk analyzer in every stall
multi-sensor automated data collection system performing multi-measurements
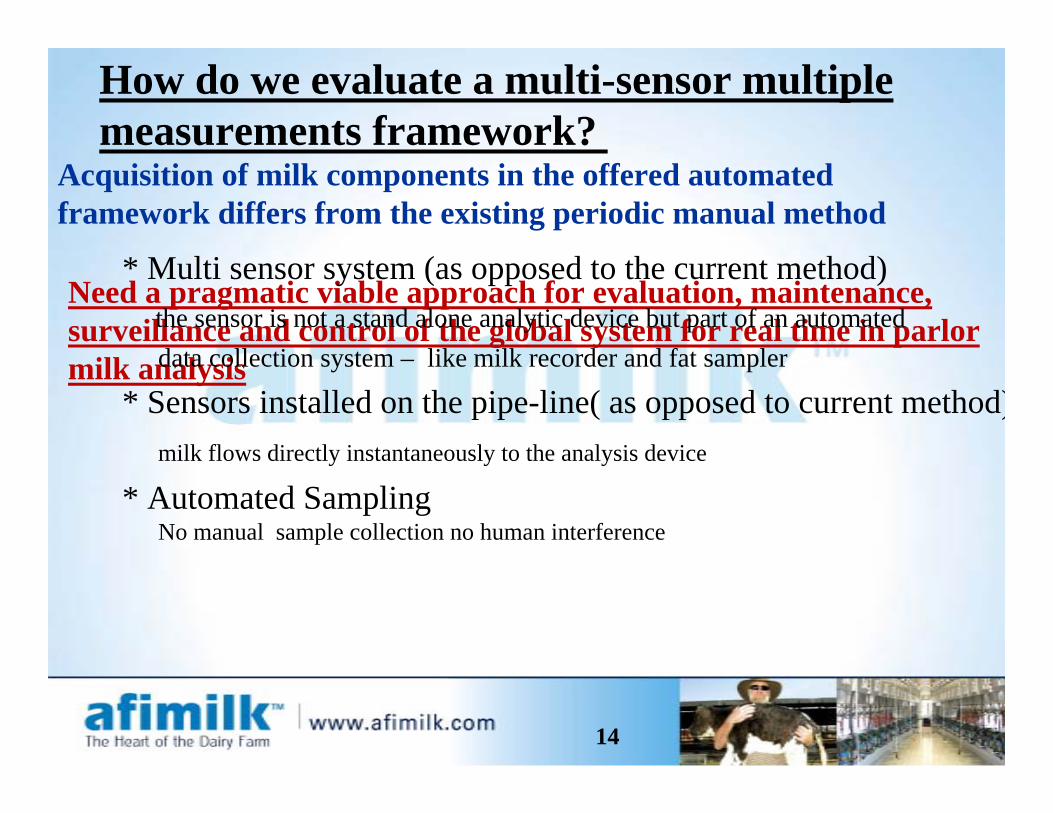
Need a pragmatic viable approach for evaluation, maintenance,surveillance and control of the global system for real time in parlormilk analysis
* Multi sensor system (as opposed to the current method) the sensor is not a stand alone analytic device but part of an automated
data collection system – like milk recorder and fat sampler
* Sensors installed on the pipe-line( as opposed to current method)milk flows directly instantaneously to the analysis device
* Automated Sampling No manual sample collection no human interference
14
How do we evaluate a multi-sensor multiplemeasurements framework?
Acquisition of milk components in the offered automatedframework differs from the existing periodic manual method
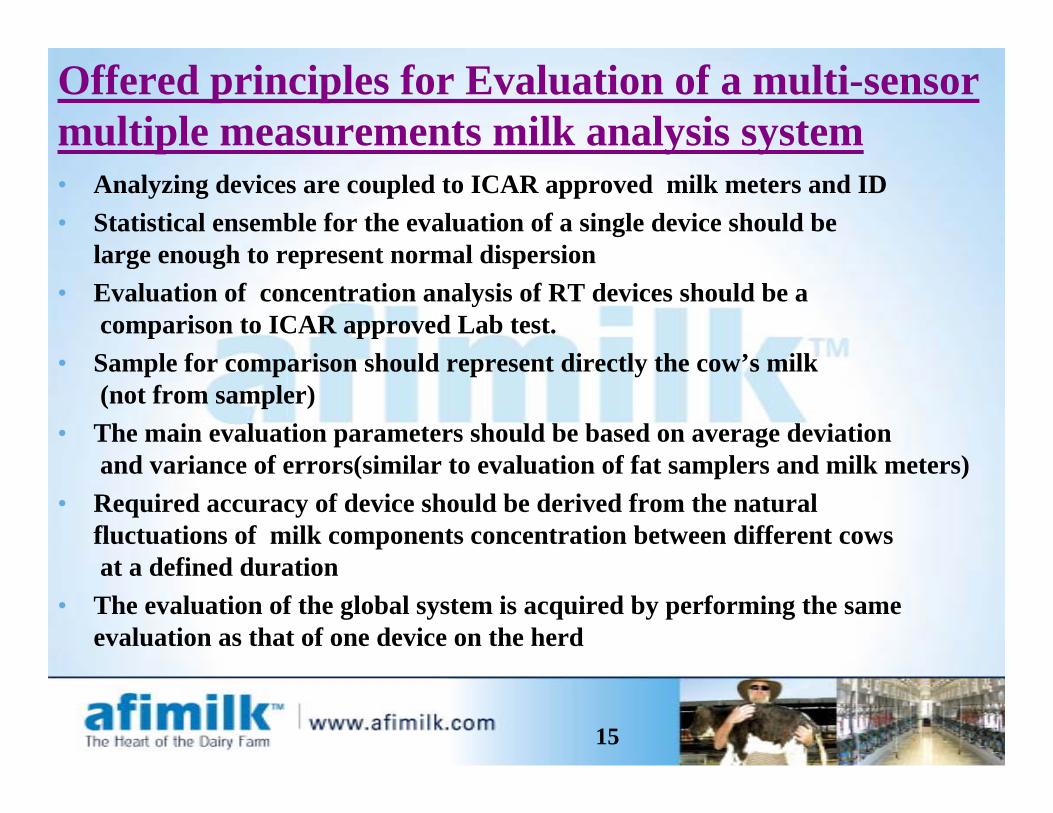
• Analyzing devices are coupled to ICAR approved milk meters and ID• Statistical ensemble for the evaluation of a single device should be
large enough to represent normal dispersion• Evaluation of concentration analysis of RT devices should be a
comparison to ICAR approved Lab test. • Sample for comparison should represent directly the cow’s milk
(not from sampler)• The main evaluation parameters should be based on average deviation
and variance of errors(similar to evaluation of fat samplers and milk meters)• Required accuracy of device should be derived from the natural
fluctuations of milk components concentration between different cows at a defined duration
• The evaluation of the global system is acquired by performing the same evaluation as that of one device on the herd
15
Offered principles for Evaluation of a multi-sensormultiple measurements milk analysis system
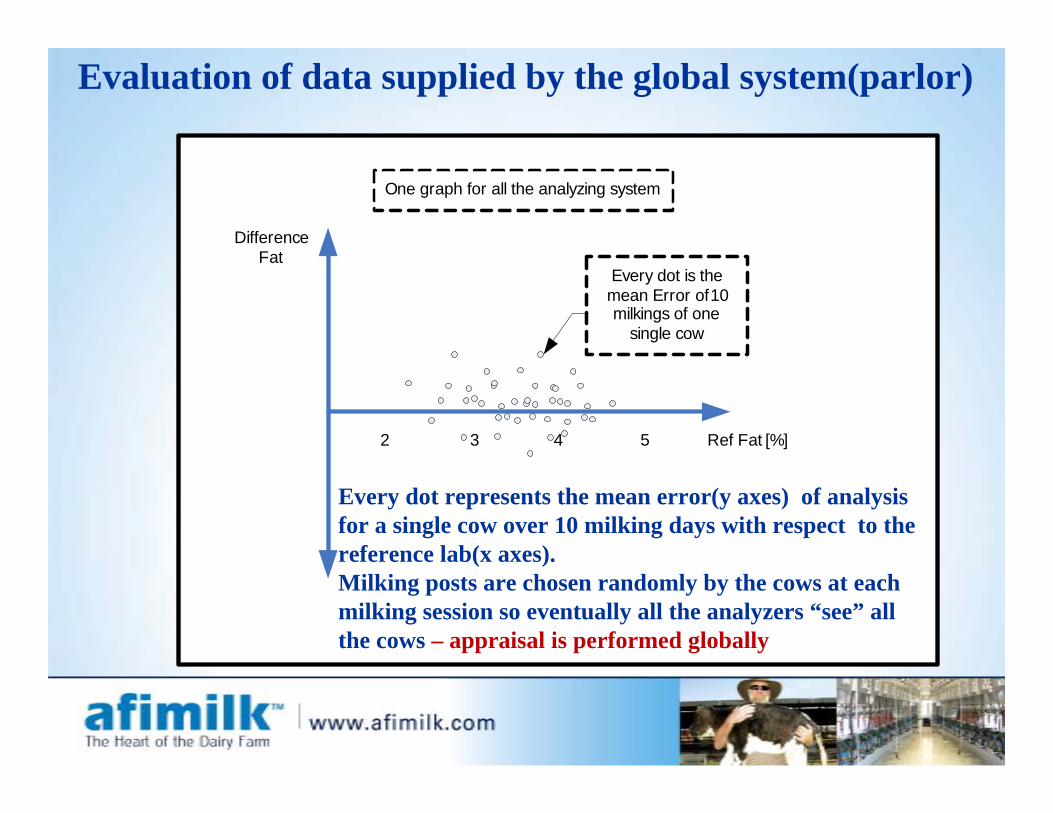
Ref Fat [%]
Difference Fat
2 3 4 5
Every dot is the mean Error of 10 milkings of one
single cow
One graph for all the analyzing system
Evaluation of data supplied by the global system(parlor)
Every dot represents the mean error(y axes) of analysisfor a single cow over 10 milking days with respect to thereference lab(x axes).Milking posts are chosen randomly by the cows at eachmilking session so eventually all the analyzers “see” allthe cows – appraisal is performed globally
17
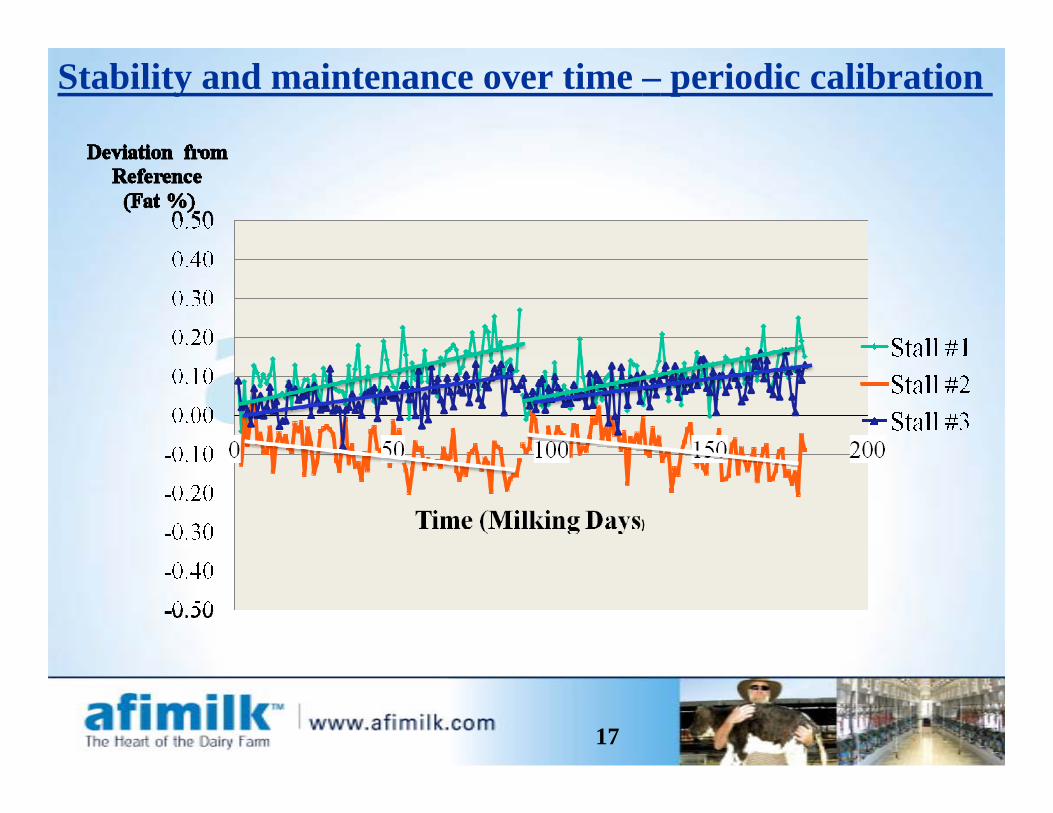
Stability and maintenance over time – periodic calibration
18
-15-10-505
1015202530
1 3 5 7 9 11 13 15 17 19 21 23 25 27
stall #1
stall #2
stall #3
Day 1 Day 2 Day 3
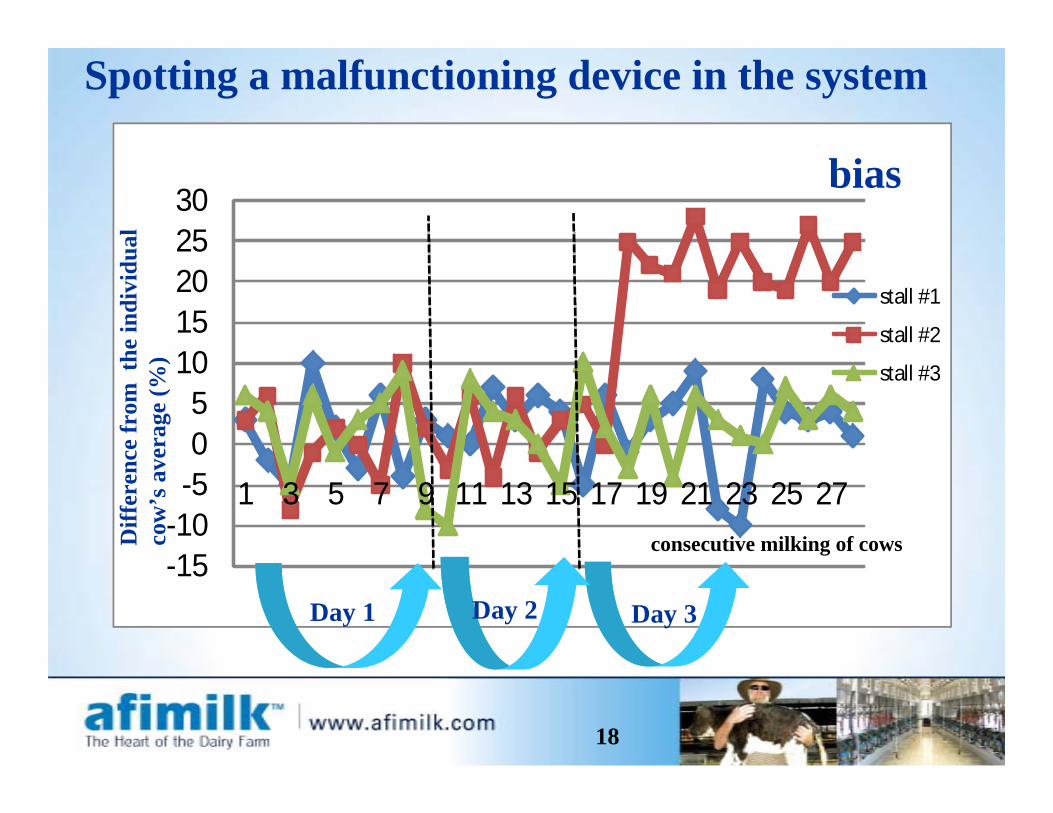
Spotting a malfunctioning device in the system
biasD
iffer
ence
from
the
indi
vidu
al
cow
’s a
vera
ge (%
)
consecutive milking of cows
19
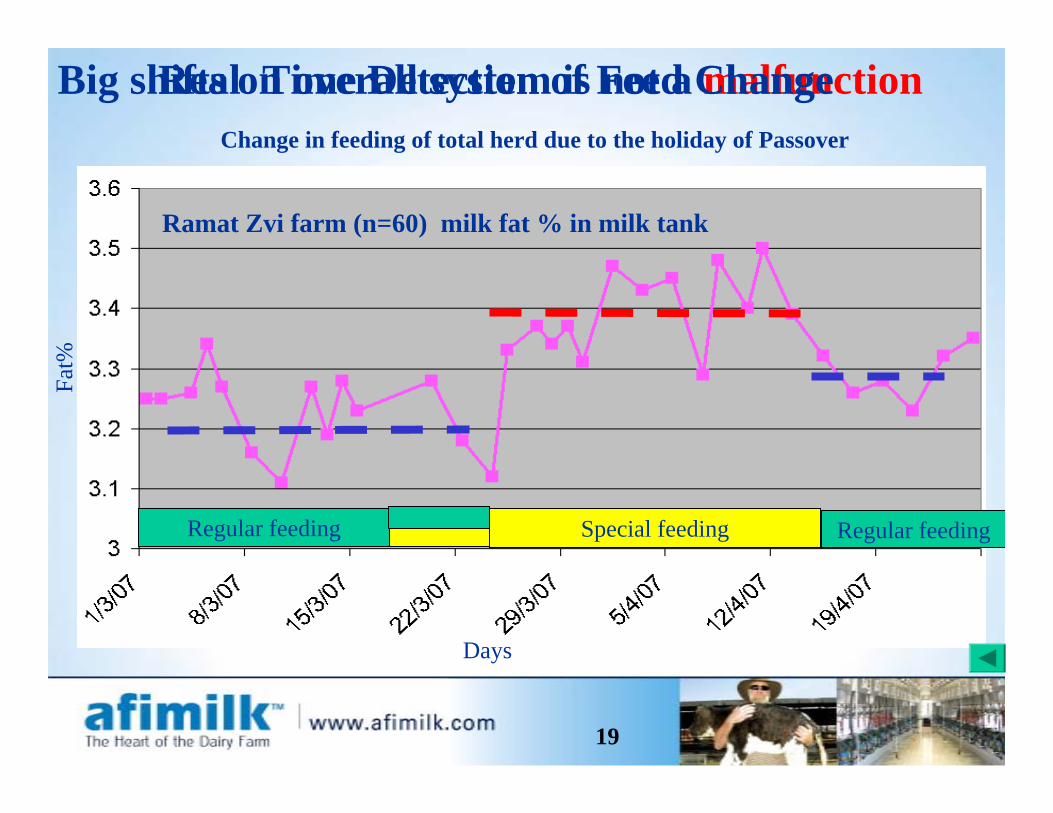
Regular feeding Special feeding Regular feeding
Fat%
Days
Ramat Zvi farm (n=60) milk fat % in milk tank
Change in feeding of total herd due to the holiday of Passover
Big shifts on overall system is not a malfunctionReal Time Detection of Feed Change

20
Summary1. A novel sensor was introduced. this sensor enables daily automated collection ofdata, that currently, is collected manually once amonth.
1. A novel sensor was introduced. this sensor enables daily automated collection ofdata, that currently, is collected manually once amonth.2. The RT on-line analyzer cannot be assessed bythe common approach used for periodic test days. There is a need to construct an approach forevaluation of the presented system
2. The RT on-line analyzer cannot be assessed bythe common approach used for periodic test days. There is a need to construct an approach forevaluation of the presented system3. The advantage of multiple sampling shouldbe a consideration in the construction of the approach

Thank you for yourThank you for yourattentionattention
“A low resolution motion picture canunravel a story that cannot be observed in
a high resolution snap shot”