a new chapter of opening-up in china’s financial sector · embracing the new era: a new chapter...
TRANSCRIPT
Embracing the New Era:A new chapter of Opening-up in China’s Financial Sector(Updated in May 2018 based on new policies and data)
www.pwccn.com
Management consulting
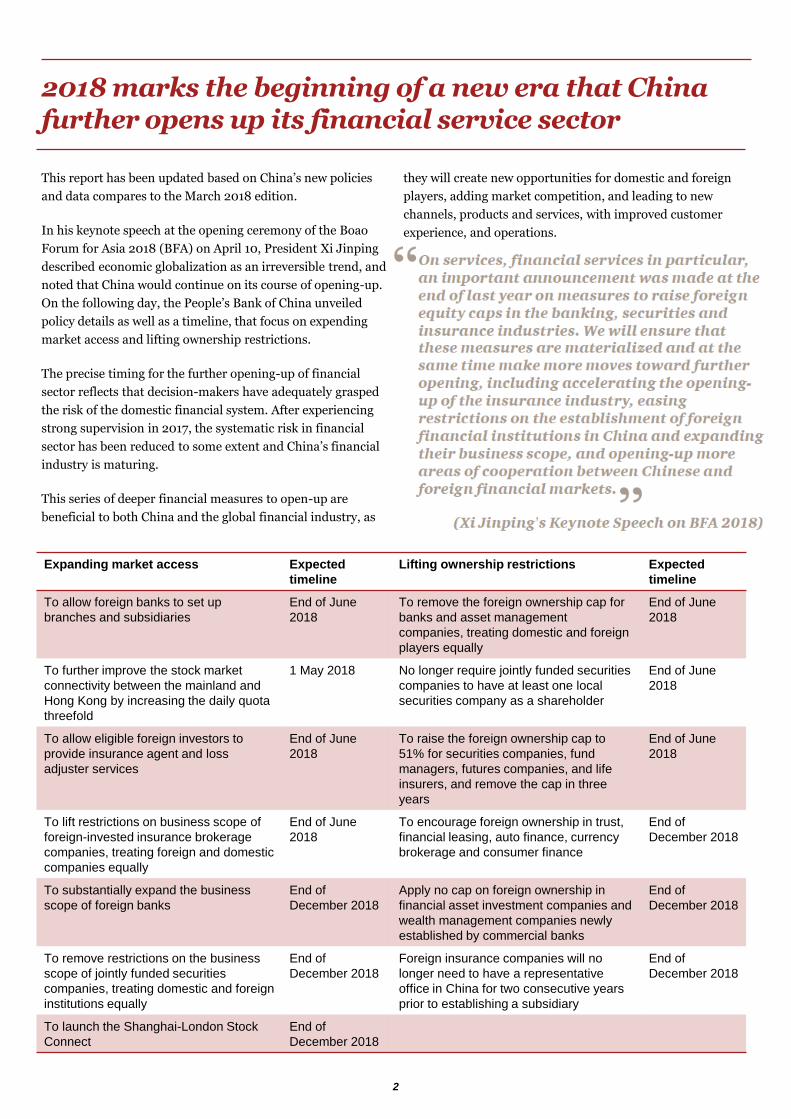
This report has been updated based on China’s new policies
and data compares to the March 2018 edition.
In his keynote speech at the opening ceremony of the Boao
Forum for Asia 2018 (BFA) on April 10, President Xi Jinping
described economic globalization as an irreversible trend, and
noted that China would continue on its course of opening-up.
On the following day, the People’s Bank of China unveiled
policy details as well as a timeline, that focus on expending
market access and lifting ownership restrictions.
The precise timing for the further opening-up of financial
sector reflects that decision-makers have adequately grasped
the risk of the domestic financial system. After experiencing
strong supervision in 2017, the systematic risk in financial
sector has been reduced to some extent and China’s financial
industry is maturing.
This series of deeper financial measures to open-up are
beneficial to both China and the global financial industry, as
they will create new opportunities for domestic and foreign
players, adding market competition, and leading to new
channels, products and services, with improved customer
experience, and operations.
2018 marks the beginning of a new era that China further opens up its financial service sector
Expanding market access Expected
timeline
Lifting ownership restrictions Expected
timeline
To allow foreign banks to set up
branches and subsidiaries
End of June
2018
To remove the foreign ownership cap for
banks and asset management
companies, treating domestic and foreign
players equally
End of June
2018
To further improve the stock market
connectivity between the mainland and
Hong Kong by increasing the daily quota
threefold
1 May 2018 No longer require jointly funded securities
companies to have at least one local
securities company as a shareholder
End of June
2018
To allow eligible foreign investors to
provide insurance agent and loss
adjuster services
End of June
2018
To raise the foreign ownership cap to
51% for securities companies, fund
managers, futures companies, and life
insurers, and remove the cap in three
years
End of June
2018
To lift restrictions on business scope of
foreign-invested insurance brokerage
companies, treating foreign and domestic
companies equally
End of June
2018
To encourage foreign ownership in trust,
financial leasing, auto finance, currency
brokerage and consumer finance
End of
December 2018
To substantially expand the business
scope of foreign banks
End of
December 2018
Apply no cap on foreign ownership in
financial asset investment companies and
wealth management companies newly
established by commercial banks
End of
December 2018
To remove restrictions on the business
scope of jointly funded securities
companies, treating domestic and foreign
institutions equally
End of
December 2018
Foreign insurance companies will no
longer need to have a representative
office in China for two consecutive years
prior to establishing a subsidiary
End of
December 2018
To launch the Shanghai-London Stock
Connect
End of
December 2018
2
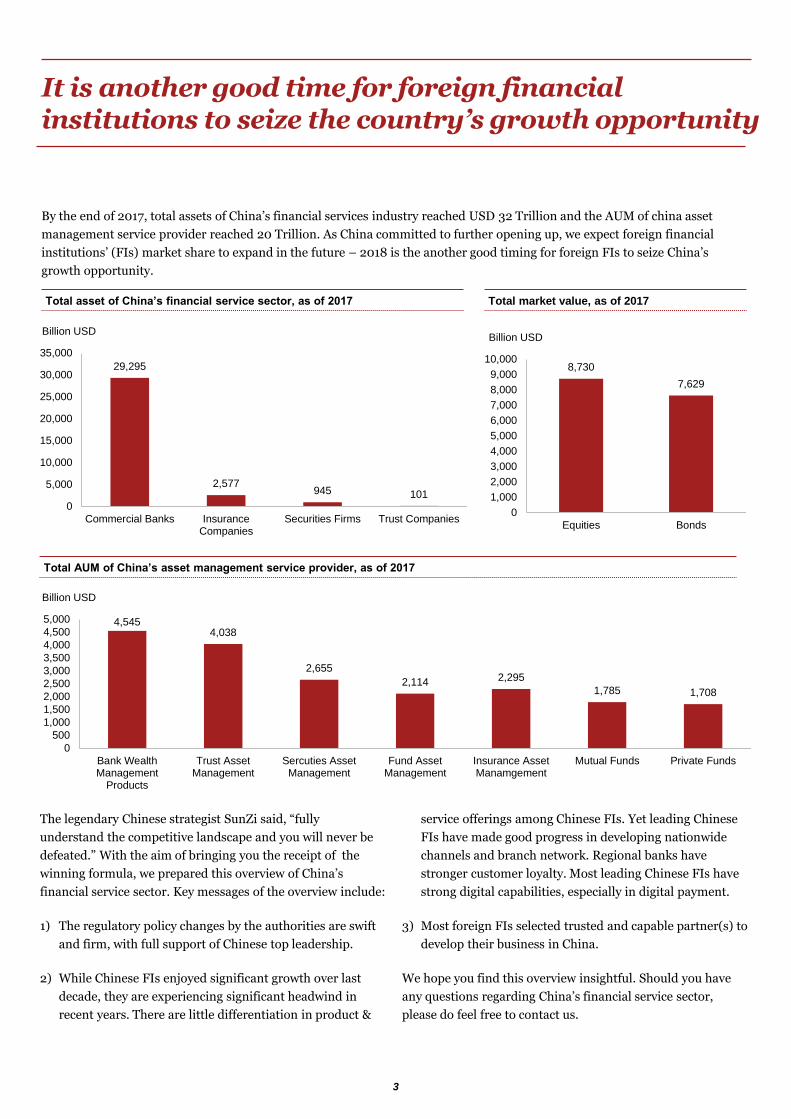
4,5454,038
2,655
2,114 2,295
1,785 1,708
0
500
1,000
1,500
2,000
2,500
3,000
3,500
4,000
4,500
5,000
Bank WealthManagement
Products
Trust AssetManagement
Sercuties AssetManagement
Fund AssetManagement
Insurance AssetManamgement
Mutual Funds Private Funds
Billion USD
It is another good time for foreign financial institutions to seize the country’s growth opportunity
3
Total AUM of China’s asset management service provider, as of 2017
The legendary Chinese strategist SunZi said, “fully
understand the competitive landscape and you will never be
defeated.” With the aim of bringing you the receipt of the
winning formula, we prepared this overview of China’s
financial service sector. Key messages of the overview include:
1) The regulatory policy changes by the authorities are swift
and firm, with full support of Chinese top leadership.
2) While Chinese FIs enjoyed significant growth over last
decade, they are experiencing significant headwind in
recent years. There are little differentiation in product &
service offerings among Chinese FIs. Yet leading Chinese
FIs have made good progress in developing nationwide
channels and branch network. Regional banks have
stronger customer loyalty. Most leading Chinese FIs have
strong digital capabilities, especially in digital payment.
3) Most foreign FIs selected trusted and capable partner(s) to
develop their business in China.
We hope you find this overview insightful. Should you have
any questions regarding China’s financial service sector,
please do feel free to contact us.
By the end of 2017, total assets of China’s financial services industry reached USD 32 Trillion and the AUM of china asset
management service provider reached 20 Trillion. As China committed to further opening up, we expect foreign financial
institutions’ (FIs) market share to expand in the future – 2018 is the another good timing for foreign FIs to seize China’s
growth opportunity.
Total asset of China’s financial service sector, as of 2017
29,295
2,577945 101
0
5,000
10,000
15,000
20,000
25,000
30,000
35,000
Commercial Banks InsuranceCompanies
Securities Firms Trust Companies
Billion USD
Total market value, as of 2017
8,730
7,629
0
1,000
2,000
3,000
4,000
5,000
6,000
7,000
8,000
9,000
10,000
Equities Bonds
Billion USD
4
01 The Financial Regulatory Landscape 05
02 Competitive Landscape: Banking 07
03 Competitive Landscape: Insurance 11
04 Competitive Landscape: Fund Management 17
05
Global FIs Anticipated Challenges in Developing China Market 27
Table of Contents
06
Competitive Landscape: Securities 23

The Financial Regulatory Landscape 1

Re-insurance
Insurance
Insurance broker/agent
Insurance asset management
Shanghai Insurance
Exchange
The Financial Regulatory Landscape
The People’s Bank of China (PBoC, China’s Central Bank)
Financial Stability and Development Commission of the State Council
The separation of supervision of China’s financial services industry has created significant risks in certain subsectors,
including insurance asset management, banking wealth management, shadow banking, etc.
With the People’s Banks of China introducing macro-prudential supervision and the recent establishment of the cross-sector
Financial Stability and Development Commission proposed in National Financial Work Conference (NFWC), as well as other
policy making meetings, such as the 19th CPC Party Congress, Central Economic Work Conference, China’s regulatory
framework is moving to an coordinated and collaborative approach.
Some recent policies with significant implications include:
• The merge of banking and insurance regulatory committee, and restriction on the shadow banking business of asset
management institutions;
• Crack down on Internet micro loans;
• Restriction on Unit-Linked products by insurance company;
• Restriction on program trading;
Trust
Financial Leasing
Banking
Consumer Finance
Auto Finance
Interbank
bond market
Interbank
Loan Asset
Exchange
China Banking & Insurance
Regulatory Commission
Mutual funds and subsidiaries
QD(F)IE/II/LP
Securities
Futures
PE Funds
Main Board/ GEM / NEEQ
China Securities
Regulatory Commission
China’s segmented supervision model of financial service industry is moving towards an coordinated and collaborative approach, enabled by several policy changes in 2017
6

Competitive Landscape:
Banking2
Competitive Landscape: Banking
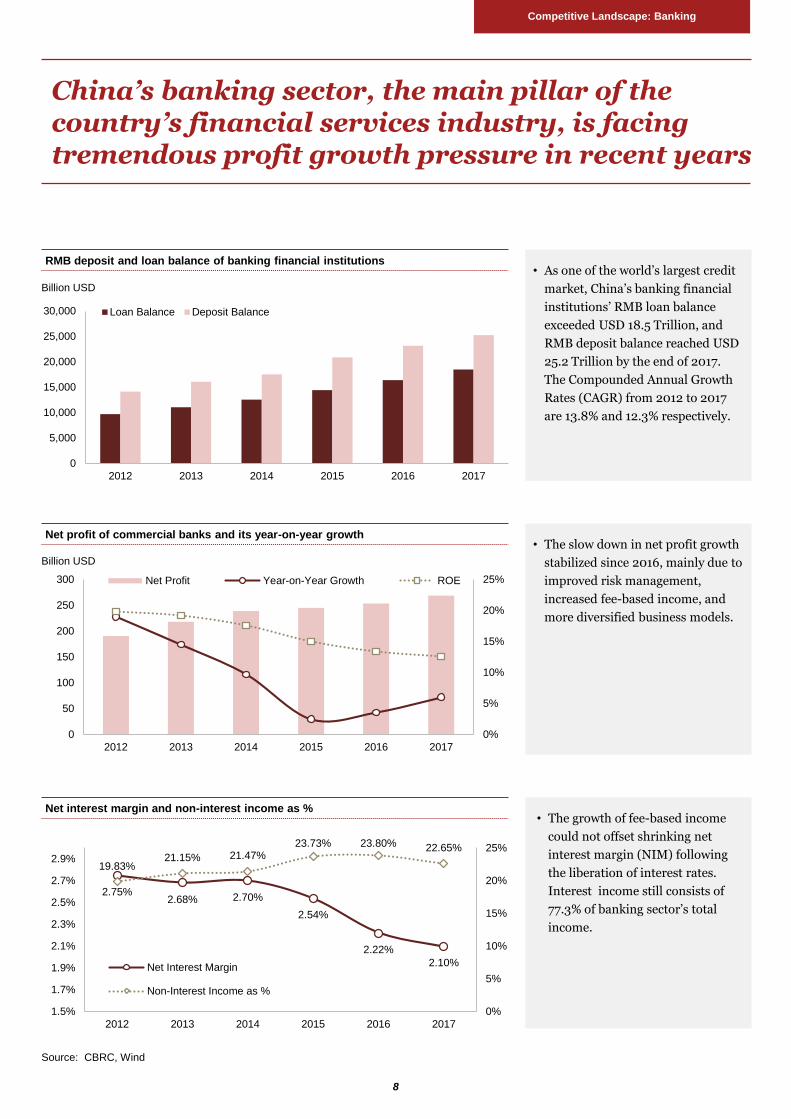
• As one of the world’s largest credit
market, China’s banking financial
institutions’ RMB loan balance
exceeded USD 18.5 Trillion, and
RMB deposit balance reached USD
25.2 Trillion by the end of 2017.
The Compounded Annual Growth
Rates (CAGR) from 2012 to 2017
are 13.8% and 12.3% respectively.
0
5,000
10,000
15,000
20,000
25,000
30,000
2012 2013 2014 2015 2016 2017
Loan Balance Deposit Balance
• The slow down in net profit growth
stabilized since 2016, mainly due to
improved risk management,
increased fee-based income, and
more diversified business models.
• The growth of fee-based income
could not offset shrinking net
interest margin (NIM) following
the liberation of interest rates.
Interest income still consists of
77.3% of banking sector’s total
income.
0%
5%
10%
15%
20%
25%
0
50
100
150
200
250
300
2012 2013 2014 2015 2016 2017
Net Profit Year-on-Year Growth ROE
2.75%2.68% 2.70%
2.54%
2.22%
2.10%
19.83%21.15% 21.47%
23.73% 23.80% 22.65%
0%
5%
10%
15%
20%
25%
1.5%
1.7%
1.9%
2.1%
2.3%
2.5%
2.7%
2.9%
2012 2013 2014 2015 2016 2017
Net Interest Margin
Non-Interest Income as %
RMB deposit and loan balance of banking financial institutions
Net profit of commercial banks and its year-on-year growth
Net interest margin and non-interest income as %
Billion USD
Billion USD
China’s banking sector, the main pillar of the country’s financial services industry, is facing tremendous profit growth pressure in recent years
Source: CBRC, Wind
8
0.95% 1.00%1.25%
1.67% 1.74% 1.74%
0.00%
0.50%
1.00%
1.50%
2.00%
2.50%
3.00%
3.50%
2012 2013 2014 2015 2016 2017
Commercial Bank
State-owned Commercial Bank
Joint-stock Commercial Bank
City Commercial Bank
Rural Comercial Bank
Competitive Landscape: Banking
Source: CBRC, Wind
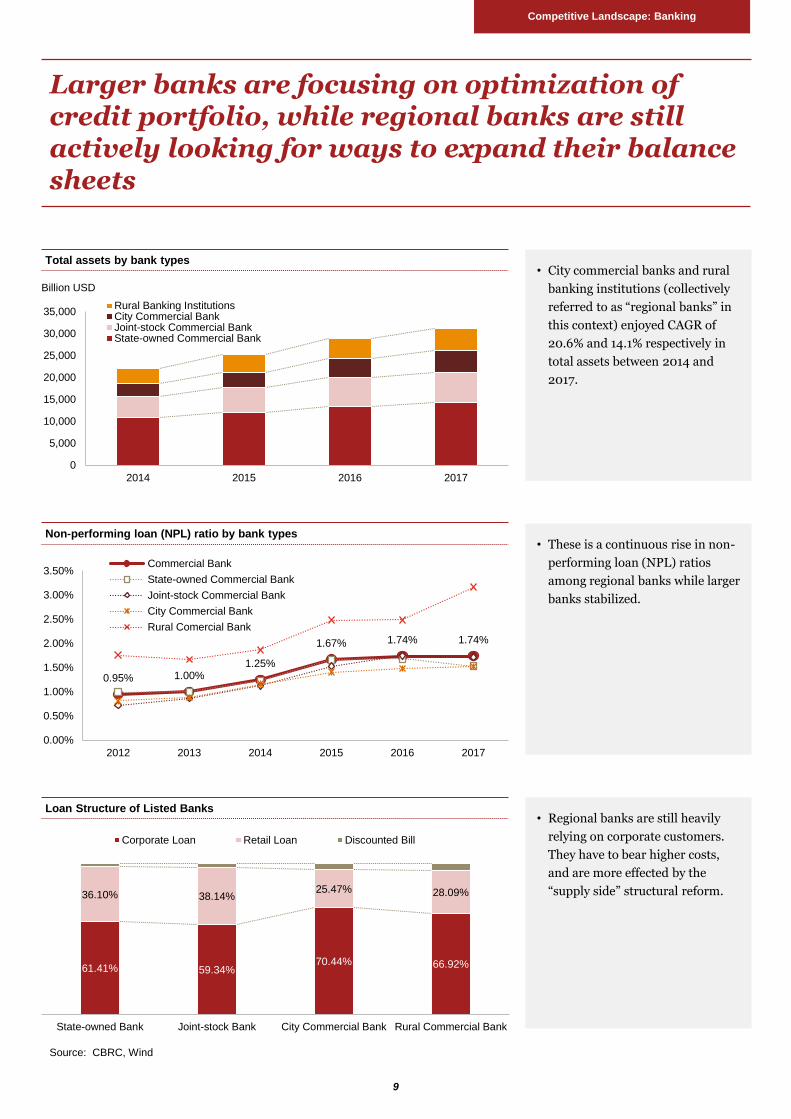
Total assets by bank types
Non-performing loan (NPL) ratio by bank types
Loan Structure of Listed Banks
0
5,000
10,000
15,000
20,000
25,000
30,000
35,000
2014 2015 2016 2017
Rural Banking InstitutionsCity Commercial BankJoint-stock Commercial BankState-owned Commercial Bank
61.41% 59.34%70.44% 66.92%
36.10% 38.14%25.47% 28.09%
State-owned Bank Joint-stock Bank City Commercial Bank Rural Commercial Bank
Corporate Loan Retail Loan Discounted Bill
Larger banks are focusing on optimization of credit portfolio, while regional banks are still actively looking for ways to expand their balance sheets
• City commercial banks and rural
banking institutions (collectively
referred to as “regional banks” in
this context) enjoyed CAGR of
20.6% and 14.1% respectively in
total assets between 2014 and
2017.
• These is a continuous rise in non-
performing loan (NPL) ratios
among regional banks while larger
banks stabilized.
• Regional banks are still heavily
relying on corporate customers.
They have to bear higher costs,
and are more effected by the
“supply side” structural reform.
Billion USD
9

Competitive Landscape: Banking
Bank’s WMPs balance and expected return rates
Wealth management products (WMPs) have been playing important roles in Chinese banks’ transformation. With tighter supervision, banks are under pressure to right size such business
1,570.77
2,310.77
3,615.38
4,469.23 4,544.62
4.88%
4.00% 3.95%
4.83%
0.00%
1.00%
2.00%
3.00%
4.00%
5.00%
6.00%
0
500
1,000
1,500
2,000
2,500
3,000
3,500
4,000
4,500
5,000
2013 2014 2015 2016 2017
Bank Wealth Management Product Balance Expected Annual Return Rate
• Bank’s wealth management
products (WMPs) balance reached
USD 4.54 Trillion in 2017,
representing an CAGR of over 30%
from 2013 to 2017.
• The balance in 2017 almost
stabilized due to tighter regulation.
• The new regulations prohibited
banks from providing “implicit
guarantee” in principal and returns
for most WMPs.
Underlying assets of bank’s WMPs
66.13% 70.31% 73.37% 73.52% 69.19%
25.62% 20.91% 15.73% 17.49%16.22%
8.25% 8.78% 10.90% 8.99%14.67%
0%
10%
20%
30%
40%
50%
60%
70%
80%
90%
100%
2013 2014 2015 2016 2017
Bonds, Money Market Instruments and Bank Deposits Non-standard debt Instruments Others
• Since the CBRC announced
tightened up the non-
standardized investment policy in
2014, bank WMPs investing in
non-standard debt instruments
have decreased.
• We expect the increased needs for
investment grade products to be
fulfilled by all FS sectors.
Data Source: CBRC, Wind
Unit: Billion USD
10

Competitive Landscape:
Insurance3
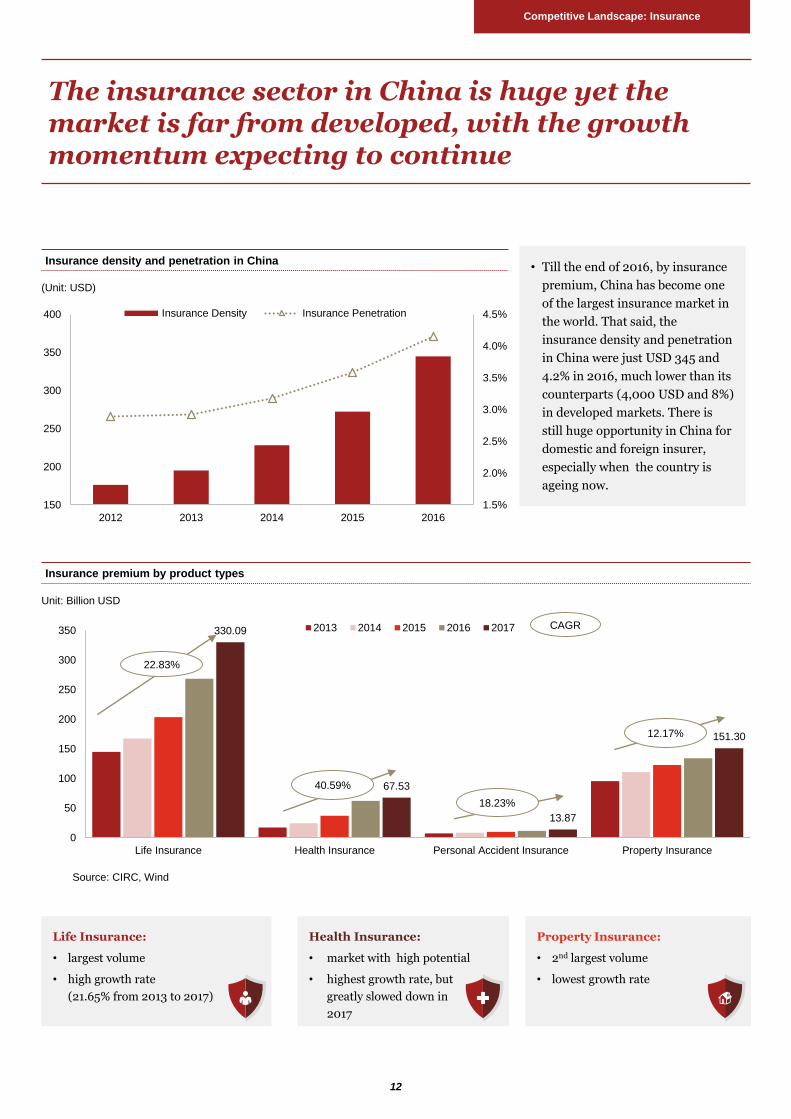
• Till the end of 2016, by insurance
premium, China has become one
of the largest insurance market in
the world. That said, the
insurance density and penetration
in China were just USD 345 and
4.2% in 2016, much lower than its
counterparts (4,000 USD and 8%)
in developed markets. There is
still huge opportunity in China for
domestic and foreign insurer,
especially when the country is
ageing now.
Insurance density and penetration in China
Insurance premium by product types
Unit: Billion USD
1.5%
2.0%
2.5%
3.0%
3.5%
4.0%
4.5%
150
200
250
300
350
400
2012 2013 2014 2015 2016
Insurance Density Insurance Penetration
330.09
67.53
13.87
151.30
0
50
100
150
200
250
300
350
Life Insurance Health Insurance Personal Accident Insurance Property Insurance
2013 2014 2015 2016 2017
22.83%
40.59%
18.23%
12.17%
CAGR
The insurance sector in China is huge yet the market is far from developed, with the growth momentum expecting to continue
Source: CIRC, Wind
Life Insurance:
• largest volume
• high growth rate
(21.65% from 2013 to 2017)
Health Insurance:
• market with high potential
• highest growth rate, but
greatly slowed down in
2017
Property Insurance:
• 2nd largest volume
• lowest growth rate
Competitive Landscape: Insurance
(Unit: USD)
12
Competitive Landscape: Insurance
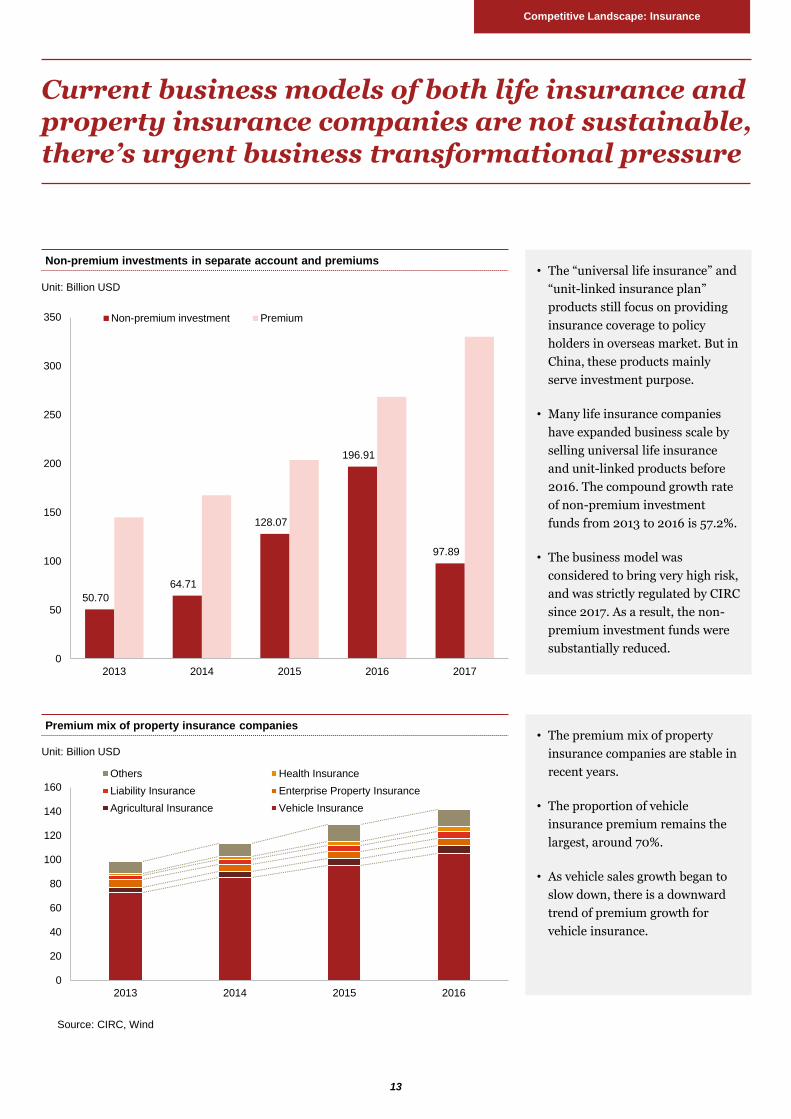
• The “universal life insurance” and
“unit-linked insurance plan”
products still focus on providing
insurance coverage to policy
holders in overseas market. But in
China, these products mainly
serve investment purpose.
• Many life insurance companies
have expanded business scale by
selling universal life insurance
and unit-linked products before
2016. The compound growth rate
of non-premium investment
funds from 2013 to 2016 is 57.2%.
• The business model was
considered to bring very high risk,
and was strictly regulated by CIRC
since 2017. As a result, the non-
premium investment funds were
substantially reduced.
• The premium mix of property
insurance companies are stable in
recent years.
• The proportion of vehicle
insurance premium remains the
largest, around 70%.
• As vehicle sales growth began to
slow down, there is a downward
trend of premium growth for
vehicle insurance.
Non-premium investments in separate account and premiums
Premium mix of property insurance companies
Current business models of both life insurance and property insurance companies are not sustainable, there’s urgent business transformational pressure
Unit: Billion USD
Unit: Billion USD
50.70
64.71
128.07
196.91
97.89
0
50
100
150
200
250
300
350
2013 2014 2015 2016 2017
Non-premium investment Premium
0
20
40
60
80
100
120
140
160
2013 2014 2015 2016
Others Health Insurance
Liability Insurance Enterprise Property Insurance
Agricultural Insurance Vehicle Insurance
Source: CIRC, Wind
13
Competitive Landscape: Insurance
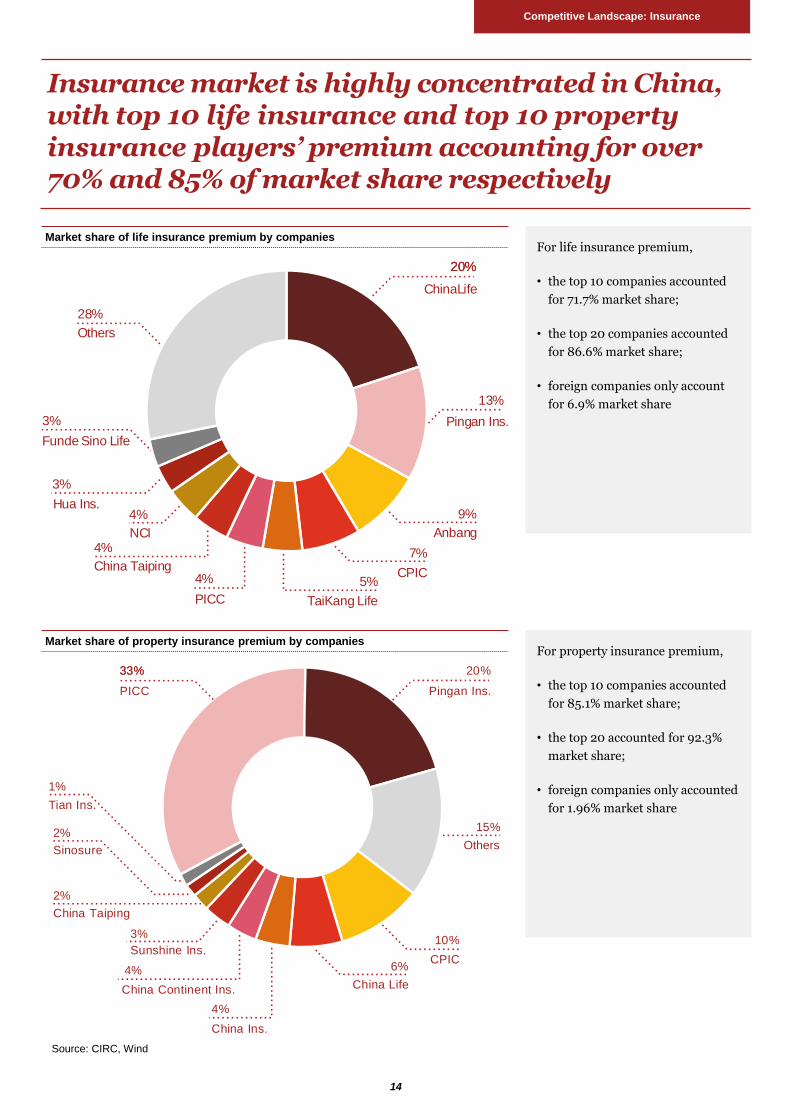
For life insurance premium,
• the top 10 companies accounted
for 71.7% market share;
• the top 20 companies accounted
for 86.6% market share;
• foreign companies only account
for 6.9% market share
For property insurance premium,
• the top 10 companies accounted
for 85.1% market share;
• the top 20 accounted for 92.3%
market share;
• foreign companies only accounted
for 1.96% market share
Market share of life insurance premium by companies
Market share of property insurance premium by companies
Insurance market is highly concentrated in China, with top 10 life insurance and top 10 property insurance players’ premium accounting for over 70% and 85% of market share respectively
Source: CIRC, Wind
33%33% 20%
15%
10%
6%
4%
4%
3%
2%
2%
1%
PICC Pingan Ins.
CPIC
China Life
China Ins.
Sunshine Ins.
China Taiping
Sinosure
Tian Ins.
Others
China Continent Ins.
20%20%
13%
9%
7%
5%4%
4%
4%
3%
3%
28%
ChinaLife
Pingan Ins.
Anbang
CPIC
TaiKang LifePICC
China Taiping
NCI
Hua Ins.
Funde Sino Life
Others
14

Competitive Landscape: Insurance
• With the rapid growth of insurance
premium, funds investable by
insurance companies increased at a
compound growth rate of 20%,
reaching over USD 2.3 Trillion in
2017.
• In terms of the asset allocation of
investment portfolio, it used to be
mainly in bonds and bank deposits.
In recent years, high-yield assets
such as unlisted equity and debt
instruments are growing in
demand.
• As insurance companies
investment scope were expanded,
as well as a buyout capital market,
the return on investment (ROI)
continued to grow in 2014 and
2015.
• But as macro economic slowdown
and a lack of quality assets, ROI of
insurance funds felt since 2016.
• If the market remains sluggish, the
ROI of insurance funds will
continue to face pressure.
Asset allocation of insurance companies’ investment portfolio
ROI of insurance companies investment portfolio
5.04%
6.30%
7.56%
5.66%5.77%
3.00%
3.50%
4.00%
4.50%
5.00%
5.50%
6.00%
6.50%
7.00%
7.50%
8.00%
2013 2014 2015 2016 2017
While insurance companies have invested more and more in high-yield assets such as unlisted equity and debt instruments, the return is trending downward in recent two years
29.45% 20.12% 21.78% 18.55% 13.11%
43.42%38.15% 34.39% 32.15% 35.11%
10.23%11.06%
15.18%13.28% 12.80%
16.90%
23.67%
28.65%
36.02%
40.79%
0
500
1,000
1,500
2,000
2,500
2013 2014 2015 2016 2017
Bank Deposit Bond Stock and Funds Alternative2295.48
2060.16
1719.93
1435.60
1182.66
Unit: Billion USD
Source: CIRC, Wind
15

Competitive Landscape:
Fund Management
4
Competitive Landscape: Fund Management
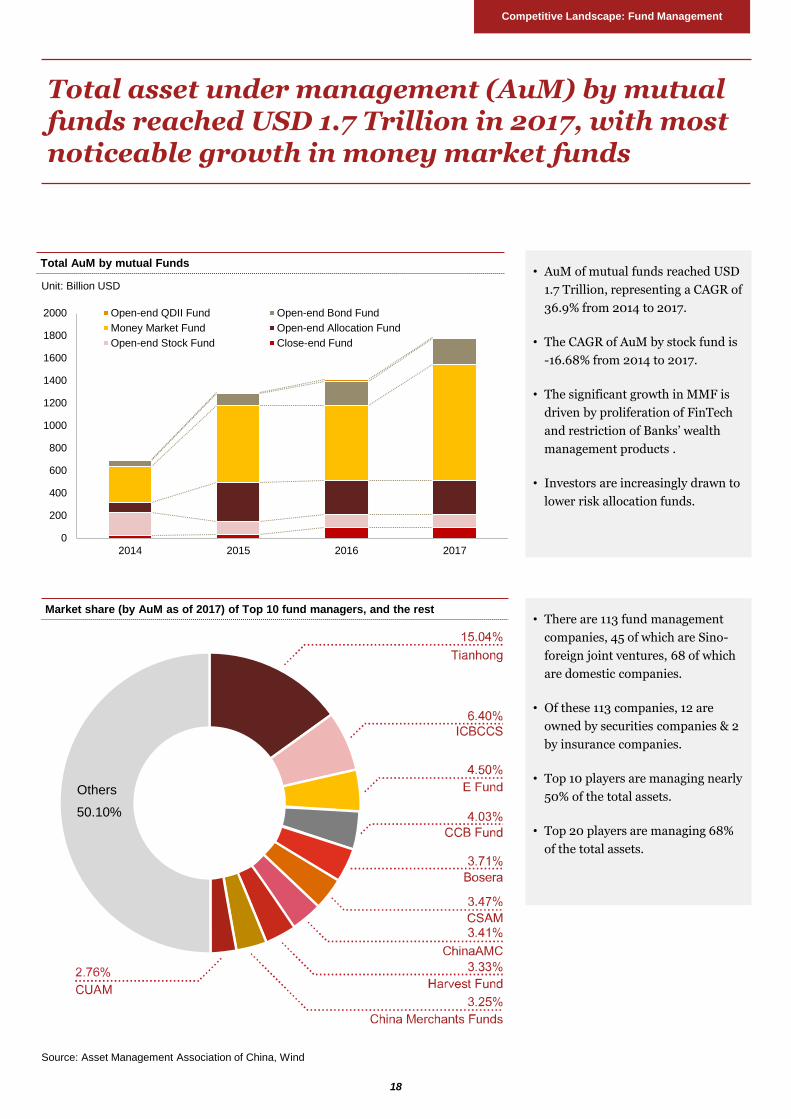
• AuM of mutual funds reached USD
1.7 Trillion, representing a CAGR of
36.9% from 2014 to 2017.
• The CAGR of AuM by stock fund is
-16.68% from 2014 to 2017.
• The significant growth in MMF is
driven by proliferation of FinTech
and restriction of Banks’ wealth
management products .
• Investors are increasingly drawn to
lower risk allocation funds.
• There are 113 fund management
companies, 45 of which are Sino-
foreign joint ventures, 68 of which
are domestic companies.
• Of these 113 companies, 12 are
owned by securities companies & 2
by insurance companies.
• Top 10 players are managing nearly
50% of the total assets.
• Top 20 players are managing 68%
of the total assets.
Total AuM by mutual Funds
Market share (by AuM as of 2017) of Top 10 fund managers, and the rest
0
200
400
600
800
1000
1200
1400
1600
1800
2000
2014 2015 2016 2017
Open-end QDII Fund Open-end Bond Fund
Money Market Fund Open-end Allocation Fund
Open-end Stock Fund Close-end Fund
Total asset under management (AuM) by mutual funds reached USD 1.7 Trillion in 2017, with most noticeable growth in money market funds
Unit: Billion USD
Source: Asset Management Association of China, Wind
50.10%
Others
18

Competitive Landscape: Fund Management
• AuM of private funds remained
high growth since 2014. The
CAGR from 2014 to 2017 is 95.1%,
with total size reaching USD 1.7
Trillion.
• AuM of private securities funds
declined significantly after
regulatory restriction in 2016, and
is around USD 265 billion by the
end of 2017.
• AuM of private equity (PE) funds
continued to increase rapidly and
reached USD 910 billion.
• The PE fund is a popular
investment vehicle in China’s
financial market. Many
institutions are developing related
business to gain higher returns.
• Private fund sector is dominated by funds with asset size under RMB 2 billion in China, with the majority relying on
banks, trusts & securities companies to market the products.
• As oppose to developed markets such as the US, there are no clear dominated players in China.
Private funds AuM
0
200
400
600
800
1000
1200
1400
1600
1800
2014 2015 2016 2017
Private securities funds Private equity funds Others
Although private fund sector is relatively small, with 95% of funds managing RMB 2 billion or less, it is the fastest growing FS subsector
Unit: Billion USD
Number of Private Funds by AUM in China (2017) AuM of Hedge Funds in the US
Source: Asset Management Association of China, Wind
Private securities Funds: private funds invested in public traded investment instruments
Private equity funds: private funds invested in nonpublic traded investment instruments
5% Bridgewater
2.3% AQR Capital
1.5% Two Sigma
RenaissanceTechnologies
1.3% DE Shaw & CO.
1% Millennium
1%Elliot
1% Och-Ziff Capital
0.9% The Baupost
0.8% Winton
1.3%
19
95%Below CNY 2B
84%Others
Competitive Landscape: Fund Management
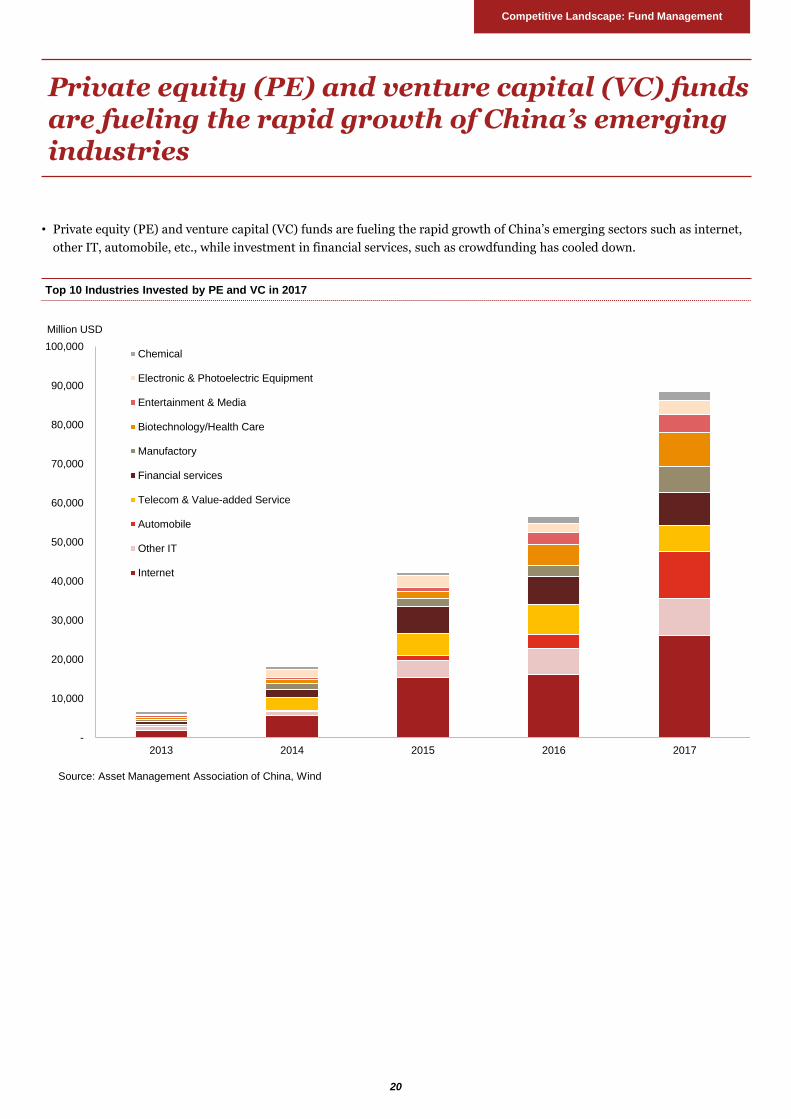
• Private equity (PE) and venture capital (VC) funds are fueling the rapid growth of China’s emerging sectors such as internet,
other IT, automobile, etc., while investment in financial services, such as crowdfunding has cooled down.
Source: Asset Management Association of China, Wind
Top 10 Industries Invested by PE and VC in 2017
Private equity (PE) and venture capital (VC) funds are fueling the rapid growth of China’s emerging industries
20
-
10,000
20,000
30,000
40,000
50,000
60,000
70,000
80,000
90,000
100,000
2013 2014 2015 2016 2017
Chemical
Electronic & Photoelectric Equipment
Entertainment & Media
Biotechnology/Health Care
Manufactory
Financial services
Telecom & Value-added Service
Automobile
Other IT
Internet
Million USD
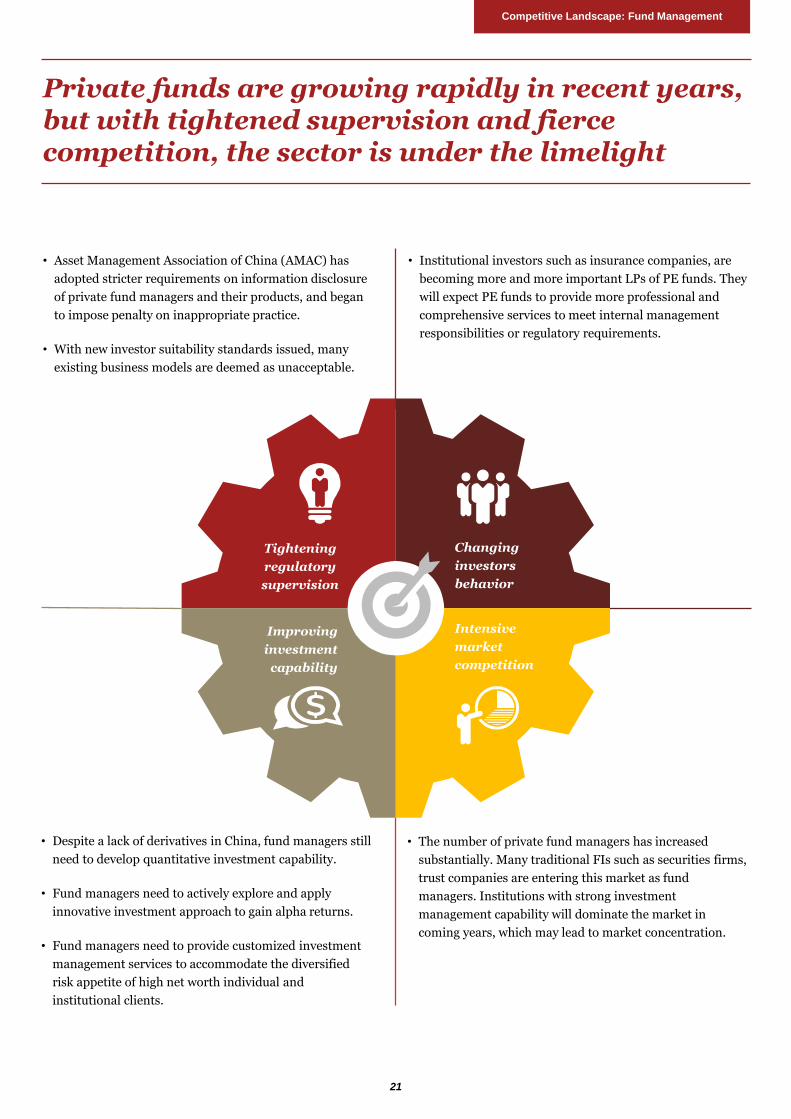
• Institutional investors such as insurance companies, are
becoming more and more important LPs of PE funds. They
will expect PE funds to provide more professional and
comprehensive services to meet internal management
responsibilities or regulatory requirements.
• Despite a lack of derivatives in China, fund managers still
need to develop quantitative investment capability.
• Fund managers need to actively explore and apply
innovative investment approach to gain alpha returns.
• Fund managers need to provide customized investment
management services to accommodate the diversified
risk appetite of high net worth individual and
institutional clients.
• The number of private fund managers has increased
substantially. Many traditional FIs such as securities firms,
trust companies are entering this market as fund
managers. Institutions with strong investment
management capability will dominate the market in
coming years, which may lead to market concentration.
• Asset Management Association of China (AMAC) has
adopted stricter requirements on information disclosure
of private fund managers and their products, and began
to impose penalty on inappropriate practice.
• With new investor suitability standards issued, many
existing business models are deemed as unacceptable.
Improving
investment
capability
Intensive
market
competition
Changing
investors
behavior
Tightening
regulatory
supervision
Private funds are growing rapidly in recent years, but with tightened supervision and fierce competition, the sector is under the limelight
21
Competitive Landscape: Fund Management

22
Competitive Landscape:
Securities5
Competitive Landscape: Securities
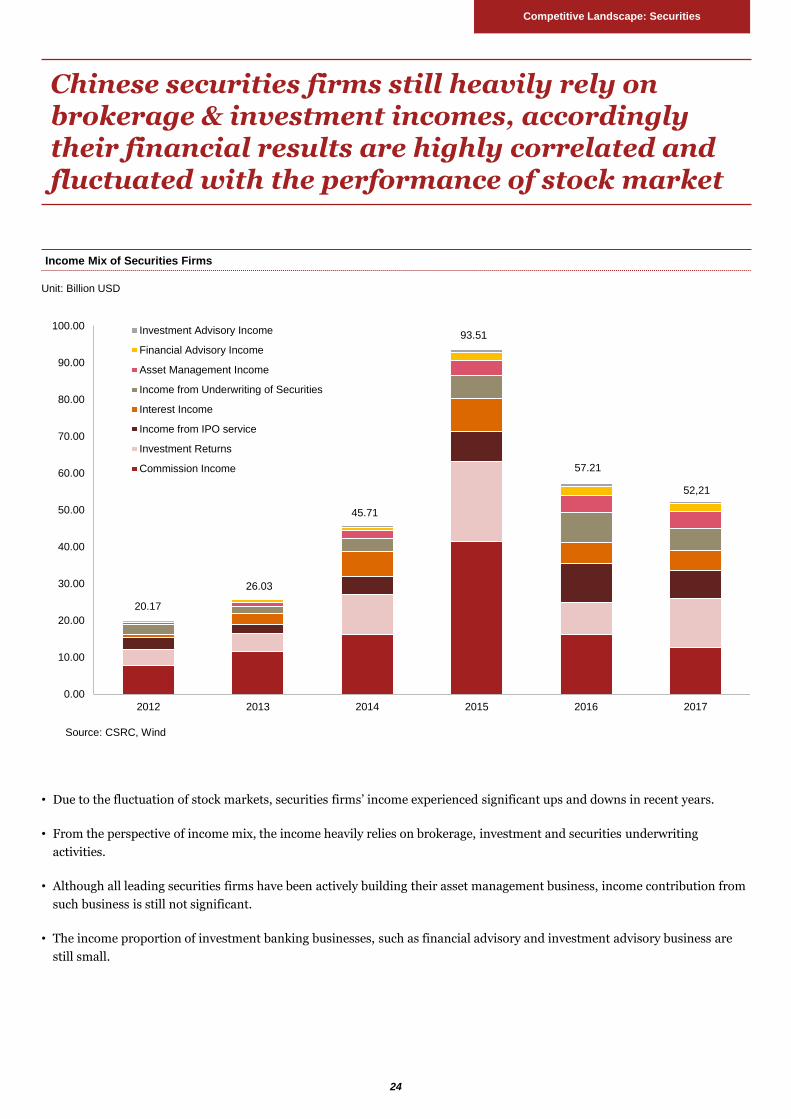
• Due to the fluctuation of stock markets, securities firms’ income experienced significant ups and downs in recent years.
• From the perspective of income mix, the income heavily relies on brokerage, investment and securities underwriting
activities.
• Although all leading securities firms have been actively building their asset management business, income contribution from
such business is still not significant.
• The income proportion of investment banking businesses, such as financial advisory and investment advisory business are
still small.
Income Mix of Securities Firms
Unit: Billion USD
0.00
10.00
20.00
30.00
40.00
50.00
60.00
70.00
80.00
90.00
100.00
2012 2013 2014 2015 2016 2017
Investment Advisory Income
Financial Advisory Income
Asset Management Income
Income from Underwriting of Securities
Interest Income
Income from IPO service
Investment Returns
Commission Income
Chinese securities firms still heavily rely on brokerage & investment incomes, accordingly their financial results are highly correlated and fluctuated with the performance of stock market
57.21
93.51
45.71
26.03
20.17
52,21
Source: CSRC, Wind
24

Asset Management
Brokerage
Investment Banking
Financial Advisory
Others
2%
17%
8%
50%
Competitive Landscape: Securities
Source: CSRC, Wind
While leading players dominate certain business segments, differentiation in product & service offerings is limited
25
Income Mix of Guangfa Securities
Asset Management
Brokerage
Investment Banking
Financial Advisory
Others
47% 25%
5%
9%
Income Mix of GUOTAI JUAN
13%
23%
• Many leading Chinese securities firms’
income mix looks very similar, with
around 50% from brokerage business
and the rest attributed to asset
management, investment banking and
advisory services;
• On the contrary, their global
counterparts are often known for
specialty in specific service line(s) such
as investment banks, asset management,
financial advisory or even securities
services
Asset Management Income of Leading Broker — Dealers
GUOTAI JUAN
GF Securities
CITIC Securities
Shenwan Hongyuan
Huatai Securities
Zhongtai Securities
Orient Securities
CMS
Everbright Securities
Huarong Securities
Others
44.39%
7.76%
3.77%
8.42%
6.69%
4.08%
3.98%
3.79%

26
Global FIs’ Anticipated Challenges
in Developing China Market
6
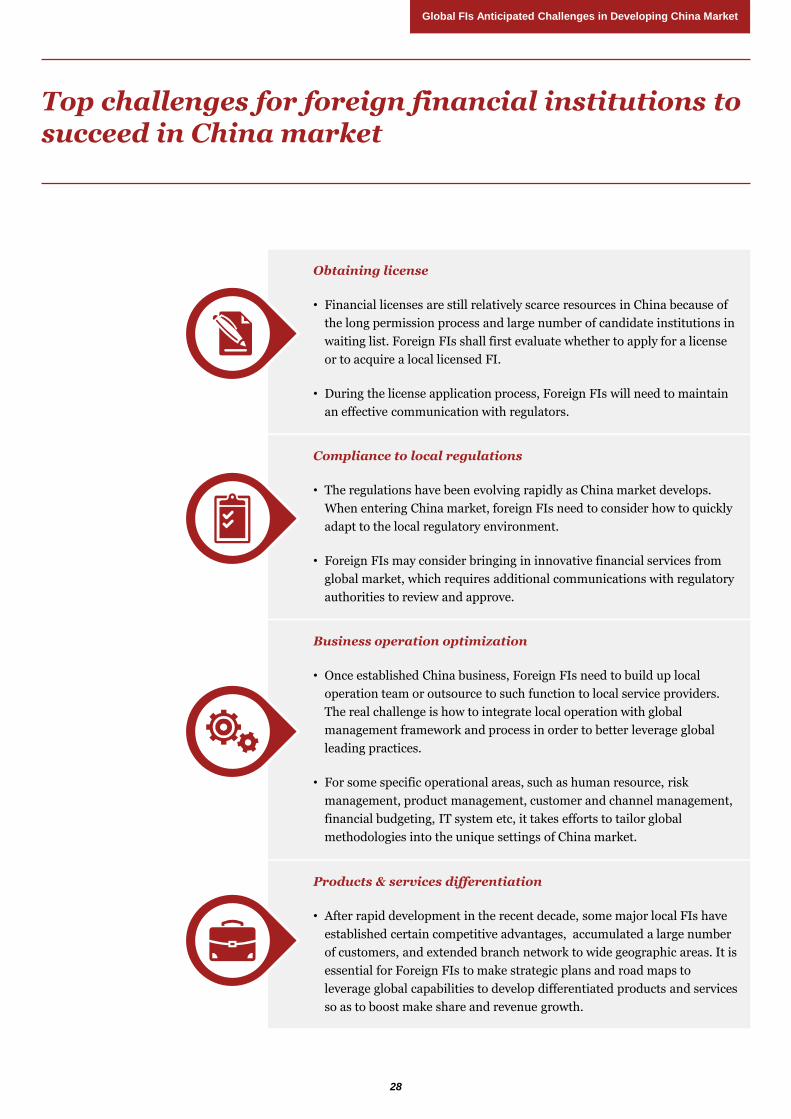
Top challenges for foreign financial institutions to succeed in China market
Obtaining license
• Financial licenses are still relatively scarce resources in China because of
the long permission process and large number of candidate institutions in
waiting list. Foreign FIs shall first evaluate whether to apply for a license
or to acquire a local licensed FI.
• During the license application process, Foreign FIs will need to maintain
an effective communication with regulators.
Compliance to local regulations
• The regulations have been evolving rapidly as China market develops.
When entering China market, foreign FIs need to consider how to quickly
adapt to the local regulatory environment.
• Foreign FIs may consider bringing in innovative financial services from
global market, which requires additional communications with regulatory
authorities to review and approve.
Business operation optimization
• Once established China business, Foreign FIs need to build up local
operation team or outsource to such function to local service providers.
The real challenge is how to integrate local operation with global
management framework and process in order to better leverage global
leading practices.
• For some specific operational areas, such as human resource, risk
management, product management, customer and channel management,
financial budgeting, IT system etc, it takes efforts to tailor global
methodologies into the unique settings of China market.
Products & services differentiation
• After rapid development in the recent decade, some major local FIs have
established certain competitive advantages, accumulated a large number
of customers, and extended branch network to wide geographic areas. It is
essential for Foreign FIs to make strategic plans and road maps to
leverage global capabilities to develop differentiated products and services
so as to boost make share and revenue growth.
Global FIs Anticipated Challenges in Developing China Market
28
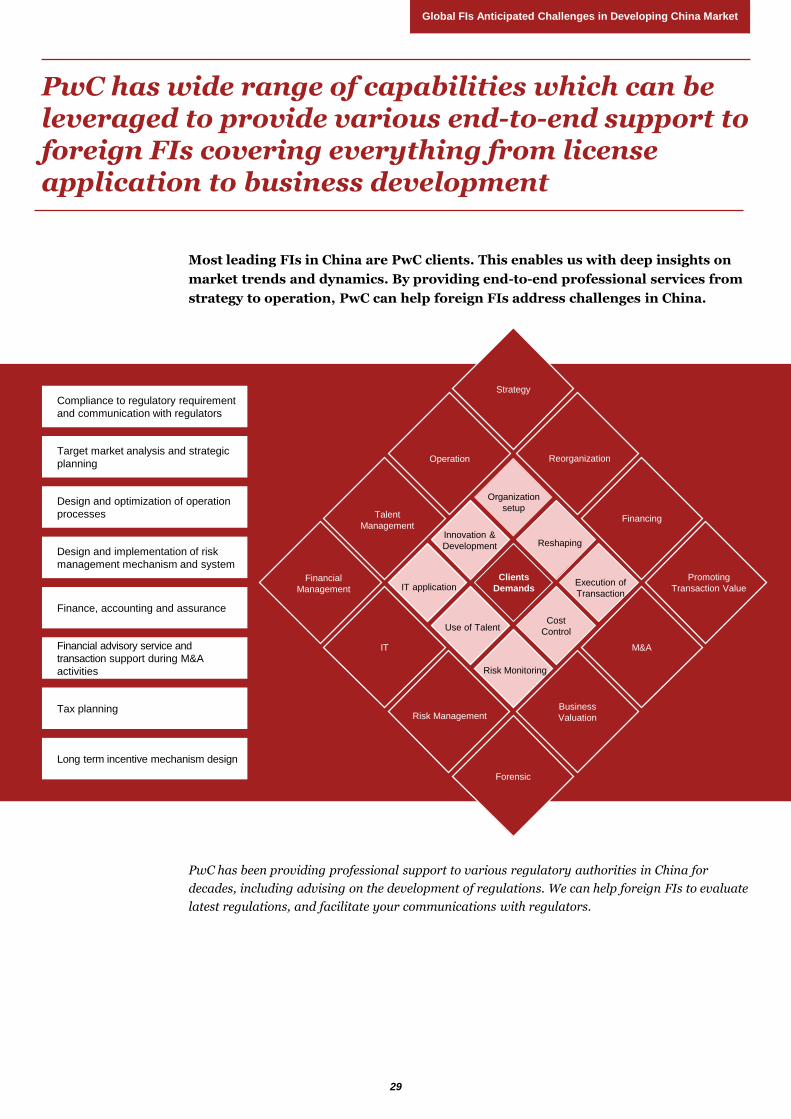
Most leading FIs in China are PwC clients. This enables us with deep insights on
market trends and dynamics. By providing end-to-end professional services from
strategy to operation, PwC can help foreign FIs address challenges in China.
PwC has wide range of capabilities which can be leveraged to provide various end-to-end support to foreign FIs covering everything from license application to business development
PwC has been providing professional support to various regulatory authorities in China for
decades, including advising on the development of regulations. We can help foreign FIs to evaluate
latest regulations, and facilitate your communications with regulators.
Strategy
Cost
Control
IT
Forensic
Business
Valuation
M&A
Financing
Innovation &
Development
Organization
setup
Reshaping
Execution of
Transaction
Risk Monitoring
Use of Talent
IT application
Risk Management
Talent
Management
Reorganization
Promoting
Transaction ValueFinancial
Management
Operation
Clients
Demands
Compliance to regulatory requirement
and communication with regulators
Target market analysis and strategic
planning
Design and optimization of operation
processes
Design and implementation of risk
management mechanism and system
Finance, accounting and assurance
Financial advisory service and
transaction support during M&A
activities
Tax planning
Long term incentive mechanism design
29
Global FIs Anticipated Challenges in Developing China Market

30

James Chang
China Financial Services Consulting Leader
+86 (10) 6533 2755
Harry Qin
China Asset & Wealth Management Consulting Lead Partner
+86 (10) 6533 5356
Jason B Li
China Financial Service Consulting Director
+86 (10) 6533 7676
Contact us

This content is for general information purposes only, and should not be used as a substitute for consultation with professional advisors.
© 2018 PricewaterhouseCoopers Management Consulting (Shanghai) Limited. All rights reserved. PwC refers to the China member firm, and may sometimes refer to the
PwC network. Each member firm is a separate legal entity. Please see www.pwc.com/structure for further details. CN-20180130-3-C1
www.pwccn.com