a new framework for modeling pond habitat in a …
TRANSCRIPT

The health of our waters is the principle measure of
how we live on the land. -- Luna Leopold
A NEW FRAMEWORK FOR MODELING POND HABITAT IN A CHANGING CLIMATE:
OBSERVED AND MODELED POND HYDROPERIODS IN CENTRAL SANTA CLARA COUNTY
A report prepared for the Guadalupe-Coyote Resource Conservation District
With partners: Santa Clara County Habitat Agency and Santa Clara County Parks
Funded in part by the
California Department of Fish and Wildlife NCCP Local Assitance Grant Program, awarded in 2015


Balance Hydrologics, Inc.
214136 Pond Habitat Report 03-14-2018.docx ii
TABLE OF CONTENTS
1. INTRODUCTION ...................................................................................................................................... 1
1.1 Problem statement .............................................................................................................................. 1
1.2 Technical goals .................................................................................................................................... 1
1.3 Report goals ......................................................................................................................................... 2
1.4 Acknowledgements ............................................................................................................................ 2
1.5 Limitations .............................................................................................................................................. 3
2. TECHNICAL APPROACH ........................................................................................................................ 4
2.1 Model selection ................................................................................................................................... 4
2.2 Ponds classification ............................................................................................................................. 5
2.2.1 Regional geology ................................................................................................................ 5
2.2.2 Genetic classification .......................................................................................................... 7
2.3 Pond selection.................................................................................................................................... 10
2.4 Pond monitoring ................................................................................................................................ 11
2.4.1 Stage-storage relationship development ....................................................................... 11
2.4.2 Hydrologic gaging ............................................................................................................. 12
2.4.3 Pond vegetation mapping ............................................................................................... 12
2.5 Conditions in WY2017 relative to historical norms ....................................................................... 12
2.6 Pond modeling .................................................................................................................................. 13
2.6.1 Model framework ............................................................................................................... 13
2.6.2 Model input data ............................................................................................................... 13
2.6.3 Model calibration data ..................................................................................................... 14
2.6.4 Hydroperiod water balance (HWB) model .................................................................... 14
2.6.5 Climate projection data ................................................................................................... 18
2.6.6 Model results ....................................................................................................................... 20 2.6.6.1 Tectogenic ................................................................................................................................... 21
2.6.6.2 Landslide head scarp ................................................................................................................. 21
2.6.6.3 Landslide dammed ..................................................................................................................... 22
2.6.6.4 Mining or quarry depressions ..................................................................................................... 23
2.6.6.5 Instream......................................................................................................................................... 23
3. HABITAT IMPLICATIONS AND NEXT STEPS .......................................................................................... 24
3.1 Habitat implications .......................................................................................................................... 24
3.2 Successes and shortcomings .......................................................................................................... 27
3.3 Next steps ............................................................................................................................................ 28
Balance Hydrologics, Inc.
214136 Pond Habitat Report 03-14-2018.docx iii
3.3.1 Coyote Valley pond habitat evaluation, prioritization, and enhancement .............. 28
3.3.2 Applying the pond hydroperiod model in other Counties and Districts ..................... 29
4. REFERENCES ......................................................................................................................................... 30

Balance Hydrologics, Inc.
214136 Pond Habitat Report 03-14-2018.docx iv
LIST OF TABLES
Table 1. Genetic classification descriptions
Table 2. Classification of the 21 study ponds
Table 3. Key pond characteristics
Table 4. Models results and parameter summary
LIST OF FIGURES
Figure 1. Pond Locations, Central Santa Clara County, California
Figure 2. Pond Locations, Almaden Quicksilver County Park, Santa Clara
County, California
Figure 3. Pond Locations, Calero County Park, Santa Clara County,
California
Figure 4. Pond Locations, Santa Teresa County Park, Santa Clara County,
California
Figure 5. Pond Locations, Coyote Lake Harvey Bear Ranch, Santa Clara
County, California
Figure 6a – 6h. Surface water and groundwater measurements and manual
observations
Figure 7. Hydroperiod water balance (HWB) model schematic
Figure 8a – 8u. Model Results
APPENDICES
Appendix A. Complete Model Parameters

Balance Hydrologics, Inc.
214136 Pond Habitat Report 03-14-2018.docx 1
1. INTRODUCTION
1.1 Problem statement
The Santa Clara Valley Habitat Conservation Plan (SCVHCP) lists eighteen “covered” species, which are managed and conserved under the SCVHCP, and for which take permits can be authorized for activities covered under the SCVHCP. Covered species under the SCVHCP include California Red-legged Frog (Rana draytonii, CRF), Western Pond Turtle (Actinemys marmorata, WPT), and Tricolored Blackbird (Agelaius tricolor, TB) are species dependent on water bodies for breeding and rearing habitat in otherwise dry grasslands and woodlands. In the Mediterranean climate of the Bay Area, the persistence of pools in streams, ponds, and artificial impoundments through the long dry season is a key determinant of habitat availability and can be difficult to determine based on sporadic, or occasional, observations (Skidds and Golet, 2005). Changes in the annual duration of ponding, or hydroperiod, and increase in the magnitude and duration of droughts expected due to changes in climate threatens to further reduce and fragment available habitat through the reduction or elimination of key individual breeding and rearing pools and ponds. Thus, the Guadalupe-Coyote Resource Conservation District has partnered with the SCVHCP and the Santa Clara County Parks (SCCP) District to study pond hydroperiod of waterbodies in the Coyote Valley of Santa Clara County, California.
1.2 Technical goals
The primary foci of this project are to:
a) Identify which ponds and impoundments which 1) are likely to be most sensitive to climate change, 2) are representative of a spectrum of landscapes and land cover, and, 3) have existing suitable habitat for target covered species.
b) Through the process of addressing point a, above, we developed a hydroperiod assessment tool that other land managers, open-space authorities, parks districts, and agencies can use in concert with other data including habitat connectivity, development plans, and water rights, to prioritize acquisition and preservation of resources and land in support of pond-dependent species covered in the habitat conservation plan.
c) Develop a hydroperiod dataset and assessment tool that can be easily applied to help develop strategies for controlling the spread of hybridized California tiger salamander and bullfrog.

Balance Hydrologics, Inc.
214136 Pond Habitat Report 03-14-2018.docx 2
The stakeholder team, consisting of GCRCD, SCCP, and SCVHA staff selected to study parks on the east and west flanks of the Coyote Valley in the following SCCP Parks: Almaden Quicksilver, Santa Teresa, Calero, and Coyote Lake Harvey Bear Ranch. Joseph D. Grant was also considered but eliminated from enrollment in the process because SCCP is concurrently and independently pursuing restoration and enhancement opportunities for many pond resources in Joseph D. Grant Park.
1.3 Report goals
In addition to applications in County Parks, this report is intended to provide a method and rubric for other public land managers seeking to evaluate and develop new ponds, and provide guidelines for the acquisition of lands, or set aside priority habitat to protect covered species. The tools presented herein have been developed to be used by the SCVHA to help prioritize areas for property expansion and conservation easements for the target species in the context of changing climates.
This report summarizes the findings of the hydrologic analyses of 21 ponds, estimating pool persistence with the application of identifying potential aquatic breeding habitat and occupancy limitations. For each pond, existing hydroperiod and emergent vegetation were quantified, and potential restoration and enhancement activities for the protection and improvement of pond habitat identified, with the intent of feeding into a larger evaluation of habitat connectivity and pond enhancement prioritization to increase the occupancy of the ponds by native species.
The stakeholder team has asked that we concentrate our efforts in areas enrolled or proposed for enrollment into the Santa Clara Valley Habitat Conservation Plan (SCVHCP) that are likely to remain undeveloped or have the opportunity to be restored, including Calero, Coyote Lake Harvey Bear Ranch, Santa Teresa, and Almaden Quicksilver County Parks.
1.4 Acknowledgements
This report has been a collaborative effort and so we’d like to acknowledge several key contributors.
• Stephanie Moreno for development of the initial concept and bringing this project to us for discussion and effective co-development of the concept and application of the results of this study. We also appreciate her persistence in

Balance Hydrologics, Inc.
214136 Pond Habitat Report 03-14-2018.docx 3
finding funding for the project and leadership and vision through the life of the grant.
• GCRCD Board of Directors for generously supporting this important work with the in-kind contribution of Stephanie Moreno’s time.
• Terah Donavan and Edmund Sullivan at the Santa Clara Valley Habitat Agency for assistance in developing the grant, and their generous in-kind contributions.
• Barry Hill, formerly of SCCP, currently at Solano County Parks and Recreation Division, for initially conceiving of a scientific study in SCCP pond hydroperiods and allowing us to further develop his approach and execute a study.
• Don Rocha at SCCP for providing critical institutional knowledge and guidance during initial project discussions
• Michael Rhoades at SCCP for working closely and openly with the project team to complete the field data collection campaign and communicate the interests of the SCCP to the Team.
• GCRCD volunteer Gary Jahns, for his invaluable assistance with the field calibration data collection campaign.
• The SCCP Rangers who provided invaluable assistance with park access, historical observations, and insights into on-the-ground pond management.
1.5 Limitations
Analyses and information included in this report are intended for planning purposes described above. Analyses of channels and other water bodies, rocks, earth properties, topography and/or environmental processes are generalized to be useful at the scale of the watershed, both spatially and temporally. We have made efforts to incorporate sound science developed by prior workers, and evaluations completed as part of this project. However, recommendations may need to be refined or modified as a result of discoveries made during planned subsequent habitat connectivity and prioritization evaluations, or as other relevant future studies are conducted and results shared.

Balance Hydrologics, Inc.
214136 Pond Habitat Report 03-14-2018.docx 4
2. TECHNICAL APPROACH
The following section presents our technical approach used to characterize the hydroperiod, and climate change response across 21 ponds in the Coyote valley SCCP, (Figure 1). Ponds were studies in Almaden Quicksilver County Park, Calero County Park, Santa Teresa County Park, and Coyote Lake Harvey Bear Ranch County Park (Figures 2 – 5). All 21 ponds were visited and a reconnaissance-level topographic survey was performed at each to develop stage-storage relationships. Each pond was grouped into genetic classification based on existing literature, input from SCCP staff, and our reconnaissance site survey visits. Selection criteria were based on, but not limited to, rainfall, geology, soils, position in the landscape (e.g., aspect and elevation), vegetation within the watershed, and anthropogenic influence (e.g., active grazing, constructed vs. natural). Model calibration data were collected at eight ponds, selected to be a representative sample of each classification type. Monitoring calibration data were supplemented with discrete pond elevations measured using historical aerial imagery in Google Earth ®. A custom-developed and batch-run hydroperiod water balance (HWB) model was constructed to characterize the relative contributions of various hydrologic inputs and outputs which estimate the pond water surface elevations monthly throughout the historical record. The model is extended into the future using climate projections and each pond hydroperiod is evaluated for climate resiliency.
2.1 Model selection
Several model platforms were evaluated for the completion of the hydroperiod modeling. In the end, a custom-developed hydroperiod water balance (HWB) model constructed in Python was selected over a graphical user interface (gui)-based software package such as the Bay Area Hydrology Model (BAHM) or the US Army Corps of Engineers Hydrologic Engineering Center Hydrologic Modeling System (HEC-HMS).
Use of a gui-based model would likely require a new model for each pond. The large number of ponds modeled in this project means that systematic changes to the set of models would require changes to be made for individual models, introducing risk for error or model inconsistency. If the resultant model is then extended to other ponds beyond the 21 ponds modeled here, this potential problem is compounded. The Python-based model uses the same model calculations for each pond, with model inputs easily comparable and adjustable in a set of Microsoft Excel® input files.
Balance Hydrologics, Inc.
214136 Pond Habitat Report 03-14-2018.docx 5
A gui-based software package often has a more intuitive user interface and a documented user manual, compared with a custom-developed Python model. As a result, the choice of a Python-based model may discourage end-users of the model without programming experience. However, as an open-source programming language, interaction with the model has been set up to use input files created in excel. With appropriate training, perhaps in the form of a workshop, end-users with no programming experience could easily use the model. In addition, BAHM is limited for use in Alameda, San Mato, and Santa Clara counties, which is sufficient for this project, but may limit wider application of the model or comparison of results with those in adjoining counties.
Ultimately, the primary deciding factor in model selection came to the flexibility and functionality of the model. Both BAHM and HEC-HMS have a limited number of parameters used for model tuning. Accurate depiction of pond hydroperiod would require explicit modeling of groundwater discharge into and out of each pond, soil moisture accounting to calculate runoff, and the permeability of the soils underlying each pond. None of the gui-based models investigated offered adequate functionality compared with our Python-based model, which offers unlimited flexibility. In addition, if the model is expanded to other ponds with different hydrologic processes, those can easily be added, if necessary.
2.2 Ponds classification
2.2.1 Regional geology
The Santa Clara Basin is situated in the northern part of the Central Coast Ranges, which extend southward from San Francisco for about 200 miles. The coast range landscape is characterized throughout its length by a series of rugged, sub-parallel, northwest-trending mountain ranges and intervening valleys. Located in one of the most seismically active areas in the world (Graf, date unknown), the Santa Clara Basin is nestled between the northwest-trending Santa Cruz Mountains and the San Andreas fault to the west and the Diablo Range and the Hayward and Calaveras faults to the east. Although the geology of the area is complex, the overall picture is straightforward. The Santa Clara Valley is a large trough that has been filled by sediment (gravel, sand, silt and clay) eroded from the adjacent mountain ranges. The structure of the area is controlled by faulting, the trend of which is predominantly in a northwesterly direction as is so commonly the case in California.
Balance Hydrologics, Inc.
214136 Pond Habitat Report 03-14-2018.docx 6
The geologic formations of the Santa Clara Basin are of two kinds—the hard rocks of the mountain borders and the unconsolidated materials of the valley fill (Clark, 1924). The ancient rocks exposed in the mountain ranges (which are collectively referred to as the Franciscan formation) originated as volcanic sea floor. Between 160 and 70 million years ago, these pieces of oceanic crust were subjected to intense shearing, pressure, and deformation when the tectonic plate that they were part of, the Pacific plate, was subducted (overridden) and stuffed underneath the North American plate (Iwamura, 1995). The mountains that border the Santa Clara valley are composed of many different types of rocks, but the region is particularly well known for the occurrence of serpentine, a rock created almost exclusively in oceanic subduction zones where cold, wet pieces of seafloor are subjected to intense pressures and deformation at relatively low temperatures.
While the Pacific plate was being forced beneath the North American plate, sand, silt and clay were eroded off the growing North American continent and were transported westward, to the sea. These sediments were deposited in the ocean off of the western edge of the continent and were buried and hardened into sandstones, siltstones, and shales of the Great Valley Sequence, and area associated with the Franciscan formation exposed today in the mountain ranges. Mountain making processes (such as faulting) then raised up two strips of land that would later become the Santa Cruz Mountains and the Diablo Range, and dropped down the area in between them, creating a deep trough that would eventually become the Santa Clara Valley. The valley floor was originally below sea level, and the older rocks deposited in it include sandstones containing many marine fossils as well as cherts (derived from silica rich oozes) and marine shales. As the valley sediments accumulated, the floor of the valley emerged above sea level and also received deposits of ash and bedded volcanic flows from active volcanoes in the region. During a time period that lasted between approximately 2 million and 10,000 years ago, the valley filled with gravel, sand and silt that eroded from the mountains. These sediments were deposited by streams that transported the broken and weathered pieces of rock from the higher elevations to the valley floor (Iwamura, unpublished work). Many of these sediments were deposited at the mouths of the streams that transported them, and formed deposits called alluvial fans. An alluvial fan is a cone shaped deposit of stream sediment, which forms where a narrow canyon stream suddenly disgorges into a flat valley.
During the past 30,000 years, while the southern portion of the Santa Clara Valley has been shaped largely by rivers, the northern portion of the valley has had somewhat different influences. San Francisco Bay was formed in much the same way as the Santa

Balance Hydrologics, Inc.
214136 Pond Habitat Report 03-14-2018.docx 7
Clara Valley, when a large chunk of faulted crust dropped downward with respect to its neighbors. Repeatedly, the bay trough was flooded by global rises in sea level associated with the melting of glaciers. Sediment rich glacial meltwater traveled down the Sacramento River and deposited large quantities of silt and clay in the Bay, creating blue-gray deposits of bay mud that extend well into the northern portion of the Santa Clara Basin (Cooper Clark and Associates, date unknown). Today, the bay has retreated from its maximum extent of inundation, and significant areas of these deposits stand exposed as dry land. Many of the geologic processes that have shaped the Santa Clara Basin continue to alter the landscape, as gravels, sands, silts and clays are weathered from the mountain hillslopes and are transported downstream channels to the valley flat where they are deposited (Iwamura, 1995).
Earthquakes occur regularly along the San Andreas Fault Zone, part of the San Andreas Fault System. Since 1980, there have been over 1000 earthquakes of magnitude 2.5 or greater, and 24 earthquakes of at least magnitude 4.5 on the Richter scale along the Diablo Range between Calaveras Reservoir and Anderson Lake Reservoir1. Earthquakes can impact stream ponds by changing groundwater pathways and altering seeps and springs and can also generate punctuated contributions of sediment to stream channels and ponds.
Mediterranean climates are fire climates. Fires can generate large sediment and wood pulses that can dramatically alter pond geometry and hydrology.
Several sets of geologic maps were used for this study, including Wentworth and others (1999), Dibblee and Minch (2005), and Graymer and others (2006).
2.2.2 Genetic classification
Ponds of similar geology, soils, and topography often have similar annual hydrologic response and groundwater patterns. Monitoring ponds in similar isohyets2 with the same type may not be necessary if they have the hydrologic response to precipitation events. Parameters such as watershed size, pond stage-storage relationship, and spillway elevation may account for many of the differences between annual pond elevations. Ponds can be genetically classified via a desktop analysis using publicly available datasets. To save field monitoring time and effort, hydrologic data can be
1 https://earthquake.usgs.gov/earthquakes/search accessed in January 2018 2 Like a contour on a topographic map which described a line of equal elevation, an isohyet describes a line of equal rainfall, most commonly mean annual precipitation.

Balance Hydrologics, Inc.
214136 Pond Habitat Report 03-14-2018.docx 8
collected at a subset of each pond classification to calibrate the numerical model presented below. With the explosive availability of historical aerial imagery, final model validation and parameterization can be further calibrated, also discussed below. Historical aerial imagery beginning in 1939 was also used to understand the formation of the pond, particularly when considering anthropogenic versus natural processes (e.g., USDA, 1939).
Ponds were classified into one of nine types, described in Table 1 (adapted from Bauder et al., 2009). Not all classifications are present in the study area. As is the case with ponds in many urban areas, none of the 21 ponds would exist without anthropogenic intervention, which typically involved construction, stabilization, or supplementation of pond berms or spillways. The genetic classification here is not used to classify the processes of pond construction; otherwise all ponds would be anthropogenic. Instead, the classification is focused on the geologic, geomorphic, and soil processes that would either create a topographic low in an existing drainage channel, a seep or spring, or a combination of both, and where conditions were favorable for construction or enhancement of a pond feature. The classification may also serve to identify ponds which may have longer year-to-year hydroperiods due to persistence of saturated horizons beneath individual ponds.
The 21 ponds modeled for this report were grouped into only five of the nine classifications; no Pedogenic, Alluviated, Dune Dammed, or Bedrock (Tenaja) ponds were found (Table 2).
Within a classification, we observed considerable hydroperiod variability, depending on watershed size or pond construction. For example, both AQ-013 and AQ-03 are classified as Landslide Dammed ponds, but AQ-01 is wetted year-round in all but the driest years, and has a much larger contributing watershed area compared to AQ-03, which drains every year. We surmise that, while foundationally important, genetic typing must be considered along with watershed sized, berm construction and the state of repair of the berm.
The following is a discussion of the ponds that fall into each genetic classification group found among the ponds modeled for this study.
3 Ponds were labeled based on initials assigned to the park in which they are located: Almaden Quicksilver is AQ, Santa Teresa is ST, Calero is CA and Coyote Lake Harvey Bear Ranch is CHB. Ponds within each park are numbered in no particular order.

Balance Hydrologics, Inc.
214136 Pond Habitat Report 03-14-2018.docx 9
Tectogenic
Both sides of the Santa Clara Valley are within active fault zones, but the Calaveras and Coyote faults intersect within Coyote Harvey Bear Ranch County Park. In the case of several ponds, active faults bisect either the watershed, the pond, or both. Tectonism has created topographic depressions and sag ponds favorable for pond construction or enhancement by the ranchers to create stock watering ponds Three ponds are believed to be Tectogenic in nature, CHB-04, CHB-06, and CHB-08. All have modified or constructed berms and are bisected by an active fault. Groundwater discharge through an active fault zone can consistently supply a Tectogenic pond with water, extending the hydroperiod.
Landslide Head Scarp
Of the ponds in this study, the only Landslide Head Scarp ponds are found in Coyote Harvey Bear park on the east side of Santa Clara Valley. The combination of the underlying Tertiary volcanic basalt rock flows and the tectonically active fault zone has produced a number of landslides, some of which may have been initiated be existing groundwater pathways. Large-scale slumps or scarps can leave wide, flat areas at the head, often exposing active groundwater seeps, the location of which may have contributed to the initial failure. Even though landslide head scarps are formed as a result of geologically unstable events, compared with engineering timescales for design of habitat improvements, the timescale of potential landslides may be considerably larger and should not be a primary concern for management of pond habitats. However, if considerable berm reconstruction were proposed, or observations point to hillslope instability, a geotechnical assessment may be required to address potential concerns.
Three ponds are believed to be located at landslide head scarps, on the north end of Coyote Harvey Bear, CHB-01, CHB-02, and CHB-03. Only CHB-03 has a visible and active seep located just upslope of the pond. It is possible that CHB-02 or CHB-01 also have active seeps but are co-located with the pond and are therefore not visible. Because CHB-02 dries up most years, the presence of an active seep is less likely than for CHB-01.
CHB-03 is positioned on the top of a large Quaternary landslide deposit, which is bisected by the Coyote Creek Fault. The position of the fault relative to the landslide deposits suggest the initial landslide may have been initiated by fault activity. The fault, when mapped through the Quaternary landslide deposit, is very close to the pond location. Because the precise location of the fault may be obscured by the landslide

Balance Hydrologics, Inc.
214136 Pond Habitat Report 03-14-2018.docx 10
deposit, we may posit that the fault could be closer to the pond than originally mapped. Therefore, CHB-03 may be influenced by tectogenic processes. The classification of Landslide Head Scarp is still most applicable.
Mining or Quarry Depressions
Ponds created in Mining or Quarry Depressions are entirely anthropogenic in nature. The creation of AQ-01 and AQ-03 are believed to be associated with the operation of Providencia Mine. Historical imagery and current conditions of CA-02 suggests that rock was removed from this site in the mid-thirties, perhaps associated with the construction of Calero Reservoir. Geologic mapping shows a small outcropping of serpentinite co-located with the pond, which may have been the target of quarry activities.
Landslide Dammed
Landslides can enter stream channels and form in-channel dams. Landslide dams can be short-lived or persist for long periods of time. One pond, AQ-02, has a berm of loosely compacted clay with angular cobbles and gravel embedded, suggesting it is the only truly Landslide Dammed pond, with no clear berm alterations. The remote, forested location of AQ-02, corroborates this notion. Historical aerials suggest that mining activities upslope and adjacent to Mine Hill Road between 1980 and 1987 contributed to a large-scale landslide which has dammed the channel forming the pond. It is likely, given enough time, that the landslide deposit will be eroded, potentially within an engineering lifespan of 25-50 years, restoring the antecedent channel slope and geometry. Erosion of the pond berm was not inspected due to overgrown vegetation.
Instream
The remaining ponds (CA-04, CA-05, CA-06, CA-07, CA-08, CA-09, CA-10, CHB-05, CHB-07, ST-01, and ST-02) are all classified as Instream ponds and all have constructed berms. Historically, the location of stock ponds was likely chosen by ranchers because favorable geologic or geomorphic conditions had previously narrowed the channel, caused a localized flatter channel slope, or perhaps hosted seeps and springs.
2.3 Pond selection
We selected eight ponds to monitor from within each of the represented pond classifications, except for the Landslide Dammed classification which only had one pond within it. We did not monitor this pond (AQ-02) due to its’ difficult accessibility, and because the relatively large watershed suggests the pond is perennially filled.

Balance Hydrologics, Inc.
214136 Pond Habitat Report 03-14-2018.docx 11
Within each pond classification we selected ponds to monitor that were more easily accessible to allow for more efficient monitoring.
We did not monitor or model four of the ponds within the project area. Both CA-01 and CA-03 were restored within the past year, and are actively being managed per management plans accepted by the regulatory agencies. ST-03 was formerly a shallow stock pond that has been filled completely and has subsequently eroded through berm and to a lesser degree, the backfilled deposits, so that no water is stored within the relic pond. ST-04 was found through aerial analysis. However, upon visiting the site, we discovered ST-04 is a shallow seep wetland rather than a pond that retains water. This feature may warrant management and protection as a seep wetland resource, but is not evaluated as part of this project.
2.4 Pond monitoring
2.4.1 Stage-storage relationship development
Once all ponds to be monitored were identified, Balance surveyed each pond in November and December 2016 to develop a relationship between water level, pond storage, and pond area at each pond. We surveyed all ponds using an automatic level and maps. To minimize time spent surveying we surveyed key points that enabled us to define the basic bathymetry of each pond, including the spillway, berm, high-water marks, current water surface elevation, and a few transects through the pond. Since the auto level does not provide georeferenced point data, we marked the points on an aerial image. We established bench-marks at each pond, so surveys could be repeated and to relate water surface elevations during future site visits. We also collected water quality measurements, such as specific conductance and temperature, using a pre-calibrated handheld meter.
Contour lines were constructed on the aerial photograph based on the relative elevations collected during the survey, aerial imagery, site observations, and photographs. The interpolated contour lines were georeferenced and tied in the relative contour elevations to best available LiDAR data (SCVWD, 2006). We then digitized the contour lines and created a stage-storage relationship (depth-capacity curve).

Balance Hydrologics, Inc.
214136 Pond Habitat Report 03-14-2018.docx 12
2.4.2 Hydrologic gaging
At the eight ponds selected for monitoring, we installed an Insitu Aquatroll© logger in the pond, which measured water depth and specific conductance hourly. We also installed one shallow piezometers at each pond, except for CA-05 which had two shallow piezometers. Each piezometer was equipped with a Solinst Levelogger© and measured water depth hourly. We installed the equipment at the select ponds between March and May of 2017 to capture the dry-down of the water in the ponds. The equipment was removed from the ponds in October 2018. We conducted an additional one or two site visits to each pond during the period of monitoring. During the site visits we measured the water surface elevation relative to a benchmark set near each pond, downloaded the loggers, and measured the specific conductance. The water surface elevations and the specific conductance for each pond can be seen in Figures 6a-6h. The equipment installed in the pond at CHB-08 was vandalized and stolen twice; thus, we have reported the water elevations from the well at this site and manual water-surface elevations for CHB-08.
2.4.3 Pond vegetation mapping
During initial site visits we photographed the pond and key features and marked the approximate extent of wetland emergent vegetation (e.g., tule and cattail) on the aerial photo. To estimate the acreage of wetland vegetation at each pond, we digitized the areas that we marked during the field surveys. The measured emergent vegetation areas associated with each pond are presented in Table 3 and also presented alongside model results figures presented in Section 2.6.6.
2.5 Conditions in WY2017 relative to historical norms
Pond monitoring and field surveys were carried out during WY2017, which was considerably wetter than most historical years. WY2017 was certainly the wettest year in the calibration period, which begins in 2003. In some cases, seeps and springs were very active throughout the water year (e.g. CHB-03). As a result, the measured dry-down curves may not be representative of each year, particularly if seeps or springs are active under certain precipitation thresholds. However, compilation of the pond sizes measured on the aerial imagery provides additional data points for understanding the dry-down curves during dry and average years.

Balance Hydrologics, Inc.
214136 Pond Habitat Report 03-14-2018.docx 13
2.6 Pond modeling
2.6.1 Model framework
A numerically straightforward hydroperiod water balance (HWB) model was developed to evaluate the historical and projected water-surface elevation of each pond. The main purpose of the HWB model is to infer the dry-down timing across a range of hydrologic years and extend the model into the future using climate projections. To meet this primary objective, a monthly timestep is sufficient compared to a daily timestep, which required more data and more computation time. In addition, many climate projection datasets are available at the monthly timestep. For the model to be integrated seamlessly between historical and projected time periods, we recommend the use of the same timestep for both datasets. For some applications (e.g., pond-filling date), a daily timestep may be more applicable. The model can be run and calibrated at a daily timestep when necessary.
The model was constructed in Python, which is an interpreted high-level programming language with many general-purpose programming tools. Python was designed with code readability in mind, and uses a syntax requiring fewer lines of code compared to other programming languages. Open-source Python libraries are used for this model (e.g., numpy, pandas) to take advantage of data analysis tools which can easily manipulate numerical tables and time series dataset. Because of the flexibility Python provides, input files were created in excel or text editor. All Python packages used in this model are open source and free to use.
2.6.2 Model input data
The model was developed with applications to other ponds, vernal pools, or seasonal wetlands in mind, thus the model construction prioritized use of publicly available data.
The primary time-dependent input variables used in the model are air temperature, used to calculate evapotranspiration (ET), and total monthly precipitation. Historical air temperature and monthly precipitation are sourced from PRISM Climate Group (PRISM)4. PRISM historical data is available annually, monthly, or daily. Air temperature and precipitation is interpolated for each 4-km grid cell through a DEM-based interpolation between publicly available gaging datasets (e.g., sourced from California Irrigation Management Information System, US Geological Survey, California Department of Water Resources, etc.). The historical data was downloaded from the 4 http://prism.oregonstate.edu/ accessed on November 20th, 2017.

Balance Hydrologics, Inc.
214136 Pond Habitat Report 03-14-2018.docx 14
PRISM website on November 20th, 2017. Downloaded historical data begins in water year 19755 (WY1975). Because the ponds begin empty at the beginning of WY1975, results are presented beginning in water 1980 to allow 5 years of model spin-up period.
Soil data for contributing watershed is sourced from the National Resources Conservation Service (NRCS) Soil Survey Geographic Database (SSURGO). A depth-weighted water capacity is calculated across the soil profile thickness. If multiple soil types are located in a single watershed, the water capacity is spatially averaged in addition to depth-averaged.
2.6.3 Model calibration data
The eight monitored ponds are first calibrated using the hydrologic gaging data discussed in Section 2.4.2. This first model calibration step is used to understand the relative importance of each of the model parameters, including the type and timing of groundwater inputs and outputs.
Next, historical calibration data is collected using historical aerial imagery available in Google Earth® for all ponds. Google Earth® historical imagery is available back through 1998 for all ponds, with images sourced from various placed and satellites. Ponded area is measured in each aerial image where the wetted boundary is clearly defined and observable. When drawing pond boundaries, some judgment is used to define pond water surface through stands of cattail or tule, or with interpretations of floating aquatic vegetation or algae around the pond edges.
The stage-storage relationship is then used to convert pond area to a water surface elevation for use in the model calibration. The use of Google Earth® historical imagery is a powerful and cost-effective approach to calibrate and validate modeled long-term historical pond hydroperiod records. Images are available up to several times per year from 2002 to present, providing calibration data for a wide range of hydrologic years and sequences of years, such as extended droughts or very wet years.
2.6.4 Hydroperiod water balance (HWB) model
The HWB model is constructed using the above input and calibration data using ten model fit parameters; each parameter is underlined in the following model explanation.
5 A water year runs from October 1 of the preceding year to September 30, of the year for which it is named. For example, water year 1975 extends from October 1, 1974 to September 30, 1975.

Balance Hydrologics, Inc.
214136 Pond Habitat Report 03-14-2018.docx 15
The HWB model calculates the monthly balance of water volume tracking three hydrologic inputs and outputs modules (Figure 7). Model input modules are:
1. Direct Rainfall. Precipitation that falls directly on the pond surface plus an additional pond fringe area that directly contributes water to the pond. Pond fringe area was suggested to be approximately 2 to 4 times the pond surface area by Napolitano and Hecht (1991), who demonstrated that bank-exchange zones in surrounding hollows and swales contribute directly to runoff into the ponds. The area of the pond fringe is specified by the rainfall fringe area6 parameter and is represented as a percentage of total pond area. Fringe area depends largely on local topography and soil properties.
2. Watershed Runoff. A soil-moisture accounting routine calculates the monthly soil moisture. Maximum soil water capacity is calculated using soil properties of the contributing watershed. When precipitation exceeds available soil water capacity plus ET, the excess precipitation is routed into the pond as runoff. To adjust for local variation in the ability of a soil to store water, regional soil properties can be adjusted as needed to account for local soil properties based on field observations and expertise.
3. Groundwater Inputs. Groundwater input delivery mechanism and timing varies widely based on soil types, underlying geology, and pond construction and so three types of groundwater inputs have been implemented in the HWB model. They are listed below in increasing order of precipitation lag.
a. Pond Fringe Groundwater Input. Ponds are typically in local topographic depressions, so soil moisture from the surrounding area can infiltrate into the pond fringe area over short timescales. To model this, the direct rainfall (module 1, above) is lagged 1 month, and scaled by the model parameter, pond fringe groundwater. Modeling results tended to over-predict pond water surface elevations in years following very wet years, and under-predict pond water surface elevations following very dry years. To address this long-term effect of precipitation, a memory scaling factor was applied to this variable, represented by the ratio between the previous year’s annual precipitation and the historical average annual precipitation. For example, after WY2014, which was very dry, the memory scaling factor would reduce the pond fringe groundwater input during WY2015, because the dry
6 Underlined terms highlight the model parameter. Model parameters are discussed in Section 2.6.6 below.

Balance Hydrologics, Inc.
214136 Pond Habitat Report 03-14-2018.docx 16
conditions of WY2014 over-taxed shallow aquifers and needed to be re-filled prior to discharging into a pond.
b. Shallow Bedrock Fracture Groundwater Input. In watersheds with shallow, fractured bedrock, additional groundwater discharge can be sourced from these fractures with a medium-term time lag. For the pond models presented here, this shallow fracture time lag ranges from two to five months. Model results and calibration data have shown that this medium-term groundwater discharge is typically only active in wet years, when precipitation is above a certain shallow fracture threshold, which is specified in the model using the annual precipitation. In many cases, over the selected historical calibration window the shallow bedrock fracture groundwater input only occurs in WY2005, WY2010, WY2017, and perhaps WY2006 or WY2011. The amount of water that discharges into the pond is based on the total volume of water stored in the soil column below the root zone, which is assumed to be18-inched for this study. This volume of water is released more quickly when the soil column is saturated, and more slowly when the soil is drier. The total volume of water is calculated over a shallow fracture contributing watershed area, which can sometimes be different than the contributing surface watershed area, depending on topography and geology. Shallow bedrock fracture groundwater seeps are modeled so that either the seep is active and contributing water to the pond, or the seep has run dry. The threshold for when the seep is active varies by pond, with some seeps active every year and other active during only the wettest years.
c. Deep Fault Groundwater Input. Groundwater that flows through deeper bedrock fracture and faults is often slower than the shallow bedrock fracture groundwater discharges. The total amount of deep fault groundwater input is the deep fault percentage of precipitation over the contributing watershed. The deep fault time lag is parameterized at seven to eight months. The lag may not represent actual groundwater flow velocities through the inferred faults, but instead may represent the timescale at which groundwater elevations in the basin have adjusted for discharge into the pond to be numerically significant. Ultimately, deep fault groundwater input is best monitored rather than estimated based on soil properties, as water levels beneath the pools can (a) also originate from delayed drainage of landslide scarps, and (b) may be largest during the second or third year of above-average rainfall, based on our experience elsewhere. A very similar effect is

Balance Hydrologics, Inc.
214136 Pond Habitat Report 03-14-2018.docx 17
observed following a fire, especially where plant roots are shallow relative to the depth to water in the deeply-weathered zone (Hecht and Richmond, 2011). However, for this application, groundwater inputs characterized as sourced from a deep fault is inferred based on model calibration results, pond classification, and knowledge of the geology, soils, and topography.
Model output modules are:
1. Evapotranspiration (ET). ET is calculated using the Blaney-Criddle Equation, and is represented by
𝑬𝑬𝑬𝑬𝒐𝒐 = 𝒑𝒑 (𝒂𝒂 𝑬𝑬𝒎𝒎𝒎𝒎𝒂𝒂𝒎𝒎 + 𝒃𝒃)
where 𝐸𝐸𝐸𝐸𝑜𝑜 is the ET of the reference crop, irrigated turf, which published by CIMIS as a function of CIMIS zones (CIMIS 1999), 𝐸𝐸𝑚𝑚𝑚𝑚𝑚𝑚𝑚𝑚 is the mean monthly temperature, and 𝑝𝑝 is the mean daily percentage of annual daytime hours as a function of site latitude, and 𝑎𝑎 and 𝑏𝑏 are fitting parameters determined using least squares fit to the historical mean monthly air temperature.
While the Blaney-Criddle Equation is considered to be a more simplistic method for deriving ET, only using air temperature and zonal reference ET as input parameters. Our choice to implement a monthly model timestep reduces the likelihood that the more complex Penman-Monteith equation would improve model results. At a minimum, the Penman-Monteith formula requires daily timeseries data for solar radiation, wind speed, relative humidity, in addition to air temperature, which can vary significantly between pond locations and even with a single watershed.
Use of the Blaney-Criddle Equation assumes that 𝐸𝐸𝐸𝐸𝑜𝑜 for the reference crop, is approximately equal to ET from a standing body of water (Allen et al., 1998).
2. Spillway. In wet months, the pond elevation may exceed the pond spillway elevation. In these cases, water surface elevations are capped at the spillway elevation. Pond elevations may slightly exceed the spillway elevation during the time when the pond is spilling, but do not need to be explicitly modeled for the purposes of hydroperiod modeling and are therefore removed.
3. Groundwater Outputs. Groundwater discharge varies as a function of pond soil permeability and connectivity, and water use on the pond fringe and so two types of groundwater outputs have been used in the HWB mode. There are:
Balance Hydrologics, Inc.
214136 Pond Habitat Report 03-14-2018.docx 18
a. Soil Moisture or ET Groundwater Output. As seasonally increasing air temperatures places more demand on water supplies in the pond fringe, ponded water is lost through additional vegetation uptake or the wicking of dry soils not captured in the calculated ET from the water surface. Active grazing in the pond area may also increase this type of groundwater loss as cattle are likely to drink more water in summer months compared with cooler, wetter months. Water lost in this way is parameterized as a percent of ET to groundwater over the pond fringe area. The magnitude of this parameter set the shape of the draw-down curve in the summer months when ET is high; the higher the percentage loss, the steeper the draw-down curve.
b. Leaky Pond Groundwater Output. The soils underlying each pond have a range of soil permeability and connectivity. Clayey soils will prevent water from infiltrating into the shallow subsurface as quickly as loamy or sandy soils. Except for some Pedogenic ponds, we would expect most ponds to consistently loose some amount of water to the shallow subsurface, as a function of the volume of water in the pond. A fuller pond loses a larger volume of water over the larger wetted pond bottom area and with higher head pressure exerted on the underlying soils, compared with pond that is less full. Therefore, groundwater output is specified as a function of total pond volume as a percent pond volume to groundwater. Each month, the pond loses the specified volume of water to the shallow subsurface, which typically ranges from 2 to 40 percent. The higher the value, the “leakier” the pond, which may relate to the composition of the underlying soils, the proximity to faults and fractures, or the construction of the berm. The rate at which a pond loses water because it is “leaky” (i.e. the percent pond volume to groundwater is larger) defines the shape and slope of the draw-down curve.
2.6.5 Climate projection data
In the Santa Clara Valley, changes in climate are expected to manifest as an increase in air temperature of approximately 3°F by 2050 with the total annual precipitations projected to remain relatively consistent (CLIMsystems, 2017). To understand how long-term climatic shifts may affect pond hydroperiod, and the corresponding habitat, we have extended the historical HWB model to 2050 using climate projection data. Mean temperature and precipitation projections were derived from SimCLIM (CLIMsystems,
Balance Hydrologics, Inc.
214136 Pond Habitat Report 03-14-2018.docx 19
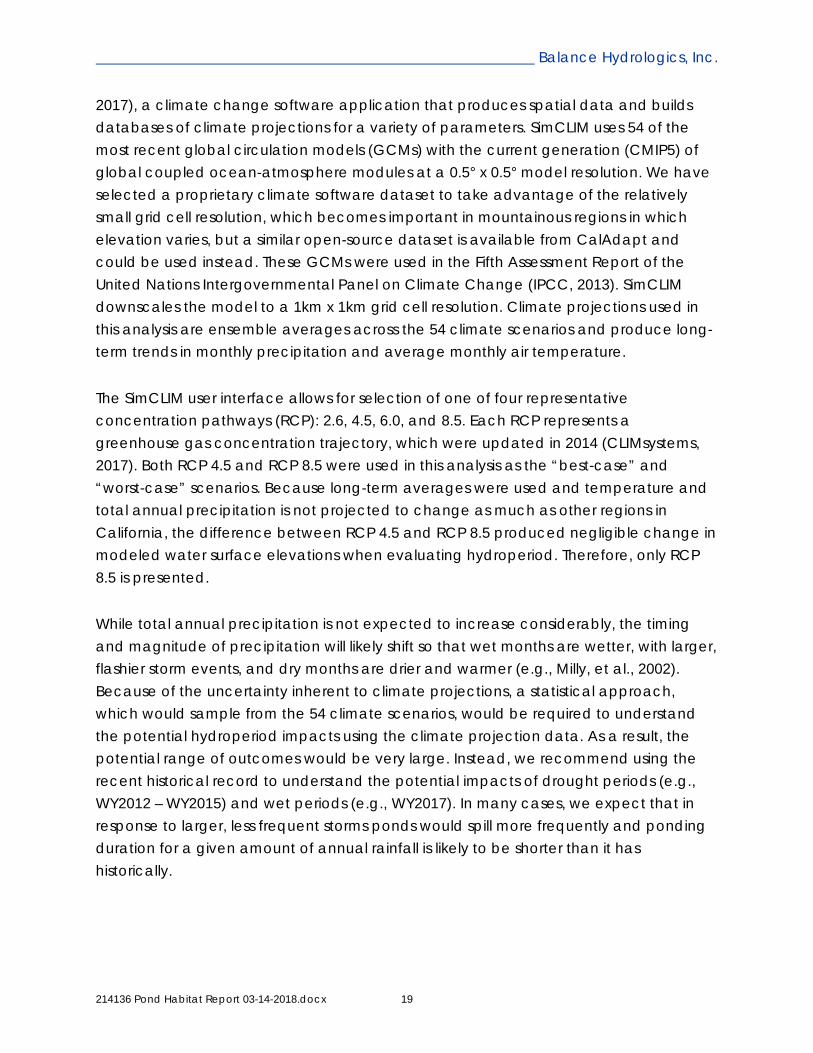
2017), a climate change software application that produces spatial data and builds databases of climate projections for a variety of parameters. SimCLIM uses 54 of the most recent global circulation models (GCMs) with the current generation (CMIP5) of global coupled ocean-atmosphere modules at a 0.5° x 0.5° model resolution. We have selected a proprietary climate software dataset to take advantage of the relatively small grid cell resolution, which becomes important in mountainous regions in which elevation varies, but a similar open-source dataset is available from CalAdapt and could be used instead. These GCMs were used in the Fifth Assessment Report of the United Nations Intergovernmental Panel on Climate Change (IPCC, 2013). SimCLIM downscales the model to a 1km x 1km grid cell resolution. Climate projections used in this analysis are ensemble averages across the 54 climate scenarios and produce long-term trends in monthly precipitation and average monthly air temperature.
The SimCLIM user interface allows for selection of one of four representative concentration pathways (RCP): 2.6, 4.5, 6.0, and 8.5. Each RCP represents a greenhouse gas concentration trajectory, which were updated in 2014 (CLIMsystems, 2017). Both RCP 4.5 and RCP 8.5 were used in this analysis as the “best-case” and “worst-case” scenarios. Because long-term averages were used and temperature and total annual precipitation is not projected to change as much as other regions in California, the difference between RCP 4.5 and RCP 8.5 produced negligible change in modeled water surface elevations when evaluating hydroperiod. Therefore, only RCP 8.5 is presented.
While total annual precipitation is not expected to increase considerably, the timing and magnitude of precipitation will likely shift so that wet months are wetter, with larger, flashier storm events, and dry months are drier and warmer (e.g., Milly, et al., 2002). Because of the uncertainty inherent to climate projections, a statistical approach, which would sample from the 54 climate scenarios, would be required to understand the potential hydroperiod impacts using the climate projection data. As a result, the potential range of outcomes would be very large. Instead, we recommend using the recent historical record to understand the potential impacts of drought periods (e.g., WY2012 – WY2015) and wet periods (e.g., WY2017). In many cases, we expect that in response to larger, less frequent storms ponds would spill more frequently and ponding duration for a given amount of annual rainfall is likely to be shorter than it has historically.

Balance Hydrologics, Inc.
214136 Pond Habitat Report 03-14-2018.docx 20
2.6.6 Model results
Model results are presented in Figures 8a – 8u and include both two primary plots. The first is a timeseries plotted from WY2000 to WY2020 and includes the monthly modeled pond water surface elevation for the historical period (blue) and using long-term average projection of climate change (green). Monthly precipitation is plotted using the right y-axis. Calibration data collected by Balance (orange dots or lines) and paired with calibration data collected using aerial imagery described in Section 2.6.3, above (blue dots). It should be noted that HWB modeled at the monthly timestep (see Section 2.6.1) does not represent the daily variability associated with individual storm events and instead represents the monthly averages in water-surface elevations associated with monthly-averaged air temperatures and total precipitation.
The gridded plots in the bottom corner of each figure presents a visual representation of the hydroperiod of each pond over historical (blue) and projected (green) time periods for each water beginning in October. The darker color represents months when the pond is full, the lighter shading depicts months when the pond is wetted, but not full, and months with no shading indicate when the pond is empty. Model input parameters are summarized in Table 4, with more detailed model parameters in Appendix A.
A table is included in each of the Figures 8a – 8u which summarizes general watershed characteristics including size, geology, soil types, land cover, pond classification, and fault present, if any. The emergent vegetation acreage from Table 3 is repeated here. The expected hydroperiod from an average hydrologic year and grazing observed by the field staff are also included in the table.
Of the ponds in this study, all Tectogenic ponds have year-round hydroperiods in the majority of the modeled years. We infer this to be largely due to groundwater influxes. Conversely, Landslide Head Scarp ponds in this study drain quickly, inferred to be very leaky, with hydroperiods extending to between June and October most modeled years. The remaining pond types have variable hydroperiods, dependent upon watershed size, berm construction or pond leakiness, and local groundwater inputs. The larger watershed sizes and active groundwater inputs tend to prolong hydroperiod, while more permeable materials in the berm or pond bottom tend to shorten hydroperiod. Our results generally follow these trends.
Model projections using long-term average climate change projection data through 2050 do not yield considerable change for most of the ponds in this study. As discussed

Balance Hydrologics, Inc.
214136 Pond Habitat Report 03-14-2018.docx 21
in Section 2.6.5, total annual precipitation is not expected in change significantly through 2050. This is illustrated by projected hydroperiods that are consistent with historical average hydroperiod in most ponds. There are a few exceptions: CA-04, CA-05, CHB-01, and ST-01. Based on interpretations of the modeling results, we surmise that CHB-01 is primarily affected by increased air temperature and increasing ET. It is possible that CA-04, CA-05, and ST-01 are filled during high-intensity floods, which the climate change projection data does not capture, and so may be marginally under-predicting pond water-surface elevations, which may have a cumulative effect if the pond is not filled to the spillway each projected year. As discussed above, this can be explicitly modeled in future iterations if deemed necessary for accurate habitat alternative design.
In the next sub-sections, key hydrologic processes and findings are summarized for each pond classification group (see Section 2.2).
2.6.6.1 Tectogenic
Model results for Tectogenic ponds show considerable groundwater inputs from deep fault pathways, which act to keep the pond wetted for longer into the dry season. Each of the Tectogenic ponds in this study (CHB-04, CHB-06, CHB-08) have a year-round hydroperiod. Without this additional fault groundwater inputs, the ponds would likely dry up each summer. The amount of groundwater discharge into the pond is dependent upon the precipitation from the preceding wet season, and typically peaks seven to eight months after the peak of the wet season. Because the ponds have high percentage of pond volume lost to groundwater (i.e. “leaky”) the draw-down curves fall off sharply after water supplies are diminished. CHB-06 and CHB-08 also have additional groundwater inputs from shorter-term shallow bedrock fractures or other shallow groundwater pathways. These groundwater inputs are active even in dry years, peaking two months after the peak soil moisture in the watershed, and act to keep the pond full for a few months into the dry season. Interestingly, Tectogenic ponds have the largest contributing pond fringe area compared to the other pond classifications, which produces a larger-magnitude response to rainfall events. This response may be attributed to both the deep-set position of the pond relative to the surrounding topography.
2.6.6.2 Landslide head scarp
In this study, Landslide Head Scarp ponds are found only in Coyote Harvey Bear Ranch County Park, likely due to the more easily weathered underlying meta-volcanic
Balance Hydrologics, Inc.
214136 Pond Habitat Report 03-14-2018.docx 22
geology and the tectonic activity. These ponds (CHB-01, CHB-02, and CHB-03) are all located in the north area of the park, and tend to have additional groundwater loses as a function of increased ET or air temperature. However, losses may not all be attributed to groundwater; these ponds are all in heavily grazed areas, possibly compounding the losses from increasing air temperatures as cattle likely drink more water from the ponds. Two of the three ponds appear to have groundwater inputs from shallow bedrock fracture pathways.
Because this study does not include any Landslide Head Scarp ponds in other geologic settings, our inferences about this pond classification may be a function of the geologic setting, rather than all Landslide Head Scarp ponds.
CHB-03, is classified as a Landslide Head Scarp pond, but classification revealed possible tectogenic processes (see Section 2.2). It is therefore unsurprising that CHB-03 is the only pond other than the Tectogenic ponds to have groundwater inputs possibly sourced from deeper fault groundwater pathways. CHB-03 also has additional groundwater inputs from the seep upslope from the pond that is quite active in very wet years. For example, the seep was still actively discharging water in the pond on October 18, 2017 after a very wet year. Interestingly, CHB-03 drains very quickly once the groundwater inputs stop discharging into the pond, suggesting the pond is somewhat leaky. None of the Landslide Head Scarp ponds in this study have year-round hydroperiod despite evidence of seep inflows.
2.6.6.3 Landslide dammed
While many of the Instream ponds have been narrowed by landslide deposits, the only pond that is truly Landslide Dammed is AQ-02. The berm is composed of soils with embedded angular cobble and gravel, and does not appear to be anthropogenically altered. The initiation of the landslide is discussed in Section 2.2. Unsurprisingly, AQ-02 has no groundwater inputs and fills each year largely from runoff and direct rainfall; AQ-02 has the largest watershed of any pond in this study. The chaotic deposition of landslides typically produces a deposit that is loosely packed and with high permeability. It is therefore unsurprising that the berm appears to be leaky, with 15 percent of the pond volume lost each month.
Because the berm does not appear to be modified in anyway, it is possible that natural processes would eventually erode the berm removing the pond, if no additional action is taken.

Balance Hydrologics, Inc.
214136 Pond Habitat Report 03-14-2018.docx 23
2.6.6.4 Mining or quarry depressions
Based on aerial imagery, three ponds (AQ-01, AQ-03, and CA-02) all appear to have been formed via mining or quarry activities. Therefore, soils under each pond are rather thin and moderately leaky. Only AQ-01 has groundwater inputs in moderately wet years, and as a result is the only Mining or Quarry Depression pond to hold water year-round.
2.6.6.5 Instream
Instream ponds make up most of the ponds in the parks on the west side of the Santa Clara Valley (Santa Teresa Park, Almaden Quicksilver Park, and Calero County Park) and are all anthropogenic in nature. As a result, hydrologic processes and hydroperiod is largely dependent upon the contributing watershed size and leakiness of the constructed berm. Four of these ponds (CA-05, CA-06, CA-07, and CA-08) are wetted year-round in all but the driest years. Three of ponds (CA-04, CA-05, and ST-01) were likely constructed where active springs support pond hydrology. CA-04 is a very small pond, with only 1.2 feet deep when full. Although the pond appears to have been shallowly constructed, some berm erosion has decreased the pond capacity.
Two ponds in Coyote Harvey Bear Ranch County Park have constructed berms in existing channels. Both ponds (or berms) are moderately leaky. The berm in CHB-05 appears to be actively eroding during wet periods, and previous erosion has incised a channel downstream of the berm, which is slowly advancing upstream. Without additional repair, the berm may be breached relatively soon.
CA-09 and CA-10 have no groundwater inputs, and the pond fills entirely from direct rainfall into the pond and fringe area, and runoff from the small watersheds. As a result, the ponds fill and drain quickly. ST-02 has a similar hydrologic response, but groundwater inflow from the pond fringe area keeps the pond full for one additional month after rainfall ceases for the season.

Balance Hydrologics, Inc.
214136 Pond Habitat Report 03-14-2018.docx 24
3. HABITAT IMPLICATIONS AND NEXT STEPS
3.1 Habitat implications
CRF require hydroperiod that includes time for breeding and metamorphosis, through July to September (Cook, 1997) and with relatively cool water temperatures. The non-native Bullfrog (Rana catesbeiana) requires ponded water year-round (D’Amore et al., 2010) and are known to prey on, or compete with the CRF. Even though CRF can and will breed and survive in a perennially wet pond, a pond that dries up most years in August or September is ideal for the optimization of CRF habitat, while simultaneously discouraging bullfrog breeding. Few ponds in this study (CHB-01, CA-04, CA-09) currently meet the optimum CRF hydroperiod requirements. CRF also prefer appropriate aquatic vegetation, which serves as an anchor for egg attachment, as well as cover for adult frogs to use for predation refuge and hunting habitat (Peterson and others, 2017). CRF use deeper portions of ponds as additional cover and refuge, which may preclude ponds like CA-04 for CRF habitat without considerable geometric reconfiguration. Of the ponds with appropriate hydroperiod, none had aquatic vegetation.
Introduction of the non-native Barred Tiger Salamander (BTS) into habitat areas of native California Tiger Salamander (nCTS) has produced a viable and often more resilient hybridization of the California Tiger Salamander (hCTS). The CTS lifecycle is dependent upon the presence of ponds or vernal pools, where breeding and larvae development take place. Metamorphs leave the ponds burrows underground where they spend most of their adult lives. Eggs are deposited on aquatic vegetation, floating sticks, or other debris. Even though nCTS is not a SCVHCP Covered Species, slowing or preventing the spread of hCTS populations is a goal of the SCVHCP. The effect of hydroperiod on both native and hybridized CTS is still an open area of research, initial studies have inferred that nCTS reproduce successfully with short hydroperiods of around three to six months, where hCTS favor perennially wetted ponds (U.S Fish and Wildlife, 2017). As a result, minimizing the number of ponds which are perennially wetted is likely to have the desired impacts on both hCTS and bullfrog populations. Notably, CTS prefer turbid ponds, which are hypothesized to provide better cover from predation and limit emergent vegetation (Robins and Vollmar, 2002). Cattle are a major source of pond turbidity, thus cattle management and other factors that may impact turbidity should be considered in future work.
Tri-colored blackbird nest in perennial stands of emergent vegetation such as cattail, tule, or willow, which all thrive in perennially wetted environments. Several ponds in this

Balance Hydrologics, Inc.
214136 Pond Habitat Report 03-14-2018.docx 25
study (CA-08, CA-07, CA-06, CA-05, CHB-08, AQ-02, AQ-01) have emergent vegetation stands surround the pond and are wetted year-round.
The Western Pond Turtle (WPT) uses a combination of aquatic and terrestrial habitat throughout its lifecycle; breeding, hunting, and foraging are largely carried out in aquatic habitat, but egg nests are created on land, typically in sand-and-gravel deltaic areas in arms upstream of the berm (Peterson and others, 2017). As a result, both environments may need to be considered when enhancing ponds of WPT habitat. Pond hydroperiod can be widely variable for successful WPT breeding, which takes place in late spring to mid-summer. However, Bullfrog habitat should be minimized as they often prey on turtle hatchlings, and so a year-round hydroperiod is not ideal. WPT also requires aquatic vegetation and logs, boulders, or accessible banks for basking. A successful WPT habitat would likely not include cattle, which could easily trample turtle nests.
The table presented on Figures 8a – 8u is a summary of key watershed and pond characteristics. This table includes covered and non-covered species of interest that may benefit from the current pond configuration and hydroperiod. These are assigned using the following rules which may require further refinement during future work:
• Hydroperiods lasting at least through August in most modeled years supports CRF
• Hydroperiods lasting at least through April in most modeled years support nCTS
• Hydroperiods lasting at least through June in most modeled years support WPT
• Year-round hydroperiod supports bullfrog and hCTS
Even though CRF, nCTS, and WPT do better in environments without bullfrog and hCTS, a year-round hydroperiod is hydrologically suitable and can potentially be managed as part of future restoration and enhancement plans, either with the installation of drainage infrastructure, or an appropriate pumping plan. Thus, those species are included in the tables contained in Figures 8a – 8u. Tri-colored blackbird habitat is dependent upon the coverage of emergent vegetation which is in turn dependent upon pond hydroperiod. However, the extent of the emergent vegetation may be too small to support tri-colored blackbird breeding and nesting (Edmund Sullivan, pers. comm., 2018).

Balance Hydrologics, Inc.
214136 Pond Habitat Report 03-14-2018.docx 26
While the focus of this report is on the effects of climate change on pond hydroperiod, changes in air temperature and precipitation may have other effects on pond habitat suitability, which are not explicitly addressed here. First, increased air temperatures expected over the Santa Clara Valley will likely affect pond temperature, possibly heating pond waters above the threshold for CRF breeding and metamorphosis. Increased pond temperatures may also increase algal blooms and aquatic weed colonization, which may introduce additional cover, but may also adversely affect water quality (e.g. dissolved oxygen). Second, the shift to higher-magnitude and less frequent rainfall events may result in ponds that fill and dry up multiple times each year, which may interrupt the breeding and rearing phases of both BRF and WPT.
The development of a HWB model for each pond allows the exploration of pond restoration alternatives, and in selecting the appropriate hydroperiod for the target species. During enhancement planning and design, the stakeholder team may favor design alternatives that do not require active management such as pond-bottom drains or other management draw-down infrastructure. If this is the case, we recommend using the HWB model to evaluate habitat improvements:
• Spillway modifications. Raising or lower the spillway changes the total volume each pond can accommodate. Ponds with year-round hydroperiods may reach target seasonal hydroperiod if the spillway is lowered and less runoff is captured each year. If water supply is adequate, raising the spillway may extend the hydroperiod. The model can easily simulate many different spillway elevations for to explore a range of possible hydroperiods. In several cases, berm reinforcement may be desired for pond resilience separate from a spillway elevation change.
• Pond geometry modifications. Like spillway elevation, the stage-storage relationship also dictates the pond capacity. In some cases, altering the hydroperiod to the desired length could include re-grading the pond geometry (e.g. deepen or widen the pond). This may have the added benefit of create a variety of pond depths which may suit different species throughout their lifecycle.
• Clay-lining pond bottom. Ponds with year-round hydroperiod may have significant groundwater inputs and outputs. Lining a pond with an impermeable clay layer will likely cut-off all groundwater inputs and outputs, significantly altering the pond hydroperiod. Because of the somewhat inter-connected hydrologic response of groundwater inputs and outputs in each pond, modeling

Balance Hydrologics, Inc.
214136 Pond Habitat Report 03-14-2018.docx 27
the impermeable clay layer in each pond or pond type is recommended to understand the potential effects.
• Engineering infrastructure. As an actively managed alternative, a pond bottom-drain or other water-surface management infrastructure can be used to manually drain the pond at the appropriate month for the target species. In some situations, the water supplies in a pond with an existing year-round hydroperiod may be held over year-to-year and completely draining the pond each year may not maintain sufficient water supply to achieve the desired maximum water-surface elevation. Because the HWB model is custom-built, engineered water-surface elevations management programs can easily be incorporated into the existing model to understand year-over-year water supplies.
3.2 Successes and shortcomings
In this project, we have developed a novel numerical approach to addressing pond hydroperiod modeling. Throughout this process, several lessons have been learned both as project successes and project shortcomings. A summary of these successes and shortcomings are listed here.
Successes:
- Typically, model calibration is collected over one or two water years, limiting the range of processes observed to the hydrologic regime (wet, dry, etc.) to observed years. The use of Google Earth ® historical imagery for collecting pond water surface elevation calibration data allows models to be developed for areas where extensive and expensive field monitoring campaigns were not previously underway. Once a stage-storage relationship is developed for each pond, this calibration data dating back to around 2002 is available inexpensively, both in terms of time and software costs – provided, of course, that the pond geometry has not been considerably altered in that time frame.
- The HWB model was developed with Python, an open-source programming language. As a result, the model has ultimate flexibility and can be adapted to any number of geologic or hydrologic setting. New hydrologic inputs and outputs can be added to suit the environment at any time.
- The HWM model prioritizes the use of publicly available dataset, such as soil parameters, reference evapotranspiration, and historical climate data. As a

Balance Hydrologics, Inc.
214136 Pond Habitat Report 03-14-2018.docx 28
result, development of a HWB hydroperiod for a model requires a relatively small start-up cost, with the largest effort involving development of a stage-storage relationship and genetic classification of the pond.
Shortcomings:
- The auto level allowed us to quickly and efficiently survey the ponds in the field, with the remaining analysis being completed in the office to finalize the stage-storage relationships. We recommend taking additional time in the field and using a total station for these surveys, which would provide georeferenced points and minimize the amount of office time required to develop the stage-storage relationships.
- Dry-down, but not wet-up data was collected for the eight monitored ponds. While dry-down data is critical for understanding dry-down curves and corresponding hydroperiod, wet-up data may have been useful for further model parameterization. However, collecting wet-up data would have increased the project cost and may not have improved all models in proportion with the cost and so was de-prioritized.
- Because the model is numerically straightforward, model parameterization does not explicitly quantify groundwater inputs and outputs, which is largely unknown in ponds and vernal pools. As a result, an individual model parameter may, in reality, represent a number of co-occurring hydrologic factors. Because model parameters are largely percentages of other easily quantified values (e.g., ET, precipitation), development of a pond model requires trial and error, parameter fine-tuning, and understanding of the underlying model principles.
3.3 Next steps
3.3.1 Coyote Valley pond habitat evaluation, prioritization, and enhancement
This study is envisioned as the first step in developing a management plan for pond habitat resources in the Coyote Valley. We anticipate the GCRCD and SCVHA will pursue funding to:
• Evaluate the connectivity of pond and other aquatic resources in the Coyote Valley, and develop potential habitat alternatives to support habitat corridors;

Balance Hydrologics, Inc.
214136 Pond Habitat Report 03-14-2018.docx 29
• further evaluate the hydroperiod data to evaluate feasibility of habitat enhancement and restoration alternatives for priority ponds. This is expected to include modelled evaluations of design alternatives; and
• identify areas within habitat corridors that merit acquisition, preservation or enhancement.
3.3.2 Applying the pond hydroperiod model in other Counties and Districts
The model and calibration framework presented herein shows great promise for evaluating pond hydroperiod in other regional ponds and depressions in Coyote Valley, the greater Bay Area and other regions which experience a Mediterranean climate. The GCRCD Team is pleased to present the new aerial photo calibration approach which is flexible, fast and highly transferable, and we see great potential for this model to open up hydroperiod evaluations of other pond resources due to cost-savings. The GCRCD Team looks forward to working with land managers, habitat agencies, and others to train end-users on using the model through workshops, extended documentation, or other suitable knowledge transfer processes.
Balance Hydrologics, Inc.
214136 Pond Habitat Report 03-14-2018.docx 30
4. REFERENCES
Allen, R.G., Pereira, L.S., Raes, D. and Smith, M., (1998). “Crop Evapotranspiration: Guidelines for Computing Crop Water Requirements.” Irrig. and Drain. Paper No. 56, United Nations Food and Agriculture Organization, Rome, Italy, 300 pp.
Bauder, E. T., Bohonak, A. J., Hecht, B., Simovich, M. A., Shaw, D., Jenkins, D. G., and Rains, M., 2009, A Draft of Regional Guidebook for Applying the Hydrogeomorphic Approach to Assessing Wetland Functions of Vernal Pool Depressional Wetlands in Southern California, 117p.
California Irrigation Management Information Systems (CIMIS), 1999, reference evaporation map
Clark, W.O., 1924. Ground water in Santa Clara Valley, California (Vol. 519). US Government Printing Office.
Cook, D., 1997, Biology of the California Red-legged Frog: A synopsis, 1997 transactions of the western section of the wildlife society 33, p 79-82.
D’Amore, A., Hemingway, V., Wasson, K., 2010, Do a threatened native amphibian and its invasive congener differ in response to human alteration of the landscape? 2010, Biol Invasions, p 145-154.
Dibblee, T. W., and Minch, J. A., 2005, Geologic map of the Gilroy quadrangle, Santa Clara County, California, U.G. Dibblee Geological Foundation, Dibblee Foundation Map DF-169.
Dibblee, T. W., and Minch, J. A., 2005, Geologic map of the Santa Teresa Hills quadrangle, Santa Clara County, California, U.G. Dibblee Geological Foundation, Dibblee Foundation Map DF-169.
Graymer, R. W., Moring B. C., Saucedo, C. M., Wentworth, C. M., Brabb, E. E., Knudsen, K. L., Geologic map of the San Francisco Bay region, 2006, Scientific Investigations Map 2918, published by US Geological Survey.
Hecht, B., and Napolitano, M.B., 1991, hydrologic processes affecting vernal pools at Ellwood Beach, California, and suggested approaches to mitigation, Balance Hydrologics Inc. consulting report prepared for LSA Associates, 67p.
Hecht, B. and Richmond, S. Post-fire flow premium: Increased summer flows promoting salmonid survival following large wildfires in Monterey County. Salmonid Restoration Federation 45th annual conference, San Luis Obispo, California. 24 p.
Hecht, B., and Ruttenberg, D., 2018, Bear Creek Preserve Ponds Assessment and Management Plan, Santa Clara County, CA, 91 p. plus 6 appendices. Balance Hydrologics consulting report prepared for Midpeninsula Regional Open Space District, Feb. 20. 2018.
Iwamura, T., 1995, Hydrogeology of the Santa Clara and Coyote Valleys groundwater basins, in Recent geologic studies in the San Francisco Bay area: Society for Sediment Geology.
Peterson, T., Meisel, A., Allaback, M., and Laabs, D., 2017, Pond species management plan, Appendix B, 37 p., in Hecht and others, 2018, Bear Creek Preserve Ponds Assessment and Management Plan, Santa Clara County, California.

Balance Hydrologics, Inc.
214136 Pond Habitat Report 03-14-2018.docx 31
Robins, J.D. and Vollmar, J.E., 2002. Livestock grazing and vernal pools. Wildlife and Rare Plant Ecology of Eastern Merced County’s Vernal Pool Grasslands. (Ed. J.E. Vollmar.) pp. 402-430.
Santa Clara Water District LiDAR: Santa Clara County, California, 2006, Sourced from National Oceanic and Atmospheric Administration Data Access Viewer, LiDAR elevation data available on the World Wide Web, accessed April 1, 2017, at URL https://coast.noaa.gov/dataviewer/#/
Skidds D. E., and Golet, F. C., 2005, Estimating hydroperiod suitability for breeding amphibians in southern Rhode Island seasonal forest ponds.
Wentworth, C.M., Blake, M.C., McLaughlin, R.J., and Graymer, R.W., 1999, Preliminary geologic map of the San Jose 30 X 60-minute quadrangle, California: a digital database. U.S. Geological Survey, Open-File Report OF-98-795
U. S. Department of Agriculture, 1939, NW Portion of Santa Clara County, CA with overlap into Santa Cruz, San Mateo and Alameda counties, flown by Fairchild Aerial Surveys, Inc.
U.S. Fish and Wildlife Service. 2017. Recovery Plan for the Central California Distinct Population Segment of the California Tiger Salamander (Ambystoma californiense). U.S. Fish and Wildlife Service, Pacific Southwest Region, Sacramento, California. v + 69pp.

TABLES

Genetic Classification Description
PedogenicVernal pools formed on old or very old terraces or deeply weathered crystalline bedrock by pedogenic processes are the most numerous and widespread. Several types of pedogenic pools are known from Southern California. In all cases, they have developed over restrictive layers created as the soils matured and which perch winter water near the soil surface.
Tectogenic
Tectonic activity has directly or indirectly created local sediment-filled depressions, which sustain vernal pools along active faults. The restrictive, or “perching” horizon supporting seasonal ponding is formed from lake sediments or ponded clays deposited in the tectonogenic depression, commonly over periods of thousands or tens of thousands of years. These pools tend to be among the largest and deepest, and are supported watersheds of (typically) 20 to 200 acres; they are distinguished by drawing much of their inflow from the steeper slopes with thinner soils near the edged of their watersheds rather than those surrounding the basin.
Landslide Head Scarp
A number of vernal pools have developed in depressions within or at the heads of landslides. As with the tectonogenic pools, inflow may originate from steeper areas at the edges of the contributing watershed, and are generally most vulnerable to changes and disturbance at the edges of their contributing areas.
Landslide Dammed
Existing drainage basins in steep to moderate landscapes are vulnerable to both large- and small-scale landslides which can dam existing channels creating a vernal pool. Inflows typically follow the existing overland pathways into channels. With no anthropogenic interference, new channels are often incised into landslide dams until normal channel processes are restored.
Mining or Quarry Depressions
Vernal pools will form inside anthropogenically created topographic lows if hydrologic conditions are favorable. Common anthropogenic depressions are quarries or surface mines.
Alluviated Alluviated pools are formed when floodplain or natural-levee deposits left by floods on nearby streams or alluvial fans/aprons dam their outlets.
Dune DammedDunes advancing over old terraces or floodplain can obstruct drainage and form dune-dammed pools. Some vernal pools are sharply elongated in the direction of the prevailing wind, presumably by waves. In many cases, the obstructing dunes or the eroding winds were formed under mid-Holocene or Pleistocene conditions, with soil-forming processes augmenting the pool-forming effects.
Bedrock (Tenaja) A few pools are not sedimentary –for example the tenajas of Riverside County or the tanques of the Santa Rosa Plateau, but these seem to be relatively rare both in Southern California and in the Santa Clara Valley.
InstreamStock ponds are commonly constructed in stream channels or headwater swales. The location of stock ponds in stream channels were often selected by ranchers where conditions were favorable either due to the location of seeps, or where canyon walls were close together or the stream long profile was gentler due to geology, faulting, or debris flows and landslides.
© 2018 Balance Hydrolo
Table 1. Genetic Classification Descriptions, adapted from Bauder et al., 2009.
P:\2014\214136 GCRCD\214136 redrope\Tables\Pond_Typing.xlsx

Genetic Classification Pond
Pedogenic None
Tectogenic CHB-04, CHB-06, CHB-08
Landslide Head Scarp CHB-01, CHB-02, CHB-03
Landslide Dammed AQ-02
Mining or Quarry Depressions AQ-01, AQ-03, CA-02
Alluviated None
Dune Dammed None
Bedrock (Tenaja) None
Instream CA-04, CA-05, CA-06, CA-07, CA-08, CA-09, CA-10, CHB-05, CHB-07, ST-01, ST-02
© 2018 Balance Hydrologics
Table 2. Classification of the 21 study ponds. See Table 1 for descriptions of each genetic classification type.
P:\2014\214136 GCRCD\214136 redrope\Tables\Pond_Typing.xlsx

Pond Watershed Size MAP Range Elevation Range Emergent Vegetation
(acres) min/max MAP (inches)
min/max elevation (feet) (acres)
AQ-01 41.7 29/33 921/1374 0.11AQ-02 174.26 31/36 1062/1697 0.02AQ-03 8.73 29/29 1185/1402 0.00
CHB-01 15.38 21/21 1325/1488 0.00CHB-02 44.83 20/21 974/1337 0.00CHB-03 22.57 20/20 808/1025 0.00CHB-04 15.21 22/23 884/1117 0.00CHB-05 25.84 22/23 815/1195 0.00CHB-06 66.65 22/22 866/1336 0.00CHB-07 95.03 21/22 906/1274 0.00CHB-08 128.37 21/22 824/1310 0.10CA-02 4.95 23/23 460/558 0.00CA-04 32.02 24/26 694/936 0.00CA-05 20.82 21/21 520/637 0.46CA-06 41.73 23/24 604/990 0.04CA-07 32.72 22/25 555/850 0.15CA-08 151.21 27/31 830/1501 0.20CA-09 9.5 28/28 1181/1281 0.00CA-10 12.26 26/26 844/940 0.00ST-01 38.22 22/22 718/1009 0.00ST-02 21.99 22/23 790/1110 0.00
© 2018 Balance Hydrologics, Inc
Table 3. Key pond characteristics. Characteristics repeated on Figures 8a - 8u.
P:\2014\214136 GCRCD\214136 redrope\Tables\Table 3 Pond Characteristics.xlsx

Rainfall Fringe Area
Pond Fringe Groundwater
Input
Shallow Fracture Groundwater Input
ThresholdDeep Fault
Groundwater Input
Percent of ET to
Groundwater
Percent Pond Volume to
Groundwater
% pond area% direct rainfall
% of ET % pond volume
CHB-04 4 0.9 None Yes 30% 30%CHB-06 6 0.5 Always Active Yes 30% 40%CHB-08 6 0.9 Always Active Yes 20% 15%
CHB-01 4 0.3 Average Years No 30% 8%CHB-02 2 0.3 None No 50% 6%CHB-03 4 0.7 Wet Years Yes 90% 20%
AQ-02 1.5 0 None No 0% 15%
AQ-01 3 0.9 Moderate Years No 15% 10%AQ-03 2 0 None No 30% 40%CA-02 2 0 None No 60% 20%
CA-04 1.5 0 Dry Years No 90% 20%CA-05 1.5 0.5 Dry Years No 15% 5%CA-06 4 1 None No 15% 2%CA-07 3 0.7 None No 10% 4%CA-08 3 0.7 None No 25% 5%CA-09 3 0 None No 50% 5%CA-10 2 0 None No 70% 2%CHB-05 2 0.9 None No 30% 10%CHB-07 2 0.7 None No 0% 18%ST-01 2.5 0 Wet Years No 25% 20%ST-02 2 0.3 None No 90% 20%
Tectogenic
Landslide Head Scarp
Landslide Dammed
Mining or Quarry Depressions
Instream
© 2018 Balance Hydrologics, Inc.
Table 4. Model results and parameter summary. All model parameters are presented in Appendix A.
P:\2014\214136 GCRCD\214136 redrope\Tables\Model Results.xlsx

FIGURES

W:\Projects\214136\location_figure
Figure 1. Pond Locations, Central Santa Clara County, California
Source: Santa Clara County Parks
$+
#*
!(
")
XY
")
!(
XY
!(!(
!(
kj$+
!(
!(
kj
!(
XY
!(
")
!(kjkj
!(
$+
AQ-03
CA-10
ST-04ST-03
ST-02
CA-05
ST-01
CA-03CA-04
CA-02
CA-01
CA-08
CA-06CA-07
CA-09
AQ-02
AQ-01
CHB-02
CHB-04CHB-05
CHB-08
CHB-07
CHB-03
CHB-06
CHB-01
Calero (Fig. 3)
Almaden Quicksilver (Fig. 2)
Coyote Lake Harvey Bear Ranch (Fig. 5)
Santa Teresa (Fig. 4)
Sources: Esri, USGS, NOAA
© 2018 Balance Hydrologics, Inc.
San Jose
Morgan Hill
San Francisco
San Jose
Santa Cruz
C o y o t e V a l l e yPond Classification!( Instream#* Landslide Dammed") Landslide Head Scarp$+ Mining or QuarryXY Tectogenickj N/A
StreamPark BoundaryInset Map I
0 52.5Miles

W:\Projects\214136\location_figure
Figure 2. Pond Locations, Almaden Quicksilver County Park, Santa Clara County, California Source: Santa Clara County Parks
$+
#*
$+AQ-03
AQ-02
AQ-01
Sources: Esri, USGS, NOAA
© 2018 Balance Hydrologics, Inc.
Pond Classification!( Instream
#* Landslide Dammed
") Landslide Head Scarp
$+ Mining or Quarry
XY Tectogenic
kj N/AWatershedPark BoundaryStream I
0 0.750.375 Miles
Guadalupe Reservoir
Almaden Quicksilver

W:\Projects\214136\maps
Figure 3. Pond Locations, Calero County Park, Santa Clara County, California Source: Santa Clara County Parks
!(
!(
!(
!(
kj
$+
!(
kj
!(
!(CA-10
CA-05
CA-03
CA-04
CA-02
CA-01
CA-08
CA-06
CA-07
CA-09
Sources: Esri, USGS, NOAA
© 2018 Balance Hydrologics, Inc.
Pond Classification!( Instream
#* Landslide Dammed
") Landslide Head Scarp
$+ Mining or Quarry
XY Tectogenic
kj N/AWatershedPark BoundaryStream I
0 0.90.45 Miles
Calero Reservoir
Calero
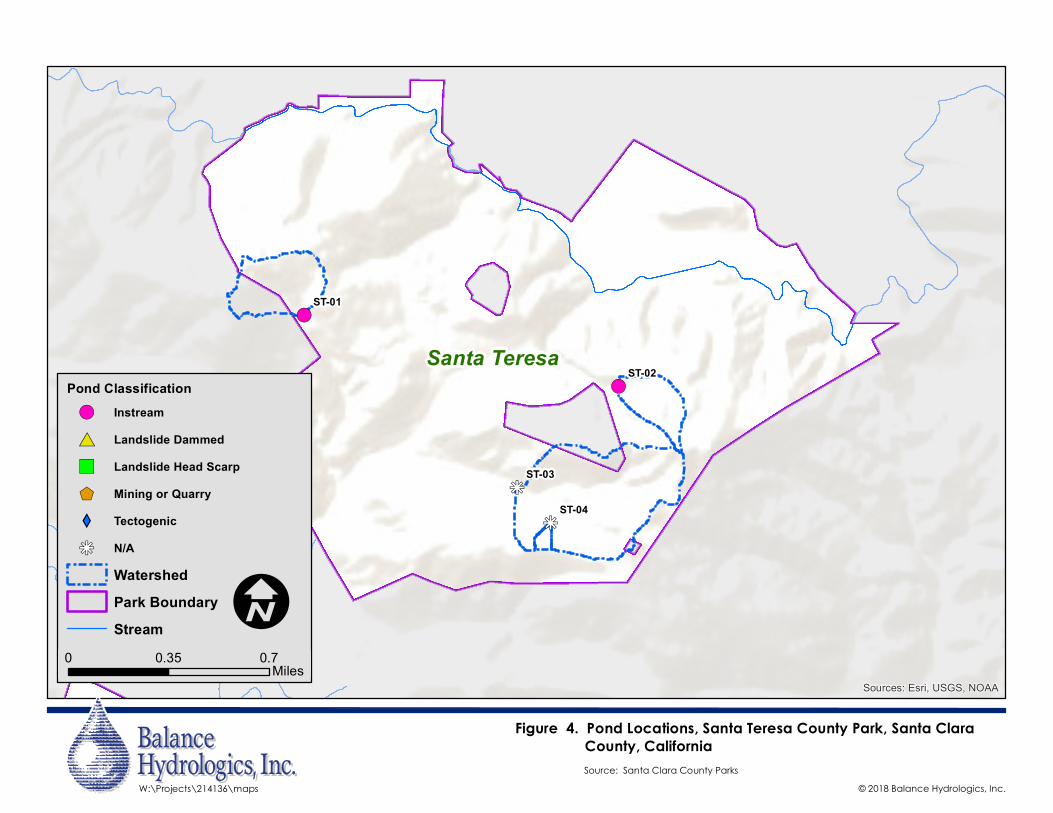
W:\Projects\214136\maps
Figure 4. Pond Locations, Santa Teresa County Park, Santa Clara County, California Source: Santa Clara County Parks
!(
!(
kj
kjST-04
ST-03
ST-02
ST-01
Sources: Esri, USGS, NOAA
© 2018 Balance Hydrologics, Inc.
Pond Classification!( Instream
#* Landslide Dammed
") Landslide Head Scarp
$+ Mining or Quarry
XY Tectogenic
kj N/AWatershedPark BoundaryStream I
0 0.70.35Miles
Santa Teresa

W:\Projects\214136\maps
Figure 5. Pond Locations, Coyote Lake Harvey Bear Ranch, Santa Clara County, California
© 2018 Balance Hydrologics, Inc.
")
XY
")
!(
XY
!(
XY
")CHB-02
CHB-04
CHB-05
CHB-08
CHB-07
CHB-03
CHB-06
CHB-01
Sources: Esri, USGS, NOAA
Pond Classification!( Instream
#* Landslide Dammed
") Landslide Head Scarp
$+ Mining or Quarry
XY Tectogenic
kj N/AWatershedPark BoundaryStream I
0 10.5Miles
Source: Santa Clara County Parks
Coyote Lake
Coyote Lake Harvey Bear Ranch

-100
100
300
500
700
900
1100
1300
1500
500
505
510
515
520
525
03/01/17 05/20/17 08/08/17 10/27/17
Spec
ific C
ondu
ctan
ce @
25°
C
Elev
atio
n (fe
et, e
stim
ated
from
200
6 SC
VWD
Lida
r)
Water Surface ElevationWater Surface ObservationsGroundwater ElevationsGroundwater ObservationsGroundwater Observations (Well 2)Specific ConductanceSpecific Conductance Observations
© 2018 Balance Hydrologics, Inc.
Figure 6a. CA-05 Surface Water and Groundwater Measurements and Manual Observations. Coyote Valley Pond Hydroperiod Study.Santa Clara County, California
Spillway Elevation
Pond Bottom Elevation
Elevations estimated based on 2006 SCVWD Lidar data
P:\2014\214136 GCRCD\214136 field activities\214136 All Ponds and wells.xlsx

0
200
400
600
800
1000
1200
1400
520
525
530
535
540
545
3/1/2017 5/20/2017 8/8/2017 10/27/2017
Spec
ific C
ondu
ctan
ce @
25°
C
Elea
vtio
n (fe
et, e
stim
ated
from
200
6 SC
VWD
Lida
r)
Water Surface ElevationWater Surface ObservationsGroundwater ElevationsGroundwater ObservationsHigh-water MarkSpecific ConductanceSpecific Conductance Observations
Figure 6b. CA-07 Surface Water and Groundwater Measurements and Manual Observations. Coyote Valley Pond Hydroperiod Study.Santa Clara County, California
Spillway Elevation
Pond Bottom Elevation
Elevations estimated based on 2006 SCVWD Lidar data
P:\2014\214136 GCRCD\214136 field activities\214136 All Ponds and wells.xlsx © 2018 Balance Hydrologics, Inc.

-100
100
300
500
700
900
1100
1300
1500
900
905
910
915
920
925
3/1/2017 5/20/2017 8/8/2017 10/27/2017
Spec
ific C
ondu
ctan
ce @
25°
C
Elev
atio
n (fe
et, e
stim
ated
from
200
6 SC
VWD
Lida
r)
Water Surface ElevationWater Surface ObservationsGroundwater ElevationsGroundwater ObservationsSpecific ConductanceSpecific Conductance Observations
© 2018 Balance Hydrologics, Inc.
Figure 6c. AQ-01 Surface Water and Groundwater Measurements and Manual Observations. Coyote Valley Pond Hydroperiod Study.Santa Clara County, California
Spillway Elevation
Pond Bottom Elevation
Elevations estimated based on 2006 SCVWD Lidar dataP:\2014\214136 GCRCD\214136 field activities\214136 All Ponds and wells.xlsx

0
200
400
600
800
1000
1200
695
697
699
701
703
705
707
709
711
713
715
3/1/2017 5/20/2017 8/8/2017 10/27/2017
Spec
ific C
ondu
ctan
ce @
25°
C
Elev
atio
n (fe
et, e
stim
ated
from
200
6 SC
VWD
Lida
r)
Water Surface ElevationWater Surface ObservationsGroundwater ElevationsGroundwater ObservationsHigh-water MarkSpecific ConductanceSpecific Conductance Observations
© 2018 Balance Hydrologics, Inc.
Figure 6d. ST-01 Surface Water and Groundwater Measurements and Manual Observations. Coyote Valley Pond Hydroperiod Study.Santa Clara County, California
Pond Bottom Elevation
Spillway Elevation
Elevations estimated based on 2006 SCVWD Lidar data
P:\2014\214136 GCRCD\214136 field activities\214136 All Ponds and wells.xlsx

-100
100
300
500
700
900
1100
1300
1500
765
770
775
780
785
790
3/1/2017 5/20/2017 8/8/2017 10/27/2017
Spec
ific C
ondu
ctan
ce @
25°
C
Elev
atio
n (fe
et, e
stim
ated
from
200
6 SC
VWD
Lida
r)
Water Surface ElevationsGroundwater ElevationsGroundwater ObservationsHigh-water MarkWater Surface ObservationsSpecific ConductanceSpecific Conductance Observations
© 2018 Balance Hydrologics, Inc.
Figure 6e. ST-02 Surface Water and Groundwater Measurements and Manual Observations. Coyote Valley Pond Hydroperiod Study.Santa Clara County, California
Pond Bottom Elevation
Spillway Elevation
Elevations estimated based on 2006 SCVWD Lidar data
P:\2014\214136 GCRCD\214136 field activities\214136 All Ponds and wells.xlsx

0
200
400
600
800
1000
1200
1400
795
800
805
810
815
820
3/1/2017 5/20/2017 8/8/2017 10/27/2017
Spec
ific C
ondu
ctan
ce @
25°
C
Elea
vtio
n (fe
et, e
stim
ated
from
200
6 SC
VWD
Lida
r)
Water Surface ElevationWater Surface ObservationsGroundwater ElevationsGroundwater ObservationsHigh-water MarkSpecific ConductanceSpecific Conductance Observations
Figure 6f. CHB-03 Surface Water and Groundwater Measurements and Manual Observations. Coyote Valley Pond Hydroperiod Study.Santa Clara County, California
Pond Bottom Elevation
Spillway Elevation
Elevations estimated based on 2006 SCVWD Lidar data
© 2018 Balance Hydrologics, Inc.P:\2014\214136 GCRCD\214136 field activities\214136 All Ponds and wells.xlsx

0
200
400
600
800
1000
1200
1400
865
870
875
880
885
890
3/1/2017 5/20/2017 8/8/2017 10/27/2017
Spec
ific C
ondu
ctan
ce @
25°
C
Elev
atio
n (fe
et, e
stim
ated
from
200
6 SC
VWD
Lida
r)
Water Surface ElevationWater Surface ObservationsHigh-water MarkSpecific ConductanceSpecific Conductance Observations
© 2018 Balance Hydrologics, Inc.
Figure 6g. CHB-04 Surface Water and Groundwater Measurements and Manual Observations. Coyote Valley Pond Hydroperiod Study.Santa Clara County, California
Pond Bottom Elevation
Spillway Elevation
Elevations estimated based on 2006 SCVWD Lidar dataP:\2014\214136 GCRCD\214136 field activities\214136 All Ponds and wells.xlsx

805
810
815
820
825
830
3/1/2017 4/1/2017 5/1/2017 6/1/2017 7/1/2017 8/1/2017 9/1/2017 10/1/2017 11/1/2017
Elev
atio
n (fe
et, e
stim
ated
from
200
6 SC
VWD
Lida
r)
Groundwater Elevations
High-water Mark
Groundwater Observations
Water Surface Observations
© 2018 Balance Hydrologics, Inc.
Figure 6h. CHB-08 Surface Water and Groundwater Measurements and Manual Observations. Coyote Valley Pond Hydroperiod Study.Santa Clara County, California
Pond Bottom Elevation
Spillway Elevation
Elevations estimated based on 2006 SCVWD Lidar data
P:\2014\214136 GCRCD\214136 field activities\214136 All Ponds and wells.xlsx

© 2018 Balance Hydrologics, Inc.
Figure 7. Hydroperiod water balance (HWB) model schematic
P:\2014\214136 GCRCD\214136 redrope\Figures\Figure 7 Model Schematic.pptx
Pond Elevation
Groundwater In
Runoff
Direct Rainfall ET
Spillway
Groundwater Out
- =+
Inflows Outflows
Previous Pond
Elevation
HWB Model
Model inputs: • Mean monthly air temperature• Total monthly precipitation • Stage-storage-area curves• Soil properties
Model Validation Data:• Historical aerial imagery pond areas• Dry season data collected by Balance
Hydrologics

Model Results for AQ-01 in Almaden Quicksilver Park, San Jose, California.
Pond empty
Pond wet, not full
Pond full
Figure 8a.
P;\2014\214136 GCRCD\214136 redrope\Figures\Fig_8a_8u_PondResults.pub © 2018 Balance Hydrologics, Inc.
AQ-01 Watershed Characteristics Size 41.7 acres
Geology Franciscan Complex, Coast Range Complex (sepentinite)
Soils Fine-loamy mixed soil Land Cover Mixed forest, some herbaceous
Emergent Vegetation 0.11 acres Berm Status Intact
Fault None Grazing Not observed
Pond Classification Mining or Quarry Depressions Hydroperiod Year-round
Existing hydroperiod potentially supports Covered Species (other species of interest) :
nCTS, CRF, WPT (Bullfrog, hCTS)
Possible management alternatives
Add drain or pumping plan (manage for bullfrog)

Model Results for AQ-02 in Almaden Quicksilver Park, San Jose, California.
Pond empty
Pond wet, not full
Pond full
Figure 8b.
P;\2014\214136 GCRCD\214136 redrope\Figures\Fig_8a_8u_PondResults.pub © 2018 Balance Hydrologics, Inc.
AQ-02 Watershed Characteristics Size 174.3 acres
Geology Franciscan Complex, Coast Range
Complex (sepentinite), Miocene marine rocks
Soils Fine-loamy mixed soil
Land Cover Mixed forest, some scrub, herbaceous, and evergreen
Emergent Vegetation 0.02 acres Berm Status Natural
Fault None Grazing Not observed
Pond Classification Landslide Dammed Hydroperiod Year-round
Existing hydroperiod potentially supports Covered Species (other
species of interest) : nCTS, CRF, WPT (Bullfrog, hCTS)
Possible management alternatives
Access is difficult, no management recommended at this time

Model Results for AQ-03 in Almaden Quicksilver Park, San Jose, California.
Pond empty
Pond wet, not full
Pond full
Figure 8c.
P;\2014\214136 GCRCD\214136 redrope\Figures\Fig_8a_8u_PondResults.pub © 2018 Balance Hydrologics, Inc.
AQ-03 Watershed Characteristics Size 8.7 acres
Geology Franciscan Complex, Coast Range Complex (sepentinite)
Soils Fine-loamy mixed soil, some sandy loam
Land Cover Mixed forest, some scrub Emergent Vegetation 0 acres
Berm Status Intact Fault None
Grazing Not observed Pond Classification Mining or Quarry Depressions
Hydroperiod Dec - Jun Existing hydroperiod potentially
supports Covered Species (other species of interest) :
WPT, nCTS
Possible management alternatives
Construct berm (increase resilience), add drain or pumping plan (manage for bullfrog)
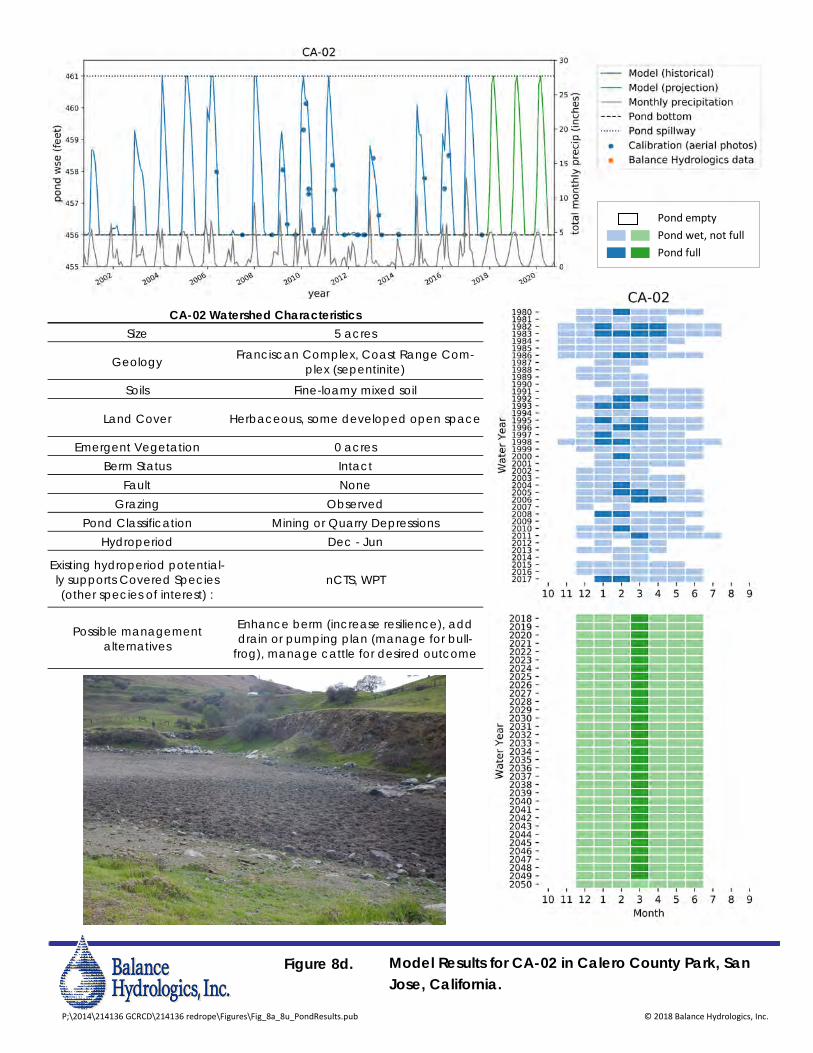
Model Results for CA-02 in Calero County Park, San Jose, California.
Pond empty
Pond wet, not full
Pond full
Figure 8d.
P;\2014\214136 GCRCD\214136 redrope\Figures\Fig_8a_8u_PondResults.pub © 2018 Balance Hydrologics, Inc.
CA-02 Watershed Characteristics Size 5 acres
Geology Franciscan Complex, Coast Range Com-plex (sepentinite)
Soils Fine-loamy mixed soil
Land Cover Herbaceous, some developed open space
Emergent Vegetation 0 acres Berm Status Intact
Fault None Grazing Observed
Pond Classification Mining or Quarry Depressions Hydroperiod Dec - Jun
Existing hydroperiod potential-ly supports Covered Species (other species of interest) :
nCTS, WPT
Possible management alternatives
Enhance berm (increase resilience), add drain or pumping plan (manage for bull-
frog), manage cattle for desired outcome

Model Results for CA-04 in Calero County Park, San Jose, California.
Pond empty
Pond wet, not full
Pond full
Figure 8e.
P;\2014\214136 GCRCD\214136 redrope\Figures\Fig_8a_8u_PondResults.pub © 2018 Balance Hydrologics, Inc.
CA-04 Watershed Characteristics Size 32 acres
Geology Franciscan Complex, Coast Range Complex (sepentinite)
Soils Loamy magnesic soils Land Cover Herbaceous, some mixed forest and scrub
Emergent Vegetation 0 acres Berm Status Eroded
Fault None Grazing Observed
Pond Classification Instream Hydroperiod Dec - Sep
Existing hydroperiod potentially supports Covered Species (other species of interest) :
CRF, nCTS, WPT
Possible management alternatives
Raise spillway (likely too shallow), add drain or pumping plan (manage for bullfrog),
manage cattle for desired outcome

Model Results for CA-05 in Calero County Park, San Jose, California.
Pond empty
Pond wet, not full
Pond full
Figure 8f.
P;\2014\214136 GCRCD\214136 redrope\Figures\Fig_8a_8u_PondResults.pub © 2018 Balance Hydrologics, Inc.
CA-05 Watershed Characteristics Size 20.8 acres
Geology Franciscan Melange and Greenstone Soils Fine-loamy mixed soil
Land Cover Herbaceous, some woody wetland and scrub
Emergent Vegetation 0.46 acres Berm Status Intact
Fault None Grazing Not observed
Pond Classification Instream Hydroperiod Year-round
Existing hydroperiod potentially supports Covered Species (other
species of interest) : nCTS, CRF, WPT (Bullfrog, hCTS)
Possible management alternatives
Add drain or pumping plan (manage for bullfrog)

Model Results for CA-06 in Calero County Park, San Jose, California.
Figure 8g.
Pond empty
Pond wet, not full
Pond full
P;\2014\214136 GCRCD\214136 redrope\Figures\Fig_8a_8u_PondResults.pub © 2018 Balance Hydrologics, Inc.
CA-06 Watershed Characteristics Size 41.7 acres
Geology Franciscan Melange Soils Fine-loamy mixed soil
Land Cover Mixed forest, some herbaceous Emergent Vegetation 0.04 acres
Berm Status Eroded spillway Fault None
Grazing Observed Pond Classification Instream
Hydroperiod Year-round Existing hydroperiod potentially
supports Covered Species (other species of interest) :
nCTS, CRF, WPT (Bullfrog, hCTS)
Possible management alternatives
Repair berm (increase resilience), add drain or pumping plan (manage for bull-
frog), manage cattle for desired outcome

Model Results for CA-07 (Los Cerritos Pond) in Calero County Park, San Jose, California.
Figure 8h.
Pond empty
Pond wet, not full
Pond full
P;\2014\214136 GCRCD\214136 redrope\Figures\Fig_8a_8u_PondResults.pub © 2018 Balance Hydrologics, Inc.
CA-07 Watershed Characteristics Size 32.7 acres
Geology Franciscan Melange Soils Fine-loamy mixed soil
Land Cover Herbaceous and mixed forest, some scrub Emergent Vegetation 0.15 acres
Berm Status Spillway eroded and lined with rip-rap Fault None
Grazing Observed Pond Classification Instream
Hydroperiod Year-round Existing hydroperiod potentially
supports Covered Species (other species of interest) :
nCTS, CRF, WPT (Bullfrog, hCTS)
Possible management alternatives
Repair berm (increase resilience), add drain or pumping plan (manage for bull-
frog), manage cattle for desired outcome

Model Results for CA-08 in Calero County Park, San Jose, California.
Figure 8i.
Pond empty
Pond wet, not full
Pond full
P;\2014\214136 GCRCD\214136 redrope\Figures\Fig_8a_8u_PondResults.pub © 2018 Balance Hydrologics, Inc.
CA-08 Watershed Characteristics Size 151.2 acres
Geology Franciscan Complex, Coast Range Complex (sepentinite)
Soils Fine-loamy and sandy loamy soil
Land Cover Mixed forest, some scrub and herbaceous
Emergent Vegetation 0.2 acres Berm Status Spillway eroded and lined with rip-rap
Fault None Grazing Not observed
Pond Classification Instream Hydroperiod Year-round
Existing hydroperiod potentially supports Covered Species (other species of interest) :
nCTS, CRF, WPT (Bullfrog, hCTS)
Possible management alternatives
Repair berm (increase resilience), add drain or pumping plan (manage for
bullfrog)

Model Results for CA-09 in Calero County Park, San Jose, California.
Figure 8j.
Pond empty
Pond wet, not full
Pond full
P;\2014\214136 GCRCD\214136 redrope\Figures\Fig_8a_8u_PondResults.pub © 2018 Balance Hydrologics, Inc.
CA-09 Watershed Characteristics Size 9.5 acres
Geology Franciscan Melange and Greenstone Soils Fine-loamy mixed soil
Land Cover Scrub and herbaceous, some mixed forest
Emergent Vegetation 0 acres Berm Status Slight erosion with minimal rock in place
Fault None Grazing Not observed
Pond Classification Instream Hydroperiod Dec - Aug
Existing hydroperiod potentially supports Covered Species (other species of interest) :
CRF, nCTS, WPT
Possible management alternatives
Repair/enhance berm (increase resilience), add drain or pumping plan
(manage for bullfrog)

Model Results for CA-10 in Calero County Park, San Jose, California.
Figure 8k.
Pond empty
Pond wet, not full
Pond full
P;\2014\214136 GCRCD\214136 redrope\Figures\Fig_8a_8u_PondResults.pub © 2018 Balance Hydrologics, Inc.
CA-10 Watershed Characteristics Size 12.3 acres
Geology Franciscan Complex, Coast Range Complex (sepentinite)
Soils Fine-loamy mixed, some loamy magnesic soils
Land Cover Herbaceous, some mixed forest Emergent Vegetation 0 acres
Berm Status Eroded Fault None
Grazing Observed Pond Classification Instream
Hydroperiod Dec - May Existing hydroperiod potentially
supports Covered Species (other species of interest) :
nCTS
Possible management alternatives
Repair berm (increase hydroperiod), add drain or pumping plan (manage for bullfrog),
manage cattle for desired outcome

Model Results for CHB-01 in Coyote Harvey Bear Ranch County Park, Gilroy, California.
Figure 8l.
Pond empty
Pond wet, not full
Pond full
P;\2014\214136 GCRCD\214136 redrope\Figures\Fig_8a_8u_PondResults.pub © 2018 Balance Hydrologics, Inc.
CHB-01 Watershed Characteristics Size 15.4 acres
Geology Tertiary volcanic flow rocks (basalt)
Soils Rocky clay loam, some clay Land Cover Herbaceous
Emergent Vegetation 0 acres Berm Status Intact
Fault None Grazing Observed
Pond Classification Landslide Head Scarp Hydroperiod Dec - Oct
Existing hydroperiod potentially supports Covered Species (other species of interest) :
CRF, nCTS, WPT
Possible management alternatives Manage cattle for desired outcome
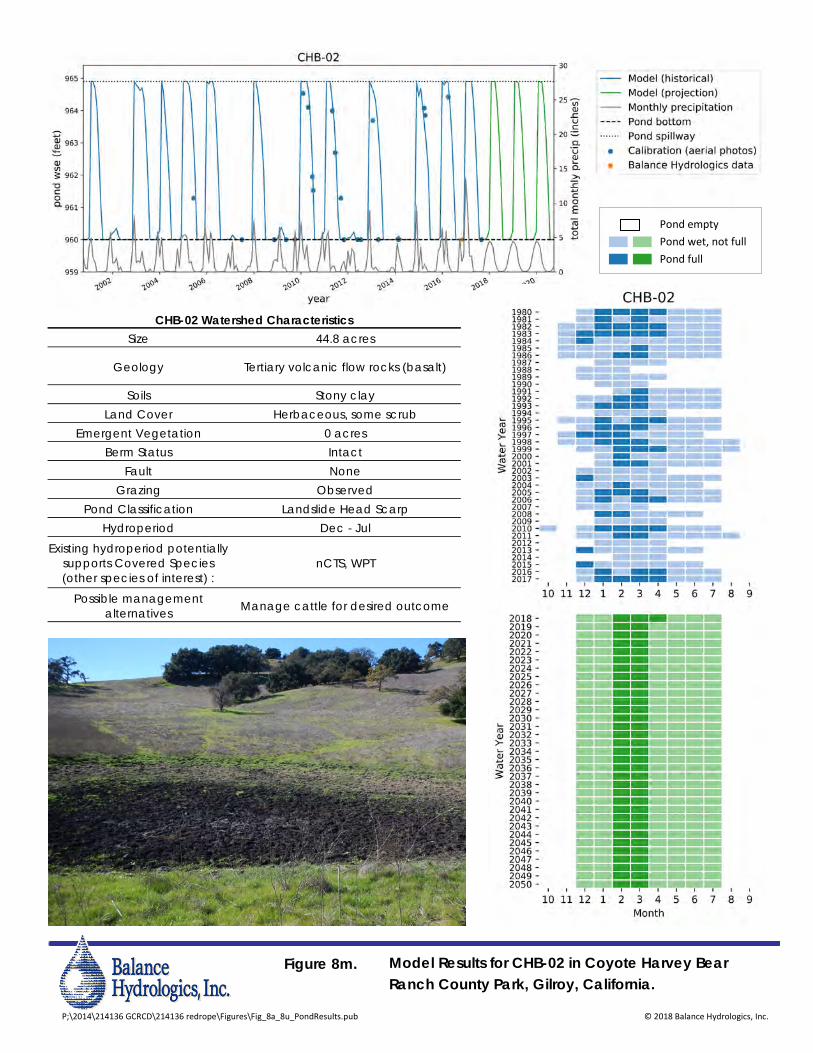
Model Results for CHB-02 in Coyote Harvey Bear Ranch County Park, Gilroy, California.
Figure 8m.
Pond empty
Pond wet, not full
Pond full
P;\2014\214136 GCRCD\214136 redrope\Figures\Fig_8a_8u_PondResults.pub © 2018 Balance Hydrologics, Inc.
CHB-02 Watershed Characteristics Size 44.8 acres
Geology Tertiary volcanic flow rocks (basalt)
Soils Stony clay Land Cover Herbaceous, some scrub
Emergent Vegetation 0 acres Berm Status Intact
Fault None Grazing Observed
Pond Classification Landslide Head Scarp Hydroperiod Dec - Jul
Existing hydroperiod potentially supports Covered Species (other species of interest) :
nCTS, WPT
Possible management alternatives Manage cattle for desired outcome

Model Results for CHB-03 in Coyote Harvey Bear Ranch County Park, Gilroy, California.
Figure 8n.
Pond empty
Pond wet, not full
Pond full
P;\2014\214136 GCRCD\214136 redrope\Figures\Fig_8a_8u_PondResults.pub © 2018 Balance Hydrologics, Inc.
CHB-03 Watershed Characteristics Size 22.6 acres
Geology Quaternary landslide deposit Soils Stony clay
Land Cover Herbaceous Emergent Vegetation 0 acres
Berm Status Eroded, rock placed to support berm
Fault Coyote Creek Fault borders watershed
Grazing Observed Pond Classification Landslide Head Scarp
Hydroperiod Nov - Jun Existing hydroperiod potentially
supports Covered Species (other species of interest) :
nCTS, WPT
Possible management alternatives
Repair spillway (increase resilience), add drain or pumping plan (manage for bull-
frog), manage cattle for desired outcome

Model Results for CHB-04 in Coyote Harvey Bear Ranch County Park, Gilroy, California.
Figure 8o.
Pond empty
Pond wet, not full
Pond full
P;\2014\214136 GCRCD\214136 redrope\Figures\Fig_8a_8u_PondResults.pub © 2018 Balance Hydrologics, Inc.
CHB-04 Watershed Characteristics Size 15.2 acres
Geology Franciscan Complex, Plio-Pleistocene non-marine, Tertiary volcanic flow rocks (basalt)
Soils Loamy mixed soil
Land Cover Herbaceous, some mixed forest and scrub
Emergent Vegetation 0 acres Berm Status Intact
Fault Calaveras Fault bisects watershed and pond
Grazing Observed Pond Classification Tectogenic
Hydroperiod Year-round Existing hydroperiod potentially
supports Covered Species (other species of interest) :
nCTS, CRF, WPT (Bullfrog, hCTS)
Possible management alternatives
Add drain or pumping plan (manage for bullfrog), Repair spillway (increase
resilience), add drain or pumping plan (manage for bullfrog), manage cattle for
desired outcome

Model Results for CHB-05 in Coyote Harvey Bear Ranch County Park, Gilroy, California.
Pond empty
Pond wet, not full
Pond full
Figure 8p.
P;\2014\214136 GCRCD\214136 redrope\Figures\Fig_8a_8u_PondResults.pub © 2018 Balance Hydrologics, Inc.
CHB-05 Watershed Characteristics Size 25.8 acres
Geology Franciscan Complex, Plio-Pleistocene non-marine
Soils Clay loam Land Cover Herbaceous, some mixed forest and scrub
Emergent Vegetation 0 acres Berm Status Active and extensive erosion
Fault Coyote Creek Fault bisects watershed only
Grazing Observed Pond Classification Instream
Hydroperiod Year-round Existing hydroperiod potentially
supports Covered Species (other species of interest) :
nCTS, CRF, WPT (Bullfrog, hCTS)
Possible management alternatives
Repair spillway (increase resilience), add drain or pumping plan (manage for bull-
frog), manage cattle for desired outcome

Model Results for CHB-06 in Coyote Harvey Bear Ranch County Park, Gilroy, California.
Pond empty
Pond wet, not full
Pond full
Figure 8q.
P;\2014\214136 GCRCD\214136 redrope\Figures\Fig_8a_8u_PondResults.pub © 2018 Balance Hydrologics, Inc.
CHB-06 Watershed Characteristics Size 66.7 acres
Geology Plio-Pleistocene nonmarine, Pliestocene alluvial sediments
Soils Clay loam and terrace escarpments
Land Cover Mixed forest, some scrub and herbaceous Emergent Vegetation 0 acres
Berm Status Intact
Fault Calaveras Fault bisects watershed and borders pond
Grazing Observed Pond Classification Tectogenic
Hydroperiod Year-round Existing hydroperiod potentially
supports Covered Species (other species of interest) :
nCTS, CRF, WPT (Bullfrog, hCTS)
Possible management alternatives
Add drain or pumping plan (manage for bullfrog), manage cattle for desired
outcome

Model Results for CHB-07 in Coyote Harvey Bear Ranch County Park, Gilroy, California.
Pond empty
Pond wet, not full
Pond full
Figure 8r.
P;\2014\214136 GCRCD\214136 redrope\Figures\Fig_8a_8u_PondResults.pub © 2018 Balance Hydrologics, Inc.
CHB-07 Watershed Characteristics Size 95 acres
Geology Cretaceous sedimentary rocks, Pleistocene alluvial sediments
Soils Loam, some silt loam
Land Cover Herbaceous, some mixed forest and developed open space
Emergent Vegetation 0 acres Berm Status Intact
Fault None Grazing Observed
Pond Classification Instream Hydroperiod Year-round
Existing hydroperiod potentially supports Covered Species (other species of interest) :
nCTS, CRF, WPT (Bullfrog, hCTS)
Possible management alternatives
Add drain or pumping plan (manage for bullfrog), manage cattle for desired
outcome

Model Results for CHB-08 in Coyote Harvey Bear Ranch County Park, Gilroy, California.
Pond empty
Pond wet, not full
Pond full
Figure 8s.
P;\2014\214136 GCRCD\214136 redrope\Figures\Fig_8a_8u_PondResults.pub © 2018 Balance Hydrologics, Inc.
CHB-08 Watershed Characteristics Size 128.4 acres
Geology Great Valley sedimentary rocks, Cretaceous
sedimentary rocks, Pleistocene alluvial sediments
Soils Clay loam, some rocky clay loam Land Cover Herbaceous, some mixed forest
Emergent Vegetation 0.1 acres
Berm Status Intact, active erosion at the end of spillway channel
Fault Calaveras Fault bisects watershed and pond
Grazing Observed Pond Classification Tectogenic
Hydroperiod Year-round
Existing hydroperiod potentially supports Covered Species (other species of interest) :
nCTS, CRF, WPT (Bullfrog, hCTS)
Possible management alternatives
Repair spillway (increase resilience), add drain or pumping plan (manage for bull-
frog), manage cattle for desired outcome
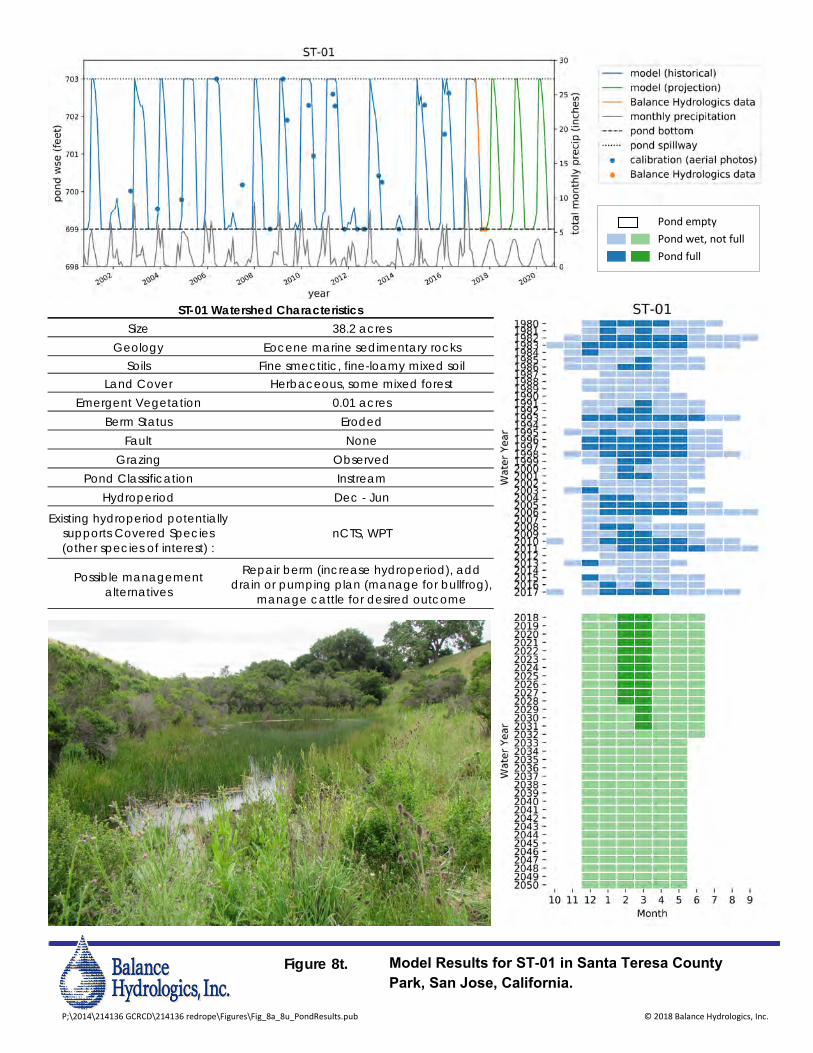
Model Results for ST-01 in Santa Teresa County
Park, San Jose, California.
Pond empty
Pond wet, not full
Pond full
Figure 8t.
P;\2014\214136 GCRCD\214136 redrope\Figures\Fig_8a_8u_PondResults.pub © 2018 Balance Hydrologics, Inc.
ST-01 Watershed Characteristics Size 38.2 acres
Geology Eocene marine sedimentary rocks Soils Fine smectitic, fine-loamy mixed soil
Land Cover Herbaceous, some mixed forest Emergent Vegetation 0.01 acres
Berm Status Eroded Fault None
Grazing Observed Pond Classification Instream
Hydroperiod Dec - Jun
Existing hydroperiod potentially supports Covered Species (other species of interest) :
nCTS, WPT
Possible management alternatives
Repair berm (increase hydroperiod), add drain or pumping plan (manage for bullfrog),
manage cattle for desired outcome

Model Results for ST-02 in Santa Teresa County Park, San Jose, California.
Pond empty
Pond wet, not full
Pond full
Figure 8u.
P;\2014\214136 GCRCD\214136 redrope\Figures\Fig_8a_8u_PondResults.pub © 2018 Balance Hydrologics, Inc.
ST-02 Watershed Characteristics Size 22 acres
Geology Franciscan Melange
Soils Loamy steep soils, some loamy magnesic
Land Cover Herbaceous, some scrub and developed open space
Emergent Vegetation 0 acres Berm Status Intact
Fault None Grazing Not observed
Pond Classification Instream Hydroperiod Dec - Jul
Existing hydroperiod potentially supports Covered Species (other species of interest) :
nCTS, WPT
Possible management alternatives
Enhance berm (increase resilience), add drain or pumping plan (manage for bullfrog)

APPENDIX A
Complete Model Parameters
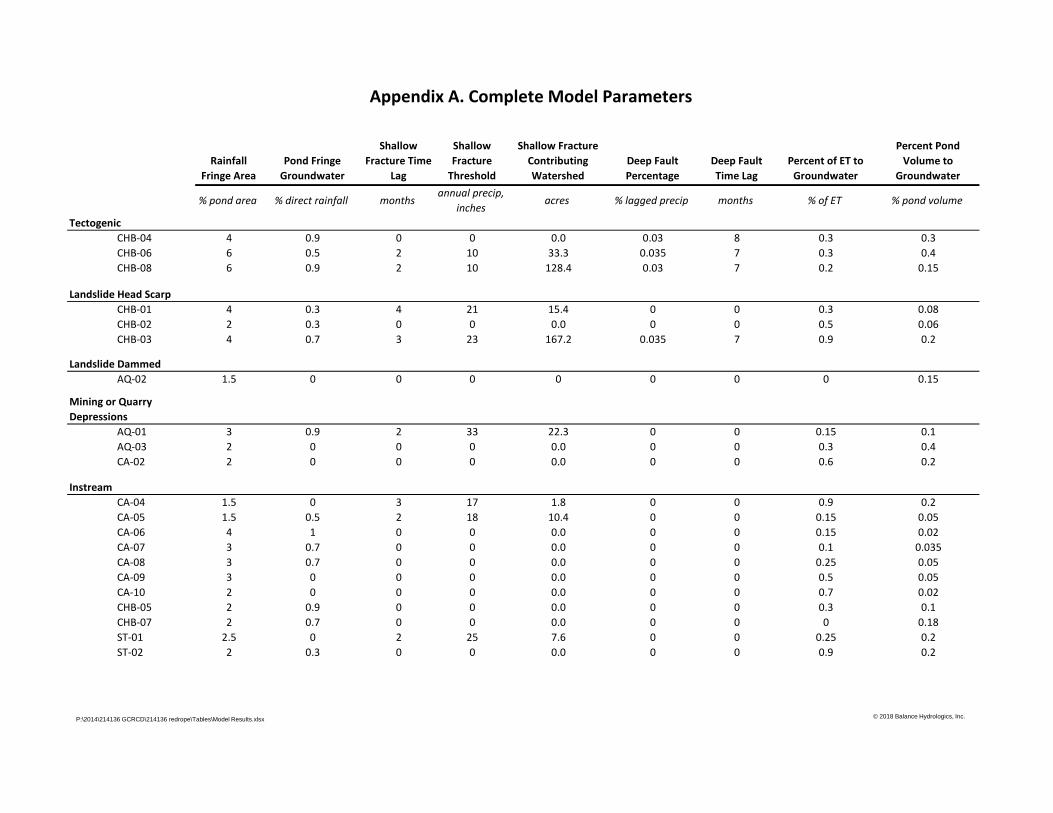
Rainfall Fringe Area
Pond Fringe Groundwater
Shallow Fracture Time
Lag
Shallow Fracture
Threshold
Shallow Fracture Contributing Watershed
Deep Fault Percentage
Deep Fault Time Lag
Percent of ET to Groundwater
Percent Pond Volume to
Groundwater
% pond area % direct rainfall monthsannual precip,
inchesacres % lagged precip months % of ET % pond volume
CHB-04 4 0.9 0 0 0.0 0.03 8 0.3 0.3CHB-06 6 0.5 2 10 33.3 0.035 7 0.3 0.4CHB-08 6 0.9 2 10 128.4 0.03 7 0.2 0.15
CHB-01 4 0.3 4 21 15.4 0 0 0.3 0.08CHB-02 2 0.3 0 0 0.0 0 0 0.5 0.06CHB-03 4 0.7 3 23 167.2 0.035 7 0.9 0.2
AQ-02 1.5 0 0 0 0 0 0 0 0.15
AQ-01 3 0.9 2 33 22.3 0 0 0.15 0.1AQ-03 2 0 0 0 0.0 0 0 0.3 0.4CA-02 2 0 0 0 0.0 0 0 0.6 0.2
CA-04 1.5 0 3 17 1.8 0 0 0.9 0.2CA-05 1.5 0.5 2 18 10.4 0 0 0.15 0.05CA-06 4 1 0 0 0.0 0 0 0.15 0.02CA-07 3 0.7 0 0 0.0 0 0 0.1 0.035CA-08 3 0.7 0 0 0.0 0 0 0.25 0.05CA-09 3 0 0 0 0.0 0 0 0.5 0.05CA-10 2 0 0 0 0.0 0 0 0.7 0.02CHB-05 2 0.9 0 0 0.0 0 0 0.3 0.1CHB-07 2 0.7 0 0 0.0 0 0 0 0.18ST-01 2.5 0 2 25 7.6 0 0 0.25 0.2ST-02 2 0.3 0 0 0.0 0 0 0.9 0.2
Appendix A. Complete Model Parameters
Instream
Landslide Head Scarp
Tectogenic
Landslide Dammed
Mining or Quarry Depressions
© 2018 Balance Hydrologics, Inc.P:\2014\214136 GCRCD\214136 redrope\Tables\Model Results.xlsx