a new kind of segregation - yale law school 3 a new kind of segregation in which i describe how the...
TRANSCRIPT

69
3
A New Kind of SegregationIn which I describe how the cultural divide between the new
upper class and the rest of America is being reinforced by
residential segregation that enables large portions of the new
upper class to live their lives isolated from everyone else.
IN 2 0 0 9 , A M E R I C A’ S leading scholar of residential segregation, Princeton’s Douglas Massey, joined by coauthors Jonathan Roth-well and Thurston Domina, published a major study of American
residential segregation over the course of the twentieth century.1 The good news was that racial segregation had receded in the aftermath of the civil rights revolution. Racial segregation was still substantial, but the trend had been in the right direction for almost four decades. The bad news was that socioeconomic segregation had been increasing.
Massey and his colleagues focused on a comparison of households below the poverty line with households that had incomes at least four times the poverty line. Their evidence was not the stuff of headlines. The dissimilarity index for people below the poverty line and fami-lies four times above the poverty line in metropolitan areas increased from 0.34 to 0.42 from 1970 to 2000.2 They also found that the isola-tion index of college graduates within census tracts increased from 0.19 to 0.36.3 But if the numbers were obscure, the authors’ sum-mary judgment was clear enough: “During the late twentieth century, in other words, the well educated and the affl uent increasingly seg-mented themselves off from the rest of American society.”4 They
Murr_9780307453426_3p_01_r1.e.indd 69Murr_9780307453426_3p_01_r1.e.indd 69 11/21/11 2:55 PM11/21/11 2:55 PM

70 Coming Apart
were reminded of a phrase coined by Robert Reich when he fi rst de-scribed the new class of symbolic analysts back in 1991: “The seces-sion of the successful.”
The authors had used a modest defi nition of affl uence. At least four times the median poverty line included 42 percent of American fami-lies in the 2000 census.5 The authors had actually demonstrated that people in the middle class on up have distanced themselves from the poor. What about people in the neighborhoods that are really affl uent and really well educated? As you are about to see, they didn’t just separate themselves from the poor. They separated themselves from just about everyone who isn’t as rich and well educated as they are.
A Tale of Three Cities
Austin, Texas
Austin, Texas, was still a small city when the census was taken in 1960, with a population of just 186,545. It was the state capital and home to the fl agship campus of the University of Texas, which gave it some distinction. But Austin was otherwise like other small cities scattered around the state, with an economy based largely on receiv-ing and shipping agricultural products from the surrounding farm country. Some local companies manufactured brick, tile, and bed-room furniture.
The capitol building and the campus were both in the middle of downtown. Austin’s wealthiest citizens lived to the west of down-town and north of the Colorado River in four census tracts that com-prised 16 percent of Austin’s adult population.6 The median family income in those affl uent census tracts was $60,700—roughly the in-come of an experienced Austin public school teacher in 2010.7 Thirty- fi ve percent of residents ages 25 and older in those four census tracts had a bachelor’s degree or higher— or to think of it another way, almost two out of three adults in Austin’s most affl uent neigh-borhoods did not have a college education.8
Four censuses later, in 2000, Austin had been transformed. The population had grown to 656,562, making Austin the sixteenth- largest
Murr_9780307453426_3p_01_r1.e.indd 70Murr_9780307453426_3p_01_r1.e.indd 70 11/21/11 2:55 PM11/21/11 2:55 PM

A New Kind of Segregation 71
city in the nation. The area adjoining downtown to the west was still the rich part of town, and had expanded even farther west by 2000, but it now housed a different demographic than it had forty years earlier, with a median income of $106,100. The median income in the richest zip code was $211,800.
Education had grown as much as income. Twelve zip codes had BA percentages above 60 percent. The increases in wealth and education went together. The top twelve wealthiest zip codes also boasted ten out of twelve of the best- educated zip codes.9
It wasn’t just more money and more education in the west half of Austin that made the difference. Austin had become home to some of the trendiest and highest-tech industries in the country. Dell Com-puter, ranked 48 on the Fortune 500 that year, had its headquarters in Austin. So did Whole Foods Market, which had grown from one small natural food store to a nationwide chain and would enter the Fortune 500 in 2005. A partial list of new- economy companies that located some of their operations in Austin then or in the decade to follow includes Apple, Google, Freescale Semiconductor, Cirrus Logic, Cisco Systems, eBay, PayPal, Intel, National Instruments, Sam-sung, Silicon Laboratories, and Sun Microsystems. About eighty- fi ve biotechnology companies would locate in Austin by 2010, making it a leading employer in that vibrant new industry.
The technical jobs offered by such employers required not just people with college educations but also very smart people. Occasion-ally that meant hiring the genius college dropout (the University of Texas had spawned its own exemplar in Michael Dell), but usually employers fi shed in the ponds where the biggest fi sh were the most numerous, which meant that the west side of Austin was swarming with executives who had been trained at Rice, Berkeley, Stanford, Duke, the Ivies, and other elite colleges. The Austin campus of the University of Texas had also been transformed. In 1960, it had been known mainly as a party school with a great football team. By 1985, its academic reputation had risen to the point that it was named one of the eight “Public Ivies” in a book listing the best state universities.10
Add to that the spouses. The growing educational homogamy since
Murr_9780307453426_3p_01_r1.e.indd 71Murr_9780307453426_3p_01_r1.e.indd 71 11/21/11 2:55 PM11/21/11 2:55 PM

72 Coming Apart
1960 meant that most of the spouses were drawn from the same pond of the cognitively talented and well educated as the people being hired by the high- tech fi rms. Family life on the west side of Austin had been transformed in ways that money alone wouldn’t produce.
Manhattan, New York
Seventeen hundred miles and a world away from Austin is Manhat-tan. In 1960 and 2000 alike, New York City was the nation’s leading metropolis, and Manhattan was its crown jewel. Then as now, the emblem of New York’s wealth was the Upper East Side, extending from Fifth Avenue to the East River between Fifty- Ninth Street and Ninety- Sixth Street.11
The rest of Manhattan’s neighborhoods were a mélange. Directly north of Central Park was Harlem, the most famous black neighbor-hood in America. On the southeastern part of the island near the Brooklyn Bridge was the Lower East Side, home to Jewish and Italian immigrants in the early twentieth century and still a white working- class neighborhood in 1960. Scattered to the west and north were the fi nancial district around Wall Street, avant- garde Greenwich Village, the meatpacking district, the garment district, plus a few dozen other ethnically, culturally, or economically distinctive neighborhoods.
Outside the Upper East Side, Manhattan was still predominantly a blue- collar town in 1960. This may not be a surprise for Manhattan north of Central Park, where 67 percent of adults had not completed high school and the median income was just $34,500. But the rest of Manhattan (excluding the Upper East Side) wasn’t that much better educated or richer. A majority of adults had not completed high school and the median family income was $39,300. That was lower than the median for the nation as a whole. Apart from that, remem-ber that these are 2010 dollars. Try to imagine raising a family in Manhattan on $39,300 a year.
Now consider the Upper East Side. To some degree, it was already a world apart in 1960. In the census tracts that ran from Fifth Avenue to Park Avenue, median family income was more than $150,000. The
Murr_9780307453426_3p_01_r1.e.indd 72Murr_9780307453426_3p_01_r1.e.indd 72 11/21/11 2:55 PM11/21/11 2:55 PM

A New Kind of Segregation 73
richest of all was the census tract across from the Metropolitan Mu-seum of Art, with a median of $176,000. But the Upper East Side from Lexington Avenue to the East River wasn’t wealthy. The me-dian family income for the Upper East Side as a whole was just $55,400—far less than the salary of an experienced teacher in the New York City public schools in 2010.12 Just 23 percent of adults on the Upper East Side as a whole had college degrees.
Fast- forward to 2000. The number of people living in Manhattan had not changed much in the intervening years, but the ways that they made their livings had changed a lot. In 1960, 40 percent of Manhattan’s jobs had been industrial. By 2000, that 40 percent had shrunk to 5 percent. By 2000, 15 percent of all jobs in Manhattan were in the fi nancial sector, another 15 percent fell into the category of “professional, scientifi c, and technical services,” and another 9 per-cent were in a category labeled simply “information.” That’s 39 per-cent of all jobs.
That doesn’t mean blue- collar work wasn’t being done in Manhat-tan anymore. It just means that by the year 2000, people who lived in Manhattan south of the Nineties weren’t doing them. Instead, Man-hattan south of the Nineties had turned into an abode for a highly educated, highly paid professional, managerial, and technical class. Even excluding the Upper East Side, the median family income of Manhattan south of Ninety- Sixth Street had risen from the $39,300 of 1960 to $121,400 in 2000. The proportion of adults with college degrees had risen from 16 percent to 60 percent. Within the Upper East Side itself, the median family income had risen from the $55,400 of 1960 to $195,300. The proportion of adults with college degrees had risen from 23 percent to 75 percent.
At street level, life in New York still had the same crackling energy in 2000 as it had had in 1960. Visually, it was far more diverse, its sidewalks even more packed with people from around the world. To the casual eye, it also still seemed to have the same riotous diversity of activity, investment bankers brushing by ConEd workers and street vendors selling hot dogs to advertising executives. But the diversity existed only on the streets. As soon as people entered their offi ce
Murr_9780307453426_3p_01_r1.e.indd 73Murr_9780307453426_3p_01_r1.e.indd 73 11/21/11 2:55 PM11/21/11 2:55 PM

74 Coming Apart
buildings or their apartments, they were surrounded by colleagues and neighbors who were in the top few centiles of education and income.
Newton, Iowa
Eleven hundred miles west of Manhattan, and another world away, is Newton, Iowa. In 1960, the census listed Newton’s population as 15,381. It was the home of the Maytag Company, the washing ma-chine manufacturer, ranked 326 that year in the Fortune 500 list of America’s largest corporations.
We don’t have educational and income data for the rich part of Newton in 1960 or 2000, because it was too small to have a census tract of its own. But Newton had affl uent people— the Maytag Com-pany paid its executives well— and southwest Newton was where al-most all of them lived, including Fred Maytag II. His house was larger than others in southwest Newton, but not by a lot. It was notable mostly because it had a swimming pool.
Within three blocks of Fred Maytag’s home in each direction lived the owner of the second- largest company in town (the Vernon Com-pany), several Maytag executives, several physicians and attorneys, the publisher of the local newspaper, and two owners of local auto dealerships. Other residents within that three- block radius were the sheriff, whose wife gave piano lessons, the city employee who ran the town’s waterworks, a couple of insurance agents, the proprietors of a drugstore, a dry- goods store, and a lumberyard, the high school band teacher, and many low- level white- collar workers and factory work-ers.13 There was also the dilapidated house of a recluse known as Over the River Charlie, who kept chickens in his backyard.
Newton was my boyhood home, which I remember fondly, but the description of the people who lived within three blocks of Fred May-tag II is a factual statement of the mix of people in the affl uent part of a town that contained one of the fi ve hundred largest corporations in the country. It is a description that could be matched by many Ameri-can towns and small cities that were home to industrial corporations as of 1960.
Murr_9780307453426_3p_01_r1.e.indd 74Murr_9780307453426_3p_01_r1.e.indd 74 11/21/11 2:55 PM11/21/11 2:55 PM

A New Kind of Segregation 75
Forty years later, Maytag was still on the Fortune 500, at number 368. The corporate headquarters and the plants for manufacturing washing machines and dryers remained in Newton. But things had changed. The new president of the company had decided to live in an affl uent neighborhood of Des Moines, thirty- six miles to the west, and other senior executives had followed his example. Those who re-mained in Newton congregated in high- end housing developments that were populated exclusively by people who could afford to buy the large homes in them, which meant no factory workers, no low- level white- collar workers, and no high school band teacher. Fewer senior executives showed up at the local Rotary and Kiwanis Club meetings, and they were less likely to serve on civic boards or charitable drives. Their spouses were not as active in Newton’s school affairs and church affairs. Their children were less likely to attend Newton’s public schools.
During the 1980s and 1990s, Maytag also found it increasingly dif-fi cult to attract top executive talent. In 1960, most of Maytag’s exec-utives had grown up in midwestern towns like Newton. In 2000, Maytag was competing for executive talent with corporations that hired from around the nation, and few of the people who were being recruited wanted to live even in Des Moines, Iowa’s big city, let alone in a town of 15,000 surrounded by cornfi elds.
Elite Neighborhoods and the SuperZips
In different ways, Austin, Manhattan, and Newton all experienced the secession of the successful. But the essence of the change was not geographic separation. Yes, the new wealthy housing developments in west Austin were farther away from downtown Austin than the rich-est parts of Austin had been in 1960, and the Maytag executives liv-ing in Des Moines were certainly farther away from downtown Newton than their predecessors had been. But usually the differences between 1960 and 2000 were ones of density and resources within neighborhoods that had been “the best part of town” for decades.
Murr_9780307453426_3p_01_r1.e.indd 75Murr_9780307453426_3p_01_r1.e.indd 75 11/21/11 2:55 PM11/21/11 2:55 PM

76 Coming Apart
The Traditional Elite Neighborhoods
America has neighborhoods that have been famous for a century: places like the Upper East Side in New York, Beacon Hill in Boston, and the North Shore of Chicago. To illustrate the magnitude of the change in density of advanced education and the magnitude of income that oc-curred over the last half century, I assembled data on median family income and percentage of adults with college degrees for fourteen of the most famous “best parts of town” in 1960, and what had happened to those same indicators by 2000. The results are shown in table 3.1.
All fourteen of these elite neighborhoods tell the same story. In 1960, college graduates were still a minority, usually a modest minor-ity, in even the most elite places in the United States. Only Beverly Hills had a median family income greater than $100,000. Over the next forty years, these places, already fashionable in 1960, were in-fused with new cultural resources in the form of college graduates and more money to pay for the tastes and preferences of an upper class. These infusions were not a matter of a few percentage points or a few thousand dollars. The median income in these fourteen elite towns and neighborhoods went from $84,000 to $163,000—almost doubling. The median percentage of college graduates went from 26 percent to 67 percent— much more than doubling.
The Serendipitous Merits of Using 2000 Census Data
All of the zip code data in this chapter must be based on the 2000
census, because socioeconomic data on zip codes for the 2010 cen-
sus were not released before this book went to press. I plan to add
the 2010 values in any subsequent edition of Coming Apart. But in
some ways, using the 2000 census has an advantage. I believe that
the segregation of the new upper class will prove to be more ex-
treme in 2010 than it was in 2000, but it was already extreme in
2000. The consequences of the segregation of the new upper class
are not something for us to worry about in the future; these conse-
quences have been working their way through our society for many
years even now. The 2000 census numbers help make that point.
Murr_9780307453426_3p_01_r1.e.indd 76Murr_9780307453426_3p_01_r1.e.indd 76 11/21/11 2:55 PM11/21/11 2:55 PM

TABLE 3.1. ELITE PLACES TO LIVE IN 1960 AND WHAT HAPPENED
TO THEM BY 2000
Median percentage Median income of adults with (000s of college degrees 2010 dollars)
1960 2000 1959 1999
New York
The Upper East Sidea 23 75 $55 $183
Lower Westchester Countyb 25 58 $87 $155
The Connecticut Corridorc 27 65 $90 $191
Boston
Brookline 21 77 $69 $124
The Western Suburbsd 27 70 $75 $157
Philadelphia
The Main Linee 25 64 $83 $140
Washington, DC
Northwest Washingtonf 35 79 $88 $172
Lower Montgomery Countyg 42 77 $94 $176
McLean/Great Falls 26 74 $74 $180
Chicago
The North Shoreh 32 68 $95 $152
Los Angeles
Beverly Hillsi 19 56 $115 $158
San Francisco
Lower Marin Countyj 26 69 $64 $158
Burlingame/Hillsborough 21 54 $89 $144
The Palo Alto Areak 28 65 $72 $157
Total 26 67 $84 $163
Sources: Bogue fi le of 1960 Census Tracts and 2000 Census zip code data from American
FactFinder on the Census Bureau website.
a. From Central Park to the East River between Fifty- Ninth Street and Ninety- Sixth Street.
b. Eastchester, Greenburgh area, Harrison, Mamaroneck, Pelham, Rye (town and city),
Scarsdale.
c. Darien, Greenwich, New Canaan, North Stamford, Westport.
d. Concord, Lexington, Needham, Newton, Newton Centre, Newton Highlands, Newton
Lower Falls, Newton Upper Falls, Newtonville, Sudbury, Wayland, Wellesley, Wellesley Hills,
Weston.
e. Ardmore, Bala Cynwyd, Berwyn, Bryn Mawr, Devon, Gladwyne, Haverford, Malvern,
Merion, Narberth, Paoli, Villanova, Wayne, Wynnewood.
f. The neighborhoods west of Rock Creek Park.
g. Potomac and the Maryland portions of Bethesda and Chevy Chase.
h. Evanston, Glencoe, Kenilworth, Wilmette, Winnetka.
i. Except for Beverly Hills, census tracts where the wealthy lived in Los Angeles have
changed enough that reconstructing comparable neighborhoods for 1960 and 2000 was
not possible.
j. Mill Valley, Sausalito, Tiburon.
k. Atherton, Los Altos, Menlo Park, Palo Alto, Portola Valley, Stanford.
Murr_9780307453426_3p_01_r1.e.indd 77Murr_9780307453426_3p_01_r1.e.indd 77 11/21/11 2:55 PM11/21/11 2:55 PM

78 Coming Apart
How important are these relatively few elite towns and urban neighborhoods? Hugely so— precisely because they are so few, and yet home to so many in the broad elite and to an even higher propor-tion of the narrow elite.
Defining the SuperZips
The fi rst step in making that point is to convey how radically elite neighborhoods differ from those in the rest of the country. To do so, I created a score combining education and income for each zip code in the country. The method for creating the scores may be found in ap-pendix B.
These scores are expressed as centiles with the same interpretation as the percentile scores on standardized tests. If you were in the 80th percentile on the SAT, only twenty people out of a hundred who took the SAT got a score as high as you did. If you live in a zip code in the 80th centile, only twenty American adults out of a hundred live in a zip code that has as high a combination of education and income as yours does.
The SuperZips are zip codes in the 95th through 99th centiles. I chose that range in part because the top fi ve centiles contain a popu-lation with education and income similar to that of the famous elite neighborhoods shown in table 3.1, with a mean of 63 percent of adults with college degrees and median family incomes of $141,400. An-other consideration is that I want the population in the SuperZips to be big enough to catch a large proportion of the new upper class. The top fi ve centiles have an aggregate population of 9.1 million people ages 25 and older— almost four times the 2.4 million people in my operational defi nition of the new upper class. In all, 882 zip codes qualify as SuperZips.
A Profile of the SuperZips
In appearance, the SuperZips vary widely. A few consist of old man-sions in old neighborhoods. Some consist of developments that have been built since the 1980s, with huge houses, much larger than the
Murr_9780307453426_3p_01_r1.e.indd 78Murr_9780307453426_3p_01_r1.e.indd 78 11/21/11 2:55 PM11/21/11 2:55 PM
A New Kind of Segregation 79
traditional mansion, fi tted out with every accoutrement that owners with unlimited budgets can think of. Many of these developments are gated or guarded by private security forces, visibly set off from the rest of the area. But a great many of the SuperZips are not visually imposing or set off. The housing stock in Chevy Chase mentioned in the prologue is typical of many. The housing stock mostly dates from the fi rst half of the twentieth century. Many of these homes have re-cently been enlarged to the limits of their small lots, but others have an unchanged footprint and are no more imposing than homes in zip codes without nearly the wealth of a SuperZip. But even a modest Chevy Chase home can sell for several hundred thousand dollars— just because it is in Chevy Chase.
By defi nition, most of the people who live in SuperZips are affl uent and well educated. They have other advantages as well. Previewing trends for the upper- middle class as a whole that I will present in de-tail in part 2, inhabitants of SuperZips are more likely to be married than elsewhere, less likely to have experienced divorce, and less likely to have children living in households with single mothers. The men in SuperZips are more likely to be in the labor force than other Ameri-can men and less likely to be unemployed. They also work longer hours than other Americans. Crime in urban SuperZips is low, and crime in suburban SuperZips is rare.
One of the most distinctive aspects of the SuperZips is their ethnic profi le. As of 2000, the 882 SuperZips were substantially whiter and more Asian than the rest of America. Inhabitants of SuperZips were 82 percent white compared to 68 percent of Americans who don’t live in SuperZips. Asians constituted 8 percent of the population of SuperZips, compared to 3 percent of Americans who don’t live in SuperZips. Meanwhile, blacks and Latinos each constituted just 3 percent of the SuperZip population, compared to 12 and 6 percent, respectively, in the rest of the zip codes.14
The 2010 census, which will be available when you read this, will provide a revealing update on how the SuperZips are evolving. Asian Americans have long been represented in elite colleges far beyond their proportion in the population, even though they suffer a system-atic disadvantage in the admissions process, and in recent years they
Murr_9780307453426_3p_01_r1.e.indd 79Murr_9780307453426_3p_01_r1.e.indd 79 11/21/11 2:55 PM11/21/11 2:55 PM
80 Coming Apart
have been joined by growing numbers of top South Asian students.15 Given the relationship between attendance at elite colleges and the likelihood of living in SuperZips to be described presently, there is every reason to think that Asian representation in the SuperZips grew signifi cantly in the 2000s. But Asians have since the 1960s been seen by whites as “honorary whites,” in sociologist Andrew Hacker’s sar-donic phrase, and an increase in the proportion of Asians in the Super Zips will not change the degree to which the composition of the SuperZips is strikingly at odds with what’s going on everywhere else.16 As I write, about one out of ten American counties has a majority of minorities. The early releases of 2010 census data revealed that Lati-nos now constitute 16 percent of the population and blacks 13 per-cent.17 The year 2010 probably marked the point at which births to white women were a minority of all births. Whites will become a minority of the American population by midcentury if not sooner. But, as of 2000, these historic changes had not intruded upon the SuperZips.
If you want to do a quick check on how much things have changed since 2000, use the American FactFinder tool at the Bureau of the Census website to see what the 2010 racial composition was in these half- dozen SuperZips, all of which matched the average of 82 percent white in 2000: 02461 (Newton Highlands, MA), 10583 (Scarsdale, NY), 20007 (Georgetown, DC), 60657 (Downtown Chicago, IL), 90212 (Beverly Hills, CA), and 94301 (Palo Alto, CA).18
The Zip Codes Where the New Upper Class Lives
I have not yet established that the new upper class actually lives in the SuperZips. There are two main possibilities. The fi rst is that I’m wrong to think that the new upper class congregates in such a narrow stratum of American neighborhoods. People in the new upper class look for neighborhoods that they like for idiosyncratic reasons. They want a neighborhood with nice houses and people in a roughly similar socioeconomic bracket, but they sort themselves into prosperous zip codes that are attractive to them for specifi c reasons such as the length of the commute to their job or the quality of the local schools.
Murr_9780307453426_3p_01_r1.e.indd 80Murr_9780307453426_3p_01_r1.e.indd 80 11/21/11 2:55 PM11/21/11 2:55 PM

A New Kind of Segregation 81
They are willing to trade off being at the top of the income/education ladder in return for these other qualities. The second possibility is that members of the new upper class act as if they are attracted to a single overriding criterion, that the neighborhood be fi lled with peo-ple as rich and smart as possible. And, for the most part, that appears to be what is happening.
To make that point anecdotally, I will continue using the metro-politan area I know best, Washington, DC, and its environs, home to almost all of the nation’s narrow elite in the political and policy- making worlds plus many of the narrow elite in the news media.
If you are invited to a dinner party at the home of a member of Washington’s narrow elite, the address could conceivably be in Great Falls, Old Town Alexandria, a few neighborhoods in Arlington or Falls Church, or on Capitol Hill, but it would be a surprise if it were. Given only the knowledge that your host is a member of the narrow elite, you can lay big odds that the address will be in Georgetown, the rest of Northwest Washington, Bethesda, Chevy Chase, Potomac, or McLean.
Those communities contain thirteen zip codes.19 All of them are SuperZips, but that’s just the beginning. As of 2000, eleven of those zip codes were in the 99th centile. And not just any part of the 99th centile. Ten of the eleven were in the top half of the 99th centile— places with combinations of education and income shared by fewer than fi ve out of every thousand Americans. The other three zip codes among the thirteen had centile scores of 99.4, 98.9, and 98.8.
The neighborhoods I named for the dinner party were not chosen on the basis of their zip codes’ centiles. For someone who has been involved in the political or public policy worlds of Washington, those are just the obvious, everybody- knows- that places where the most infl uential people in Washington live— and those places turn out to be not just SuperZips, but usually in the top half of the top centile.
A more systematic way of identifying where the most successful members of the new upper class live is provided by the profi les of graduates of the Harvard Business School’s class of 1979 published for the class’s twenty- fi fth reunion in 2004.
In 2004, members of the Harvard Business School’s class of 1979
Murr_9780307453426_3p_01_r1.e.indd 81Murr_9780307453426_3p_01_r1.e.indd 81 11/21/11 2:55 PM11/21/11 2:55 PM
82 Coming Apart
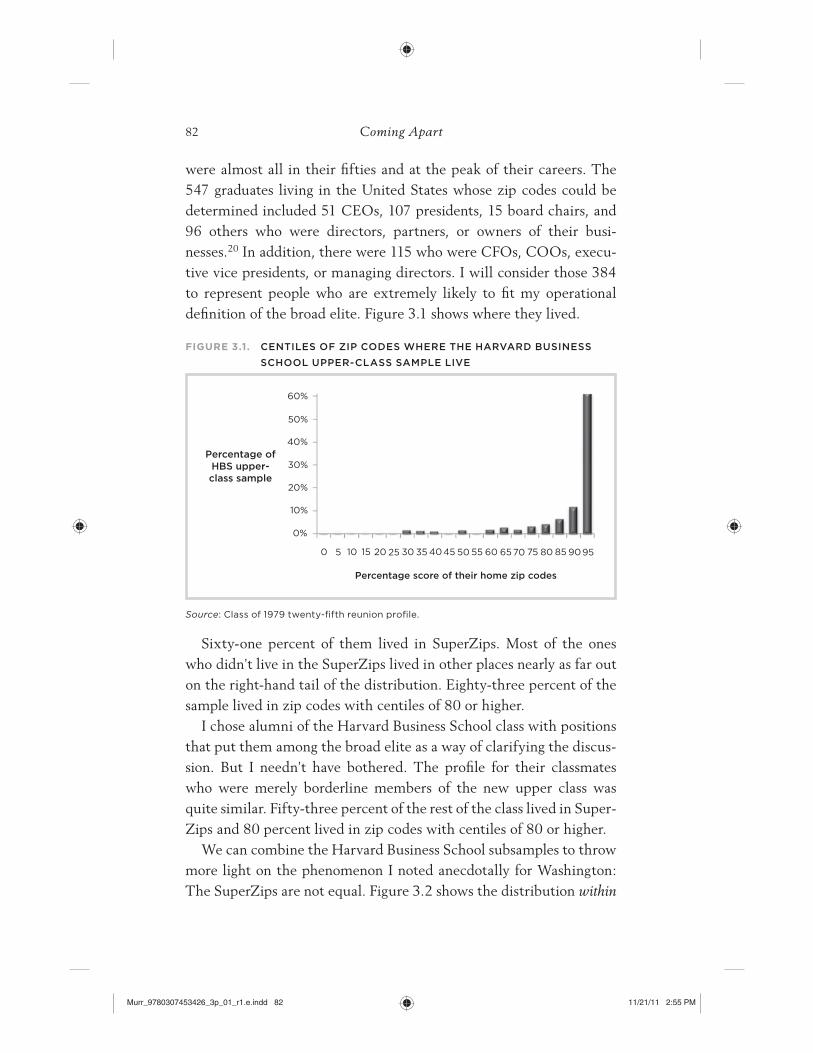
were almost all in their fi fties and at the peak of their careers. The 547 graduates living in the United States whose zip codes could be determined included 51 CEOs, 107 presidents, 15 board chairs, and 96 others who were directors, partners, or owners of their busi-nesses.20 In addition, there were 115 who were CFOs, COOs, execu-tive vice presidents, or managing directors. I will consider those 384 to represent people who are extremely likely to fi t my operational defi nition of the broad elite. Figure 3.1 shows where they lived.
Sixty- one percent of them lived in SuperZips. Most of the ones who didn’t live in the SuperZips lived in other places nearly as far out on the right- hand tail of the distribution. Eighty- three percent of the sample lived in zip codes with centiles of 80 or higher.
I chose alumni of the Harvard Business School class with positions that put them among the broad elite as a way of clarifying the discus-sion. But I needn’t have bothered. The profi le for their classmates who were merely borderline members of the new upper class was quite similar. Fifty- three percent of the rest of the class lived in Super-Zips and 80 percent lived in zip codes with centiles of 80 or higher.
We can combine the Harvard Business School subsamples to throw more light on the phenomenon I noted anecdotally for Washington: The SuperZips are not equal. Figure 3.2 shows the distribution within
Percentage ofHBS upper-class sample
Percentage score of their home zip codes
60%
50%
40%
30%
20%
10%
0%
0 5 10 15 20 25 30 35 4045 50 55 60 6570 75 80 85 9095
FIGURE 3.1. CENTILES OF ZIP CODES WHERE THE HARVARD BUSINESS
SCHOOL UPPER- CLASS SAMPLE LIVE
Source: Class of 1979 twenty- fi fth reunion profi le.
Murr_9780307453426_3p_01_r1.e.indd 82Murr_9780307453426_3p_01_r1.e.indd 82 11/21/11 2:55 PM11/21/11 2:55 PM

A New Kind of Segregation 83
the top fi ve centiles of the 61 percent of the Harvard Business School sample who lived in SuperZips.
Remember that the highly successful families buying homes in these elite zip codes didn’t have a key matching neighborhoods with centiles that they could consult— it’s not like rich people who can go into a wine store with the latest issue of Wine Advocate and buy only wines that Robert Parker scored 99 or 100. Rather, they were looking for something that was consistently satisfi ed by something that the centile score taps into. It was something other than the simple wealth of the zip code. Multivariate analysis reveals that the percentage of adults with BAs played at least as important a role as median income in discriminating between zip codes where the new upper class live and where they don’t. That “something” was people like them— affl uent, highly educated, and highly successful. They want to live in the very, very best neighborhoods. The evidence from both Washing-ton’s elite and the Harvard Business School sample reveals how clearly the new upper class can agree upon what the very, very best neigh-borhoods are.
FIGURE 3.2. DISTRIBUTION OF CENTILES WITHIN THE SUPERZIPS
Source: Class of 1979 twenty- fi fth reunion profi le.
Percentageof the HBS
sample living in
SuperZips
Percentile score oftheir home zip codes
0%
10%
20%
30%
40%
50%
60%
95 96 97 98 99
Murr_9780307453426_3p_01_r1.e.indd 83Murr_9780307453426_3p_01_r1.e.indd 83 11/21/11 2:55 PM11/21/11 2:55 PM

84 Coming Apart
The SuperZips Where Overeducated Elitist Snobs Live
On my former block in Washington DC were my next door neigh-
bors (Princeton ’57 and Radcliffe ’66), the folks next to them
(both Harvard ’64) and the people across the street (Yale ’71 and
Yale Law ’74), plus me (Harvard ’66 and Yale Law ’69). Just a
typical American neighborhood, in other words.
Michael Barone
Email to the author
The culture of the new upper class carries with it an unmistakable whiff of a “we’re better than the rabble” mentality. The daily yoga and jogging that keep them whippet- thin are not just healthy things for them to do; people who are overweight are less admirable as people. Deciding not to recycle does not refl ect just an alternative opinion about whether recycling makes sense; it is inherently irresponsible. Smokers are not to be worried about, but to be held in contempt.
The people who suffer from this syndrome have been labeled by many other Americans as overeducated elitist snobs. The OES syn-drome does not manifest itself like Margaret Dumont playing society lady to Groucho Marx. Overeducated elitist snobs may even be self- deprecating about their cultural preferences. They just quietly believe that they and their peers are superior to the rest of the popu-lation, intellectually and in their nuanced moral sensibility.
No external marker lets us defi ne exactly who in the new upper class does and does not fi t this indictment. Those who suffer from the OES syndrome tend to have high IQs, but lots of people with high IQs happily munch on double quarter- pounders with cheese and think that recycling is a farce. In my own experience, political ideol-ogy is not a reliable guide— I have found condescension toward the rabble among new- upper- class liberals and conservatives alike.
So we have to fi nd a proxy measure: some population that is not defi ned by possessing the OES syndrome, but that is disproportion-ately dense with people suffering from it. I propose to use graduation from an elite college. To my fellow alumni of such schools, most of whom are fi ne people and who will understandably bridle at this, let
Murr_9780307453426_3p_01_r1.e.indd 84Murr_9780307453426_3p_01_r1.e.indd 84 11/21/11 2:55 PM11/21/11 2:55 PM
A New Kind of Segregation 85
me appeal to you: I’m not talking about all of us, or even most of us (I hope). I’m just saying that the OES syndrome is more densely found in the population of people who graduate from elite colleges than in the college- educated population at large.
Such a relationship is plausible for several reasons. First comes self- selection. Eighteen- year- olds do not end up at Duke or Yale by accident. They have to try hard to be there. In other words, most of them badly wanted as teenagers to be part of an elite institution, with all the implications that attraction to eliteness carries with it.
Second, they are only eighteen years old or thereabouts when they are admitted. They arrive on campus at an impressionable age, eager to fi t in with whatever goes along with being a full- fl edged member of that elite institution.
Third, the intense competition for admission to elite schools cre-ates a powerful sense of validation. If you’ve gotten in, you’re special, they say to themselves.
Fourth, as demonstrated in chapter 2, high proportions of those who get into elite schools have come from upper- middle- class back-grounds. They have already been socialized into the tastes and prefer-ences of the upper- middle class, with little experience of any other realm of American life. They’re more than halfway toward the OES syndrome when they arrive.
Fifth, the culture on elite campuses is intensely Bobo- like. David Brooks’s discussion of what he called the “educated class” is saturated with examples associated with elite schools and their graduates, and rightly so.21
And so I am interested in seeing where the graduates of elite schools migrate as adults as an indirect measure of where the OES syndrome is most likely to be found.
The primary database I used for this exercise consists of the home zip codes of 14,317 graduates of Harvard, Princeton, and Yale (HPY, for convenience). The years to which the data apply range from 1989 to 2010, when almost all of the subjects were somewhere from ages 39 through 53.22 The secondary database consists of 1,588 graduates of Wesleyan University, an elite school below the iconic level of HPY, who graduated during the 1970s and whose home zip codes were
Murr_9780307453426_3p_01_r1.e.indd 85Murr_9780307453426_3p_01_r1.e.indd 85 11/21/11 2:55 PM11/21/11 2:55 PM

86 Coming Apart
obtained as of 1996, when almost all of them ranged in age from 38 to 47. The sources of the data are alumni directories and class anni-versary volumes borrowed from graduates of those schools.
As mature adults, fully a quarter of the HPY graduates were living in New York City or its surrounding suburbs. Another quarter lived in just three additional metropolitan areas: Boston (10 percent), Washington (8 percent), and San Francisco (7 percent). Relative to the size of their populations, the Los Angeles and Chicago areas got few HPY graduates— just 5 percent and 3 percent, respectively. Ex-cept for the Philadelphia and Seattle areas, no other metropolitan area got more than 1 percent.
Even though I didn’t screen the sample for achieved success— just graduating from Harvard, Princeton, or Yale was enough— these alumni lived in zip codes nearly as exclusive as those of the Harvard Business School sample. Figure 3.3 replicates the graph I showed in fi gure 3.1, using the same scale for the vertical axis, but this time using the entire HPY sample.
The zip codes for all HPY graduates are not quite as exaggerated as those of the upper- class sample of the Harvard Business School, but almost. Forty- four percent of them lived in SuperZips; 74 percent of them lived in zip codes at the 80th centile or higher.
Percentageof the HPY
sample
Percentile score of their home zip codes
60%
50%
40%
30%
20%
10%
0%
0 5 10 15 20 25 30 35 40 45 50 55 60 65 70 75 80 85 9095
FIGURE 3.3. CENTILES OF ZIP CODES WHERE GRADUATES OF HARVARD,
PRINCETON, AND YALE LIVE
Sources: Various class directories.
Murr_9780307453426_3p_01_r1.e.indd 86Murr_9780307453426_3p_01_r1.e.indd 86 11/21/11 2:55 PM11/21/11 2:55 PM

A New Kind of Segregation 87
The data from the HPY sample are even more startling than those from the Harvard Business School sample. Everyone in fi gure 3.1 was a CEO, a CFO, or held some similarly elevated position that meant with-out doubt that they had enough money to live wherever they chose. But not everyone who enters Harvard, Princeton, or Yale at age 18 ends up a fi nancial success. Many fail to accomplish much in life, and others choose to go into low- paying professions. Figure 3.3 includes all of them. That it is possible to select a sample exclusively on the basis of whether they were admitted to Harvard, Princeton, or Yale as a teen-ager, knowing nothing else whatsoever about what became of them, and produce the extreme concentration of those people in SuperZips when they were in their forties is remarkable on many counts.
If we were talking about only these three universities, these fi nd-ings would be trivial. But there is no reason to think that the results are going to be much different for the other schools at the summit, such as Columbia, Stanford, or Duke. This brings us to the sample of Wesleyan graduates. In the most recent U.S. News college rankings, Wesleyan was ranked number 12 among liberal arts colleges— defi nitely elite, but, adding in the top national universities (a separate list from the liberal arts colleges), it is fair to say that Wesleyan is not at the summit. But look at fi gure 3.4, the third replication of the graph pre-viously shown for the Harvard Business School upper- class sample and the HPY graduates, this time based on the Wesleyan graduates.
Percentageof the
Wesleyansample
Percentile score of their home zip codes
60%
50%
40%
30%
20%
10%
0%
0 5 10 15 20 25 30 35 40 45 50 55 60 65 70 75 80 85 9095
FIGURE 3.4. CENTILES OF ZIP CODES WHERE GRADUATES OF
WESLEYAN LIVE
Source: Wesleyan University Alumni/ae Directory 1996.
Murr_9780307453426_3p_01_r1.e.indd 87Murr_9780307453426_3p_01_r1.e.indd 87 11/21/11 2:55 PM11/21/11 2:55 PM

88 Coming Apart
Thirty- one percent of Wesleyan graduates were living in SuperZips, and 65 percent were living in zip codes at the 80th centile or higher. It would appear that the college sorting machine replicates itself with remarkable fi delity as a residential sorting machine. The hypothesis this suggests— testing it would push this exercise much further than appropriate for the purposes of this book— is that the rank order of colleges by mean SAT scores would be just about the same if ordered by the mean zip code centile of their graduates. If this is the case, then, ceteris paribus, the higher the centile of the SuperZip, the more densely it is populated by graduates of elite colleges and, by extension, the more densely it is populated by overeducated elitist snobs. I en-courage others to explore this hypothesis empirically.
As for the phenomenon noted for the Washington elite and the Harvard Business School sample— within the SuperZips, the new upper class clusters at the highest possible centile— a graph based on the alumni from elite schools closely resembles fi gure 3.2. Among those alumni who lived in SuperZips, 9 percent were in zip codes at the 95th centile, 11 percent in the 96th, 15 percent in the 97th, 23 percent in the 98th, and 42 percent in the 99th.
The Elite Bubbles
If the SuperZips were islands bordered by reasonably ordinary neigh-borhoods, the segregation of the new upper class from everyone else would be mitigated. But they are not islands.
Recall the principal habitats of the Washington narrow elite— Georgetown, the rest of Northwest Washington, Bethesda, Chevy Chase, Potomac, and McLean. The thirteen zip codes represented by those names are nested within cocoons. Seven of them are completely surrounded by a combination of one another, the Potomac River, and Rock Creek Park. The other six have at least one border with a zip code outside the magic circle. The outsider borders for McLean are zip codes with centile scores of 99, 99, 93, and 98. The outsider zip code bordering Georgetown has a centile score of 99. For Bethesda, the bordering outsider zip codes have scores of 96, 99, and 97. The
Murr_9780307453426_3p_01_r1.e.indd 88Murr_9780307453426_3p_01_r1.e.indd 88 11/21/11 2:55 PM11/21/11 2:55 PM

A New Kind of Segregation 89
outsider zip codes that border Potomac have scores of 96, 96, 97, plus two other zip codes, both rural areas with centiles of merely 91 and 89, the far northwest nub of Potomac’s zip code 20854, several miles after leaving Potomac’s residential areas behind.
The map in fi gure 3.5 shows the zip codes in and surrounding the District of Columbia. The zip codes in black are SuperZips, in the top fi ve centiles. Dark gray indicates zip codes that just barely missed qualifying as SuperZips, at the 90th–94th centiles. Light gray is for zip codes that may not be elite by the rarefi ed standard I am using, but are far above average for the nation as a whole, at the 80th–89th centile. Unshaded zip codes are somewhere below the 80th centile.
FIGURE 3.5. SUPERZIP CLUSTERS AROUND WASHINGTON, DC
Black: SuperZips. Dark gray: zip codes in the 90th–94th centiles. Light gray: zip codes in the
80th–89th centiles. Unshaded: below the 80th centile.
Murr_9780307453426_3p_01_r1.e.indd 89Murr_9780307453426_3p_01_r1.e.indd 89 11/21/11 2:55 PM11/21/11 2:55 PM

90 Coming Apart
The size of the SuperZip clusters around Washington is the most obvious feature of the map. In all, 931,512 adults ages 25 and older lived in those black zip codes in 2000. The clustering is even more important than the population. Notice how many of the black zip codes are contiguous.23 Notice also how many of the zip codes bor-dering on the SuperZips are dark gray, meaning that they are nearly as affl uent and well educated as the SuperZips— and conversely, how rarely are the SuperZips bordered by a white zip code that is below the 80th centile. The map seems to indicate that Northwest Washington is not so isolated in that regard, but that’s an illusion. Along the border between the SuperZips in Northwest Washington and the nonelite bordering zip codes is Rock Creek Park, which separates the homes in the elite part of Northwest DC from every-one else with the broad, forested expanse through which Rock Creek runs.
The map’s real shock for readers who are familiar with Washington will be some of the places that qualify as SuperZips. To someone who lives in the fashionable neighborhoods of Washington, communities such as Gaithersburg, Springfi eld, Chantilly, and Ellicott City are seen as unexceptional middle- class and upper- middle- class suburbs. But in fact the people in those zip codes have a combination of educa-tion and income higher than that enjoyed by all but 5 percent of other Americans. The main features of the new- upper- class culture prevail as widely in those SuperZips as they do in McLean or Georgetown, just on a less expensive scale.
The Washington area has the two critical conditions for the estab-lishment of clusters in which the culture of the new upper class can fl ourish— a suffi ciently large population of new- upper- class members and geographic contiguity of the neighborhoods where they live. Of what other parts of the United States may that be said?
Suppose we defi ne a cluster as contiguous SuperZips.24 In that case, Washington had the largest cluster in the country. As indicated in fi g-ure 3.5, it is possible to go from Ellicott City in the north to Spring-fi eld in the south without setting foot outside SuperZips, a cluster containing 827,746 adults in the 2000 census, 89 percent of all peo-ple in SuperZips in the Washington area.
Murr_9780307453426_3p_01_r1.e.indd 90Murr_9780307453426_3p_01_r1.e.indd 90 11/21/11 2:55 PM11/21/11 2:55 PM

A New Kind of Segregation 91
The New York City area had the most people in SuperZips, though none of the individual clusters was as large as Washington’s. Uptown Manhattan was by far the densest cluster, with 486,222 adults in Super Zips bordering the east, south, and west sides of Central Park. A triangle in north- central New Jersey bounded roughly by South Orange, Westfi eld, Annandale, Long Valley, and Mountain Lakes contained 314,189 adults. Another 246,709 adults lived in suburbs in Connecticut and New York roughly bounded by Greenwich, Granite Springs, Redding, and Westport. SuperZips along Long Island Sound had 194,725 adults. The Westchester area made up a cluster of 119,986 adults.
The third- largest aggregate population after New York and Wash-ington is in the San Francisco area, which had four large SuperZip clusters. Downtown San Francisco had 118,555 adults in contiguous SuperZips plus other singletons. The area to the east of San Francisco, bounded roughly by Berkeley, Clayton, and Castro Valley, had 227,322 adults. Marin County had a cluster consisting of 75,583 adults. The biggest cluster in the greater San Francisco area is superimposed on Silicon Valley. It starts with Burlingame, a wealthy San Francisco sub-urb, and wends its way south through Palo Alto to Sunnyvale, enclos-ing SuperZips with 422,907 adults— the third- largest cluster in the country after Washington and Uptown Manhattan.
These clusters still don’t completely capture the degree to which much of the new upper class lives in a world far removed from ordi-nary America. The clusters are defi ned by contiguous zip codes that are in the 95th centile. But a SuperZip usually borders several zip codes—four, on average— and only one of those need be another Super Zip to keep the cluster going. What is the average centile of all zip codes bordering the SuperZips? A very high 86. Even when a bor-dering zip code is not a SuperZip, it is likely to be nearly as affl uent and highly educated.
Specifi cally, the average centile for people living in the zip codes bordering the SuperZips was at least 90 for 48 percent of them and 80 to 89 for another 30 percent. Another 13 percent had neighboring zip codes whose centiles averaged from 70 to 79, still well above the national average. Only 7 percent of the adults living in SuperZips
Murr_9780307453426_3p_01_r1.e.indd 91Murr_9780307453426_3p_01_r1.e.indd 91 11/21/11 2:55 PM11/21/11 2:55 PM

92 Coming Apart
bordered on zip codes averaging centiles of 50 to 69, and a minuscule 2 percent of them bordered on zip codes inhabited by Americans who averaged anywhere below the 50th centile.
The result is that people who live in small towns, apparently in the countryside, can actually be part of a large new- upper- class city— it just happens to be a city with a really, really low population density. Take, for example, zip code 01778, centile 99, which serves Wayland, Massachusetts, fi fteen miles west of Boston. Wayland has a popula-tion of just 13,100. It is a pretty little town, and you drive through sparsely populated countryside to any of the adjacent towns. It doesn’t look like an elite bubble worth worrying about. But bordering Way-land are the zip codes for Weston (centile 99), Sudbury (99), Natick (94), Lincoln (99), and the eastern zip code for Framingham (93). The next circle of zip codes beyond the adjacent ones include Welles-ley (99), Wellesley Hills (99), Dover (99), Needham (99), Sherborn (99), Acton (99), Carlisle (99), Southborough (99), Concord (99), Lexington (99), North Sudbury (98), Bedford (97), Auburndale (98), and Newton Lower Falls (95). Add in this additional set, and Wayland is cocooned among 259,100 people with similarly exalted education and income— a population that would rank Greater Way-land as the sixty- ninth-largest city in the country.
These very large, very well- buffered SuperZip clusters are rare. Just how rare is quickly conveyed by the map in fi gure 3.6 showing the location of all the SuperZips.
The fi rst thing to emphasize about the map in fi gure 3.6 is all the white space interspersed with a black dot or two. Of all the clusters of SuperZips, 64 percent consist of a single zip code surrounded by others that are not SuperZips. Furthermore, the neighboring zip codes are much closer to normal than the SuperZip in their midst. Among the 80 percent of the SuperZips that were in clusters of three or fewer, the av-erage centile of the adjacent zip codes was 77—still in the top quartile of the American population, but representing neighborhoods with a lot of variety. In other words, about 80 percent of the SuperZips do not represent the kind of elite bubble, isolated from the rest of America, that I have been describing. The problem is that this 80 percent of
Murr_9780307453426_3p_01_r1.e.indd 92Murr_9780307453426_3p_01_r1.e.indd 92 11/21/11 2:55 PM11/21/11 2:55 PM

FIG
UR
E 3
.6.
TH
E N
AT
ION
AL
DIS
TR
IBU
TIO
N O
F P
EO
PL
E W
HO
LIV
E I
N S
UP
ER
ZIP
S
So
urc
e: 2
00
0 c
en
sus
zip
co
de d
ata
fro
m A
me
ric
an
Fa
ctF
ind
er
on
th
e C
en
sus
Bu
rea
u w
eb
site
. “A
du
lts”
re
fers
to
pe
rso
ns
ag
e 2
5 a
nd
old
er.
Th
e s
ma
lle
st p
op
ula
tio
n v
isib
le o
n t
he s
ca
le u
sed
fo
r th
e m
ap
is
ab
ou
t 5
,00
0 a
du
lts,
me
an
ing
th
at
ab
ou
t
41,
00
0 a
du
lts
(0.4
pe
rce
nt
of
all p
ers
on
s in
Su
pe
rZip
s) liv
ed
in
Su
pe
rZip
s n
ot
vis
ible
on
th
e m
ap
.
Murr_9780307453426_3p_01_r1.e.indd 93Murr_9780307453426_3p_01_r1.e.indd 93 11/21/11 2:55 PM11/21/11 2:55 PM

94 Coming Apart
SuperZips contains only 21 percent of the people who live in SuperZips. Furthermore, that 21 percent includes few of the people who qualify for the broad elite and almost no one who qualifi es for the narrow elite.
This can be said in part because of the defi nition of both groups. To be a member of the broad elite means being a signifi cant fi gure in a signifi cant city, and about a quarter of the adults living in SuperZip clusters of three or fewer were not part of any of the fi fty largest met-ropolitan areas. To be a member of the narrow elite is even more con-straining. As I noted in the introduction to part 1, it is diffi cult to hold a nationally infl uential job in politics, public policy, fi nance, business, academia, information technology, or the media and not live in the areas surrounding New York, Washington, Los Angeles, or San Fran-cisco. In a few cases, it can be done by living in Boston, Chicago, At-lanta, Seattle, Dallas, or Houston— and Bentonville, Arkansas— but not many other places.25
The Harvard Business School sample and the graduates of elite col-leges who live in SuperZips let us put some numbers to this defi ni-tional necessity. Of the Harvard Business School graduates who held positions that clearly put them in the broad elite, only 8 percent lived in a SuperZip cluster of three or fewer zip codes. The median number of zip codes in their SuperZip clusters was eighteen. Of those who graduated from Harvard, Princeton, or Yale, only 13 percent lived in a SuperZip cluster of three or fewer. The median was fourteen.
Meanwhile, the clusters surrounding the Big Four— New York, Washington, Los Angeles, and San Francisco— accounted for 39 per-cent of all people living in SuperZips. And those are the clusters in which almost all of the narrow elite and a large proportion of the broad elite live—in large bubbles dominated by their own kind.
Red SuperZips and Blue SuperZips
I promised at the end of chapter 1 that I would eventually take up the political orientation of the new upper class. The SuperZips give us a way to do that.
Murr_9780307453426_3p_01_r1.e.indd 94Murr_9780307453426_3p_01_r1.e.indd 94 11/21/11 2:55 PM11/21/11 2:55 PM
A New Kind of Segregation 95
It is widely accepted, with good reason, that the new upper class is more liberal than the rest of the country. The dominance of liberal views among the faculties of elite universities is well documented.26 So are the percentages of journalists in the elite media who are self- identifi ed liberals.27 The liberalism of the fi lm industry is openly proclaimed by its top stars, producers, and directors.28
Furthermore, activist liberalism has become much more wide-spread in the business community over the last few decades, as docu-mented by political scientist David Callahan in Fortunes of Change. It’s not just the well- publicized cases such as George Soros. The new bil-lionaires of the information technology industry are overwhelmingly liberal, and so are large proportions of the billionaires and centimil-lionaires in the fi nancial community.
To some degree, this growth of activist liberals in the business community has happened everywhere. Callahan opens his book with the case of Preston Hollow, the exclusive Dallas neighborhood where George W. Bush moved after leaving offi ce. In 2008, Barack Obama raised more money in Preston Hollow’s zip code than John McCain did.29 But while the increasing leftward dominance of American elites is a fact, it can easily be exaggerated.
The SuperZips and the 2004 Presidential Election
Consider the bitterly contested 2004 presidential election. Some places fi tted the stereotype. The SuperZips in the San Francisco–Silicon Valley corridor gave John Kerry 70 to 80 percent of the vote.30 Moving down the coast to Los Angeles, Kerry got a combined 71 per-cent of the vote in Beverly Hills, Santa Monica, and Malibu. The wealthy suburbs of Boston and the wealthy neighborhoods of Man-hattan gave Kerry more than 70 percent of the vote.
But other places didn’t fi t the stereotype. Outside Beverly Hills, Santa Monica, and Malibu, Kerry didn’t get even a majority in the other wealthy Los Angeles areas for which votes can be broken out. Moving farther south into the wealthy towns of Orange County, Kerry won Laguna Beach but nowhere else, getting a meager
Murr_9780307453426_3p_01_r1.e.indd 95Murr_9780307453426_3p_01_r1.e.indd 95 11/21/11 2:55 PM11/21/11 2:55 PM
96 Coming Apart
combined 35 percent of the vote in Newport Beach, Aliso Viejo, Tus-tin, and Yorba Linda.
On the East Coast, the towns of the new upper class in the Super-Zips surrounding New York City were not particularly blue. Kerry got huge margins in a few of the New Jersey suburbs— Montclair and South Orange gave Kerry larger margins than even the most liberal San Francisco suburbs. But thirty- three of the forty- six wealthy New Jersey towns for which votes could be broken out went for Bush, with Kerry getting just a combined 39 percent of the vote. In the wealthy Connecticut suburbs outside New York City, Kerry won only ten of the eighteen towns for which votes could be broken out. The com-bined vote across all eighteen was 49 percent for Kerry, barely more than his national percentage.
Moving away from the coasts, it becomes impossible to think of the new upper class as being predominantly liberal. For the most part, wealthy neighborhoods in the cities of the Midwest, South, and Southeast are about as conservative as the states in which they are located, and sometimes more so. The entire state of Kansas gave Bush 62 percent of the vote. The wealthy towns of Leawood, Lenexa, Shawnee, and Overland Park each gave more than 70 percent of their vote to Bush.
Austin, Texas, provides an object lesson in the perils of confusing the conspicuous exceptions with the underlying profi le. Austin’s lib-eral neighborhoods are so visible in the life of the city that Austin is known elsewhere in Texas as “the People’s Republic of Austin.” Judg-ing from its description by journalist Bill Bishop (and he lives there), the most liberal zip code (78704) in Austin, Travis Heights, is al-most a caricature of the doctrinaire, politically correct progressive neighborhood.31 Travis Heights gave Kerry 82 percent of the vote in 2004. Its neighbor to the north, just west of the University of Texas campus, went for Kerry with 63 percent of the vote. But the zip code adjoining it to the west, with a higher median income and a higher percentage of college degrees than either of the two liberal zip codes I just mentioned, went for Bush with 61 percent of the vote. The wealthiest zip code in Austin, also with one of the top percentages of the college- educated, went for Bush with 62 percent of the vote. So
Murr_9780307453426_3p_01_r1.e.indd 96Murr_9780307453426_3p_01_r1.e.indd 96 11/21/11 2:55 PM11/21/11 2:55 PM

A New Kind of Segregation 97
it is true that the areas immediately to the south, west, and north of the campus and the Texas state capitol are bastions of intellectual liberalism, just as Austin’s image has it. But that doesn’t mean that all or perhaps even most members of the Austin new upper class are liberal.
Who Represents the SuperZips in Congress?
Presidential votes can be broken out for only some towns and urban neighborhoods. Elections to the House of Representatives offer a more systematic way to characterize the political orientation of the new upper class nationwide.
As the measure of the political orientation of a zip code I used the liberal quotient of its congressional representative. Liberal quotient is the term used by the Americans for Democratic Action (ADA) for the number it calculates for each congressperson in each congres-sional session. The liberal quotient represents the number of correct votes, in the ADA’s view, on key legislation divided by the total num-ber of votes cast by that representative. One hundred is therefore the perfect liberal score and 0 is the perfect conservative score. I averaged the liberal quotients for all representatives for the 108th through 111th Congresses (those elected in 2002, 2004, 2006, and 2008), which, serendipitously, consisted of two each with Republican and Democratic majorities.32
In the pie charts that follow, “doctrinaire liberal” means an average liberal quotient of 90 or more, “liberal” means 75–89, “mixed” means 25–74, “conservative” means 10–24, and “doctrinaire conservative” means 0–9.
First, consider the nation as a whole. From 2002 to 2008, the members of the House of Representatives had a mean liberal quotient of 51.5, just slightly to the left of center, but that may imply more centrism than actually existed. Fifty- seven percent of the representa-tives had liberal quotients at the doctrinaire extremes, either liberal or conservative, and a mere 21 percent had liberal quotients in the great middle range of scores from 25 to 74. Taking all the zip codes in the country, fi gure 3.7 shows how the balance looked when the ADA
Murr_9780307453426_3p_01_r1.e.indd 97Murr_9780307453426_3p_01_r1.e.indd 97 11/21/11 2:55 PM11/21/11 2:55 PM

98 Coming Apart
Doctrinaireliberal, 29%
Liberal, 9%
Mixed, 26%
Conservative,5%
Doctrinaireconservative,
30%
FIGURE 3.8. ADA VOTING RECORDS OF PEOPLE REPRESENTING THE
SUPERZIPS THAT ARE NOT NEAR THE BIG FOUR
Sources: Annual ADA reports. Percentages refer to the aggregate population of the
SuperZips.
scores of the representatives are weighted by the adult population in the zip codes they represented.
Doctrinaireliberal, 31%
Liberal, 11%
Mixed, 21%
Conservative,12%
Doctrinaireconservative,
26%
FIGURE 3.7. ADA VOTING RECORDS OF PEOPLE REPRESENTING ZIP CODES
THAT ARE NOT SUPERZIPS
Source: Annual ADA reports and the zip code data base. Percentages are weighted by zip
code population.
Outside the SuperZips, the nation was almost evenly split, with only a small edge for doctrinaire liberals.
The same balance between liberals and conservatives applies to most of the SuperZips. Figure 3.8 shows the representation for people who live in SuperZips— with one little caveat: It includes all the Super Zips except the ones surrounding the Big Four— New York, Washington, Los Angeles, and San Francisco.
Murr_9780307453426_3p_01_r1.e.indd 98Murr_9780307453426_3p_01_r1.e.indd 98 11/21/11 2:55 PM11/21/11 2:55 PM

A New Kind of Segregation 99
The representatives of the SuperZips outside the Big Four are slightly more polarized than the entire House of Representatives, with 60 percent of the inhabitants being represented by doctrinaire liberals or conservatives. But the doctrinaire representation is equally balanced.
In fi gure 3.9 we look at who represents the people in the SuperZips surrounding the Big Four.
Doctrinaireliberal, 64%
Liberal, 3%
Mixed,14%
Conservative,9%
Doctrinaireconservative,
10%
FIGURE 3.9. ADA VOTING RECORDS OF PEOPLE REPRESENTING THE
SUPERZIPS SURROUNDING THE BIG FOUR
Sources: Annual ADA reports. Percentages refer to the aggregate population of the
SuperZips.
Sixty- four percent of the people living in the SuperZips surround-ing the Big Four are represented by doctrinaire liberals, compared to 19 percent who are represented by a conservative of any stripe. The reason fi gure 3.9 is signifi cant is, of course, that the SuperZips sur-rounding New York, Washington, Los Angeles, and San Francisco are the home of almost all of the narrow elite whose decisions directly affect the economy, politics, and culture of the nation. These are also the SuperZips that are aggregated into the largest and most heavily buffered SuperZip clusters in the nation. The representatives they elect refl ect a component of the new upper class that is just as liberal as its reputation.
Murr_9780307453426_3p_01_r1.e.indd 99Murr_9780307453426_3p_01_r1.e.indd 99 11/21/11 2:55 PM11/21/11 2:55 PM

100100
4
How Thick Is Your Bubble?A new upper class that makes decisions affecting the lives of
everyone else but increasingly doesn’t know much about how
everybody else lives is vulnerable to making mistakes.
How vulnerable are you?
NO V I C E O F the human heart is so acceptable to [a despot] as egotism,” wrote Alexis de Tocqueville. “A despot easily forgives his subjects for not loving him, provided they
do not love each other.” That couldn’t happen in the United States, Tocqueville argued, because of the genius of the founders in devolv-ing power:
Local freedom . . . perpetually brings men together, and forces them to help one another, in spite of the propensities which sever them. In the United States, the more opulent citizens take great care not to stand aloof from the people. On the contrary, they constantly keep on easy terms with the lower classes: they listen to them, they speak to them every day.1
That’s not true anymore. As the new upper class increasingly con-sists of people who were born into upper- middle- class families and have never lived outside the upper- middle- class bubble, the danger increases that the people who have so much infl uence on the course of the nation have little direct experience with the lives of ordinary
Murr_9780307453426_3p_01_r1.e.indd 100Murr_9780307453426_3p_01_r1.e.indd 100 11/21/11 2:55 PM11/21/11 2:55 PM

How Thick Is Your Bubble? 101
Americans, and make their judgments about what’s good for other people based on their own highly atypical lives.
In one sense, there is no such thing as an “ordinary American.” The United States comprises a patchwork of many subcultures, and the members of any one of them is ignorant about and isolated from the others to some degree. The white fi fth- grade teacher from South Boston doesn’t understand many things about the life of the black insur-ance agent in Los Angeles, who in turn doesn’t understand many things about the life of the Latino truck driver in Oklahoma City. But there are a variety of things that all three do understand about the common-alities in their lives— simple things that you have no choice but to un-derstand if you have to send your kids to the local public school, you live in a part of town where people make their living in a hundred different ways instead of a dozen, and you always eat out at places where you and your companion won’t spend more than $50 tops, including tip.
Those specifi cations embrace an extremely large part of the Amer-ican population. Tack on a few other specifi cations—that you watch at least twenty- four hours of commercial television a week (still well below the national average of thirty- fi ve hours) and that you see most of the most popular new movies, either in theaters or on DVDs—and you have guaranteed a substantial degree of common familiarity about the culture as well. So while there is no such thing as an ordi-nary American, it is not the case that most Americans are balkanized into enclaves where they know little of what life is like for most other Americans. “The American mainstream” may be hard to specify in detail, but it exists.
Many of the members of the new upper class are balkanized. Fur-thermore, their ignorance about other Americans is more problem-atic than the ignorance of other Americans about them. It is not a problem if truck drivers cannot empathize with the priorities of Yale professors. It is a problem if Yale professors, or producers of network news programs, or CEOs of great corporations, or presidential advis-ers cannot empathize with the priorities of truck drivers. It is inevi-table that people have large areas of ignorance about how others live, but that makes it all the more important that the members of the new upper class be aware of the breadth and depth of their ignorance.
Murr_9780307453426_3p_01_r1.e.indd 101Murr_9780307453426_3p_01_r1.e.indd 101 11/21/11 2:55 PM11/21/11 2:55 PM
102 Coming Apart
To my knowledge, sociologists haven’t gotten around to asking upper- middle- class Americans how much they know about their fel-low citizens, so once again I must ask you to serve as a source of evi-dence by comparing your own experience to my generalizations. This time, I have a twenty- fi ve- question quiz for you to take.2 I hope it will serve two purposes: fi rst, to calibrate the extent of your own igno-rance (if any); second, to give you a framework for thinking about the ignorance that may be common in your professional or personal cir-cles, even if it doesn’t apply to you.
The questions you should take most seriously are the opening ones that ask about the places you have lived and the variation in condi-tions of life that you have experienced. The ignorance they imply is certain. If you have never lived or worked in a small town, you must be ignorant about day- to- day life in a small town, no matter how many movies set in rural Georgia you’ve seen. If you have never held a job that caused a body part to hurt by the end of the day, you don’t know what that’s like— period.
When I move to informational questions about sports, popular cul-ture, and some American institutions, you are free to complain that some of them aren’t fair. Some questions have a gender bias (though I’ve tried to balance those). Some are sneaky and several poke fun. In no case does an inability to answer refl ect on your intelligence, char-acter, or all- around goodness of heart.
Some of the questions are ones that whites will get right more often than minorities, and that people who do not live in metropo-lises will get right more often than people who do. That’s because I am writing about the problems of the new upper class, the new upper class is overwhelmingly white and urban, and the readers of this book are overwhelmingly white and urban. Note, however, that had I in-cluded questions that would be more easily answered by minorities in working- class urban neighborhoods, your score would probably be even worse.
Unless I specify an age range, the questions apply to experiences that occurred at any point in your life.
Please take out your no. 2 pencil and begin.
Murr_9780307453426_3p_01_r1.e.indd 102Murr_9780307453426_3p_01_r1.e.indd 102 11/21/11 2:55 PM11/21/11 2:55 PM

How Thick Is Your Bubble? 103
The Questions
Life History
1. Have you ever lived for at least a year in an American neighbor-hood in which the majority of your fi fty nearest neighbors prob-ably did not have college degrees?
2. Did you grow up in a family in which the chief breadwinner was not in a managerial job or a high- prestige profession (defi ned as attorney, physician, dentist, architect, engineer, scientist, or col-lege professor)?
3. Have you ever lived for at least a year in an American community under 50,000 population that is not part of a metropolitan area and is not where you went to college?
4. Have you ever lived for at least a year in the United States at a family income that was close to or below the poverty line? You may answer “yes” if your family income then was below $30,000 in 2010 dollars. Graduate school doesn’t count. Living unem-ployed with your family after college doesn’t count.
Take your best guess. For estimating your family’s past income, you should multiply what you or your parents used to make by the infl ator appropriate to that time. For example, if your dad made $7,000 a year when you were growing up in 1970, you should mul-tiply that by 5.61. He made about $39,270 in 2010 dollars. You may estimate the infl ator for any particular year from these: 1940, 15.66; 1950, 9.12; 1960, 7.41; 1970, 5.61; 1980, 2.64; 1990, 1.67; 2000, 1.26.
5. Have you ever walked on a factory fl oor? 6. Have you ever held a job that caused something to hurt at the end
of the day?
People Who Have Been Part of Your Life
7. Have you ever had a close friend who was an evangelical Christian?
Murr_9780307453426_3p_01_r1.e.indd 103Murr_9780307453426_3p_01_r1.e.indd 103 11/21/11 2:55 PM11/21/11 2:55 PM

104 Coming Apart
8. Do you now have a close friend with whom you have strong and wide- ranging political disagreements?
9. Have you ever had a close friend who could seldom get better than Cs in high school even if he or she tried hard?
10. During the last month, have you voluntarily hung out with peo-ple who were smoking cigarettes?
11. What military ranks do these fi ve insignia represent?
Sports, Pastimes, and Consumer Preferences
12. Choose one. Who is Jimmie Johnson? Or: Have you ever pur-chased Avon products?
13. Have you or your spouse ever bought a pickup truck? 14. During the last year, have you ever purchased domestic mass-
market beer to stock your own fridge? 15. During the last fi ve years, have you or your spouse gone fi shing? 16. How many times in the last year have you eaten at one of the fol-
lowing restaurant chains? Applebee’s, Waffl e House, Denny’s, IHOP, Chili’s, Outback Steakhouse, Ruby Tuesday, T.G.I. Fri-day’s, Ponderosa Steakhouse
Some American Institutions
17. In secondary school, did you letter in anything? 18. Have you ever attended a meeting of a Kiwanis Club or Rotary
Club, or a meeting at a union local? 19. Have you ever participated in a parade not involving global warm-
ing, a war protest, or gay rights? 20. Since leaving school, have you ever worn a uniform? 21. Have you ever ridden on a long- distance bus (e.g., Greyhound,
Trailways) or hitchhiked for a trip of fi fty miles or more?
Murr_9780307453426_3p_01_r1.e.indd 104Murr_9780307453426_3p_01_r1.e.indd 104 11/21/11 2:55 PM11/21/11 2:55 PM

How Thick Is Your Bubble? 105
Media and Popular Culture
22. Which of the following movies have you seen (at a theater or on a DVD)? Iron Man 2, Inception, Despicable Me, Tron Legacy, True Grit, Clash of the Titans, Grown Ups, Little Fockers, The King’s Speech, Shutter Island
23. During the 2009–10 television season, how many of the follow-ing series did you watch regularly? American Idol, Undercover Boss, The Big Bang Theory, Grey’s Anatomy, Lost, House, Desperate Housewives, Two and a Half Men, The Offi ce, Survivor
24. Have you ever watched an Oprah, Dr. Phil, or Judge Judy show all the way through?
25. What does the word Branson mean to you?
Scoring Your Access to the Rest of America
1. Have you ever lived for at least a year in an American neighborhood in which the majority of your fi fty nearest neighbors did not have col-lege degrees? Seven points maximum. Score 4 points if you an-swered “yes” plus a bonus point for every fi ve years you have lived in such a place up to fi fteen years.
In the 2000 census, 92 percent of Americans lived in zip codes in which the majority of adults ages 25 and older did not have col-lege degrees. Seventy- seven percent lived in zip codes where fewer than a third of those adults had degrees. You should make your judgment with regard to your neighborhood, not your zip code. Zero points if you are thinking of a gentrifying neighbor-hood in which you were one of the gentrifi ers.
2. Did you grow up in a family in which the chief breadwinner was not in a managerial job or a high- prestige profession (defi ned as attorney, physician, dentist, architect, engineer, scientist, or college professor)? Seven points maximum. Score 4 points if you answered “yes” and 3 bonus points if the chief breadwinner for most or all of your childhood was in what you consider to be a blue- collar job.
The percentages of households in which the chief breadwinner
Murr_9780307453426_3p_01_r1.e.indd 105Murr_9780307453426_3p_01_r1.e.indd 105 11/21/11 2:55 PM11/21/11 2:55 PM

106 Coming Apart
was not in a managerial job or a high- prestige profession ranged from 85 percent in 1960 to 75 percent in 2010.3
3. Have you ever lived for at least a year in an American community under 50,000 population that is not part of a metropolitan area and is not where you went to college? Seven points maximum. Score 5 points if you answered “yes,” 6 points if the place was under 25,000, and 7 points if you lived in a town of fewer than 10,000 people or in a rural area.
The percentage of Americans fi tting the description in the question was 58 percent in the 1960 census and 48 percent in the 2000 census. You may fi nd it surprising, as I did, that 21 percent of Americans still lived in rural areas as of the 2000 census and another 10 percent lived in towns of fewer than 10,000 people— in total, almost a third of the population. That fi gure is not com-pletely cleansed of bedroom communities, but it’s close.
4. Have you ever lived for at least a year in the United States at a family income that was close to or below the poverty line? You may answer “yes” if your family income then was below $30,000 in 2010 dollars. Graduate school doesn’t count. Living unemployed with your family after college doesn’t count. Seven points maximum. Score 5 points if you answered “yes” and two bonus points if you experienced poverty both as a child and as an adult.
A majority of Americans in their forties have been below the poverty line for a year at least once since their teens—56 percent for the 1979 cohort of the NLSY.4
5. Have you ever walked on a factory fl oor? Six points maximum. Score 2 points for “yes,” 4 points if you have ever had a job that entailed routine visits to factory fl oors, and 6 points if you have worked on a factory fl oor.
I was prompted to use this question because of a personal ex-perience. In the mid- 1980s, my sponsor for a speech at a local college in Wichita was the owner of a factory that made card-board boxes, and my host took me to see it. It was fascinating—the ingenious machines, the noise, the speed, the organization. Then it struck me that every product I used was made in such a place—in the aggregate, thousands of them, constituting the
Murr_9780307453426_3p_01_r1.e.indd 106Murr_9780307453426_3p_01_r1.e.indd 106 11/21/11 2:55 PM11/21/11 2:55 PM

How Thick Is Your Bubble? 107
world that made my life possible—and until then I had never seen even a glimpse of it except as a small child on a single visit to Maytag Company’s assembly line. My visit to the box factory was a quarter of a century ago, and I haven’t been on another factory fl oor since.
6. Have you ever held a job that caused something to hurt at the end of the day? Six points maximum. Score 3 points if you answered “yes,” add 2 bonus points if the job lasted longer than a summer, and a bonus point if you’re talking about a job that made you ache all over.
The question applies to any part of the body that hurts because of physical labor using the large muscles. Headaches don’t count, and neither does carpal tunnel syndrome. Sore feet from having to stand up for long periods of time does count.
If you answered “no” to this one, your bubble is thick indeed. John Kenneth Galbraith, who grew up on a farm, once said that after you’ve worked on a farm, nothing else you ever do is work. One might also say that if you’ve never had a job where some-thing hurts at the end of the day, you don’t know what work is. You certainly don’t know what work is like for the large propor-tion of the American population who do hold jobs that cause something to hurt at the end of the day.
7. Have you ever had a close friend who was an evangelical Christian? Four points maximum. Score 2 points if you answered “yes,” and 4 points if you are an evangelical Christian yourself.
The distinguishing characteristics of evangelical Christians are belief in the historical accuracy of both the Hebrew Bible and the New Testament, including especially the divinity and resurrec-tion of Christ, and belief in the necessity of personal conversion— being “born again”—as a condition for salvation. In the Pew Forum’s survey of the U.S. religious landscape in 2004, with a sample of more than 35,000, 26.3 percent of the respondents said they were affi liated with evangelical Protestant churches, the sin-gle largest category. Catholics came in second at 23.9 percent, mainline Protestant churches third at 18.1 percent, and “unaffi li-ated” fourth at 16.1 percent.5
Murr_9780307453426_3p_01_r1.e.indd 107Murr_9780307453426_3p_01_r1.e.indd 107 11/21/11 2:55 PM11/21/11 2:55 PM
108 Coming Apart
8. Do you now have a close friend with whom you have strong and wide- ranging political disagreements? Four points maximum. Score 2 points if you have one such close friend, 4 points if you have more than one, but not if they are disagreements within the same side of the political spectrum (no points if you are a liberal who has an ultraliberal friend or a conservative with an ultraconserva-tive friend).
The reason for this question is obvious from the discussion of red and blue SuperZips in chapter 3. See Bill Bishop’s The Big Sort for a comprehensive analysis of this issue.6
9. Have you ever had a close friend who could seldom get better than Cs in high school even if he or she tried hard? Score 4 points for “yes.”
I use this question as a way of getting at the question I would like to ask, “Have you ever had a close friend who would have scored below the national average on an IQ test?” I can’t ask that question, because readers who grew up in an upper- middle- class neighborhood or went to school with the children of the upper-middle class have no way of knowing what average means. The empirical case for that statement is given in detail elsewhere, but it may be summarized quickly.7 The typical mean IQ for students in schools that the children of the upper- middle class attend is around 115, compared to the national mean of 100. In such a school, almost all of the below- average students, the ones you thought of as the school’s dummies, actually were above the na-tional average. Even if the students were arranged in a normal distribution around a mean of 115, only 11 percent of the stu-dents could be expected to have IQs under 100.8 But they prob-ably weren’t normally distributed, especially at a private school that uses a fl oor of academic ability in its admission decisions. So if you went to upper- middle- class schools and think you had a good friend who was below the national IQ mean, and are right, it had to have been one of the students who was at the absolute bot-tom of academic ability.
If you answered “yes” to this question as stated, you need to ask yourself if you fudged about the defi nition of “close friend.” We hate to think we’re such snobs that we have consorted only
Murr_9780307453426_3p_01_r1.e.indd 108Murr_9780307453426_3p_01_r1.e.indd 108 11/21/11 2:55 PM11/21/11 2:55 PM

How Thick Is Your Bubble? 109
with people as smart as we are, and the temptation is strong to defi ne as a “close friend” a classmate in K–12 who didn’t seem very smart but with whom we exchanged friendly greetings in the lunchroom.
10. During the last month have you voluntarily hung out with people who were smoking cigarettes? Score 3 points for “yes.”
In the Centers for Disease Control’s Behavioral Risk Factor Surveillance System for 2009, 35 percent of the respondents said that they smoked some days or every day.9 Rates of smoking have a strong socioeconomic gradient, but the wording of the question is designed to get at something else. Open smoking in the world of the new upper class has become so rare that it is nearly invisi-ble. Cigars and pipes appear occasionally, but it is possible to go for weeks in the new- upper- class milieu without smelling a whiff of cigarette smoke anywhere except on a public street. Elsewhere in America, there are still lots of homes, bars, and work sites where smoking goes on openly, and nonsmokers in those settings accept it as a fact of life. The question asks to what extent you have any voluntary participation in that part of America.
11. What military ranks are denoted by these fi ve insignia? From left to right, the fi ve stand for colonel (or navy captain), major general (or navy rear admiral, upper half), corporal, master sergeant, and captain (or navy lieutenant). Five points maximum. Score 1 point if you got at least one correct, 3 points if you identifi ed all of them, and 5 points if you ever served in the armed forces.
In 2007, 1.4 million Americans were on active duty in the armed forces, another 1.3 million were in the reserve, and 805,000 civilians worked directly for the Department of Defense. People who live in counties where a large military base is located account for another 8.4 million.10 In the 2000 census, 26.4 mil-lion Americans were veterans of the armed forces. In mainstream America, just about every neighborhood is peppered with numer-ous veterans, and the local chapter of the VFW or American Le-gion is still a signifi cant civic force in much of America.
12. Option 1: Who is Jimmie Johnson? Three points maximum. Score 3 points if you identifi ed Jimmie Johnson as the NASCAR driver.
Murr_9780307453426_3p_01_r1.e.indd 109Murr_9780307453426_3p_01_r1.e.indd 109 11/21/11 2:55 PM11/21/11 2:55 PM
110 Coming Apart
Score 1 point (consolation prize) if you identifi ed him as the for-mer coach of the Dallas Cowboys (the coach spells it Jimmy, not Jimmie).
For tens of millions of Americans, Jimmie Johnson is the most important fi gure in sports. He was the NASCAR Sprint Cup Se-ries champion for fi ve consecutive years from 2006 to 2010, a feat as unlikely as pulling off the Grand Slam in golf or tennis. NAS-CAR itself rivals the NFL, NBA, and Major League Baseball by several measures of attendance, economic clout, and size of fan base.
Option 2: Have you ever purchased Avon products? Score 3 points for “yes.”
Avon is one of the largest companies selling cosmetics and per-fume door- to- door, with sales of $9.9 billion in 2007.
13. Have you or your spouse ever bought a pickup truck? Score 2 points for “yes.”
In 2010, Americans bought about 1.6 million new pickup trucks.11 Occasionally members of the new upper class buy one for fun or because they need one at their summer place in Mon-tana. But it remains true that people who have a need for the things that a pickup truck can do are usually engaged in activities that people in the new upper class often don’t do at all, or things that the new upper class hires other people to do for them.
14. During the last year, have you ever purchased domestic mass- market beer to stock your own fridge? Score 2 points for “yes.”
The leading qualifying beers are Budweiser, Coors, Miller, or Busch, light or regular. The disdain of the new upper class for domestic mass- market beer is nearly as intense as its disdain for people who smoke cigarettes.
15. During the last fi ve years, have you or your spouse gone fi shing? Two points maximum. Score 1 point for “yes” and 2 points if you or your spouse go fi shing more than once a year.
Fishing is a regular pastime for about 40 million Americans, and at the center of the annual vacation for millions more who don’t fi sh regularly.12 It is so popular that it supports not just one but two professional bass-fi shing tournament circuits, the Bass-
Murr_9780307453426_3p_01_r1.e.indd 110Murr_9780307453426_3p_01_r1.e.indd 110 11/21/11 2:55 PM11/21/11 2:55 PM
How Thick Is Your Bubble? 111
master Tournament Trail and the Walmart FLW Tour, plus several regional tours. Top prize for the Bassmaster Classic is $500,000. Win the Forrest Wood Cup, and you get $1 million. Both major tours are nationally televised.
16. How many times in the last year have you eaten at one of the follow-ing restaurant chains? Applebee’s, Waffl e House, Denny’s, IHOP, Chili’s, Outback Steakhouse, Ruby Tuesday, T.G.I. Friday’s, Pon-derosa Steakhouse. Four points maximum. Score a point for each time you ate at one of them up to 4.
However much they disapprove of fast food in theory and re-strict their visits, almost all members of the new upper class at least know what the inside of a McDonald’s looks like. But how about the chains of sit- down restaurants that form such an inte-gral part of life in most of America? The nine I listed are the ones with the most outlets in the United States.13 I could not get statis-tics on meals served by them, but given that these nine chains had revenues of more than $12 billion in 2009 (probably much more), and all of that comes from dinner checks that ran around $5 to $25 per person, the aggregate number of meals served by just the top nine chains has to be in the high hundreds of millions, at least.14 Why a list of nine chains instead of the more natural top ten? Because one of the top ten is Chipotle Mexican Grill, which is to the casual- dining genre of restaurants as Whole Foods is to grocery stores.
17. In secondary school, did you letter in anything? Two points maxi-mum. Score 2 points if you got any high school varsity letter ex-cept for the debating team or chess club. Score 2 points if you were a cheerleader or in the marching band.
The stereotype of the overeducated elitest snob as a teenager is someone who either went to a private school where team sports were not a big deal or went to a public school where he held him-self aloof from the team sports and collateral activities that are such an important part of the culture of public high schools. Does the stereotype fi t you?
18. Have you ever attended a meeting of a Kiwanis Club or Rotary Club, or a meeting at a union local? Score 2 points for “yes.”
Murr_9780307453426_3p_01_r1.e.indd 111Murr_9780307453426_3p_01_r1.e.indd 111 11/21/11 2:55 PM11/21/11 2:55 PM

112 Coming Apart
Kiwanis and Rotary Clubs have for several decades been a primary networking organization for local businessmen. They are more infl uential in small cities than in large ones, but their reach extends everywhere. They are a signifi cant source of secu-lar social capital as well, playing an active role in a variety of civic activities. Unions usually do not play a large role in gener-ating social capital for the community at large, but they are often centrally important to the work life of members of the union.
19. Have you ever participated in a parade not involving global warming, a war protest, or gay rights? Score 2 points for “yes.”
Celebratory parades, as opposed to parades on behalf of causes, occur everywhere in America, from small towns to ethnic neigh-borhoods in the largest cities, but not so often in the enclaves of the new upper class. This question asks if you have ever been part of one. Helping to decorate a fl oat counts even if you didn’t get to ride on it.
20. Since leaving school, have you ever worn a uniform? Three points maximum. Score 1 for “yes,” a bonus point if you did so as part of your job, and a third point if it was while you served in the armed forces.
A uniform can consist of as little as a shirt with your employ-er’s logo that you are required to wear on the job. It gives you a chance to score a point or two if you are a member of a social club that occasionally has rituals involving uniforms, if you are a Civil War reenactor, or if you participate in an adult athletic league. Wearing a uniform in a dramatic production or on Halloween does not count.
21. Have you ever ridden on a long- distance bus (e.g., Greyhound, Trailways) or hitchhiked for a trip of fi fty miles or more? Two points maximum. Score 1 point for having used each form of transpor-tation.
About 25 million people rode on a Greyhound Bus in 2008 alone. There are no statistics on hitchhiking.
22. Which of the following movies have you seen (at a theater or on a DVD)? Iron Man 2, Inception, Despicable Me, Tron Legacy, True
Murr_9780307453426_3p_01_r1.e.indd 112Murr_9780307453426_3p_01_r1.e.indd 112 11/21/11 2:55 PM11/21/11 2:55 PM

How Thick Is Your Bubble? 113
Grit, Clash of the Titans, Grown Ups, Little Fockers, The King’s Speech, Shutter Island. Four points maximum. Score a point for each movie seen up to 4.
These represent the ten top- grossing fi lms of 2010 that were not principally directed at children or teens.15
23. During the 2009–10 television season, how many of the following series did you watch regularly? American Idol, Undercover Boss, The Big Bang Theory, Grey’s Anatomy, Lost, House, Desperate House-wives, Two and a Half Men, The Offi ce, Survivor. Four points max-imum. Score a point for each series up to 4.
These were the ten television series (omitting a sports series, NBC Sunday Night Football) with the highest Nielsen ratings for the 2009–10 television season. Number 1, American Idol, had a rating of 9.1 and an audience share of 24 percent. Number 10, Survivor (the “Heroes and Villains” sequence), had a rating of 4.5 and an audience share of 13 percent.16
24. Have you ever watched an Oprah, Dr. Phil, or Judge Judy show all the way through? Four points maximum. Score 1 point for each of the three for which you have watched an entire episode and a bonus point if you watch any of them regularly.
The Oprah Winfrey Show is, of course, the highest- rated talk show in American history, in its twenty- fi fth and last year as I write. Dr. Phil is in its ninth year, and is rated second only to Oprah. Judge Judy is now in its fi fteenth year and is said to be watched by about 10 million people on a typical day. References to them have become a common part of the popular culture.
25. What does the word Branson mean to you? Four points maximum. Score 2 points if you knew that Branson is a big entertainment center in the Midwest, and 4 points if you’ve gone to Branson yourself. No points for thinking of Richard Branson.
Branson, Missouri, is one of the leading tourist destinations in America. With a permanent population of only 6,050 in the 2000 census, it has more than fi fty different theaters offering daily live performances, almost all of them devoted to country music and its derivatives. In 2009, during the worst year of the recession, it still attracted more than 7 million visitors.17
Murr_9780307453426_3p_01_r1.e.indd 113Murr_9780307453426_3p_01_r1.e.indd 113 11/21/11 2:55 PM11/21/11 2:55 PM

114 Coming Apart
Interpreting Your Score
Here are the scores that you could expect to get if you fi t the follow-ing descriptions.
• A lifelong resident of a working- class neighborhood with average televi-sion and moviegoing habits. Range: 48–99. Typical: 77.
• A fi rst- generation middle- class person with working- class parents and average television and moviegoing habits. Range: 42–100. Typical: 66.
• A fi rst- generation upper- middle- class person with middle- class par-ents. Range: 11–80. Typical: 33.
• A second- generation (or more) upper- middle- class person who has made a point of getting out a lot. Range: 0–43. Typical: 9.
• A second- generation (or more) upper- middle- class person with the tele-vision and moviegoing habits of the upper-middle class. Range: 0–20. Typical: 2.
The scoring of the archetypes refl ects a few realities about socio-economic background and the bubble.
If you grew up in a working- class neighborhood, you are going to have a high score even if you are now an investment banker living on Park Avenue. Your present life may be completely encased in the bub-ble, but you brought a lot of experience into the bubble that will al-ways be part of your understanding of America.
Growing up in a middle- class neighborhood also scores points for you on several questions, and this, too, is refl ected in the real- world experiences that people bring to their adult lives in the new upper class. But middle class covers a wide variety of environments, and the degree to which people who grew up in the middle class seal them-selves off from that world after they reach the new upper class also varies widely, which is refl ected in the wide range of possible scores.
Having grown up in an upper- middle- class neighborhood inevita-bly means some restriction to your exposure to average American life. If you grew up in an exclusive part of town such as Chicago’s North Shore or Northwest Washington, you or your parents had to
Murr_9780307453426_3p_01_r1.e.indd 114Murr_9780307453426_3p_01_r1.e.indd 114 11/21/11 2:55 PM11/21/11 2:55 PM

How Thick Is Your Bubble? 115
take proactive steps to force you out of the bubble. That sort of thing happens, but even then it is often artifi cial— your parents made you help out in a soup kitchen during high school and you volunteered for Habitat for Humanity during college, so you have had brief exposure to some of the most downtrodden people and disorganized neighbor-hoods. The truth is, such experiences still leave people with little idea of what life in an ordinary working- class or middle- class neigh-borhood is like.
Murr_9780307453426_3p_01_r1.e.indd 115Murr_9780307453426_3p_01_r1.e.indd 115 11/21/11 2:55 PM11/21/11 2:55 PM