a new method to quantify the heterogeneity of glass
TRANSCRIPT
[email protected] 14, 2020
A New Method to Quantify the Heterogeneity of Glass Container Surfaces – Chemical Durability Ratio
Introduction
Glass delamination has been at the forefront of the pharmaceutical industry since the FDA published its advisory in 2011. The term delamination refers to the production of thin, visible, glassy particles in a drug product following a corrosion process. Formation of delamination particles has been linked to heterogeneous surface chemistry in the glass vial heel area generated during the tube-to-container converting process.1-6 A new method will be presented that focuses on the leading indicator of delamination risk and benefits of the method will be compared to existing screening strategies that rely upon lagging indicators and lamellae generation.
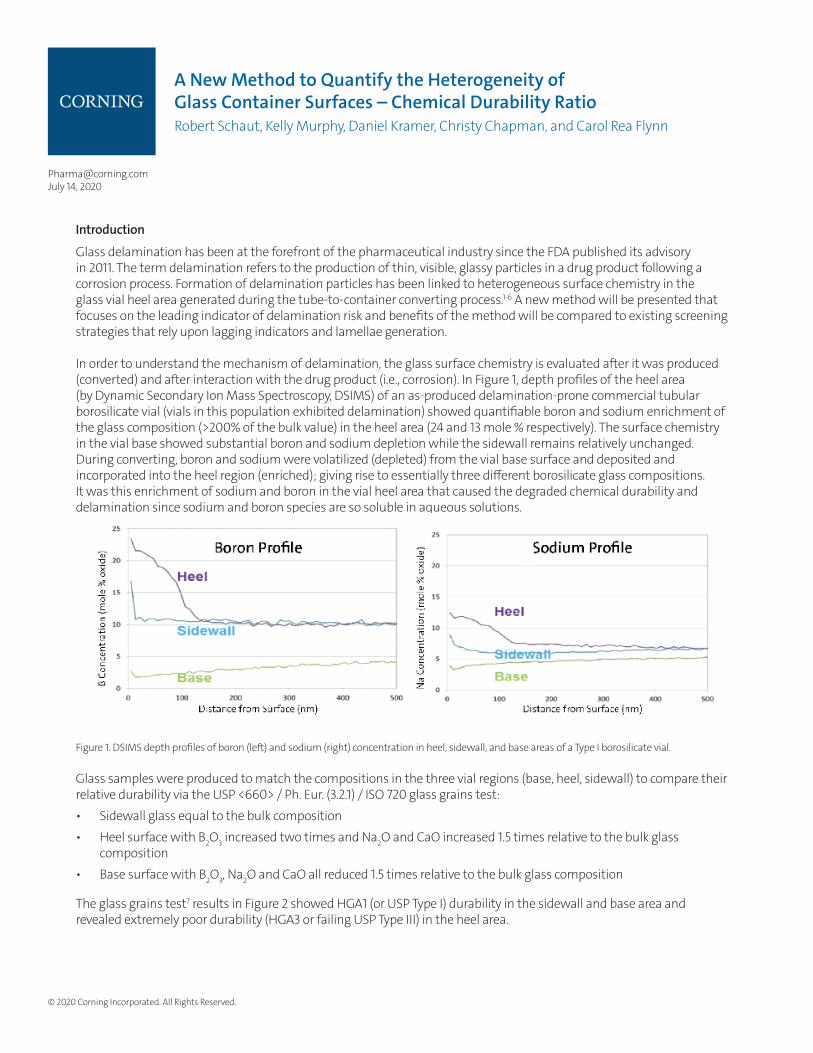
In order to understand the mechanism of delamination, the glass surface chemistry is evaluated after it was produced (converted) and after interaction with the drug product (i.e., corrosion). In Figure 1, depth profiles of the heel area (by Dynamic Secondary Ion Mass Spectroscopy, DSIMS) of an as-produced delamination-prone commercial tubular borosilicate vial (vials in this population exhibited delamination) showed quantifiable boron and sodium enrichment of the glass composition (>200% of the bulk value) in the heel area (24 and 13 mole % respectively). The surface chemistry in the vial base showed substantial boron and sodium depletion while the sidewall remains relatively unchanged. During converting, boron and sodium were volatilized (depleted) from the vial base surface and deposited and incorporated into the heel region (enriched); giving rise to essentially three different borosilicate glass compositions. It was this enrichment of sodium and boron in the vial heel area that caused the degraded chemical durability and delamination since sodium and boron species are so soluble in aqueous solutions.
Figure 1. DSIMS depth profiles of boron (left) and sodium (right) concentration in heel, sidewall, and base areas of a Type I borosilicate vial.
Glass samples were produced to match the compositions in the three vial regions (base, heel, sidewall) to compare their relative durability via the USP <660> / Ph. Eur. (3.2.1) / ISO 720 glass grains test:• Sidewall glass equal to the bulk composition• Heel surface with B2O3 increased two times and Na2O and CaO increased 1.5 times relative to the bulk glass
composition• Base surface with B2O3, Na2O and CaO all reduced 1.5 times relative to the bulk glass composition
The glass grains test7 results in Figure 2 showed HGA1 (or USP Type I) durability in the sidewall and base area and revealed extremely poor durability (HGA3 or failing USP Type III) in the heel area.
© 2020 Corning Incorporated. All Rights Reserved.
Robert Schaut, Kelly Murphy, Daniel Kramer, Christy Chapman, and Carol Rea Flynn

Figure 2. Glasses of the same composition as the vial interior surface were assessed by the glass grains test for hydrolytic performance. The sidewall and base compositions exhibit USP Type I hydrolytic performance (as expected), but the heel composition exceeds USP Type III Glass Grains performance.
Figure 3: SEM image of a Type I borosilicate vial with glass lamellae present at the heel region.
When this low chemical durability heel area was exposed to an aqueous drug product, it corroded more quickly than the surrounding area and produced glass delamination (or particle, flakes, lamellae) in the region of greatest heterogeneity. Lamellae generation is depicted in Figure 3, where evidence of separation of flakes from the container wall is observed in the region of greatest heterogeneity.
While chemical characterization techniques (DSIMS, XPS, and SEM) are well-suited to evaluate changes in surface chemistry that have been linked to delamination, they have limitations including: high cost, significant analysis time/technical training, influence of sample preparation, and small area investigated (less than 1 mm2 on one part). Current delamination testing methods such as USP <1660> are also not sufficient for a definitive determination of delamination risk. These methods rely upon observation of glass lamellae which frequently do not occur within the recommended testing timescales but could appear later or be dissolved due to aggressive test conditions8. Also, some methods (such as described in USP <1660>) lack prescriptive detail leading to differences in test methods (from lab to lab) and qualitative, non-comparable results. Some shortcomings of current delamination testing include:• Lack of positive controls - This prevents test method validation.• Converting variability - Absence of delaminated flakes from testing one population does not ensure similar
performance in future lots. • Over-acceleration - High temperatures can raise solubility limits and misrepresent actual storage conditions
(increases both false-positive and false-negative errors). • Monitors an indirect response - Sodium concentration in solution is not a direct cause or indicator of delamination
propensity. • Diluted response due to high fill volumes – unrealistic fill volumes.• Lengthy tests – require days to months of storage to observe flake response. • Difficult to implement in manufacturing setting – Complex buffers and specific storage temperatures require
additional equipment beyond compendial tests.
A new approach is presented for quantifying the degree of surface chemistry alteration induced by the converting process (the root cause of delamination), while addressing limitations of current delamination test procedures.
© 2020 Corning Incorporated. All Rights Reserved.

The method is called Chemical Durability Ratio (CDR), because it is a unitless ratio of the titration volumes obtained by hydrolytic testing of two glass surface conditions. It is intended to complement the compendial Surface Glass Tests9-10 and applies to containers already meeting Type I performance criteria. For these containers, the results will highlight that considerable performance variation (extractables, leachables, delamination, etc.) exists within the current classification of ‘Type I’ and aid pharmaceutical manufacturers in distinguishing containers with non-uniform surface chemistry.
The method differs from existing methods by using a low filling volume to target the performance of the vial low durability heel region, which is in contact with the drug product. The quantitative nature of the CDR result allows for comparison between glass container pedigrees and correlation to delamination risk. Finally, it is easy to implement within pharmaceutical and tubular supplier laboratories because it uses solutions and equipment already used in current USP and Ph. Eur. methods.
New method identities surface hetergeneity
The CDR test characterizes the degradation of chemical durability of the container associated with surface heterogeneities generated during the conversion process. At a high-level, the method consists of (1) a hydrolytic test of the “as-received” surface, (2) an etching step to remove any chemical heterogeneities that may be present, and (3) a second hydrolytic test of the ‘etched’ surface.
A graphical overview of the method is shown in Figure 4, where “as-received” refers to the glass container received by the pharmaceutical manufacturer ─ ready to be washed and filled (with exception for sulfate-treated containers, to be discussed later). “As-received” containers are processed according to the USP <660> Surface Glass Test (or Ph. Eur. 3.2.1A) with one notable deviation: the filling volume was 12.5% of the brimful capacity (instead of 90% in the Surface Glass Test). The CDR method requires the same attention to detail (washing, filling, autoclaving, titration procedure) as the Surface Glass Test to assure consistent results. The titration volume was recorded as the “as-received” response.
Figure 4. Schematic of the major steps in the CDR test method. Red detail in Step 1 signifies the low durability region of interest. The darker orange region in Step 2 indicates the glass removed by the etching process.
A second Surface Glass Test was conducted on “etched” containers to measure the underlying surface response. The etching process removed the material deposited or incorporated during the forming process. A target etchant concentration of 2.3 M HF/4.6 M HCl for a minimum of three minutes was used to remove at least one micron of depth. These conditions are sufficient for most Type I glass vials, and the depth of surface removal is confirmed by mass lost. Subsequently, the acidic residue was removed by water soaking and rinsing. Containers used for the “etched” response can either be a completely unique set or the retained containers from the “as-received” test. The “etched” containers were processed according to the Surface Glass Test using the reduced fill volume (12.5% of the brimful capacity). The resulting titrant volume was recorded as the “etched” titrant response. A ratio of the recorded titrant volumes, as illustrated in Figure 5, provides a measure of the level of surface heterogeneity.
© 2020 Corning Incorporated. All Rights Reserved.
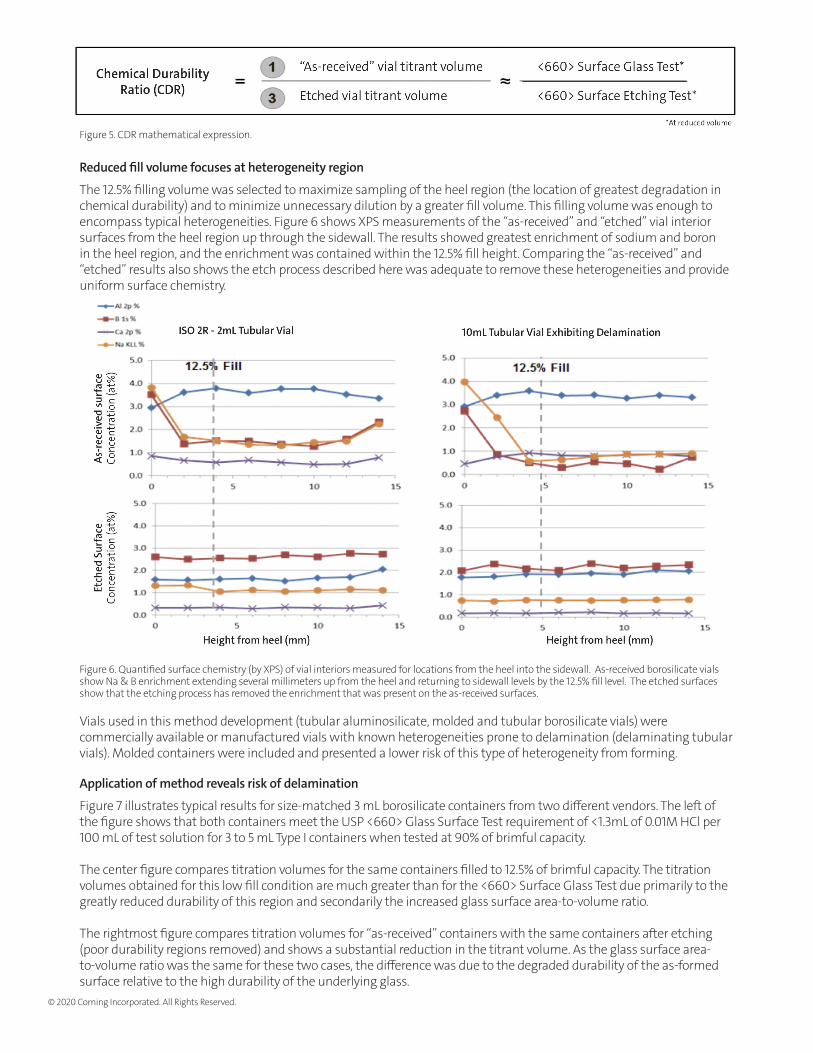
Figure 5. CDR mathematical expression.
Reduced fill volume focuses at heterogeneity region
The 12.5% filling volume was selected to maximize sampling of the heel region (the location of greatest degradation in chemical durability) and to minimize unnecessary dilution by a greater fill volume. This filling volume was enough to encompass typical heterogeneities. Figure 6 shows XPS measurements of the “as-received” and “etched” vial interior surfaces from the heel region up through the sidewall. The results showed greatest enrichment of sodium and boron in the heel region, and the enrichment was contained within the 12.5% fill height. Comparing the “as-received” and “etched” results also shows the etch process described here was adequate to remove these heterogeneities and provide uniform surface chemistry.
Figure 6. Quantified surface chemistry (by XPS) of vial interiors measured for locations from the heel into the sidewall. As-received borosilicate vials show Na & B enrichment extending several millimeters up from the heel and returning to sidewall levels by the 12.5% fill level. The etched surfaces show that the etching process has removed the enrichment that was present on the as-received surfaces.
Vials used in this method development (tubular aluminosilicate, molded and tubular borosilicate vials) were commercially available or manufactured vials with known heterogeneities prone to delamination (delaminating tubular vials). Molded containers were included and presented a lower risk of this type of heterogeneity from forming.
Application of method reveals risk of delamination
Figure 7 illustrates typical results for size-matched 3 mL borosilicate containers from two different vendors. The left of the figure shows that both containers meet the USP <660> Glass Surface Test requirement of <1.3mL of 0.01M HCl per 100 mL of test solution for 3 to 5 mL Type I containers when tested at 90% of brimful capacity.
The center figure compares titration volumes for the same containers filled to 12.5% of brimful capacity. The titration volumes obtained for this low fill condition are much greater than for the <660> Surface Glass Test due primarily to the greatly reduced durability of this region and secondarily the increased glass surface area-to-volume ratio.
The rightmost figure compares titration volumes for “as-received” containers with the same containers after etching (poor durability regions removed) and shows a substantial reduction in the titrant volume. As the glass surface area-to-volume ratio was the same for these two cases, the difference was due to the degraded durability of the as-formed surface relative to the high durability of the underlying glass.
© 2020 Corning Incorporated. All Rights Reserved.

Figure 7. Examples of <660> Surface Glass Test and CDR Test performed on size-matched 3 mL containers from different vendors.
A CDR value of approximately 1 indicates that the surface of the “as-received” vials was equivalent to the underlying glass after etching and therefore, minimal differences exist (the two surfaces tested have equivalent durability). Ratios that exceed 1 have an elevated titrant volume for the “as-received” relative to the “etched” containers. In this case, the chemical durability of the surface has been degraded as a result of volatilization during the converting/molding process, and the container may have an elevated delamination risk. CDR values measurably less than 1 indicate the surface may have been treated (such as ammonium sulfate treatment) or coated (such as silica-like thin films). Ammonium sulfate treated Type I borosilicate containers should not be assessed directly by the CDR method because the treatment masks the heterogeneities of interest, and the resulting ratio does not correlate with delamination risk.
When this method was applied to various pharmaceutically relevant glass container pedigrees, the results agree with trends reported in the literature and the FDA advisory. Figure 8 summarizes more than 100 individual CDR measurements and groups the results by container type (shown on the y-axis with arbitrary arrangement).
Figure 8. CDR values for a variety of containers. Data point labels describe the wall thickness (mm) and container volume (mL). The error bars represent 95% confidence intervals on the measured values.
© 2020 Corning Incorporated. All Rights Reserved.
In the bottommost grouping, commercial tubular borosilicate containers of unknown delamination risk demonstrated a broad range of CDR values from ~2 to ~9. The results showed that thicker container walls tend to exhibit greater CDR values (1.2 and 1.5 mm wall containers between CDR 7 - 9, compared to 1.0 and 1.1 mm wall containers between CDR 2 - 4). This difference in CDR value was consistent with the greater heat required for forming and converting of the thicker wall vials. If special precautions are taken, it could be possible to produce containers with lower CDR ratios (30 mL container with 1.5 mm wall at CDR ~2).
Testing of more than ten pedigrees of glass lamellae confirmed delaminating tubular borosilicate containers exhibited CDR values above 5. This suggested a threshold CDR value might exist above which containers are at known risk of exhibiting delamination.
Molded borosilicate containers exhibit far less surface chemistry alteration during forming compared to tubular containers, as discussed in USP<1660>. Figure 8 shows CDR results for a wide range of molded borosilicate containers that were consistently between 0.8 and 1.5. The containers tested included nominal volumes from 5 to >1000 mL, and both clear and amber compositions. This observation of homogeneous surface chemistry indicated uniform durability on the vial interior surface (CDR values near 1), which was consistent with the lower delamination risk associated with molded containers.
The last pedigrees examined were tubular vials of “boron-free” or “aluminosilicate glass” compositions, intentionally designed to eliminate the root causes of delamination. These glasses have been shown to reduce the degree of evaporation during converting and consequently reduce or eliminate delamination. As illustrated in Figure 8, these containers can exhibit CDR values close to 1, indicating that the converting process induced no significant degradation in chemical durability.
The high variability illustrated by the error bars, further demonstrated the level of heterogeneity between the delaminating tubular vials. The low variability of the data for tubular aluminosilicates and molded borosilicates supported claims of homogeneity.
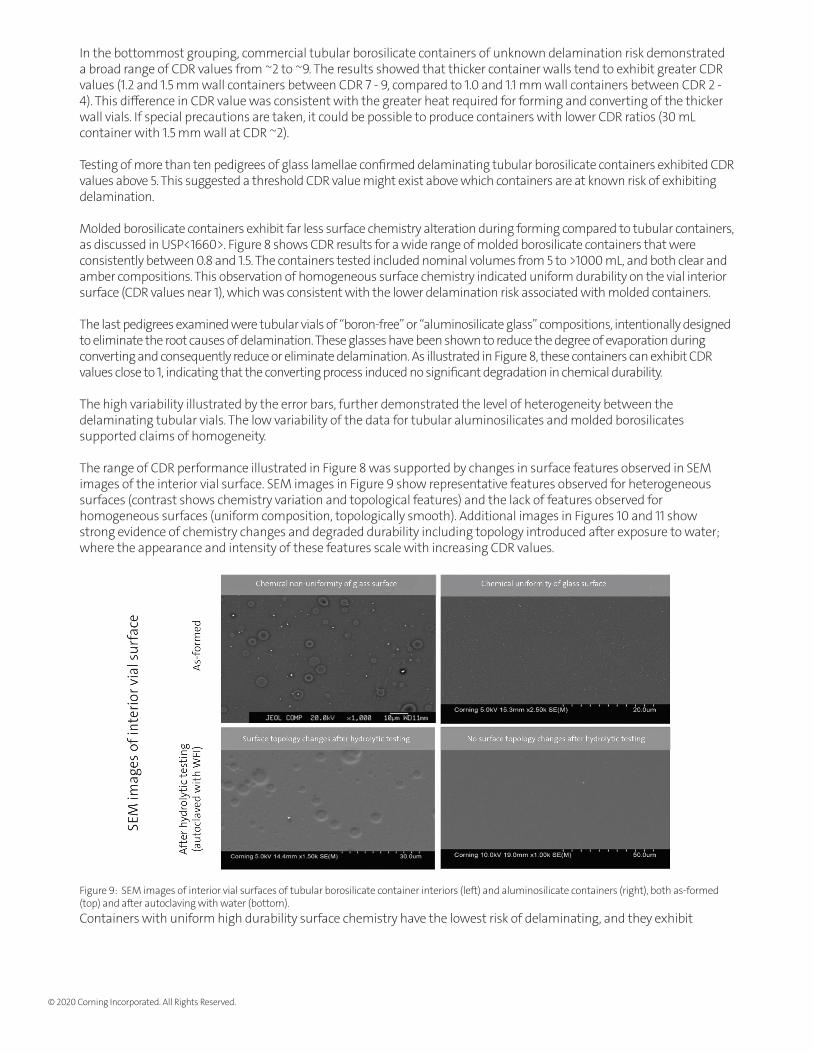
The range of CDR performance illustrated in Figure 8 was supported by changes in surface features observed in SEM images of the interior vial surface. SEM images in Figure 9 show representative features observed for heterogeneous surfaces (contrast shows chemistry variation and topological features) and the lack of features observed for homogeneous surfaces (uniform composition, topologically smooth). Additional images in Figures 10 and 11 show strong evidence of chemistry changes and degraded durability including topology introduced after exposure to water; where the appearance and intensity of these features scale with increasing CDR values.
Figure 9: SEM images of interior vial surfaces of tubular borosilicate container interiors (left) and aluminosilicate containers (right), both as-formed (top) and after autoclaving with water (bottom). Containers with uniform high durability surface chemistry have the lowest risk of delaminating, and they exhibit
© 2020 Corning Incorporated. All Rights Reserved.

CDR ratios between ~0.5 and ~2.0. Containers converted with care to produce minor heterogeneities will have CDR ratios between ~2 and ~5. While lower values are preferred, containers with higher CDR values in this range (e.g. 4) will have increased risk of delamination. Containers with CDR values greater than 5 are known to contain heterogeneities sufficient for delamination. The exact time required for the corroded regions to spall off into solution as a delaminated flake will depend upon the corrosivity of the solution.
Method provides leading indicator of delamination risk
The new CDR method offers significant advantages for quantifying delamination risk compared to existing screening strategies, including:• Interrogates the glass surface that will contact the drug product (instead of fracture surfaces as with the grains test)• Samples larger container population (i.e., not single container and location)• Quantifies the differences in chemical durability when heterogeneities are present (the cause of delamination)
rather than monitoring flake generation (the symptom of delamination)• Avoids dilution effects and represents pharmaceutically relevant fill volumes (90% fill volume for Surface Glass Test
masks high risk regions of vial surface)• Decreases test timing relative to other delamination tests (hours as opposed to days or months)• Can easily be implemented in pharmaceutical and tubular supplier laboratories setting familiar with USP <660> testing
The CDR results reported here show that vials deemed ‘Type I’ by USP <660> and Ph. Eur. 3.2.1 can include a large range of chemical durability. The CDR method has been shown to quantitatively distinguish populations with known performance variation (i.e., delaminating populations). More work is needed to refine the CDR onset for increased delamination risk. SEM, XPS, and DSIMS results confirm that CDR values closer to 1 represent more consistent surface chemistry (relative to the underlying surface) and therefore, have lowest delamination risk. Glass manufacturers might utilize this method to understand and improve their products or implement process control. Similarly, pharmaceutical companies might employ the method during container selection (to understand relative risk and performance between container options) and during manufacturing to monitor incoming container quality.
Figure 10: SEM images of 20 mL borosilicate as-converted tubular container with CDR = ~ 7. (The atomic number contrast details compositional differences.)
Figure 11: SEM images of 10 mL molded borosilicate container with CDR = ~ 0.84.
© 2020 Corning Incorporated. All Rights Reserved.
Singh SK, Afonina N, et al. (2010). An industry perspective on the monitoring of subvisible particles as a quality attribute for protein therapeutics. J. Pharm. Sci. 99(8): 3302-3321.
Ennis RD, Pritchard R, et al. Glass vials for small volume parenterals: influence of drug and manufacturing process on glass delamination. Pharm. Dev. and Tech. 2001; 6(3): 393-405.
Sacha G, et al. Practical fundamentals of glass, rubber, and plastic sterile packaging systems, Pharmaceutical Development and Technology 2010; 15(1): 6-34.
Kuehn, SE. Clash of the Titans: Super-rivals glass and plastic square off for patient safety. Pharmaceutical Manufacturing 2014; (October): 3-9.
Schaut RA and Weeks WP, Historical Review of Glasses Used for Parenteral Packaging. PDA J. Pharm. S&T, 2017. 71(4): 279-296.
Swift R, et al. Glass Containers for Parenteral Products, in Pharmaceutical Dosage Forms: Parenteral Medications, S. Nema and J.D. Ludwig, Editors. 2019.
ISO720, Glass - Hydrolytic Resistance of Glass Grains at 121°C - Method of Test and Classification. International Organization for Standardization: Switzerland, 1985.
Sloey, C., Gleason, C., and Phillips, J., Determining the Delamination Propensity of Pharmaceutical Glass Vials Using a Direct Stress Method. PDA J. of Pharm. S&T, 2013. 67(1): 35-42.
The United States Pharmacopeia. <660> Glass Containers.
European Pharmacopeia, 3.2.1 Glass Containers for Parenteral Use.
The United States Pharmacopeia. <1660> Glass Containers.
1
2
3
4
5
6
7
8
9
10
11
References
© 2020 Corning Incorporated. All Rights Reserved.