a new technique for characterizing aerated flocs in a ... new technique for characterizing...a new...
TRANSCRIPT
International Journal of Mineral Processing 96 (2010) 36–44
Contents lists available at ScienceDirect
International Journal of Mineral Processing
j ourna l homepage: www.e lsev ie r.com/ locate / i jm inpro
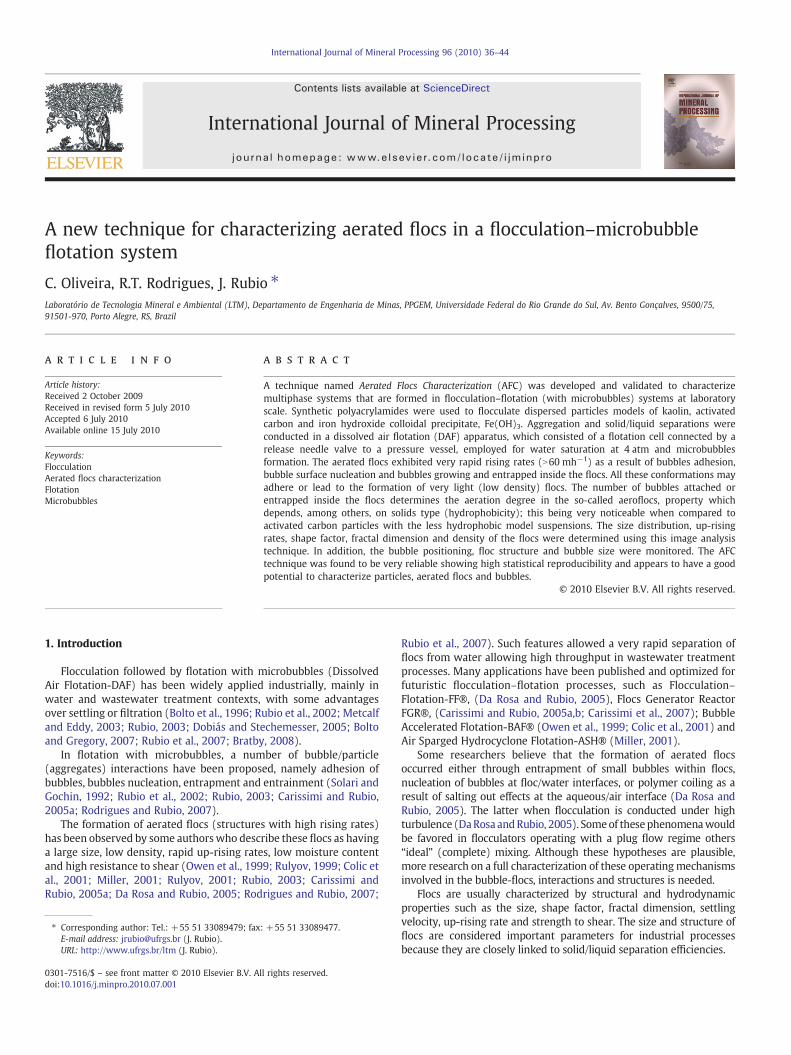
A new technique for characterizing aerated flocs in a flocculation–microbubbleflotation system
C. Oliveira, R.T. Rodrigues, J. Rubio ⁎Laboratório de Tecnologia Mineral e Ambiental (LTM), Departamento de Engenharia de Minas, PPGEM, Universidade Federal do Rio Grande do Sul, Av. Bento Gonçalves, 9500/75,91501-970, Porto Alegre, RS, Brazil
⁎ Corresponding author: Tel.: +55 51 33089479; faxE-mail address: [email protected] (J. Rubio).URL: http://www.ufrgs.br/ltm (J. Rubio).
0301-7516/$ – see front matter © 2010 Elsevier B.V. Adoi:10.1016/j.minpro.2010.07.001
a b s t r a c t
a r t i c l e i n f oArticle history:Received 2 October 2009Received in revised form 5 July 2010Accepted 6 July 2010Available online 15 July 2010
Keywords:FlocculationAerated flocs characterizationFlotationMicrobubbles
A technique named Aerated Flocs Characterization (AFC) was developed and validated to characterizemultiphase systems that are formed in flocculation–flotation (with microbubbles) systems at laboratoryscale. Synthetic polyacrylamides were used to flocculate dispersed particles models of kaolin, activatedcarbon and iron hydroxide colloidal precipitate, Fe(OH)3. Aggregation and solid/liquid separations wereconducted in a dissolved air flotation (DAF) apparatus, which consisted of a flotation cell connected by arelease needle valve to a pressure vessel, employed for water saturation at 4 atm and microbubblesformation. The aerated flocs exhibited very rapid rising rates (N60 mh−1) as a result of bubbles adhesion,bubble surface nucleation and bubbles growing and entrapped inside the flocs. All these conformations mayadhere or lead to the formation of very light (low density) flocs. The number of bubbles attached orentrapped inside the flocs determines the aeration degree in the so-called aeroflocs, property whichdepends, among others, on solids type (hydrophobicity); this being very noticeable when compared toactivated carbon particles with the less hydrophobic model suspensions. The size distribution, up-risingrates, shape factor, fractal dimension and density of the flocs were determined using this image analysistechnique. In addition, the bubble positioning, floc structure and bubble size were monitored. The AFCtechnique was found to be very reliable showing high statistical reproducibility and appears to have a goodpotential to characterize particles, aerated flocs and bubbles.
: +55 51 33089477.
ll rights reserved.
© 2010 Elsevier B.V. All rights reserved.
1. Introduction
Flocculation followed by flotation with microbubbles (DissolvedAir Flotation-DAF) has been widely applied industrially, mainly inwater and wastewater treatment contexts, with some advantagesover settling or filtration (Bolto et al., 1996; Rubio et al., 2002; Metcalfand Eddy, 2003; Rubio, 2003; Dobiás and Stechemesser, 2005; Boltoand Gregory, 2007; Rubio et al., 2007; Bratby, 2008).
In flotation with microbubbles, a number of bubble/particle(aggregates) interactions have been proposed, namely adhesion ofbubbles, bubbles nucleation, entrapment and entrainment (Solari andGochin, 1992; Rubio et al., 2002; Rubio, 2003; Carissimi and Rubio,2005a; Rodrigues and Rubio, 2007).
The formation of aerated flocs (structures with high rising rates)has been observed by some authorswho describe these flocs as havinga large size, low density, rapid up-rising rates, low moisture contentand high resistance to shear (Owen et al., 1999; Rulyov, 1999; Colic etal., 2001; Miller, 2001; Rulyov, 2001; Rubio, 2003; Carissimi andRubio, 2005a; Da Rosa and Rubio, 2005; Rodrigues and Rubio, 2007;
Rubio et al., 2007). Such features allowed a very rapid separation offlocs from water allowing high throughput in wastewater treatmentprocesses. Many applications have been published and optimized forfuturistic flocculation–flotation processes, such as Flocculation–Flotation-FF®, (Da Rosa and Rubio, 2005), Flocs Generator ReactorFGR®, (Carissimi and Rubio, 2005a,b; Carissimi et al., 2007); BubbleAccelerated Flotation-BAF® (Owen et al., 1999; Colic et al., 2001) andAir Sparged Hydrocyclone Flotation-ASH® (Miller, 2001).
Some researchers believe that the formation of aerated flocsoccurred either through entrapment of small bubbles within flocs,nucleation of bubbles at floc/water interfaces, or polymer coiling as aresult of salting out effects at the aqueous/air interface (Da Rosa andRubio, 2005). The latter when flocculation is conducted under highturbulence (DaRosa andRubio, 2005). Someof thesephenomenawouldbe favored in flocculators operating with a plug flow regime others“ideal” (complete) mixing. Although these hypotheses are plausible,more research on a full characterization of these operatingmechanismsinvolved in the bubble-flocs, interactions and structures is needed.
Flocs are usually characterized by structural and hydrodynamicproperties such as the size, shape factor, fractal dimension, settlingvelocity, up-rising rate and strength to shear. The size and structure offlocs are considered important parameters for industrial processesbecause they are closely linked to solid/liquid separation efficiencies.
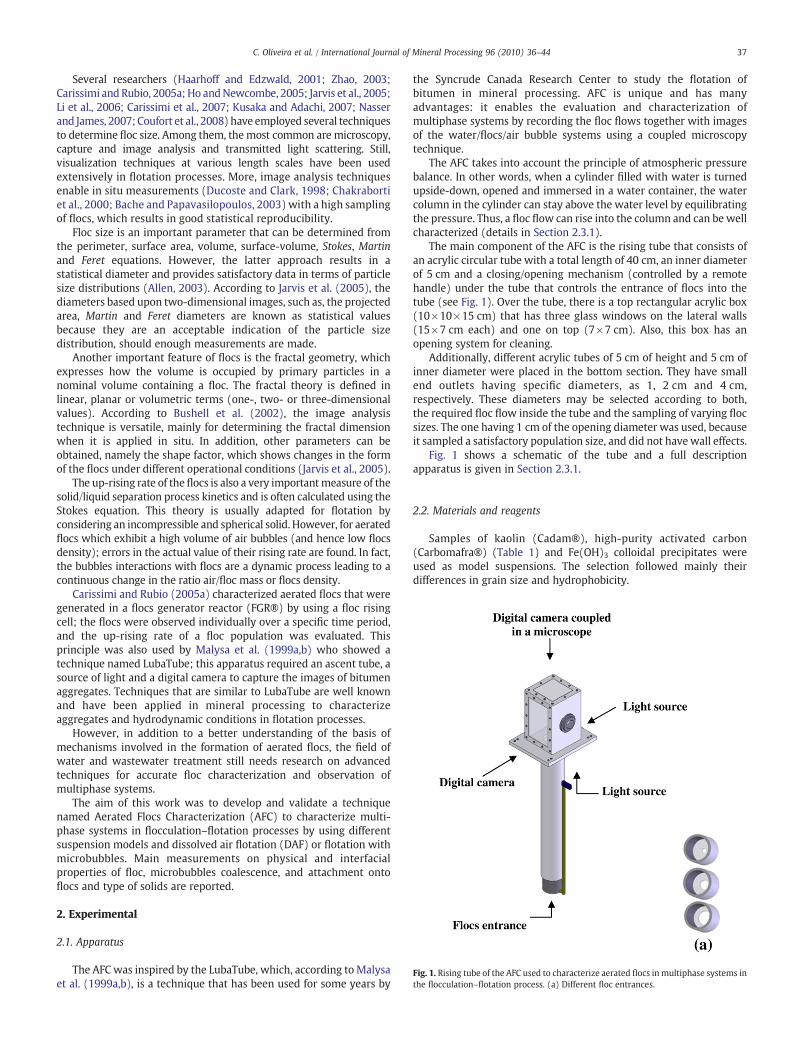
Fig. 1. Rising tube of the AFC used to characterize aerated flocs inmultiphase systems inthe flocculation–flotation process. (a) Different floc entrances.
37C. Oliveira et al. / International Journal of Mineral Processing 96 (2010) 36–44
Several researchers (Haarhoff and Edzwald, 2001; Zhao, 2003;Carissimi and Rubio, 2005a; Ho andNewcombe, 2005; Jarvis et al., 2005;Li et al., 2006; Carissimi et al., 2007; Kusaka and Adachi, 2007; Nasserand James, 2007; Coufort et al., 2008) have employed several techniquesto determine floc size. Among them, themost common are microscopy,capture and image analysis and transmitted light scattering. Still,visualization techniques at various length scales have been usedextensively in flotation processes. More, image analysis techniquesenable in situ measurements (Ducoste and Clark, 1998; Chakrabortiet al., 2000; Bache and Papavasilopoulos, 2003) with a high samplingof flocs, which results in good statistical reproducibility.
Floc size is an important parameter that can be determined fromthe perimeter, surface area, volume, surface-volume, Stokes, Martinand Feret equations. However, the latter approach results in astatistical diameter and provides satisfactory data in terms of particlesize distributions (Allen, 2003). According to Jarvis et al. (2005), thediameters based upon two-dimensional images, such as, the projectedarea, Martin and Feret diameters are known as statistical valuesbecause they are an acceptable indication of the particle sizedistribution, should enough measurements are made.
Another important feature of flocs is the fractal geometry, whichexpresses how the volume is occupied by primary particles in anominal volume containing a floc. The fractal theory is defined inlinear, planar or volumetric terms (one-, two- or three-dimensionalvalues). According to Bushell et al. (2002), the image analysistechnique is versatile, mainly for determining the fractal dimensionwhen it is applied in situ. In addition, other parameters can beobtained, namely the shape factor, which shows changes in the formof the flocs under different operational conditions (Jarvis et al., 2005).
The up-rising rate of the flocs is also a very importantmeasure of thesolid/liquid separation process kinetics and is often calculated using theStokes equation. This theory is usually adapted for flotation byconsidering an incompressible and spherical solid. However, for aeratedflocs which exhibit a high volume of air bubbles (and hence low flocsdensity); errors in the actual value of their rising rate are found. In fact,the bubbles interactions with flocs are a dynamic process leading to acontinuous change in the ratio air/floc mass or flocs density.
Carissimi and Rubio (2005a) characterized aerated flocs that weregenerated in a flocs generator reactor (FGR®) by using a floc risingcell; the flocs were observed individually over a specific time period,and the up-rising rate of a floc population was evaluated. Thisprinciple was also used by Malysa et al. (1999a,b) who showed atechnique named LubaTube; this apparatus required an ascent tube, asource of light and a digital camera to capture the images of bitumenaggregates. Techniques that are similar to LubaTube are well knownand have been applied in mineral processing to characterizeaggregates and hydrodynamic conditions in flotation processes.
However, in addition to a better understanding of the basis ofmechanisms involved in the formation of aerated flocs, the field ofwater and wastewater treatment still needs research on advancedtechniques for accurate floc characterization and observation ofmultiphase systems.
The aim of this work was to develop and validate a techniquenamed Aerated Flocs Characterization (AFC) to characterize multi-phase systems in flocculation–flotation processes by using differentsuspension models and dissolved air flotation (DAF) or flotation withmicrobubbles. Main measurements on physical and interfacialproperties of floc, microbubbles coalescence, and attachment ontoflocs and type of solids are reported.
2. Experimental
2.1. Apparatus
The AFC was inspired by the LubaTube, which, according to Malysaet al. (1999a,b), is a technique that has been used for some years by
the Syncrude Canada Research Center to study the flotation ofbitumen in mineral processing. AFC is unique and has manyadvantages: it enables the evaluation and characterization ofmultiphase systems by recording the floc flows together with imagesof the water/flocs/air bubble systems using a coupled microscopytechnique.
The AFC takes into account the principle of atmospheric pressurebalance. In other words, when a cylinder filled with water is turnedupside-down, opened and immersed in a water container, the watercolumn in the cylinder can stay above the water level by equilibratingthe pressure. Thus, a floc flow can rise into the column and can be wellcharacterized (details in Section 2.3.1).
The main component of the AFC is the rising tube that consists ofan acrylic circular tube with a total length of 40 cm, an inner diameterof 5 cm and a closing/opening mechanism (controlled by a remotehandle) under the tube that controls the entrance of flocs into thetube (see Fig. 1). Over the tube, there is a top rectangular acrylic box(10×10×15 cm) that has three glass windows on the lateral walls(15×7 cm each) and one on top (7×7 cm). Also, this box has anopening system for cleaning.
Additionally, different acrylic tubes of 5 cm of height and 5 cm ofinner diameter were placed in the bottom section. They have smallend outlets having specific diameters, as 1, 2 cm and 4 cm,respectively. These diameters may be selected according to both,the required floc flow inside the tube and the sampling of varying flocsizes. The one having 1 cm of the opening diameter was used, becauseit sampled a satisfactory population size, and did not have wall effects.
Fig. 1 shows a schematic of the tube and a full descriptionapparatus is given in Section 2.3.1.
2.2. Materials and reagents
Samples of kaolin (Cadam®), high-purity activated carbon(Carbomafra®) (Table 1) and Fe(OH)3 colloidal precipitates wereused as model suspensions. The selection followed mainly theirdifferences in grain size and hydrophobicity.

Fig. 2. Schematic of the Aerated Flocs Characterization (AFC) technique: (1) pressurevessel, (2) flotation cell, (3) digital camera for recording the floc flow, (4) rising tube,(5) illumination sources, (6) optical microscope, (7) digital camera for capturing themultiphase system and (8) screen to observe the resulting images.
Table 1Main characteristics of the kaolin and activated carbon particles.
Characteristic Kaolin Carbon
Particle size, μm 0.87 10.9Specific surface area, m2/g 17 703Specific mass, g/cm3 2.3 1.6Moisture, % 1.1 15.9Whiteness 88 –
X-ray 99 % of kaolinite –
38 C. Oliveira et al. / International Journal of Mineral Processing 96 (2010) 36–44
The reagent FeCl3·6H2O (Vetec®) was used to generate the ironhydroxide colloidal precipitates. Potassiumnitrate (KNO3–Merck®) ofanalytical purity was used for measuring the zeta potential of thekaolin and activated carbon particles. pH adjustments were madeusing HNO3 and KOH solutions. An aluminum sulfate solution (Al2(SO4)314H2O–Cynth®) was used as a coagulant for the kaolinparticles. The high molecular weight polymers included an anionicSuperfloc-A100 (Kemira®), a cationic Superfloc-C448 (Cytec®) and anon-ionic-920SH (SNF Floerger®). All of the solutions were preparedaccording to the manufacturer's instructions by using water obtainedfrom a reverse osmosis water treatment lab unit.
2.3. Methodology
2.3.1. Flocculation–flotation studiesThe flocculation–flotation studies were carried out by using a
dissolved air flotation (DAF) unit, composed of a 5 L pressure vesselfor saturating the water at 4 atm and a 5 L flotation cell. This cell wasconnected by a release needle valve to depressurize the saturatewater cavitation and formation of air microbubbles. The suspensionmodels were prepared distinctly, depending on the kind of particles asfollows:
2.3.1.1. Kaolin suspension. A 2.0 g sample was mixed with 2 L of waterand the suspension was placed into the ultrasound bath equipment(Thornton® TS0) for 20 min; this was suitable for particle disaggre-gation, according to laser diffraction particle size analyses. Thereafter,the suspension (pH 5.0) was transferred to the flotation cell andcoagulated with an optimal concentration of Al2(SO4)3 (2.5×10⁻⁵ molAl3+/gkaolin). This concentration was selected from the zeta potentialstudies (Zeta Plus® Brookhaven Instruments) 30 s after the addition ofalum in a jar test apparatus. In addition, the turbidity of thesupernatants was determined (Hach® 2100N) after 5 min settling.
2.3.1.2. Iron hydroxide suspension. A solution of FeCl3 (60 mgFe3+/L)was prepared in the flotation cell at pH 7.5 to complete the iron–ionprecipitation as Fe(OH)3 (consistent with the solubility diagram forthis hydroxide).
2.3.1.3. Activated carbon suspension. 2.5 g of material was mixed with2 L of water within the flotation cell (pH about 7.0).
All suspensions were flocculated with an optimal flocculantconcentration under a sequence of rapid and low agitations (1 mineach); this was followed by microbubble injection with 30% of thedepressurized saturated water volume (usually named recycle ratio).
During the flotationmechanism, the tube of the AFC was opened, afloc flow was sampled and its rising rate was measured. In this stage,the tube was opened for, approximately, 2–3 min. The videorecordings were made for a period even when all flocs reach the topwindow and it resulted in videos containing thousands of flocs. Yet, aperiod of 25 s of recording was chosen and divided in frames andsubsequently image analysis. This time was defined to standardizedata obtained from all experiments and it was found to be asatisfactory time to give a suitable size population and a good
statistical evaluation of the aerated flocs, which was the main purposeof this work.
The flocs sampled reach the top window and remain there. Thishappens due to the fact that the fluid in the tube is under vacuum.Thus, the flocs rose in a laminar regime without interactions. Thesampled flocs stayed at the top window, as well as the “attached”bubbles that had a good stability for a long time (not turbulence ordown flow generated).
Although this fact had been well observed in this work, the topimages of the flocs within 5 min were selected as an optimal capturetime.
Also, it was not observed that a formation of a layer of flocs was atthe top window, because this is controlled and avoided by thesampling time. Consequently, the sampling time used in this workallowed to obtain a representative population, as well as, a fairly goodindividual positioning of the flocs at the top window.
The AFC tube was filled with water and the air was expelled by avacuum formedwhen immersed at 6 cm in the suspensionwithin theflotation cell. A digital camera (Sony Cyber-Shot DSC-S75) wasplaced in front of the rectangular box to take video recordings of theflocs flow; another camera (Sony Mavica MVC-DC500) was coupledto the opticalmicroscope (Zeiss Stemi SV 11) to capture images of themultiphase system inside the tube. This camera was sat up at thesurface of the system with the purpose of getting qualitative datafrom investigations on the arrangement of the bubbles into the flocs,the bubble size distribution, the stability of the bubbles inside theflocs, the attached and the individual bubbles.
The digital cameras were used in manual mode, thus, automatedfeatures were disabled allowing a manual control of importantparameters, among others, digital zoom, focus, resolution, exposuretime and aperture settings. This was done to keep a suitable controland uniformity of the conditions of the image capture stage, in allstudies.
An illumination device was installed opposite to the cameras toprovide suitable contrast for the images.

Fig. 3. Key image treatment steps to determine the up-rising rates of the flocs: (i) conversion of the frames to grayscale; (ii) identification of the objects and their mass centers; and(iii) overlap of the subsequent frames and determining the distance between two mass centers of the same floc.
39C. Oliveira et al. / International Journal of Mineral Processing 96 (2010) 36–44
Videos were recorded without any changes of the cameraposition or its focus; therefore, the established magnification waskept constant during the recordings of the flowing flocs. Themanual focus operated at the maximum depth mode to give threetimes the magnification. Thus, the camera features were adjustedmanually, as well as, the positioning of the cameras and tube.Within the tube filled with water was inserted a calibrated scale inthe flocs flow zone. Thus, video recordings were captured and theimages were treated in the absence of the fish eye effects. Thesame procedure was performed with the camera coupled in themicroscope to capture images instead of video recordings. Theseprocedures were conducted in all experiments and all videos andimages were calibrated. A schematic of the apparatus is shown inFig. 2.
Additionally to sampling using AFC, a sample of subnadantsuspension from flotation cell was collected after 1 min of flotationand the residual turbidity was measured.
The same procedure using AFC was used to characterize the airbubbles, but in this case, the flotation cell was filled only withwater (in the tube absence of particles). The microbubbles wereinjected into the flotation cell and were sampled during their up-rising in the box above the tube. It is important to emphasize thatfor the bubble size distribution studies, the images were capturedimmediately, because these bubbles might coalesce on function ofthe time.
2.3.2. Method of image analysis
2.3.2.1. Floc characterization. All recorded videos and captured imageswere processed using image analysis software named Image Tool3.0, developed by researchers from the University of Texas HealthScience Center in San Antonio — UTHSCSA. Firstly, the videorecordings were divided into frames over established periods(t=1 s) and 25 frames were isolated; this period was sufficient tosample the flocs across the suspension models. Then, the frameswere treated as follows: (a) every frame was converted to grayscale;(b) the objects in each frame were thresholded; (c) the objects wereanalyzed by determining their mass centers; (d) the subsequent frames(frame t0 and frame t0+1) were overlapped and (e) the distance
between the twomass centers of the same floc was determined and theup-rising rate (v) was obtained according to Eq. (1):
v =
ffiffiffiffiffiffiffiffiffiffiffiffiffiffiffiffiffiffiffiffiffiffiffiffiffiffiffiffiffiffiffiffiffiffiffiffiffiffiffiffiffiffiffiffiffiffiffiffiðx2−x1Þ2 + ðy2−y1Þ2
qΔt
ð1Þ
where (x1, y1) and (x2, y2) are the coordinates of the flocs in frames t0and t0+1, respectively, and Δt is the time interval between theframes.
Now, all objects (flocs) in the frames, were recognized andnumbered. All objects were characterized including the mass centersparameter. When the frames were overlapped, the numbersattributed to the same object in the different frames were identifiedand registered manually. A list containing the pairs of attributednumbers to the same object with their correspondent mass centerswas obtained. Finally, these numbers and characterization data werecomputed in a excel spreadsheet to make calculations of the distancebetween the two mass centers. The identification of the same flocwas fairly and reliable and avoids errors committed by thealgorithm, from the software.
Therefore, it is believed that the obtained data are precise andhave satisfactory statistical reproducibility mainly because a largepopulation of flocs (approximately 200 flocs were analyzed ineach study).
Fig. 3 shows the main steps that were carried out during the imagetreatment to determine the up-rising rates of the flocs by measuringthe displacement of flocs in 1 s.
Other characterization parameters (such as the Feret diameter,shape factor and fractal dimension) were determined using the samesteps as described above. The Feret diameter (df) was defined as thediameter of a circle that has the same area of an irregular object andwas determined using Eq. (2):
df =
ffiffiffiffiffiffiffiffiffiffiffiffiffi4Areaπ
rð2Þ
The shape factor (SF) is defined by Eq. (3) — this metric assumesvalues in the range of zero to one. Thus, higher values (SF→1) imply

Fig. 4. Main steps of the image treatment to determine the bubble size distribution in the flocculation–flotation system: (a) conversion to grayscale; (b) threshold treatment,recognition and analysis of the objects.
40 C. Oliveira et al. / International Journal of Mineral Processing 96 (2010) 36–44
an object is a perfect circle, while lower values (SF→0) are related toa non-circular form.
SF =4πArea
perimeter2ð3Þ
The fractal dimension was determined in planar terms using atwo-dimensional analysis. This parameter (D2) is a dimension that isrelated to the projected area from the primary particle mass, whichconstitutes a floc in a circle of radius r, according to Eq. (4) (Harrison,1995; Chakraborti et al., 2000). The average D2 values are in the rangeof zero to two; thus, lower values (D2→0) describe a structure that isopen, large, highly branched and loosely bound while higher values(D2→2) imply a structure that is more compact and densely packed.
A∝rD2 ð4Þ
where A is the sum of the areas of all of the primary particles in a circleof radius r. Thus, D2 is the slope of the plot (log A) versus (log r).
The effective floc density (ρe) was determined according to themodeling by Haarhoff and Edzwald (2001), who used it to characterizethe bubble–floc aggregates in a dissolved air flotation system.
The parameters as fractal dimension, shape factor and densitywere expressed as mean values (arithmetic mean data).
Fig. 5. Up-rising rate distribution in the activated carbon flocs. Conditions: V of 2 L; mof 2.5 g; Ti : 725 NTU; [A100] of 0.63 mg/g; Ps of 4 atm; and recycle ratio of 30%.Statistical data: mean of 60.7 m/h; minimum of 28 m/h and maximum of 85 m/h.
2.3.2.2. Bubble characterization. Bubble images were treated using thesame procedure used to characterize the flocs. However, in this case,the longer diameter (major axis length) was determined, becausewhen the images receive the threshold treatment, the bubbles appearwith both an irregular form and small white areas that are caused bylight reflection onto the bubbles during the studies (see Fig. 4).
Another important fact was the elimination of those objects thatconstituted both touching bubbles and bubbles on the frame border.Fig. 4 shows the main steps of this characterization.
3. Results and discussion
3.1. Flocculation–flotation studies
3.1.1. Activated carbon particlesThe flocculation–flotation studies of the activated carbon particles,
using the anionic polymer A100 showed satisfactory performance interms of particles removal (99%) with low residual turbidity (8.3 NTU)in the treated liquid. Fig. 5 shows an up-rising rate distribution in therange of 25–85 m/h. These data show that the predominant risingvelocity was between 55 and 65 m/h while some faster flocs (85 m/h)appeared to indicate the formation of some aerated flocs.
In this aggregate flow, flocs had a wide size distribution in therange of 0.7–3.3 mm (Fig. 6). Also, the majority of flocs (N80%) weresmaller than 1.9 mmwhile the bigger flocs 2.3–3.3 mm, accounted forjust 10% of the population. This indicates that this polymer induced a
Fig. 6. Size distribution of the activated carbon flocs. Conditions: V of 2 L; m of 2.5 g; Ti :725 NTU; [A100] of 0.63 mg/g, Ps of 4 atm; and recycle ratio of 30%. Statistical data:mean of 1.5 mm; minimum of 0.6 mm and maximum of 3.3 mm.

Fig. 7. Aerated floc of activated carbon — microphotographs showing details of largebubbles in their structure.
Fig. 9. Kaolin-floc size distribution. Conditions: V of 2 L; m of 2.0 g; Ti : 1810 NTU;[920SH] of 1.25 mg/g, Ps of 4 atm; and recycle ratio of 30%. Statistical data: mean of1.0 mm; minimum of 0.5 mm; and maximum of 3.3 mm.
41C. Oliveira et al. / International Journal of Mineral Processing 96 (2010) 36–44
good growth for the primary flocs. The shape factor (0.8), fractaldimension (1.2) and density (0.98 g/cm3) of the structures werecharacterized; the structures held many particles with a mediumcompactness that resulted in light, open structures.
The microscopic analysis of this multiphase system showed plentyof microbubbles in all structures of flocs. This fact is due tohydrophobic interactions between carbon particles and microbub-bles; the latter remaining stable inside the floc structure with nobubble coalescence being observed. However, the faster flocs (85 m/h)appear to be due to the great number of other, but entrapped bubbles. Agreat deal of bubble is attached to the flocs and somemust be formed bynucleation at the hydrophobic particles. Fig. 7 shows an aerated floc of
Fig. 8. Up-rising rate distribution of the kaolin flocs. Conditions: V of 2 L; m of 2.0 g;Ti :1810 NTU; [920SH] of 1.25 mg/g, Ps of 4 atm; and recycle ratio of 30%. Statisticaldata: mean of 63.5 m/h; minimum of 31 m/h and maximum of 101 m/h.
activated carbon containing plenty of microbubbles and large bubblesattached.
3.1.2. Kaolin particlesFlocculation–flotation studies of the kaolin particles using the non-
ionic polymer 920SH was very effective yielding low residual turbidity(24.8 NTU) in the treated liquid. The kaolin flocs showed an up-risingrate distribution in the range of 35–105 m/h. The predominant risingvelocitywasbetween65 and 75 m/h (Fig. 8); and, some(9%), rising veryfast (85–105 m/h).
Here, the floc population had a size distribution in the range of0.5–3.3 mm (Fig. 9) while the majority of the flocs (80%) weresmaller than 1.3 mm. The large flocs only accounted for a smallpopulation; however, they were faster indicating, again, theformation of aeroflocs. The mean values of the shape factor, fractaldimension and density were 0.9, 1.0 and 0.97 g/cm3, respectively;this corresponds to light, open structures with high particleconcentration and medium compactness values.
The microscopic analysis of the multiphase system formed bywater/bubbles/kaolin flocs suggested that some flocs had several airbubbles in their floc structures, while others only included a fewbubbles. This result was the opposite of activated carbon model,where the flocs exhibited plenty of bubbles.
This difference can be explained by the chemical–physicalproperties of these particles, because carbon particles are morehydrophobic than kaolin and, therefore, they have more of an affinityfor air bubbles (hydrophobic interactions).
Although some kaolin flocs exhibited fewer bubbles (lesshydrophobic mineral), the high up-rising metrics persisted due tothe presence of large bubbles in these so-called aeroflocs.
Fig. 10(a) shows a kaolin aerated floc and the same floc isvisualized in (b) with a light contrast to show the large bubblesentrapped within this floc.
The presence of these large bubbles into flocs may be due toenhancement of the air volume inside the flocs. In other words, theDAF generated microbubbles (30–80 μm) suffer coalescence growinguntil large bubbles are formed. This is in agreement with Carissimiand Rubio (2005a) who reported a relationship between the theoricaldata of equivalent diameter of bubbles and the up-rising rate. Theseauthors also argued that large bubbles are responsible by high up-rising rates and it would explain the term aerated flocs. Currently, thishypothesis is confirmed using AFC technique whose obtained imagesshowed clearly the presence of large bubbles in the floc structure.
3.1.3. Fe(OH)3 particlesThe flocculation–flotation studies of Fe(OH)3 colloidal particles
that used the cationic polymer C448 showed satisfactory performance

Fig. 10. Aerated floc of kaolin — microphotographs of: (a) top view of the floc. (b) Top view with a light contrast to show the large bubbles, mainly, entrapped in this floc.
42 C. Oliveira et al. / International Journal of Mineral Processing 96 (2010) 36–44
in terms of particle removal (95%) and, therefore, low residualturbidity (0.5 NTU) in the treated liquid. Fig. 11 shows the up-risingrate distribution in the range of 45–145 m/h. The predominant risingvelocity was between 65 and 85 m/h while some very fast flocs (7%)with a velocity, in the range of 125–145 m/h, were also observed.
This floc population showed a size distribution in the range of0.5–2.9 mm (Fig. 12). Most of the flocs (70%) were smaller than1.1 mm while the large flocs were definitely in a small number,but still rose very fast. Also, parameters such as the shape factor,fractal dimension and density were 0.7, 0.8 and 0.95 g/cm3,respectively, indicate a very open floc structure.
Themicroscopic analysis of this multiphase system showed a greatnumber of bubbles in all the flocs observed (Fig. 13). The structuresseemed very open, i.e., very filamentous, withmany empty spaces andloose bonds.
Some flocs had many large bubbles and yielding faster up-risingvalues. This fact may be due to the very open and porous floc structurewhich allows a very tight packing of many bubbles that grew morereadily than those distant bubbles in the compact flocs.
Fig. 13 shows clearly an aerated floc of iron hydroxide, notablystructures having large bubbles responsible for the high up-risingrates to these flocs.
Another important feature is that results and discussions,presented in this work, confirmed that fractal dimension appears to
Fig. 11. Up-rising rate distribution of the Fe(OH)3 flocs. Conditions: V of 2 L; [Fe3+] of60 mg/L; Ti : 9.5 NTU; [C448] of 0.5 mg/L, Ps of 4 atm; and recycle ratio of 30%. Statisticaldata: mean of 84.6 m/h; minimum of 44 m/h and maximum of 142 m/h.
be not relevant to the up rise rates, a fact which is in agreement withHaarhoff and Edzwald (2001). This parameter is described in thiswork with the purpose of showing that it is possible to obtain fractaldimension values using this technique, another alternative technicalcontribution.
3.2. Bubble characterization
The bubble characterization suggested a size distribution in therange of 10–230 μmwith a mean diameter of 73 μm (Fig. 14). But, themajority (70%) of bubbles was between 50 and 90 μm in diameterwhile 83% were smaller than 110 μm. These data are consistent withthe results of Rodrigues and Rubio (2003), who developed thetechnique named LTM-BSizer to measure the bubble size and thebubbles size distribution in the context of dissolved air flotation(DAF). Researchers who used the same experimental conditions as inthis manuscript have reported a mean bubble size of 65 μm.
Finally, it is believed that AFC technique may be utilized to studyother different factors apart from those aiming in this work; namelythe reagent chemistry effects, ionic strength, and presence ofultrafines, bubble–particle attachment rates, in general flocculation–flotation processes.
Fig. 12. Fe(OH)3 floc size distribution. Conditions: V of 2 L; [Fe3+] of 60 mg/L; Ti :9.5 NTU; [C448] of 0.5 mg/L, Ps of 4 atm; and recycle ratio of 30%. Statistical data: meanof 1.1 mm; minimum of 0.5 mm and maximum of 2.9 mm.

Fig. 13. Aerated floc of iron hydroxide colloidal precipitates — microphotographsshowing details of large bubbles entrapped in the floc structure.
43C. Oliveira et al. / International Journal of Mineral Processing 96 (2010) 36–44
4. Conclusions
A technique to characterize multiphase systems, named AeratedFlocs Characterization (AFC), was developed and validated in floccu-lation–flotation systems of different suspensionmodels. The approachenables the sampling and recording of floc flows to better understandthemultiphase system, which is formed bywater/floc/air bubbles. Thetechnique allowed to perform a detailed evaluation of aerated flocs bymeasuring parameters, such as the size, shape factor, up-rising rate,
Fig. 14. Bubbles injected into the flocculation–flotation studies and their size distribution. Cominimum of 8 μm and maximum of 222 μm.
fractal dimension and density of the flocs, with a high statisticalreproducibility. The AFC allowed both the characterization ofmicrobubbles that were generated in a Dissolved Air Flotation(DAF) unit, and the calculation of a relationship between the bubblesize and the up-rising rates of flocs and bubbles. AFC allowed theidentification of bubbles (various sizes), bubbles attached andentrapped in the so-called aerated flocs and appears to have a goodpotential for the understanding of floc-flotation, a rapid separation offlocs from water and for measurements of bubbles–particles attach-ment rates.
Abbreviations and unitsV volumeT timeΔt time intervalD distancedf Feret diameterSF shape factorD2 fractal dimensionA arear radiusρe floc densitym massTi mean value of the initial turbidity[] concentrationPs saturation pressureNTU Nephelometric Turbidity UnitsAFC Aerated Flocs CharacterizationDAF Dissolved Air Flotation
Acknowledgements
The authors would like to thank Cadam® and Carbomafra® bysupplying the kaolin and activated carbon samples and, to Floerger®,Kemira® and Cytec® companies with special tanks to Dr. D.R. Nagarajfor technical information and provision of flocculants. The authorsalso thank all colleagues for the friendly atmosphere at the LTM(31 years in 2010) — Universidade Federal do Rio Grande do Sul, apublic and free University unit and to all Institutions supportingResearch in Brazil (CNPq, Capes, Finep, and UFRGS).
nditions: V of 2 L; Ps of 4 atm; and recycle ratio of 30%. Statistical data: mean of 73 μm;

44 C. Oliveira et al. / International Journal of Mineral Processing 96 (2010) 36–44
References
Allen, T., 2003. Powder Sampling and Particle Size Determination, First edition. ElsevierScience.
Bache, D.H., Papavasilopoulos, E.N., 2003. Dewatering of alumino-humic sludge:impacts of hydroxide. Water Research 37, 3289–3298.
Bolto, B., Gregory, J., 2007. Organic polyelectrolytes in water treatment. Water Research41, 2301–2324.
Bolto, B.A., Dixon, D.R., Gray, S.R., Chee, H., Harbour, P.J., Ngoc, L., Ware, A.J., 1996. Theuse of soluble organic polymers in waste treatment. Water Science and Technology34, 117–124.
Bratby, J.L., 2008. Coagulation and flocculation in water and wastewater treatment,Second edition. International Water Association.
Bushel, G.C., Yan, Y.D., Woodfield, D., Raper, J., Amal, R., 2002. On techniques for themeasurement of the mass fractal dimension of aggregates. Advances in Colloid andInterface Science 95 (1), 1–50.
Carissimi, E., Rubio, J., 2005a. The flocs generator reactor-FGR: a new basis forflocculation and solid–liquid separation. International Journal of Mineral Proces-sing 75, 237–247.
Carissimi, E., Rubio, J., 2005b. Reator gerador de flocos e processo para tratamento deefluentes. Brasil. PI: 0406106-3.
Carissimi, E., Miller, J.D., Rubio, J., 2007. Characterization of the high kinetic energydissipation of the Flocs Generator Reactor (FGR). International Journal of MineralProcessing 85, 41–49.
Chakraborti, R.K., Atkinson, J.F., Van Benschoten, J.E., 2000. Characterization of AlumFloc by Image Analysis, 34, pp. 3969–3976.
Colic, M., Morse, D.E., Morse, W.O., Martherly, T.G., Carty, S., Miller, J.D., 2001. AirSparged Hydrocyclone to Gas Energy Mixing (GEM) Flotation. Froth Flotation —Dissolved Air Flotation: Bridging the Gap. Tahoe.
Coufort, C., Dumas, C., Bouyer, D., Liné, A., 2008. Analysis of floc size distributions in amixing tank. Chemical Engineering and Processing: Process Intensification 47,287–294.
Da Rosa, J.J., Rubio, J., 2005. The FF (flocculation–flotation) process. MineralsEngineering 18, 701–707.
Dobiás, B., Stechemesser, H., 2005. Coagulation and Flocculation, Second edition. MarcelDekker Inc., New York.
Ducoste, J.J., Clark, M.M., 1998. The influence of tank size and impeller geometry onturbulent flocculation: I experimental. Environmental Engineer Science 15,215–224.
Haarhoff, J., Edzwald, J.K., 2001. Modelling of floc-bubble aggregate rise rates indissolved air flotation. Water Science e Technology 43, 175–183.
Harrison, A., 1995. Fractals in Chemistry, Second edition. Publications, O. S. OxfordUniversity Press, Oxford.
Ho, L., Newcombe, G., 2005. Effect of NOM, turbidity and floc size on the PAC adsorptionof MIB during alum coagulation. Water Research 39, 3668–3674.
Jarvis, P., Jefferson, B., Parsons, S., 2005. Measuring floc structural characteristics.Reviews in Environmental Science and Biotechnology 4, 1–18.
Kusaka, Y., Adachi, Y., 2007. Determination of hydrodynamic diameter of small flocs bymeans of direct movie analysis of Brownian motion. Colloids and Surfaces A:Physicochemical and Engineering Aspects 306, 166–170.
Li, T., Zhu, Z., Wang, D., Yao, C., Tang, H., 2006. Characterization of floc size, strength andstructure under various coagulation mechanisms. Powder Technology 168,104–110.
Malysa, K., Ng, S., Cymbalisty, L., Czarnecki, J., Masliyah, J., 1999a. A method ofvisualization and characterization of aggregate flow inside a separation vessel, Part1. Size, shape and rise velocity of the aggregates. International Journal of MineralProcessing 55, 171–188.
Malysa, K., Ng, S., Czarnecki, J., Masliyah, J., 1999b. A method of visualization andcharacterization of aggregate flow inside a separation vessel, Part 2. Composition ofthe bitumen–air aggregates. International Journal of Mineral Processing. 55,189–202.
Metcalf, Eddy, 2003. Wastewater engineering: treatment and reuse, In: Tchobanoglous,G., Burton, F.L., Stensel, D.H., Eddy, M. (Eds.), Third edition. McGraw Hill.
Miller, J., 2001. Surface chemistry of oil/soil/water systems for improved oil removalfrom contaminated soil by air-sparged hydrocyclone flotation. EnvironmentalProtection Agency.
Nasser, M.S., James, A.E., 2007. Effect of polyacrylamide polymers on floc size andrheological behavior of kaolinite suspensions. Colloids and Surfaces A: Physico-chemical and Engineering Aspects 301, 311–322.
Owen, J.J., Morse, D.E., Morse, W.O., Jovine, R., 1999. New developments in flotationequipment for water treatment systems. In: Parekh, B.K., Miller, J.D. (Eds.),Advances in Flotation Technology. : Society for Mining, Metallurgy and Exploration.Littleton.
Rodrigues, R.T., Rubio, J., 2003. New basis for measuring the size distribution of bubbles.Minerals Engineering 16, 757–765.
Rodrigues, R.T., Rubio, J., 2007. DAF-dissolved air flotation: potential applications in themining and mineral processing industry. International Journal of MineralProcessing 82, 1–13.
Rubio, J., 2003. Unconventional flocculation and flotation. In: Ralston, J., Miller, J., Rubio,J. (Eds.), Fundamentals to Applications: Proceedings from Strategic Conference andWorkshop, 15. Hawai.
Rubio, J., Souza, M.L., Smith, R.W., 2002. Overview of flotation as a wastewatertreatment technique. Minerals Engineering 15, 139–155.
Rubio, J., Carissimi, E., Rosa, J., 2007. Flotation in water and wastewater treatment andreuse: recent trends in Brazil. International Journal of Environment e Pollution 30,193–207.
Rulyov, N.N., 1999. Hydrodynamic destruction of waste emulsions in the process oftheir separation through ultra-flocculation and micro-flotation. Colloids andSurfaces A: Physicochemical and Engineering Aspects 152, 11–15.
Rulyov, N.N., 2001. Turbulent microflotation: theory and experiment. Colloids andSurfaces A: Physicochemical and Engineering Aspects 192, 73–91.
Solari, J.A., Gochin, R.J., 1992. Fundamental aspects of microbubbles flotation. In:Ralston, J., Laskowski, J.S. (Eds.), Colloid Chemistry in Mineral Processing. :Development in Mineral Processing, 12. Elsevier, Amsterdam, pp. 395–418.
Zhao, Y.Q., 2003. Correlations between floc physical properties and optimum polymerdosage in alum sludge conditioning and dewatering. Chemical Engineering Journal92, 227–235.