a new traffic-mining approach for unveiling typical global
TRANSCRIPT

1
A New Traffic-Mining Approach for Unveiling Typical Global Evolutions
of Large-Scale Road Networks
Fabien Moutarde and Yufei Han Robotics Lab (CAOR), Mines ParisTech
60 Bd St Michel, F-75006 Paris, FRANCE [email protected]
ABSTRACT In this paper, we present a new traffic-mining approach for automatic unveiling of typical global
evolution of large-scale road networks. Our method uses as input a history of continuous traffic states
(typically measured by travel times) of *all* links of the road graph. This historical data concatenated
in a link/time matrix is then approximated with a locality-preserving Non-negative Matrix
Factorization (NMF) method. The network-level traffic state similarity takes into account the graph
topology by systematically combining link-wise comparisons with same measure on adjacent links.
Based on the obtained matrix factorization, we project original high-dimensional network-level traffic
information into a feature space (that of NMF components) of much lower dimensionality than
original data. Importantly, because we use a modified NMF ensuring locality-preserving property
(LP-NMF), the proximity of data-points in low-dim projected space correspond to proximity also in
original high-dim space. We can therefore apply standard clustering methods easily in low-dim space,
and directly deduce from its output pertinent categorization of global network traffic states and
dynamics. Experimentations on simulated data with a large realistic network of more than 13000 links
have been done, and show that our method allows to easily obtain meaningful partition of the attained
global traffic states, and to deduce a categorization of the global daily evolution.
INTRODUCTION The majority of published work on traffic data analysis and prediction focus on mining temporal patterns of traffic data measured on individual links [1][2][3]. These works only analyze temporal properties of local link level traffic states. In fact, in a typical urban traffic scenario, traffic states of one link are correlated with neighboring areas. Network-level traffic states can be regarded as complementary knowledge and constraints in predicting or analyzing link level traffic patterns. Therefore, in recent years, with improvement of intelligent transportation systems, it becomes necessary to unveil global traffic patterns at network level. Global traffic information provides overall descriptions of spatial configurations of traffic states over the whole road network, which can improve performances of traffic guidance or control systems [3].
In large-scale traffic networks, like urban traffic systems, network level traffic information is often represented in a high-dimensional feature space, which makes it difficult to extract

2
characteristics of global traffic states. In our work, we firstly adopt a geometrical weighted distance to evaluate similarity between network-level traffic patterns, which is described in the second section. Then, we make use of a matrix factorization method with topological regulation item to obtain a low-dimensional representation model of global traffic states, as described in the third section. In a further step, we perform clustering of global traffic states based on the learned low dimensional representation, in order to extract typical spatial patterns of network-level traffic states. In the final part of the paper, we present clustering structures of network-level traffic patterns with respect to a large-scale link network and make conclusions of the whole paper.
LOCALITY-PRESERVING NON-NEGATIVE MATRIX FACTORIZATION APPLIED TO TRAFFIC DATA A network level traffic state is defined by a sequence of link level traffic states with respect to each individual link in the road network, which is normally represented in a n-dimensional vector, with n being the number of links in the network. Dimensionality of network-level traffic status representation is directly proportional to the number of links in the network. Given a large-scale network, which is common in applications of urban traffic control, the resultant high-dimensional traffic state representation is difficult to store or use for traffic prediction / classification due to the curse of dimensionality.
To attack this issue, we propose to use locality preserving non-negative matrix factorization (LP-NMF) [4][5] to obtain low-dimensional representation of global traffic states. Assuming that k samples of n-dimensional global traffic states are stored as n*k matrix X, LP-NMF factorizes X into the non-negative n*s matrix M and s*k matrix VT, which minimizes the following objective function:
)(2
LVVTrMVXO T
F
T λ+−= (1)
The first term is the Frobenius reconstruction error with respect to M and V. Each sample is approximated by a linear combination of the columns of M, weighted by the rows of V. Therefore, M can be regarded as containing a learned basis of the global traffic states, while V concatenates s-dimensional representations of original samples in the given basis. The number s of NMF components is usually set to be much less than the original dimensionality n. Therefore, we actually obtain a much lower dimensional representation of network-level traffic state after factorization, which removes redundancy in the original high-dimensional space and makes it flexible to implement statistical analysis on the manifold V. In contrast with SVD decomposition, derived manifold space is not necessarily orthogonal in NMF. It is also required that each data sample takes positive coordinates in the low-dimensional feature space. The above two properties makes NMF more suitable to describe the latent distribution structures, especially when overlap exists among different clusters of data samples. In the second term of the object function, L is called Graph Laplacian [6], defined as D-W. In the matrix W, w ij is the pair-wise geometrical weighted similarity measure matrix between i-th and j-th k global traffic state sample. Due to symmetry of the distance measure, W is a symmetric matrix.
3
In a typical traffic network, the traffic state of one specific link is closely correlated with its up-stream or down-stream nearest neighbors in most cases. Therefore, we use a similarity measure that takes into account the road graph topology, by merging together differences between traffic states of each link with link-wise difference values of its up-stream and down-stream neighbors. D is a diagonal matrix whose entries are column sums of W, defined as Eq.2:
∑=j
ijii wD (2)
By adding the Graph Laplacian based constraints, the obtained low-dimensional representation V are calibrated to have similar topological structures as original samples X, which means that two close samples x i and x j are also close in the low-dimensional manifold V. With this property, we can analyze global traffic states easily in the low-dimensional manifold V instead of high-dim original space, without loss of intrinsic data distribution of original samples X.
Each element vij of matrix V represents to which degree i-th original sample is associated with the j-th expanding basis in matrix M. If i-th sample could be represented solely using the j-th basis, then vij would take the largest value in the i-th row of V [7]. Therefore, we simply use V to determine the cluster labels of the network-level traffic states. For each x i, we examine the i-th row of V and assign xi to the j-th cluster, j = argmax
jv ij .
EXPERIMENTAL RESULTS
SIMULATED TRAFFIC DATA
The traffic-mining method we propose makes sense essentially for analyzing data of a large network with many streets/roads, such as city-wide or city+suburbs. Real-world traffic data of this type are not easily accessible, therefore we choose to first apply our approach on realistic simulated data. To this end, we use Metropolis simulation software [8], which was designed to model transportation systems. It contains a complete environment to handle dynamic simulations of daily traffic in one specific traffic network. It allows the user to study the impacts of transportation management policies in a large-scale urban traffic network in a time-dependent manner. We use Metropolis to build the benchmark traffic database of Paris and suburb regions, which is composed by 4660 road intersections and 13627 links in the network, as we can see in the Figure 1. Each simulated traffic scene is generated to cover 8 hours of observations, including congestion in morning rush hours. Different traffic situations are obtained by adding random events and fluctuation in the O-D matrix (Origin-Destination) and capacity of network flow. There are totally 108 simulated traffic scenarios in our benchmark data set. Each one contains 48 time steps, corresponding to 10-minute bins over which the network traffic flow is aggregated, covering 4:00 a.m. till noon. To represent traffic states in each link, we propose to use traffic index [9][10] in each link at a specific time, which is defined as follows in Eq.3.
]1,0[0
∈∆∆=
lt
llt t
tx (3)

4
The denominator is the observed travel time in link l at timet , the numerator is the free-flow travel time on this link. The smaller the traffic index is, the corresponding link is more congested. To perform clustering analysis, we concatenate all the observations of global traffic states into a 13627*5184 matrix. Each column corresponds to a network-level traffic status obtained at each time step, which is a 13627-dimensional vector. In the experiment, the number of clusters is set to be 3 and 5 respectively. For the convenience of visualization, we project all the samples into 3-dimensional PCA space to illustrate the structures of the obtained clusters.
Figure 1. Traffic network of Paris and suburb regions used in Metropolis simulation software
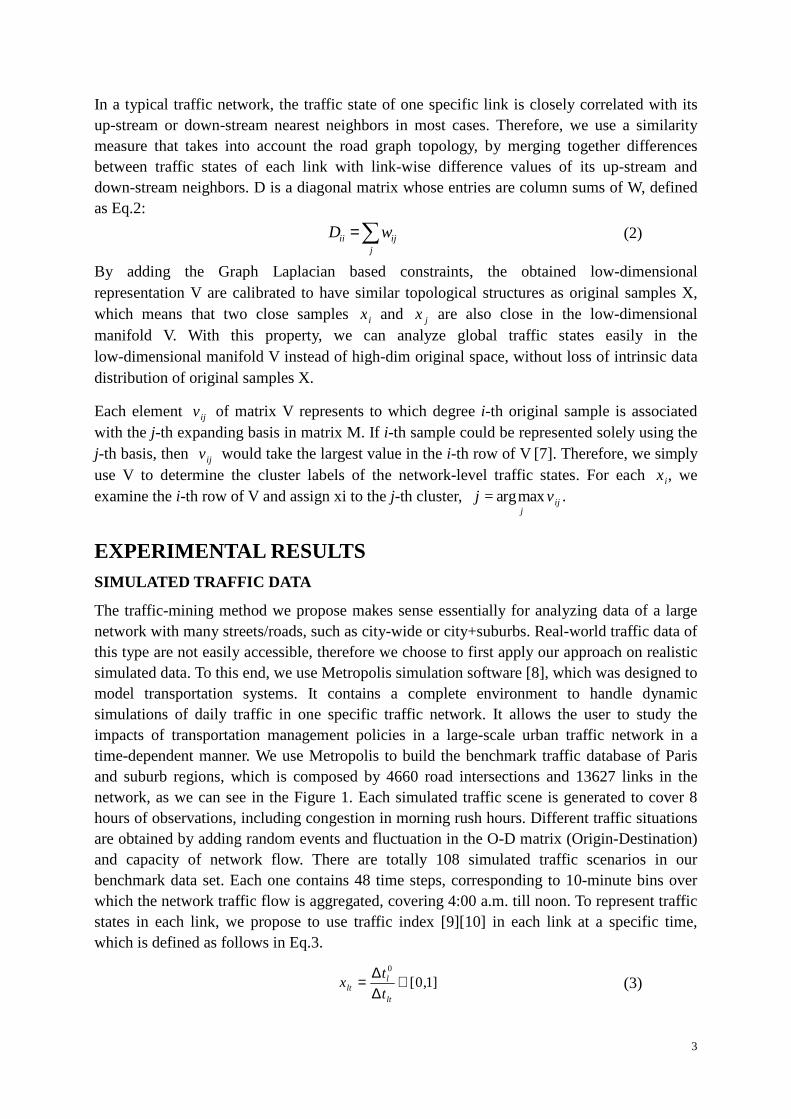
NETWORK-LEVEL TRAFFIC-STATE CLUSTERING In the 3D PCA space, as shown on Figure 2, the samples corresponding to the free-flowing network level states are concentrated within a small region in the PCA space. By contrast, samples corresponding to network-level congestion are distributed sparsely and far from the region of the free-flowing state. Notably, with increasing degrees of traffic jam in the network, variations of network-level traffic patterns become larger and larger. In fact, spatial configurations of global traffic states keep the same if the whole network is free-flowing everywhere. On the contrary, congestion occurred at different parts of the network change the spatial configurations in different ways, which introduces variations in global traffic patterns.
5
Figure 2. Plot of network-level traffic state representation in 3D PCA space
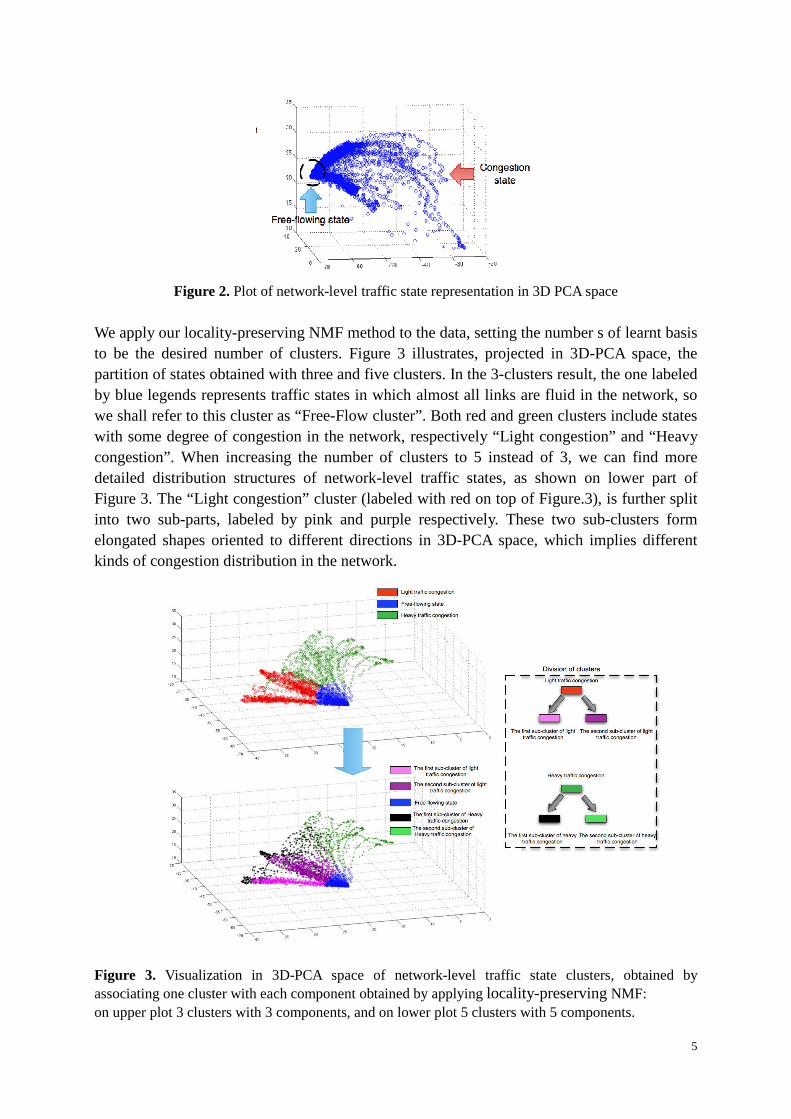
We apply our locality-preserving NMF method to the data, setting the number s of learnt basis to be the desired number of clusters. Figure 3 illustrates, projected in 3D-PCA space, the partition of states obtained with three and five clusters. In the 3-clusters result, the one labeled by blue legends represents traffic states in which almost all links are fluid in the network, so we shall refer to this cluster as “Free-Flow cluster”. Both red and green clusters include states with some degree of congestion in the network, respectively “Light congestion” and “Heavy congestion”. When increasing the number of clusters to 5 instead of 3, we can find more detailed distribution structures of network-level traffic states, as shown on lower part of Figure 3. The “Light congestion” cluster (labeled with red on top of Figure.3), is further split into two sub-parts, labeled by pink and purple respectively. These two sub-clusters form elongated shapes oriented to different directions in 3D-PCA space, which implies different kinds of congestion distribution in the network.
Figure 3. Visualization in 3D-PCA space of network-level traffic state clusters, obtained by associating one cluster with each component obtained by applying locality-preserving NMF: on upper plot 3 clusters with 3 components, and on lower plot 5 clusters with 5 components.
6
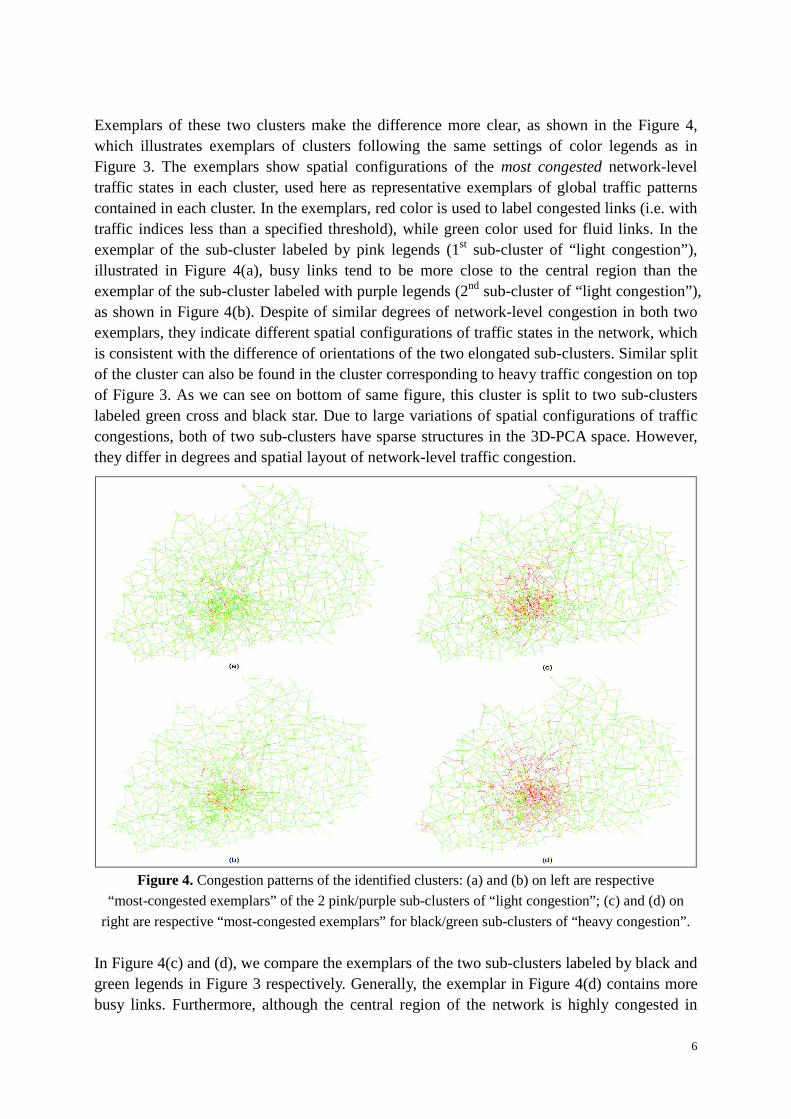
Exemplars of these two clusters make the difference more clear, as shown in the Figure 4, which illustrates exemplars of clusters following the same settings of color legends as in Figure 3. The exemplars show spatial configurations of the most congested network-level traffic states in each cluster, used here as representative exemplars of global traffic patterns contained in each cluster. In the exemplars, red color is used to label congested links (i.e. with traffic indices less than a specified threshold), while green color used for fluid links. In the exemplar of the sub-cluster labeled by pink legends (1st sub-cluster of “light congestion”), illustrated in Figure 4(a), busy links tend to be more close to the central region than the exemplar of the sub-cluster labeled with purple legends (2nd sub-cluster of “light congestion”), as shown in Figure 4(b). Despite of similar degrees of network-level congestion in both two exemplars, they indicate different spatial configurations of traffic states in the network, which is consistent with the difference of orientations of the two elongated sub-clusters. Similar split of the cluster can also be found in the cluster corresponding to heavy traffic congestion on top of Figure 3. As we can see on bottom of same figure, this cluster is split to two sub-clusters labeled green cross and black star. Due to large variations of spatial configurations of traffic congestions, both of two sub-clusters have sparse structures in the 3D-PCA space. However, they differ in degrees and spatial layout of network-level traffic congestion.
Figure 4. Congestion patterns of the identified clusters: (a) and (b) on left are respective
“most-congested exemplars” of the 2 pink/purple sub-clusters of “light congestion”; (c) and (d) on
right are respective “most-congested exemplars” for black/green sub-clusters of “heavy congestion”.
In Figure 4(c) and (d), we compare the exemplars of the two sub-clusters labeled by black and green legends in Figure 3 respectively. Generally, the exemplar in Figure 4(d) contains more busy links. Furthermore, although the central region of the network is highly congested in

7
both exemplars, the area to which network-level traffic congestion extend is wider in the exemplar shown in the Figure 4(d), especially in suburb regions. This implies a different setting of traffic scenarios in the simulation.
FROM STATE CLUSTERING TO CATEGORIZING DAILY EVOLUTION
In a typical setting of traffic scenario simulation, the whole traffic network is free-flowing at the beginning. Subsequently, traffic congestion emerges and becomes heavier and heavier until reaching the peak of traffic jam in rush hours. Finally, the network-level states return to free-flowing gradually. Therefore, network-level traffic states evolve in circular trajectories in the PCA space, as shown in Figure 5. Along the trajectories, transitions from the free-flow state to clusters corresponding to different types of network-level congestion patterns imply totally different temporal dynamic patterns of network-level traffic states. Comparing Figures 5 and 3, it is clear that the partition of global traffic states obtained with our method also corresponds to a categorization of the daily evolution of traffic, with green, pink and purple sub-clusters each corresponding to a subset of the possible daily dynamics.
Figure 5. The evolution trajectory of network-level traffic states, projected in 3D-PCA space
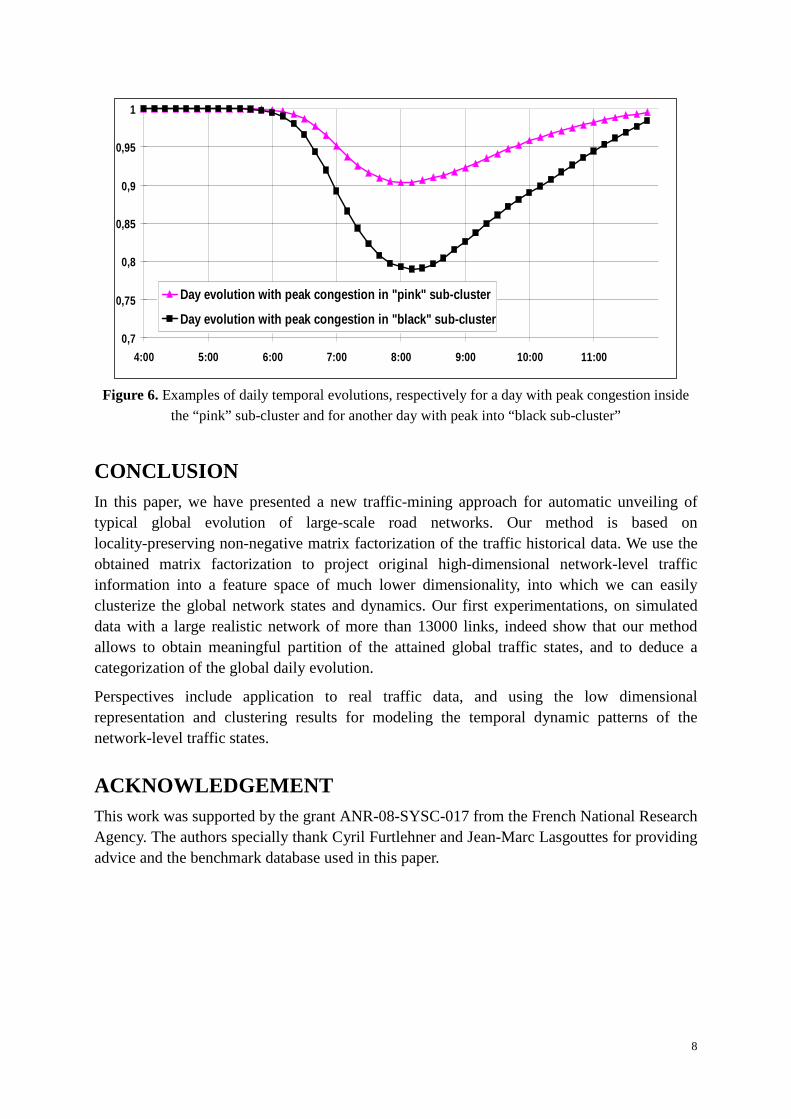
In order to verify this, we select two kinds of daily trajectories: both start from the free-flowing state but reach peaks of traffic congestions in the clusters labeled by pink (one of the 2 “light congestion” sub-clusters) and black legends respectively. Each trajectory is composed by observations of network-level traffic states at 48 time steps in our benchmark database. For each time step, we take the mean traffic index value of all 13627 links in the network as a crude measure of global traffic state at the current time. The lower it is, the heavier congestion occurs in the network. Within each type of trajectories, we calculate average of the mean traffic index at each time step, which results in a 48-D sequence of average values as a general temporal dynamic pattern of global traffic states in the corresponding type of trajectories. Figure 6 compare the two dynamic patterns. As we can see, trajectories with its peak of congestion located in the cluster labeled by black legends contain traffic jams that have longer durations and heavier congestion at their peak points. These two different temporal evolution processes of network-level traffic states represent different settings of requirements and supplies of traffic resources in the network. Crude as it is, this analysis provides us a hint that we could find typical temporal patterns of network-level traffic patterns based on the clustering results.
8
0,7
0,75
0,8
0,85
0,9
0,95
1
4:00 5:00 6:00 7:00 8:00 9:00 10:00 11:00
Day evolution with peak congestion in "pink" sub-cluster
Day evolution with peak congestion in "black" sub-cluster
Figure 6. Examples of daily temporal evolutions, respectively for a day with peak congestion inside
the “pink” sub-cluster and for another day with peak into “black sub-cluster”
CONCLUSION
In this paper, we have presented a new traffic-mining approach for automatic unveiling of typical global evolution of large-scale road networks. Our method is based on locality-preserving non-negative matrix factorization of the traffic historical data. We use the obtained matrix factorization to project original high-dimensional network-level traffic information into a feature space of much lower dimensionality, into which we can easily clusterize the global network states and dynamics. Our first experimentations, on simulated data with a large realistic network of more than 13000 links, indeed show that our method allows to obtain meaningful partition of the attained global traffic states, and to deduce a categorization of the global daily evolution.
Perspectives include application to real traffic data, and using the low dimensional representation and clustering results for modeling the temporal dynamic patterns of the network-level traffic states.
ACKNOWLEDGEMENT
This work was supported by the grant ANR-08-SYSC-017 from the French National Research Agency. The authors specially thank Cyril Furtlehner and Jean-Marc Lasgouttes for providing advice and the benchmark database used in this paper.

9
REFERENCES [1] R. Herring, A. Hofleitner, S. Amin, T. Nasr, A. Khalek, P. Abbeel and A. Bayen, "Using mobile
phones to forecast arterial traffic through statistical learning",in the 89th Transportation Research Board Annual Meeting, Washington D.C.,January 10-14 2010.
[2] B. Ghosh, B. Basu, and M. O’Mahony, "Multivariate short-term traffic flow forecasting using time-series analysis", IEEE Trans. Intell. Transport. Sys., vol. 10, no. 2, pp. 246–254, 2009.
[3] H. Kanoh et al., “Short-term traffic prediction using fuzzy c-means and cellular automata in a wide-area road network,” in Proceedings of the 8th International, ser. Conf. Intell. Transport. Sys. Vienna, Austria, 2005.
[4] D. Cai, X.F. He, X.Y. Wu, and J.W. Han, "Non-negative Matrix Factorization on Manifold", in Proceedings of International Conference on Data Mining, Italy, 2008.
[5] D. Cai, X.F. He, X.H. Wang, H.J. Bao and J.W. Han, "Locality Preserving Nonnegative Matrix Factorization", In Proceedings of International Joint Conference on Artificial Intelligence, Pasadena, CA, 2009.
[6] F.R.K. Chung, "Spectral Graph Theory", in Proceedings of AMS Regional Conference Series in Mathematics, vol.92,1997.
[7] W. Xu, X. Liu and Y.H. Gong, "Document Clustering Based on Non-negative Matrix Factorization", in Proceedings of ACM SIGIR 2003, Canada, 2003.
[8] F. Marchal, “Contribution to dynamic transportation models,” Ph.D.dissertation, University of Cergy-Pontoise, 2001.
[9] C. Furtlehner, Y.F. Han, J.M. Lasgouttes, V. Martin, F. Marchal and F. Moutarde, "Spatial and Temporal Analysis of Traffic States on Large Scale Networks", In Proceedings of Intelligent Transportation Systems Conference,Portugal, 2010.
[10] "TRAVESTI Project Wiki", http://travesti.gforge.inria.fr/