a new vision for long island’s economy · regional economic development councils 2011. suffolk....
TRANSCRIPT


A New Vision forLong Island’s
Economy
Regional Economic
Development CouncilsPutting New York Back to Work
Governor Andrew M. CuomoLieutenant Governor Robert J. Duffy

Table of Contents
Regional Economic Development Councils 2011
Section 1:Physical and Built Environment
Section 2:Economic Environment
Section 3:Policy Environment

Environmental Overview
Infrastructure
Real Estate
Culture, Tourism, and Quality of Life
Section 1: Physical and Built Environment
Regional Economic Development Councils 2011

Environmental Overview
Regional Economic Development Councils 2011
Suffolk
Nassau
Open SpaceBeing adjacent to New York City, most of Nassau County is fully developed. DEC oversees nearly 150 acres of open space there.
WaterThe county offers reservoirs and small ponds, as well as saltwater recreation. There are five boat ramps in the county.
FishingMost fishing is limited to the shore on small ponds in parks. Bass, trout and panfish are available. Bass fishing is catch-and-release only on the small ponds, so large fish are not uncommon.
FishingLake, pond and stream fishing are available. The Carmans River showcases native brook trout, the only trout species native to Long Island. Other ponds and lakes offer bass, trout and warm-water species. Fort Pond, in Montauk, offers fishing opportunities for largemouth bass, smallmouth bass
and walleye.
Open SpaceDEC oversees nearly 18,000 acres of land. Three of Suffolk County's ten townships are host to the 100,000+ acre region known as the Central Pine Barrens. The Central Pine Barrens overlies a portion of Long Island's federally designated sole source drinking water aquifer.
WaterThe county offers many salt-water and freshwater recreation opportunities. There are 22 public boat ramps; 13 operated by DEC.
Section 1: Physical and Built Environment

Environmental Map
Environmental Overview
Regional Economic Development Councils 2011
Section 1: Physical and Built Environment
Source: NYS Department of Environmental Conservation.

Transportation Indicators
Infrastructure
Regional Economic Development Councils 2011
Section 1: Physical and Built Environment
Source: NYS Department of Transportation.

Long Island 2008 Clean Water and Sewer Infrastructure Needs Survey
County Amount
Nassau $970,200,154
Suffolk $2,662,708,760
Total $3,632,908,914
Regional Economic Development Councils 2011
Infrastructure
Source: NYS Environmental Facilities Corporation; Community-reported data.
Section 1: Physical and Built Environment

New York Power Authority
Municipal & Cooperative Customers
The Power Authority provides electricity to 47 municipal and four rural electric cooperative systems across New York State. Thirteen of these systems (highlighted on the map) have signed long-term partnership agreements with NYPA, under which they receive their full electricity requirements with some of the cheapest power in the state.
Regional Economic Development Councils 2011
Infrastructure
Section 1: Physical and Built Environment

Pre-foreclosure Filings in 2010 asPercent of Loans Originated from 2004 to 2009
Real Estate
Regional Economic Development Councils 2011
17.3% 16.7%17.7%
14.9%
0%
2%
4%
6%
8%
10%
12%
14%
16%
18%
20%
Long Island Region Nassau Suffolk NEW YORK STATE
Source: NYS Homes & Community Renewal.
Section 1: Physical and Built Environment

Median Sales Price of Existing Single-Family HomesFourth Quarter 2010 compared to Fourth Quarter 2008
Real Estate
Regional Economic Development Councils 2011
County 4th Quarter 2010pPercent Change
4Q 2008 to 4Q 2010
Nassau $420,000 -1.2%
Suffolk $330,000 -7.0%
Section 1: Physical and Built Environment
Source: NYS Homes & Community Renewal, NYS Association of Realtors

Housing Report Card (2006 – 2010)
Real Estate
Regional Economic Development Councils 2011
Rental Preservation
Units
New Construction of
Rental Units
Homeowner Improvement
Units
Homebuyer Assistance
Units
Nassau 2,106 232 861 583
Suffolk 680 167 1,076 1,599
Total 2,786 399 1,937 2,182
Note: NYS Homes and Community Renewal records the affordable housing units assisted by programs administered by HCR, the New York State Office of Temporary Disability Assistance and the New York State Office of Mental Health.Rental Preservation Units – HCR-supported units that have either had their affordability period extended for existing and future tenants or assistance for moderate to gut rehabilitation of existing, aging affordable housing which also extends the affordability period. Source: NYS Homes & Community Renewal.
Section 1: Physical and Built Environment

Affordable Housing Coverage Rate
Real Estate
Regional Economic Development Councils 2011
CountyNumber of Renters at or Below 50% of AMI
Renter Coverage Rate
Number of Owners at or Below 50% of AMI
Homeowner Coverage Rate
Nassau 34,860 6.7% 56,155 2.6%
Suffolk 37,055 2.3% 66,095 4.0%
Total 71,915 4.5% 122,250 3.3%
Notes: The HCR Affordable Housing Renter and Homeowner Coverage Rate is a way of measuring the proportion of low-income residents in a county impacted by HCR programs funded 2006-2010. AMI – Area Median Income is the midpoint family income for a metropolitan area or a non-metropolitan county calculated each year by the US Department of Housing and Urban Development for use in determining eligibility for housing programs.Source: NYS Homes & Community Renewal, 2009 HUD Comprehensive Housing Affordability Strategy (CHAS) Data Book.
Section 1: Physical and Built Environment

Housing and Affordability Indicators
Real Estate
Regional Economic Development Councils 2011
Percent of Units that are Renter Occupied
Percent of Housing
Units Built Before 1940
Percent of Renters with ‘Severe Cost
Burden’
Percent of Owners with ‘Severe Cost
Burden’
Percent of Residential
Addresses that are Vacant
Nassau 16.9% 21.0% 27.2% 18.0% 1.2%
Suffolk 17.1% 10.5% 27.7% 18.1% 1.4%
Section 1: Physical and Built Environment
‘Severe cost burden’ is spending more than 50% of their gross income on housing costs.Source: NYS Homes & Community Renewal, Quarter 3 2010 HUD Aggregated United States Postal Service Data, 2009 HUD CHAS Data Book.
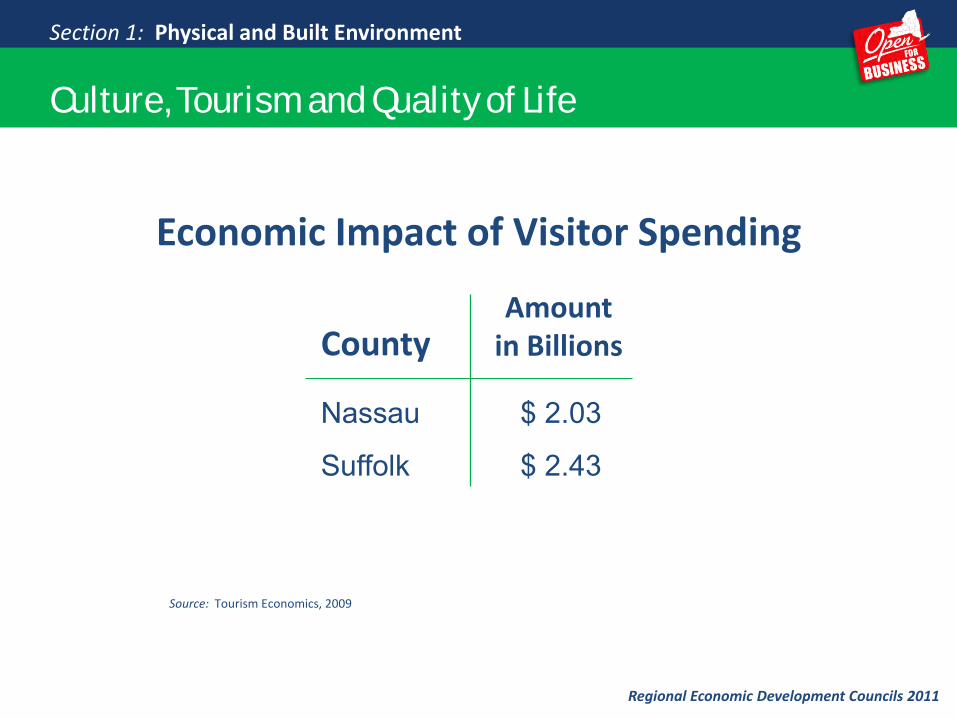
Economic Impact of Visitor Spending
Culture, Tourism and Quality of Life
Regional Economic Development Councils 2011
Nassau
Suffolk
$ 2.03
$ 2.43
CountyAmount
in Billions
Source: Tourism Economics, 2009
Section 1: Physical and Built Environment

Long Island’s State Parks and Historic Sites
5,739,3863,800,5551,624,9521,180,972
779,740756,940212,039
Jones BeachRobert MosesSunken MeadowCaptreeBethpage Golf CourseMontauk PointPlanting Fields Arboretum
Culture, Tourism and Quality of Life
Regional Economic Development Councils 2011
2009 Annual Attendance
Total attendance at the region’s 29 state parks and historic sites was over
19 million.
Section 1: Physical and Built Environment
Source: NYS Office of Parks, Recreation & Historic Preservation

Long Island State Parks and Historic Sites
Quality of Life
The recreational and natural resources created by the area’s parks and historic sites benefit this region by:
Maintaining the state’s ecosystem and biodiversity
Providing opportunities for recreation
Reducing the negative effects from pollution
Improving health outcomes
Preserving areas of historic importance
Influencing business location decisions by making the
community a better place to live
Culture, Tourism and Quality of Life
Regional Economic Development Councils 2011
Economic Impact
An economic impact study* estimates that in 2008-09, nearly 4,000 jobs were created and $410 million in local economic activity was generated by State Parks in the Long Island Region
*Source, The NYS Park System: An Economic Asset to the Empire State: Political Economy Research Institute, Univ. of Mass, Amherst, March, 2009
Section 1: Physical and Built Environment

Long Island’s State Parks and Historic Sites
Highlights:
Jones BeachLargest public swimming beach in the nation.
Bethpage Black Golf CourseTwice hosted the US Open Golf Championship.
Captree State ParkFamous for salt water fishing.
Culture, Tourism and Quality of Life
Regional Economic Development Councils 2011
Section 1: Physical and Built Environment

Culture, Tourism and Quality of Life
Regional Economic Development Councils 2011
Long Island State Parks and Historic SitesRegional Capital Needs
Jones Beach West Bathhouse renovations $12,000,000
Robert Moses Upgrade drinking water system $ 2,000,000
Belmont LakeLake restoration $ 2,500,000
The backlog of capital projects in the Long Island area is estimated to exceed $250 million.
CaptreeRehabilitate fishing pier and bulkhead $ 2,000,000
Sunken Meadow Rehabilitate swimming beach bathhouse $ 2,700,000
High Impact Projects:
Section 1: Physical and Built Environment

Regional Overview
Globalization
Changing Demographics
Workforce and Education
Industry Structure and Concentration
Regional Economic Development Councils 2011
Section 2: Economic Environment

Regional Overview
Regional Economic Development Councils 2011
Long Island always has been a special place, unique in ambiance, rich in history, rooted in tradition. It is a startling blend of quaint villages and high technology research centers; of quiet, wave-lapped coves and bustling downtowns. The region sent Lindbergh to Paris and the Lunar Landing Module to the moon. In the 1940s, Long Island manufacturers built World War II fighter planes. Today, biotechnology and R&D industries produce cancer-fighting drugs.
Diverse economic base. Highly-productive workforce. Top tourism destinations – beaches, water
sports, fine dining, and world class golf. Transportation infrastructure & proximity to
major markets. Renowned research institutions and highly
skilled labor force position the region for high-tech development.
Key Regional Assets
Section 2: Economic Environment

Regional Economic Development Councils 2011
Accelerate LI – Brookhaven National Lab, Stony Brook University, Cold Spring Harbor Lab, North Shore - LIJ Health Systems, Hofstra University, and Long Island Association leading efforts to improve technology commercialization in the region.
Enterprise Park at Calverton
SUNY Stony Brook CEWIT AEC Center for Advanced Technology Translational Medical Research Facility
Regional Overview
Nassau Hub
Hempstead Village/Renaissance Development
Redevelopment of 105-acre former Navy/Grumman site in Bethpage
Heartland Town Square/Mixed-Use Development Project
Wyandanch Rising
Canon
Major Economic Development Projects
Section 2: Economic Environment

Regional Economic Development Councils 2011
Pockets of distressed communities
Educational inequalities
Regional transportation challenges
Inefficient, redundant, and overlapping levels of government
Regional Overview
Aging population; flight of educated youth
Lack of workforce housing
Manufacturing decline
Aging sewer infrastructure
High property taxes and electric rates
Regional Issues/Challenges
Section 2: Economic Environment

New York Metropolitan MSA Exports at a Glance
Globalization
Regional Economic Development Councils 2011
Section 2: Economic Environment
Long Island is part of the nation’s largest MSA, the New York Metropolitan Area: 10 counties in New York State, 12 in New Jersey, and one in Pennsylvania.The rankings are out of the top 100 exporting MSAs in the U.S.GMP = Gross Metropolitan ProductSource: Brookings Institution

Metro Metro Rank 100 Largest Metro Areas United States
Exports ($ billions) $85.2 1 $1,037 $1,609
Exports as a share of GMP 7.3% 88 10.3% 11.4%
Number of export-related jobs 481,946 2 7,688,744 11,854,390
Real annual growth rate of exports, 2003-2008 7.8% 61 8.7% 9.2%
Average wages in leading export industry $105,213 5 $66.449 $45,563
Number of export clusters 9 17 6.7 N/A
Percentage of exports sold to Brazil, India and China 8.1% 89 8.6% 8.8%
New York Metro MSA’s Key Export Indicators for 2008
Source: Brookings InstitutionLong Island is part of the nation’s largest MSA, the New York Metro Area: 10 counties in New York State, 12 in New Jersey, and one in Pennsylvania.
Globalization
Regional Economic Development Councils 2011
Section 2: Economic Environment

Changing Demographics
Regional Economic Development Councils 2011
Suffolk
Nassau
Section 2: Economic Environment
Long Island’s population grew 2.9% from 2000 to 2010, the 3rd highest rate of growth of New York State’s ten regions.
Nassau County grew 0.4% and Suffolk grew 5.2%, the 38th and 11th highest growth rates, respectively.
Long Island has only two cities, both in Nassau County. Glen Cove grew 1.3% (29th fastest growing of the 62 cities) and Long Beach, which lost 6.2% of its population.
The Long Island regional ethnic composition is 68.7% white, 15.6% Hispanic, 8.6% black, and 5.4% Asian. The Hispanic population grew 56% from 2000 to 2010.
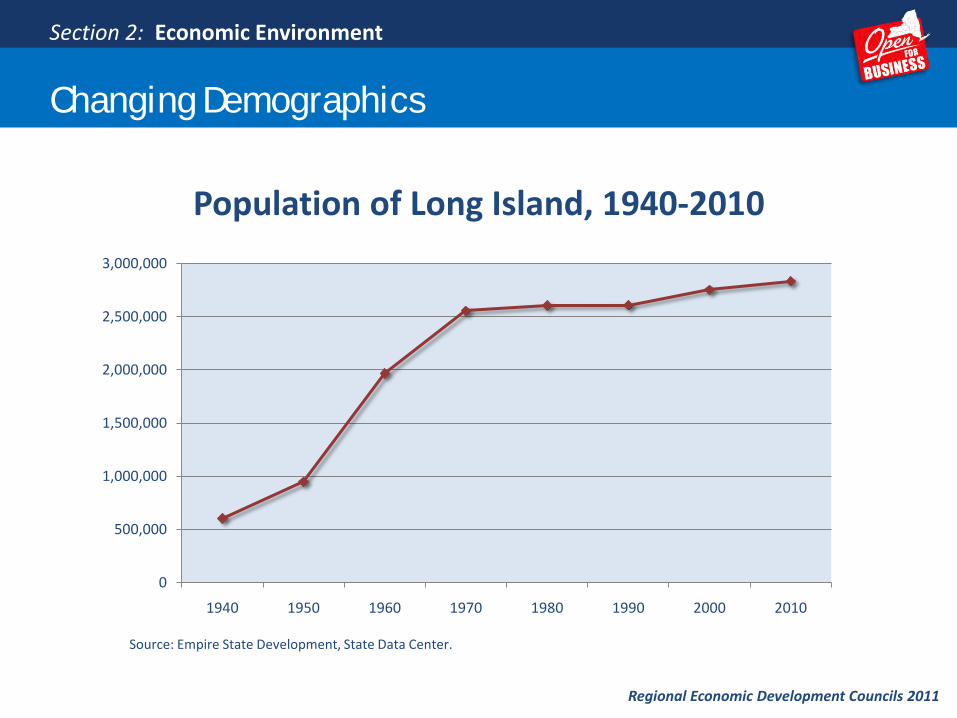
Population of Long Island, 1940-2010
Regional Economic Development Councils 2011
Changing Demographics
0
500,000
1,000,000
1,500,000
2,000,000
2,500,000
3,000,000
1940 1950 1960 1970 1980 1990 2000 2010
Source: Empire State Development, State Data Center.
Section 2: Economic Environment

Percent of Population Above 61 Years Old
Poverty Rate Median Household Income
United States 16.2% 13.5% $51,425
New York State 16.7% 13.8% $55,233
Long Island Region 17.7% 5.1% $88,057
Nassau County 18.7% 4.8% $92,450
Suffolk County 16.8% 5.4% $84,530
Long Island Socioeconomic Profile
Changing Demographics
Regional Economic Development Councils 2011
Source: Empire State Development, State Data Center. Age data is from 2010; poverty and income are from 2009.
Section 2: Economic Environment

Changing Demographics
Population Change 1990-2000 compared to 2000-2010
Long Island, by County
Regional Economic Development Councils 2011
0%
1%
2%
3%
4%
5%
6%
7%
8%
Long Island Nassau Suffolk
1990-2000
2000-2010
Source: Empire State Development, State Data Center
Section 2: Economic Environment
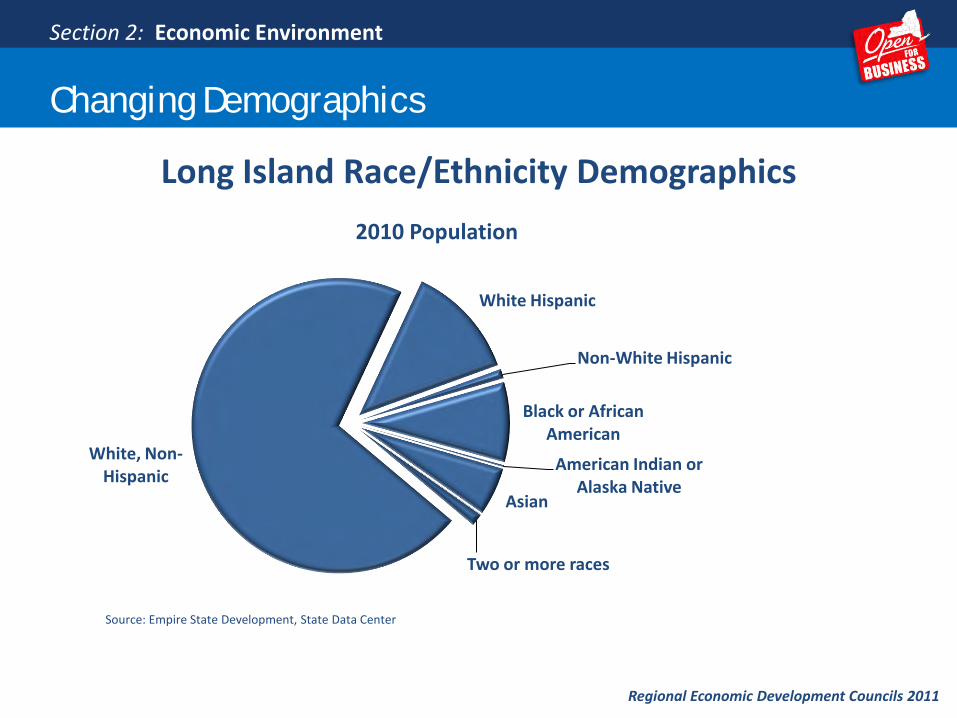
Long Island Race/Ethnicity Demographics
Changing Demographics
Regional Economic Development Councils 2011
White, Non-Hispanic
White Hispanic
Non-White Hispanic
Black or African American
American Indian or Alaska Native
Asian
Two or more races
2010 Population
Section 2: Economic Environment
Source: Empire State Development, State Data Center

Long Island Hispanic/Latino Population
Changing Demographics
Regional Economic Development Councils 2011
County 2000 2010 % Change
Nassau County
Hispanic/Latino 133,282 195,355 46.6%
Non-Hispanic/Non-Latino 1,201,262 1,144,177 -4.8%
Suffolk County
Hispanic/Latino 149,411 246,239 64.8%
Non-Hispanic/Non-Latino 1,269,958 1,247,111 -1.8%
Section 2: Economic Environment
Source: Empire State Development, State Data Center

In-Migration (to Long Island)
Year In-Migration Percent of Population
2008 56,234 2.0%
Top Migratory Regions In-Migrants
Queens County 19,724
Kings County 6,100
New York County 3,796
Bronx County 1,619
All other 1,006
Out-Migration (from Long Island)
Year Out-Migration Percent of Population
2008 67,356 2.4%
Top Migratory Regions Out-Migrants
Queens County 10,098
New York County 4,133
Kings County 3,597
Palm Beach, FL 1,603
Wake, NC 1,437
Changing Demographics
Regional Economic Development Councils 2011
Section 2: Economic Environment
Source: EMSI Strategic Advantage Model.

Educational Attainment on Long Island
Area
Percent of Adults with At Least a Bachelor’s
DegreePercent of Adults with a
Graduate Degree
Long Island 35.7% 15.8%
State 31.8% 13.6%
Nation 27.5% 10.1%
Changing Demographics
Regional Economic Development Councils 2011
Section 2: Economic Environment
Source: Empire State Development, State Data Center; American Community Survey 2005-2009.Note: ‘Adults’ are at least 25 years old.

Workforce & Education
Regional Economic Development Councils 2011
Section 2: Economic Environment

Workforce and Education
Regional Economic Development Councils 2011
Section 2: Economic Environment

Workforce and Education
Regional Economic Development Councils 2011
Section 2: Economic Environment
Long IslandPrivate, Not-for-Profit Colleges and Universities
NY Institute of Technology
Molloy College
Long Island University
Adelphi University Dowling College
Sources: Commission on Independent Colleges and Universities and the Long Island Regional Advisory Council on Higher Education
Hofstra University
Webb Institute
Watson School of Biological Sciences at Cold Spring Harbor Laboratory
NYU-Polytechnic Institute
Five Towns CollegeTouro College and Law Center
Briarcliffe CollegeSt. Joseph’s College

Long IslandMay2011
April2011
May2010
Labor Force 1,455,800 1,449,400 1,472,200
Unemployment 98,100 95,700 104,600
Local Unemployment Rate 6.7% 6.6% 7.1%
NY State Unemployment Rate 7.8% 7.6% 8.3%
U.S. Unemployment Rate 8.7% 8.7% 9.3%
Long Island Labor MarketLocal Area Unemployment Statistics
Workforce and Education
Regional Economic Development Councils 2011
Section 2: Economic Environment
Note: Data not seasonally adjusted.Source: NYS Department of Labor.
Workforce and Education
Regional Economic Development Councils 2011
Section 2: Economic Environment
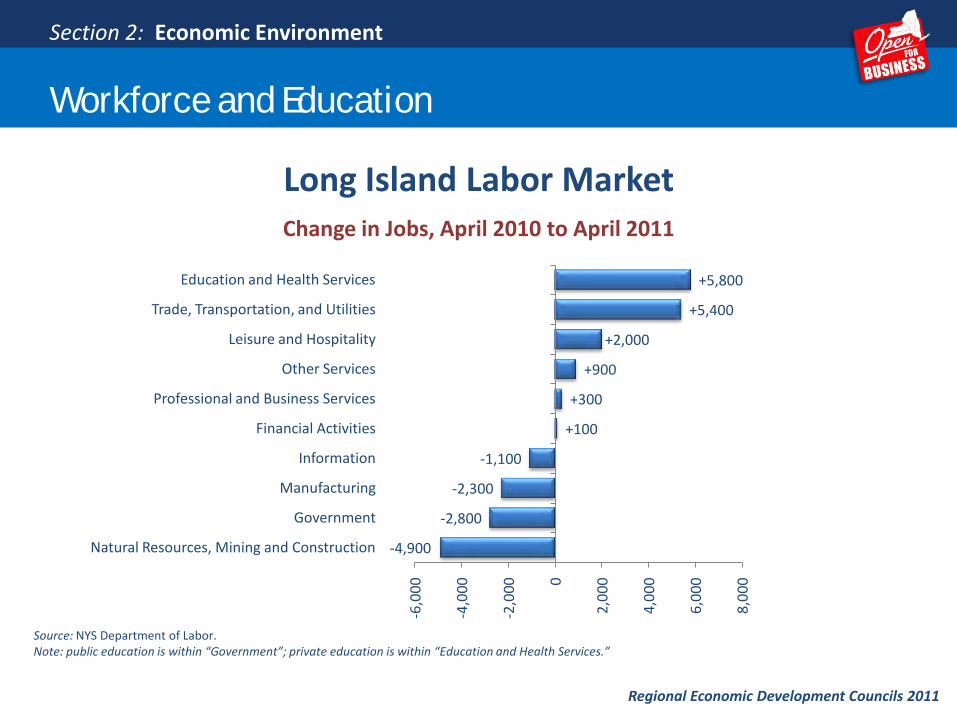
-4,900
-2,800
-2,300
-1,100
+100
+300
+900
+2,000
+5,400
+5,800
-6,0
00
-4,0
00
-2,0
00 0
2,0
00
4,0
00
6,0
00
8,0
00
Natural Resources, Mining and Construction
Government
Manufacturing
Information
Financial Activities
Professional and Business Services
Other Services
Leisure and Hospitality
Trade, Transportation, and Utilities
Education and Health Services
Source: NYS Department of Labor.Note: public education is within “Government”; private education is within “Education and Health Services.”
Long Island Labor MarketChange in Jobs, April 2010 to April 2011

Long Island Labor Market
Distribution of Nonfarm Jobs, May 2011
Workforce and Education
Regional Economic Development Councils 2011
Section 2: Economic Environment
Trade, Transportation,
and Utilities21%
Education and Health Services
19%
Government17%
Professional and Business Services
12%
Leisure and Hospitality8%
Manufacturing6%
Financial Activities6%
Natural Resources, Mining and Construction
5%
Other Services4%
Information2%
Total Nonfarm Jobs 1,235,500

Unionization Rate
Area Share of Employed Workers
New York Metro Area MSA 21.4%
New York State 24.2%
United States 11.9%
Workforce and Education
Regional Economic Development Councils 2011
Section 2: Economic Environment
Source: Current Population Survey, calculations by unionstats.com, 2010.

Growth in Long Island Regional Sectors
Industry Structure and Concentration
Regional Economic Development Councils 2011
Section 2: Economic Environment
Jobs in 2010 Growth since 2006Average weekly
wage 2010
Projected growth,
2008 to 2018
Specialty Trade Contractors 40,955 -13.6% $1,133 -4.9%Chemical Manufacturing 10,660 6.9% $1,284 -2.1%Fabricated Metal Product Manufacturing 7,803 -13.3% $1,051 -17.6%Machinery Manufacturing 4,862 -22.2% $1,505 -16.4%Computer and Electronic Product Mfg 13,796 -13.1% $1,607 -26.9%Electrical Equipment and Appliances 2,547 2.7% $1,381 -22.0%Transportation Equipment Manufacturing 4,365 -17.2% $1,578 -49.1%Merchant Wholesalers, Durable Goods 32,730 -9.1% $1,371 -5.2%Merchant Wholesalers, Nondurable Goods 22,683 -1.7% $1,263 3.4%General Merchandise Stores 24,057 6.4% $418 11.2%Insurance Carriers & Related Activities 23,960 -10.4% $1,367 -14.1%Professional and Technical Services 69,943 -2.0% $1,264 11.2%Management of Companies and Enterprises 16,034 -5.2% $1,895 3.5%Ambulatory Health Care Services 74,481 10.8% $1,032 24.0%Hospitals 62,646 22.9% $1,264 3.1%Nursing and Residential Care Facilities 34,909 3.2% $701 24.5%Food Services and Drinking Places 73,882 6.9% $370 8.2%
Source: NYS Department of Labor.

Location Quotient of Industry Clusters in the Long Island Region
Location quotient (LQ) is a way of quantifying how concentrated a particular industry, cluster, occupation, or demographic group is in a region as compared to the nation. It can reveal what makes a particular region unique in comparison to the national average.. Source: EMSI Strategic Advantage model.
Industry Structure and Concentration
Regional Economic Development Councils 2011
Section 2: Economic Environment
Financial Services Biomedical
Travel & TourismBack Office
Info Technology
Electronics
Misc. Manuf.Distribution
Front Office
Communications

Source: D&B Market Insight
Number of New Manufacturers: 378 (16.0% of state total)
Number of New Manufacturing Jobs: 1,728 (18.1% of state total)
New Manufacturing Activity on Long Island
January 2010 to April 2011
Industry Structure and Concentration
Regional Economic Development Councils 2011
Section 2: Economic Environment

Industry Structure and Concentration
Regional Economic Development Councils 2011
Biomedical Cluster:
420 companies11,790 employees
Section 2: Economic Environment
Source: Empire State Development analysis of NYS Department of Labor data, 2008.

Industry Structure and Concentration
Regional Economic Development Councils 2011
Distribution Cluster:
7,470 companies40,450 employees
Section 2: Economic Environment
Source: Empire State Development analysis of NYS Department of Labor data, 2008.
Industry Structure and Concentration
Regional Economic Development Councils 2011
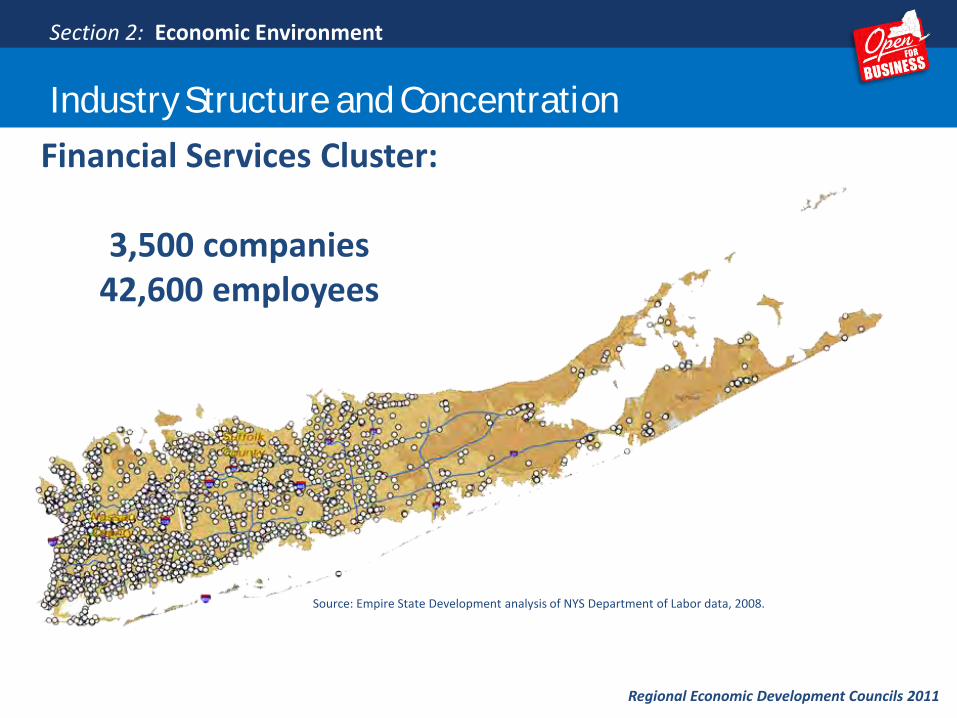
Financial Services Cluster:
3,500 companies42,600 employees
Section 2: Economic Environment
Source: Empire State Development analysis of NYS Department of Labor data, 2008.

Industry Structure and Concentration
Regional Economic Development Councils 2011
Front Office Cluster:
9,500 companies62,200 employees
Section 2: Economic Environment
Source: Empire State Development analysis of NYS Department of Labor data, 2008.

Industry Structure and Concentration
Regional Economic Development Councils 2011
Information Technology Cluster:
1,780 companies8,850 employees
Section 2: Economic Environment
Source: Empire State Development analysis of NYS Department of Labor data, 2008.

Travel & Tourism Cluster:
8,900 companies28,500 employees
Industry Structure and Concentration
Regional Economic Development Councils 2011
Section 2: Economic Environment
Source: Empire State Development analysis of NYS Department of Labor data, 2008.

Industry Structure and Concentration
Regional Economic Development Councils 2011
1,118
34,127
1,288
34,404
0
10,000
20,000
30,000
40,000
Nassau Suffolk
Acr
es
Acres of Farmland 2002/2007
2002 2007
17
52
22
59
0
25
50
75
Nassau Suffolk
Acr
es
Average Farm Size 2002/2007
2002 2007
7%
24%
93%
76%
Suffolk
Nassau
Distribution of Farm Sales 2007
Livestock Crops
$126,938
$309,035$267,780
$415,270
$0
$100,000
$200,000
$300,000
$400,000
$500,000
Nassau Suffolk
Average Farm Sales 2002/2007
2002 2007
Section 2: Economic Environment

Policy Environment
Governance
Statewide Business Costs and Tax Structure
Entrepreneurialism, Innovation and Risk-taking
Regional Economic Development Councils 2011
Section 3: Policy Environment

State and Local Government Expenditures Per Capita
CategoryRanking
(1 = Highest Spending, 50 = Lowest Spending)
State Corrections 17State Social Insurance Administration 10State Health Administration 35State Hospitals 8State Public Welfare Administration 45
Local Corrections 1Local Health Administration 11Local Hospitals 11
Local Public Welfare 1Local Police Protection 1Local Housing and Community Development 1Local Fire Protection 10Local Police Protection 1
K-12 Instructional Employees 13K-12 Non-Instructional Employees 21
Section 3: Policy Environment
Governance
Regional Economic Development Councils 2011
Source: U.S. Census Bureau “Census of Governments 2007.”

Long Island Villages with a Population Below 500
Centre Island (Nassau)
Cove Neck (Nassau)
Hewlett Bay Park (Nassau)
Hewlett Neck (Nassau)
Dering Harbor (Suffolk)
Ocean Beach (Suffolk)
Sagaponack (Suffolk)
Saltaire (Suffolk)
West Hampton Dunes (Suffolk)
Governance
Regional Economic Development Councils 2011
410
286
404
445
11
79
313
37
55
Section 3: Policy Environment
Source: Empire State Development, State Data Center

Triple-Layering(three layers of general purpose
local government)
Regional Economic Development Councils 2011
Governance
Percent of Population in Triple-layered Communities
Section 3: Policy Environment
Source: NYS Commission on Local Government Efficiency and Competitiveness, 2008

Unreserved Fund Balances Less Than
1.5 % of Gross Expenditures
Municipalities withTotal Debt as a
Percentage of Full Value Assessment in Greater
Than 3.25%
Municipalities with Total Debt Per Capita in Top 10% of State
Municipalities with Operating Deficits as a
Percent of Gross Expenditures in the
Top 10% of State
Long Island 11.5% 0.9% 20.4% 9.1%
NY State 5.7% 10.0% 10.0% 10.0%
Regional Economic Development Councils 2011
Governance
Section 3: Policy Environment
Local Fiscal Capacity: Municipalities with Financial Stress
Source: NYS Environmental Facilities Corporation.

Long Island Cost of Doing Business & Cost of Living
Statewide Business Costs and Tax Structure
Regional Economic Development Councils 2011
Source: Moody’s Analytics, May 2011
Metro AreaCost of Doing
Business Index(US = 100)
Cost of Living Index(US = 100)
Nassau-Suffolk 107 130
Section 3: Policy Environment

New York State
Innovation Rankings
2010
Source: Kauffman Foundation
IndicatorNew York's Ranking
(1 = Best, 50 = Worst)High-Wage Traded Services 3
E-Government 4
Managerial, Professional, Technical Jobs 6
Broadband Telecommunications 6
Overall 10
Foreign Direct Investment 10
IPOs 10
Entrepreneurial Activity 10
Patents 10
Workforce Education 12
Migration of U.S. Knowledge Workers 12
Fastest-Growing Firms 12
Alternative Energy Use 12
IT Professionals 13
Export Focus of Manufacturing & Services 14
Venture Capital 14
Online Agriculture 17
Job Churning 19
Investor Patents 21
Immigration of Knowledge Workers 24
Manufacturing Value-Added 24
High-Tech Jobs 25
Scientists and Engineers 25
Industry Investment in R&D 26
Non-Industry Investment in R&D 31
Online Population 34
Health IT 39
Entrepreneurialism, Innovation and Risk-taking
Regional Economic Development Councils 2011
Section 3: Policy Environment

Appendix
Existing Regional Strategies
Regional Economic Development Councils 2011
Long Island Association www.longislandassociation.org2009-10 Long Island Fact BookProvides a detailed description of the Nassau and Suffolk County economies from an economist’s perspective, but does not provide a strategic vision of the future.
Long Island Regional Planning Councilwww.lirpc.orgLong Island 2035 Visioning InitiativeDesigned to help achieve a regional public consensus on where the next generation of Long Islanders could live and work and the transportation systems required to support these settlements. This plan is more focused on land use and transportation issues than economic development.
A New Vision forLong Island’s
Economy
Regional Economic
Development CouncilsPutting New York Back to Work
Governor Andrew M. CuomoLieutenant Governor Robert J. Duffy