a new volcanic province: an inventory of subglacial ... · improving our understanding of...
TRANSCRIPT
A new volcanic province: an inventory of subglacialvolcanoes in West Antarctica
MAXIMILLIAN VAN WYK DE VRIES*, ROBERT G. BINGHAM & ANDREW S. HEIN
School of GeoSciences, University of Edinburgh, Drummond Street, Edinburgh EH8 9XP, UK
*Correspondence: [email protected]
Abstract: The West Antarctic Ice Sheet overlies the West Antarctic Rift System about which, dueto the comprehensive ice cover, we have only limited and sporadic knowledge of volcanic activityand its extent. Improving our understanding of subglacial volcanic activity across the province isimportant both for helping to constrain how volcanism and rifting may have influenced ice-sheetgrowth and decay over previous glacial cycles, and in light of concerns over whether enhanced geo-thermal heat fluxes and subglacial melting may contribute to instability of the West Antarctic IceSheet. Here, we use ice-sheet bed-elevation data to locate individual conical edifices protrudingupwards into the ice across West Antarctica, and we propose that these edifices represent subglacialvolcanoes. We used aeromagnetic, aerogravity, satellite imagery and databases of confirmed volca-noes to support this interpretation. The overall result presented here constitutes a first inventory ofWest Antarctica’s subglacial volcanism. We identified 138 volcanoes, 91 of which have not previ-ously been identified, and which are widely distributed throughout the deep basins of West Antarc-tica, but are especially concentrated and orientated along the >3000 km central axis of the WestAntarctic Rift System.
Gold Open Access: This article is published under the terms of the CC-BY 3.0 license.
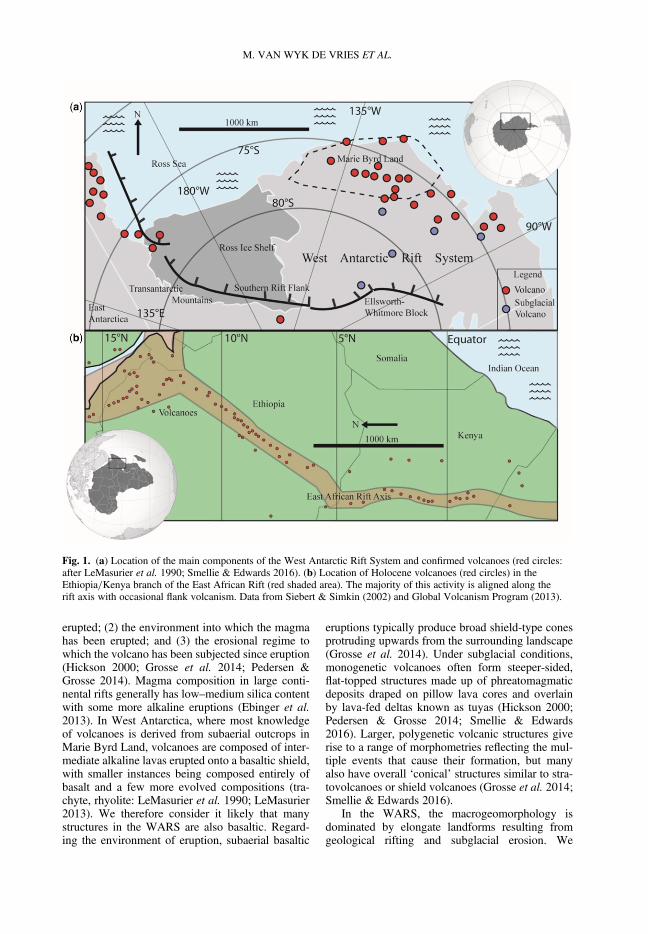
West Antarctica hosts one of the most extensiveregions of stretched continental crust on the Earth,comparable in dimensions and setting to the EastAfrican Rift System and the western USA’s Basinand Range Province (Fig. 1) (e.g. see Behrendtet al. 1991; Dalziel 2006; Kalberg et al. 2015). Im-proved knowledge of the region’s geological struc-ture is important because it provides the templateover which the West Antarctic Ice Sheet (WAIS)has waxed and waned over multiple glaciations(Naish et al. 2009; Pollard & DeConto 2009; Jamie-son et al. 2010), and this provides a first-ordercontrol on the spatial configuration of the WAIS’ice dynamics (Studinger et al. 2001; Jordan et al.2010, Bingham et al. 2012). The subglacial regiontoday is characterized by an extensive and complexnetwork of rifts, which is likely to have initiated atvarious times since the Cenozoic (Fitzgerald 2002;Dalziel 2006; Siddoway 2008; Spiegel et al. 2016),and which in some locations may still be active (Beh-rendt, et al. 1998; LeMasurier 2008; Lough et al.2013; Schroeder et al. 2014). Collectively, this seriesof rifts beneath the WAIS has been termed the WestAntarctic Rift System (WARS), and is bounded bythe Transantarctic Mountains to the south (Fig. 1).
In other major rift systems of the world, riftinteriors with thin, stretched crust are associatedwith considerable volcanism (e.g. Siebert & Simkin2002). However, in West Antarctica, only a fewstudies have identified subglacial volcanoes and/or
volcanic activity (e.g. Blankenship et al. 1993;Behrendt et al. 1998, 2002; Corr & Vaughan 2008;Lough et al. 2013), with the ice cover having deterreda comprehensive identification of the full spreadof volcanoes throughout the WARS. Improving onthis limited impression of the WARS’ distributionof volcanism is important for several reasons. Firstly,characterizing the geographical spread of volcanicactivity across the WARS can complement widerefforts to understand the main controls on rift vol-canism throughout the globe (Ellis & King 1991;Ebinger et al. 2010). Secondly, volcanic edifices,by forming ‘protuberances’ at the subglacial inter-face, contribute towards the macroscale roughnessof ice-sheet beds, which in turn forms a first-orderinfluence on ice flow (cf. Bingham & Siegert 2009).Thirdly, volcanism affects geothermal heat flowand, hence, basal melting, potentially also impactingupon ice dynamics (Blankenship et al. 1993; Vogelet al. 2006). Fourthly, it has been argued that sub-glacial volcanic sequences can be used to recoverpalaeoenvironmental information from Quaternaryglaciations, such as palaeo-ice thickness and thermalregime (e.g. Smellie 2008; Smellie & Edwards 2016).
In this contribution, we present a new regional-scale assessment of the likely locations of volca-noes in West Antarctica based on a morphometric(or shape) analysis of West Antarctica’s ice-bedtopography. Volcano shape depends on three prin-cipal factors: (1) the composition of the magma
From: SIEGERT, M. J., JAMIESON, S. S. R. & WHITE, D. A. (eds) Exploration of Subsurface Antarctica: UncoveringPast Changes and Modern Processes. Geological Society, London, Special Publications, 461,https://doi.org/10.1144/SP461.7© 2017 The Author(s). Published by The Geological Society of London.Publishing disclaimer: www.geolsoc.org.uk/pub_ethics
erupted; (2) the environment into which the magmahas been erupted; and (3) the erosional regime towhich the volcano has been subjected since eruption(Hickson 2000; Grosse et al. 2014; Pedersen &Grosse 2014). Magma composition in large conti-nental rifts generally has low–medium silica contentwith some more alkaline eruptions (Ebinger et al.2013). In West Antarctica, where most knowledgeof volcanoes is derived from subaerial outcrops inMarie Byrd Land, volcanoes are composed of inter-mediate alkaline lavas erupted onto a basaltic shield,with smaller instances being composed entirely ofbasalt and a few more evolved compositions (tra-chyte, rhyolite: LeMasurier et al. 1990; LeMasurier2013). We therefore consider it likely that manystructures in the WARS are also basaltic. Regard-ing the environment of eruption, subaerial basaltic
eruptions typically produce broad shield-type conesprotruding upwards from the surrounding landscape(Grosse et al. 2014). Under subglacial conditions,monogenetic volcanoes often form steeper-sided,flat-topped structures made up of phreatomagmaticdeposits draped on pillow lava cores and overlainby lava-fed deltas known as tuyas (Hickson 2000;Pedersen & Grosse 2014; Smellie & Edwards2016). Larger, polygenetic volcanic structures giverise to a range of morphometries reflecting the mul-tiple events that cause their formation, but manyalso have overall ‘conical’ structures similar to stra-tovolcanoes or shield volcanoes (Grosse et al. 2014;Smellie & Edwards 2016).
In the WARS, the macrogeomorphology isdominated by elongate landforms resulting fromgeological rifting and subglacial erosion. We
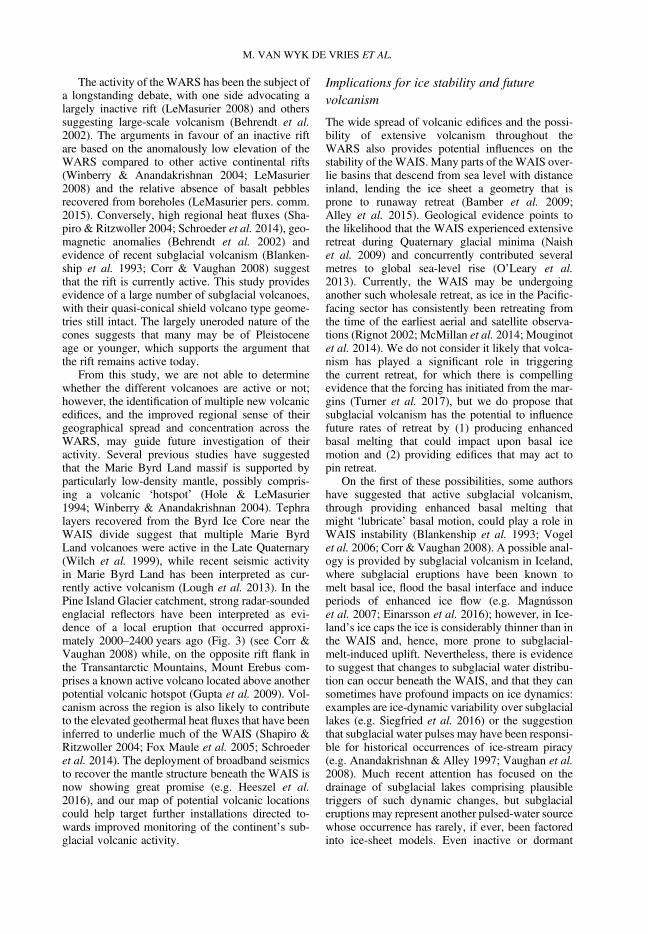
Fig. 1. (a) Location of the main components of the West Antarctic Rift System and confirmed volcanoes (red circles:after LeMasurier et al. 1990; Smellie & Edwards 2016). (b) Location of Holocene volcanoes (red circles) in theEthiopia/Kenya branch of the East African Rift (red shaded area). The majority of this activity is aligned along therift axis with occasional flank volcanism. Data from Siebert & Simkin (2002) and Global Volcanism Program (2013).
M. VAN WYK DE VRIES ET AL.
propose here that, in this setting, the most reasonableexplanation for any ‘cones’ being present is that theymust be volcanic in origin. We define ‘cones’ as anyfeatures that have a low length/width ratio viewedfrom above; hence, for this study, we include coneseven with very low slope angles. Thus, we usecones in this subglacial landscape as diagnostic ofthe presence of volcanoes. We note that identifyingcones alone will by no means identify all volcanismin the WARS. For example, volcanic fissures erup-tions, a likely feature of rift volcanism, will yieldridge forms, or ‘tindars’ (Smellie & Edwards 2016),rather than cones. Moreover, in the wet basal envi-ronment of the WAIS, the older the cone the morelikely it will have lost its conical form from sub-glacial erosion. Therefore, cones present today arelikely to be relatively young – although we cannotuse our method to distinguish whether or not thefeatures are volcanically active.
Methods
Our underpinning methodology was to identifycones that protrude upwards from a digital elevationmodel (DEM) of Antarctica’s subglacial topography,and to assess the likelihood that each cone is a vol-canic edifice. We undertook our analysis on theBedmap2 DEM (Fretwell et al. 2013) domainencompassed by the WARS, which incorporates allof West Antarctica, the Ross Ice Shelf and the Trans-antarctic Mountains fringing East Antarctica thatflank the WARS (Elliott 2013). Importantly, whileBedmap2 represents the state-of-the-art knowledgeof West Antarctica’s subglacial landscape, it isderived from variable data coverage, the vast major-ity of the data being sourced from airborne radar-sounding acquired along one-dimensional tracks.Along the radar tracks the horizontal spacing ofbed-elevation data points can reach a few metres,but between tracks the spacing is often several kilo-metres. The DEM itself is presented as a 1 kmgridded product, although the raw data were initiallygridded at 5 km (Fretwell et al. 2013). Therefore,while the DEM cannot capture the fine-scale topog-raphy now routinely acquired by satellite and air-borne altimetry, and which has been exploited formultiple morphometric analyses (e.g. Pedersen &Grosse 2014; Lindback & Pettersson 2015; Elyet al. 2016), it nevertheless presents a workable start-ing point for identifying volcanic edifices. We con-sider how some of the DEM’s limitations can beovercome in our analysis below.
We defined a cone as an upwards protuberancefrom the DEM whose elongation ratio (widthv. length) <1.5. Over the domain, but excluding non-grounded ice (primarily the Ross Ice Shelf) wherethe subglacial topography is poorly characterized,
we first extracted cones protruding at least 100 mfrom the surrounding terrain. The bed-elevation un-certainties within the DEM prevent reliable identifi-cation of smaller edifices. Elevation profiles acrosseach cone were then extracted from Bedmap2 atmultiple angles with respect to the current ice-flowdirection (taken from Rignot et al. 2011). Whereradar profiles directly traversed a cone, we furthercross-checked the shape of the bed directly fromthe raw data. This is part of our procedure foraccounting for any artefacts in Bedmap2, whichinvolves corroborating our identified volcanoeswith auxiliary datasets. To assess the likelihoodthat the Bedmap2-extracted cones were (a) notmerely interpolation-induced artefacts and (b) likelyrepresent volcanoes, we implemented a schemewherein points were awarded where auxiliary dataground-truthed the bed DEM and/or gave greaterconfidence in a volcanic interpretation. The assess-ment criteria are as follows, with points awardedfor each and data-source references given in Table 1:
(1) Whether a cone is found within 5 km of thenearest raw ice-thickness data.
(2) Whether a cone is overlain by an upwards-protruding prominence in the surface of theice draped over it. This criterion takes advan-tage of the fact that, under the right balancebetween ice thickness and ice-flow speed, sub-glacial topographical prominences can beexpressed at the ice surface (e.g. De Rydtet al. 2013).
(3) Whether a cone is discernible as a feature at theice surface in visible satellite imagery. Variousrecent studies have demonstrated that subgla-cial features can be outlined by visible expres-sions in surface imagery (e.g. Ross et al. 2014;Chang et al. 2015; Jamieson et al. 2016).
(4) Whether a cone is associated with a clear con-centric magnetic anomaly. This depends onthe potential volcano having a pillow-lavacore, rather than being composed solely oftuff. This is consistent with the thicknessof ice overlying the cones and the erodibilityof tuff/tephra deposits. Strong geomagneticanomalies have long been suggested as evi-dence of subglacial volcanism in the WARS(e.g. Behrendt et al. 1998, 2002).
(5) Whether a cone is associated with a concentricfree-air and/or Bouguer anomaly.
Each cone was assigned a final confidence factorvalue of between 0 and 5 by summing up the pointsfrom the five indicators described above (Table 1).
Results
Our morphometric analysis of subglacial West Ant-arctica recovers a total of 178 conical structures
SUBGLACIAL VOLCANOES IN WEST ANTARCTICA
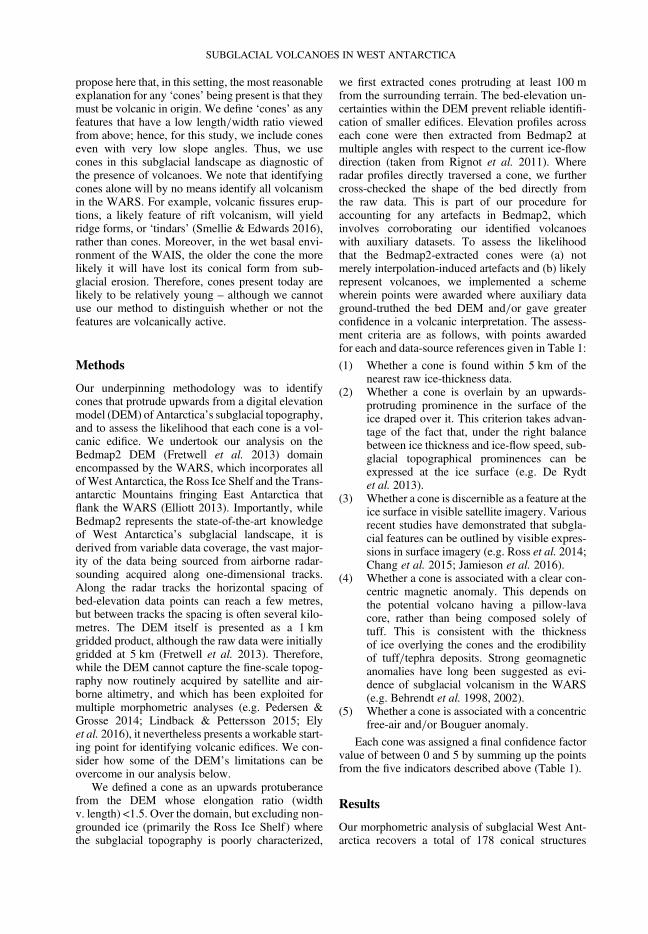
Table 1. Classification scheme used in assessing confidence that a cone extracted from Bedmap2 (Fretwell et al. 2013) can be interpreted as a volcano
Confidence assessment criterion Dataset/source Confidence score
0 0.5 1
(1) Distance to nearest raw ice-thicknessmeasurement
Figure 3 in Fretwell et al. (2013) >15 km 5–15 km <5 km
(2) Expression in ice-surface DEM overlyingidentified subglacial cone
Bedmap2 ice-surface DEM: Fretwellet al. (2013)
No expression Associated but off-centre anomaly
Direct overlyinganomaly
(3) Expression in MODIS imagery of the icesurface overlying the identifiedsubglacial cone
MODIS Mosaic of Antarctica:Scambos et al. (2007)
No expression Weak expression Clear expression
(4) Magnetic anomaly data ADMAP: Kim et al. (2007) No anomaly Weak anomaly Clear anomaly
(5) Gravity anomaly data Studinger et al. (2002); Damiani et al.(2014); Scheinert et al. (2016)
No anomaly Weak anomaly Clear anomaly
Full scores are given in Table 2.
M.V
ANWYKDEVRIESETAL.
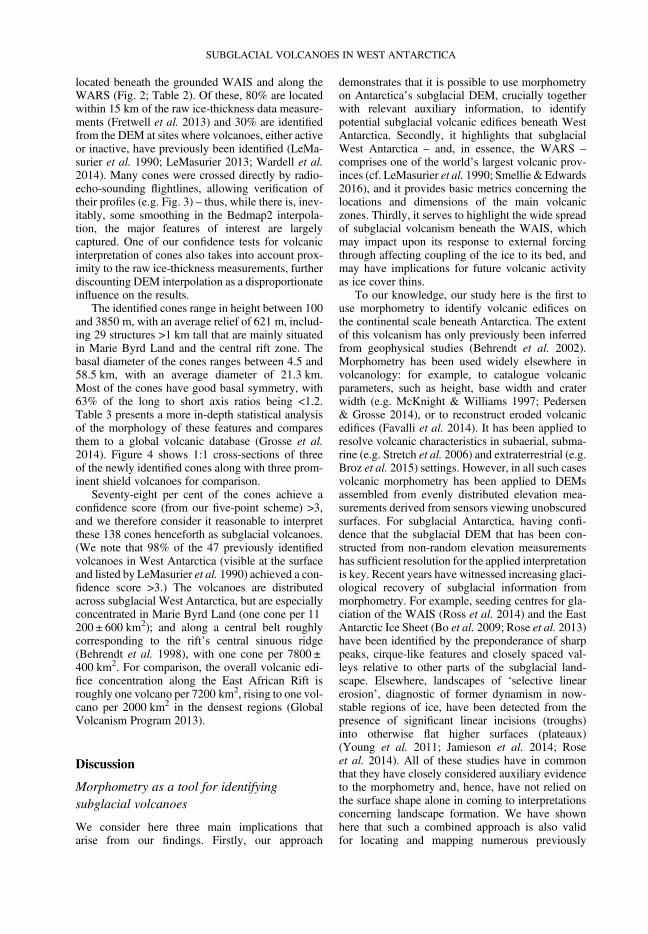
located beneath the grounded WAIS and along theWARS (Fig. 2; Table 2). Of these, 80% are locatedwithin 15 km of the raw ice-thickness data measure-ments (Fretwell et al. 2013) and 30% are identifiedfrom the DEM at sites where volcanoes, either activeor inactive, have previously been identified (LeMa-surier et al. 1990; LeMasurier 2013; Wardell et al.2014). Many cones were crossed directly by radio-echo-sounding flightlines, allowing verification oftheir profiles (e.g. Fig. 3) – thus, while there is, inev-itably, some smoothing in the Bedmap2 interpola-tion, the major features of interest are largelycaptured. One of our confidence tests for volcanicinterpretation of cones also takes into account prox-imity to the raw ice-thickness measurements, furtherdiscounting DEM interpolation as a disproportionateinfluence on the results.
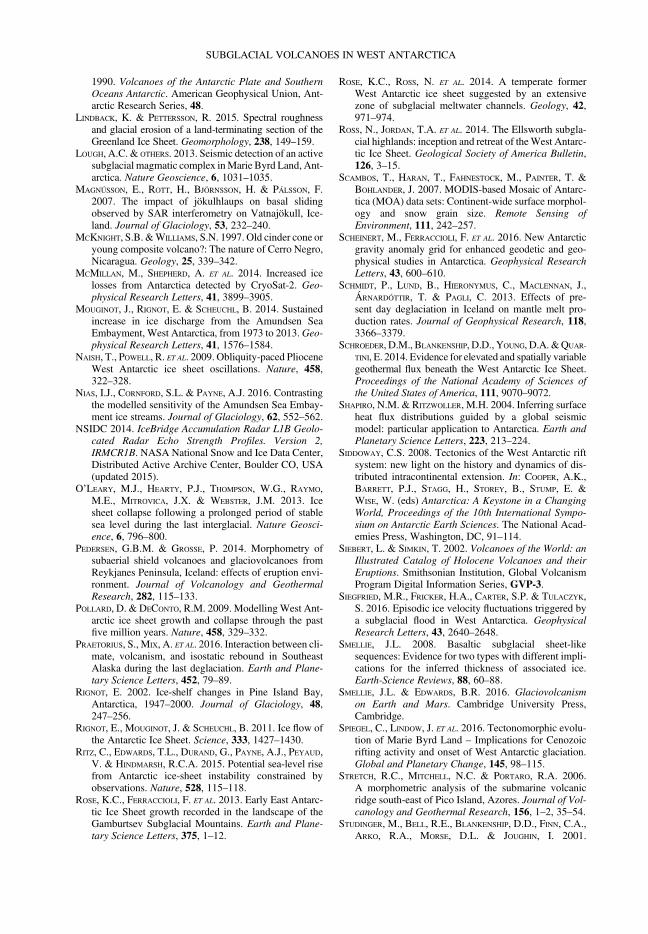
The identified cones range in height between 100and 3850 m, with an average relief of 621 m, includ-ing 29 structures >1 km tall that are mainly situatedin Marie Byrd Land and the central rift zone. Thebasal diameter of the cones ranges between 4.5 and58.5 km, with an average diameter of 21.3 km.Most of the cones have good basal symmetry, with63% of the long to short axis ratios being <1.2.Table 3 presents a more in-depth statistical analysisof the morphology of these features and comparesthem to a global volcanic database (Grosse et al.2014). Figure 4 shows 1:1 cross-sections of threeof the newly identified cones along with three prom-inent shield volcanoes for comparison.
Seventy-eight per cent of the cones achieve aconfidence score (from our five-point scheme) >3,and we therefore consider it reasonable to interpretthese 138 cones henceforth as subglacial volcanoes.(We note that 98% of the 47 previously identifiedvolcanoes in West Antarctica (visible at the surfaceand listed by LeMasurier et al. 1990) achieved a con-fidence score >3.) The volcanoes are distributedacross subglacial West Antarctica, but are especiallyconcentrated in Marie Byrd Land (one cone per 11200 ± 600 km2); and along a central belt roughlycorresponding to the rift’s central sinuous ridge(Behrendt et al. 1998), with one cone per 7800 ±400 km2. For comparison, the overall volcanic edi-fice concentration along the East African Rift isroughly one volcano per 7200 km2, rising to one vol-cano per 2000 km2 in the densest regions (GlobalVolcanism Program 2013).
Discussion
Morphometry as a tool for identifyingsubglacial volcanoes
We consider here three main implications thatarise from our findings. Firstly, our approach
demonstrates that it is possible to use morphometryon Antarctica’s subglacial DEM, crucially togetherwith relevant auxiliary information, to identifypotential subglacial volcanic edifices beneath WestAntarctica. Secondly, it highlights that subglacialWest Antarctica – and, in essence, the WARS –
comprises one of the world’s largest volcanic prov-inces (cf. LeMasurier et al. 1990; Smellie & Edwards2016), and it provides basic metrics concerning thelocations and dimensions of the main volcaniczones. Thirdly, it serves to highlight the wide spreadof subglacial volcanism beneath the WAIS, whichmay impact upon its response to external forcingthrough affecting coupling of the ice to its bed, andmay have implications for future volcanic activityas ice cover thins.
To our knowledge, our study here is the first touse morphometry to identify volcanic edifices onthe continental scale beneath Antarctica. The extentof this volcanism has only previously been inferredfrom geophysical studies (Behrendt et al. 2002).Morphometry has been used widely elsewhere involcanology: for example, to catalogue volcanicparameters, such as height, base width and craterwidth (e.g. McKnight & Williams 1997; Pedersen& Grosse 2014), or to reconstruct eroded volcanicedifices (Favalli et al. 2014). It has been applied toresolve volcanic characteristics in subaerial, subma-rine (e.g. Stretch et al. 2006) and extraterrestrial (e.g.Broz et al. 2015) settings. However, in all such casesvolcanic morphometry has been applied to DEMsassembled from evenly distributed elevation mea-surements derived from sensors viewing unobscuredsurfaces. For subglacial Antarctica, having confi-dence that the subglacial DEM that has been con-structed from non-random elevation measurementshas sufficient resolution for the applied interpretationis key. Recent years have witnessed increasing glaci-ological recovery of subglacial information frommorphometry. For example, seeding centres for gla-ciation of the WAIS (Ross et al. 2014) and the EastAntarctic Ice Sheet (Bo et al. 2009; Rose et al. 2013)have been identified by the preponderance of sharppeaks, cirque-like features and closely spaced val-leys relative to other parts of the subglacial land-scape. Elsewhere, landscapes of ‘selective linearerosion’, diagnostic of former dynamism in now-stable regions of ice, have been detected from thepresence of significant linear incisions (troughs)into otherwise flat higher surfaces (plateaux)(Young et al. 2011; Jamieson et al. 2014; Roseet al. 2014). All of these studies have in commonthat they have closely considered auxiliary evidenceto the morphometry and, hence, have not relied onthe surface shape alone in coming to interpretationsconcerning landscape formation. We have shownhere that such a combined approach is also validfor locating and mapping numerous previously
SUBGLACIAL VOLCANOES IN WEST ANTARCTICA

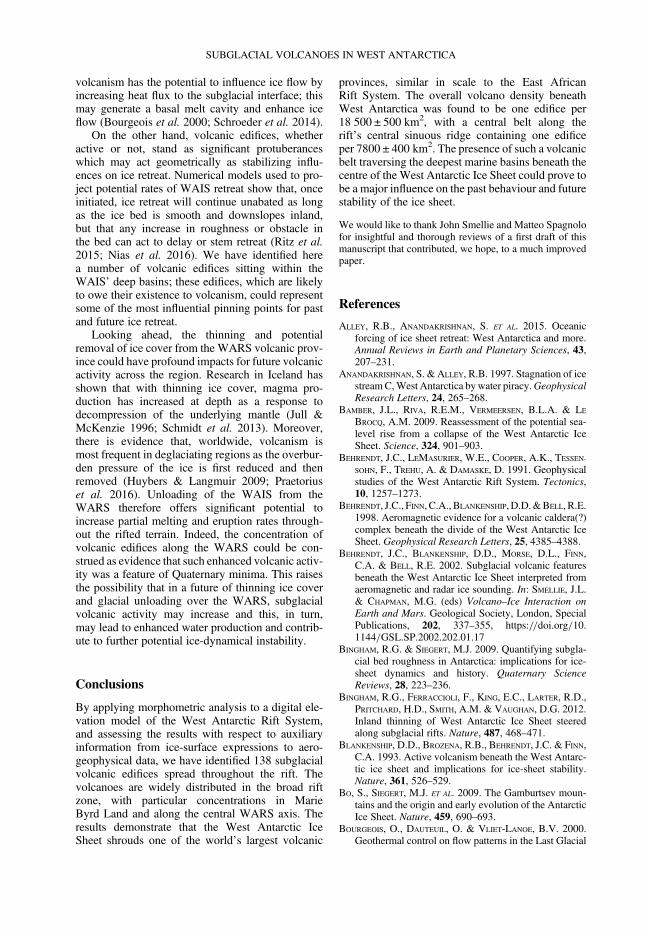
Fig. 2. Location map of conical edifices (circles) identified from Bedmap2 (greyscale background) across the West Antarctic Rift System. The data are tabulated in Table 2. Thecircle colour represents the confidence factor used to assess the likelihood of cones being subglacial volcanoes, and the circle size is proportional to the cone’s basal diameter.Circles with black rims represent volcanoes that have been confirmed in other studies (LeMasurier et al. 1990; Smellie & Edwards 2016), generally those that have tips whichprotrude above the ice surface.
M.V
ANWYKDEVRIESETAL.
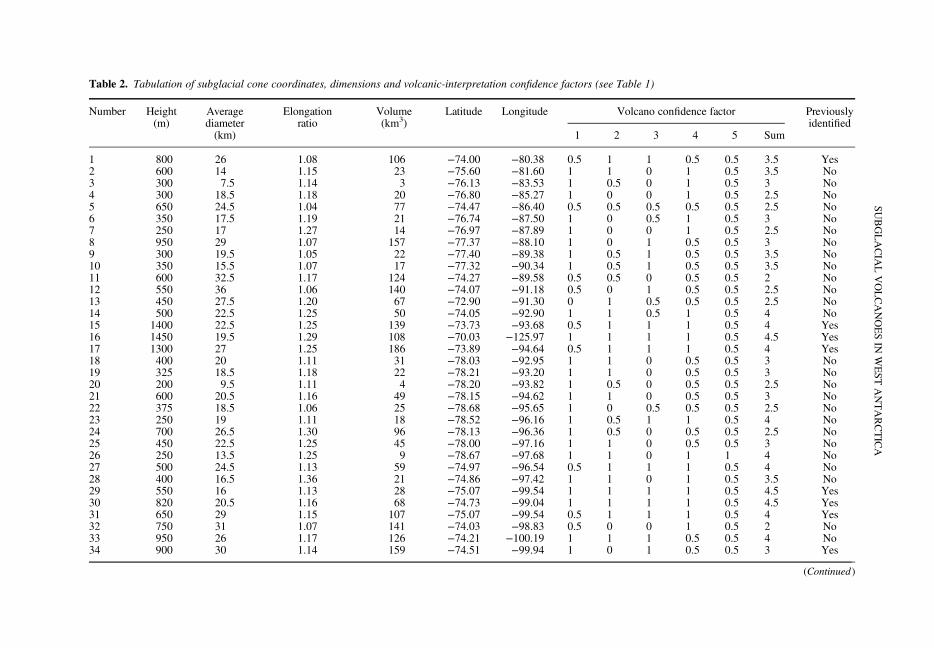
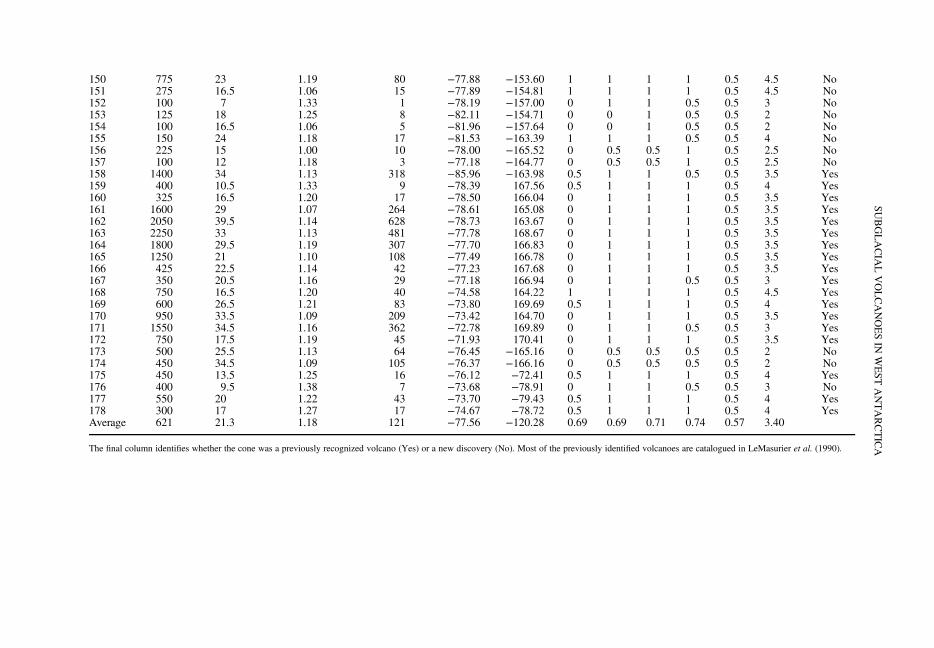
Table 2. Tabulation of subglacial cone coordinates, dimensions and volcanic-interpretation confidence factors (see Table 1)
Number Height(m)
Averagediameter(km)
Elongationratio
Volume(km3)
Latitude Longitude Volcano confidence factor Previouslyidentified
1 2 3 4 5 Sum
1 800 26 1.08 106 −74.00 −80.38 0.5 1 1 0.5 0.5 3.5 Yes2 600 14 1.15 23 −75.60 −81.60 1 1 0 1 0.5 3.5 No3 300 7.5 1.14 3 −76.13 −83.53 1 0.5 0 1 0.5 3 No4 300 18.5 1.18 20 −76.80 −85.27 1 0 0 1 0.5 2.5 No5 650 24.5 1.04 77 −74.47 −86.40 0.5 0.5 0.5 0.5 0.5 2.5 No6 350 17.5 1.19 21 −76.74 −87.50 1 0 0.5 1 0.5 3 No7 250 17 1.27 14 −76.97 −87.89 1 0 0 1 0.5 2.5 No8 950 29 1.07 157 −77.37 −88.10 1 0 1 0.5 0.5 3 No9 300 19.5 1.05 22 −77.40 −89.38 1 0.5 1 0.5 0.5 3.5 No10 350 15.5 1.07 17 −77.32 −90.34 1 0.5 1 0.5 0.5 3.5 No11 600 32.5 1.17 124 −74.27 −89.58 0.5 0.5 0 0.5 0.5 2 No12 550 36 1.06 140 −74.07 −91.18 0.5 0 1 0.5 0.5 2.5 No13 450 27.5 1.20 67 −72.90 −91.30 0 1 0.5 0.5 0.5 2.5 No14 500 22.5 1.25 50 −74.05 −92.90 1 1 0.5 1 0.5 4 No15 1400 22.5 1.25 139 −73.73 −93.68 0.5 1 1 1 0.5 4 Yes16 1450 19.5 1.29 108 −70.03 −125.97 1 1 1 1 0.5 4.5 Yes17 1300 27 1.25 186 −73.89 −94.64 0.5 1 1 1 0.5 4 Yes18 400 20 1.11 31 −78.03 −92.95 1 1 0 0.5 0.5 3 No19 325 18.5 1.18 22 −78.21 −93.20 1 1 0 0.5 0.5 3 No20 200 9.5 1.11 4 −78.20 −93.82 1 0.5 0 0.5 0.5 2.5 No21 600 20.5 1.16 49 −78.15 −94.62 1 1 0 0.5 0.5 3 No22 375 18.5 1.06 25 −78.68 −95.65 1 0 0.5 0.5 0.5 2.5 No23 250 19 1.11 18 −78.52 −96.16 1 0.5 1 1 0.5 4 No24 700 26.5 1.30 96 −78.13 −96.36 1 0.5 0 0.5 0.5 2.5 No25 450 22.5 1.25 45 −78.00 −97.16 1 1 0 0.5 0.5 3 No26 250 13.5 1.25 9 −78.67 −97.68 1 1 0 1 1 4 No27 500 24.5 1.13 59 −74.97 −96.54 0.5 1 1 1 0.5 4 No28 400 16.5 1.36 21 −74.86 −97.42 1 1 0 1 0.5 3.5 No29 550 16 1.13 28 −75.07 −99.54 1 1 1 1 0.5 4.5 Yes30 820 20.5 1.16 68 −74.73 −99.04 1 1 1 1 0.5 4.5 Yes31 650 29 1.15 107 −75.07 −99.54 0.5 1 1 1 0.5 4 Yes32 750 31 1.07 141 −74.03 −98.83 0.5 0 0 1 0.5 2 No33 950 26 1.17 126 −74.21 −100.19 1 1 1 0.5 0.5 4 No34 900 30 1.14 159 −74.51 −99.94 1 0 1 0.5 0.5 3 Yes
(Continued)
SUBGLACIA
LVOLCANOESIN
WESTANTARCTICA
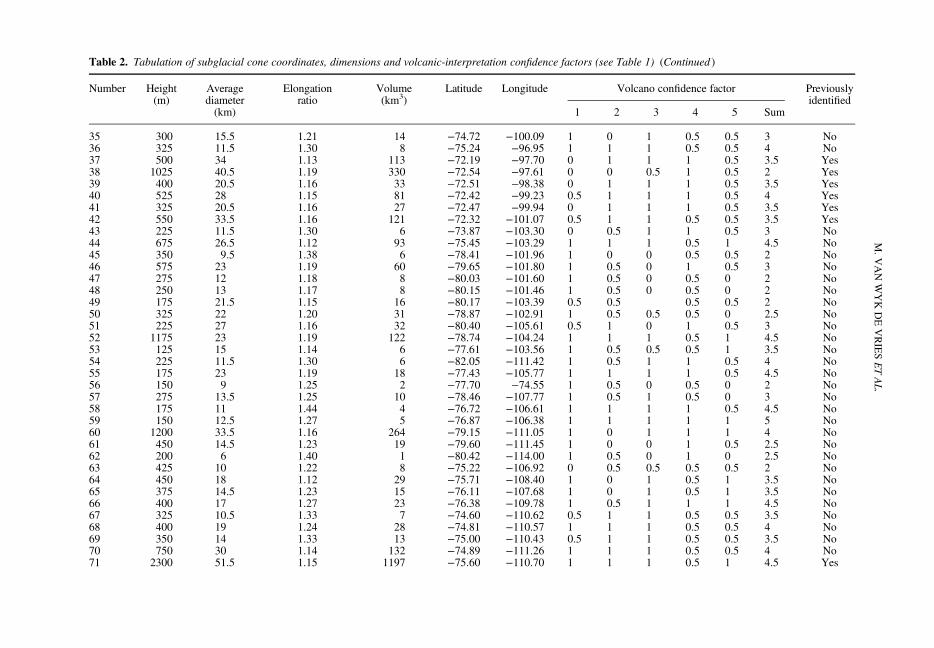
Table 2. Tabulation of subglacial cone coordinates, dimensions and volcanic-interpretation confidence factors (see Table 1) (Continued )
Number Height(m)
Averagediameter(km)
Elongationratio
Volume(km3)
Latitude Longitude Volcano confidence factor Previouslyidentified
1 2 3 4 5 Sum
35 300 15.5 1.21 14 −74.72 −100.09 1 0 1 0.5 0.5 3 No36 325 11.5 1.30 8 −75.24 −96.95 1 1 1 0.5 0.5 4 No37 500 34 1.13 113 −72.19 −97.70 0 1 1 1 0.5 3.5 Yes38 1025 40.5 1.19 330 −72.54 −97.61 0 0 0.5 1 0.5 2 Yes39 400 20.5 1.16 33 −72.51 −98.38 0 1 1 1 0.5 3.5 Yes40 525 28 1.15 81 −72.42 −99.23 0.5 1 1 1 0.5 4 Yes41 325 20.5 1.16 27 −72.47 −99.94 0 1 1 1 0.5 3.5 Yes42 550 33.5 1.16 121 −72.32 −101.07 0.5 1 1 0.5 0.5 3.5 Yes43 225 11.5 1.30 6 −73.87 −103.30 0 0.5 1 1 0.5 3 No44 675 26.5 1.12 93 −75.45 −103.29 1 1 1 0.5 1 4.5 No45 350 9.5 1.38 6 −78.41 −101.96 1 0 0 0.5 0.5 2 No46 575 23 1.19 60 −79.65 −101.80 1 0.5 0 1 0.5 3 No47 275 12 1.18 8 −80.03 −101.60 1 0.5 0 0.5 0 2 No48 250 13 1.17 8 −80.15 −101.46 1 0.5 0 0.5 0 2 No49 175 21.5 1.15 16 −80.17 −103.39 0.5 0.5 0.5 0.5 2 No50 325 22 1.20 31 −78.87 −102.91 1 0.5 0.5 0.5 0 2.5 No51 225 27 1.16 32 −80.40 −105.61 0.5 1 0 1 0.5 3 No52 1175 23 1.19 122 −78.74 −104.24 1 1 1 0.5 1 4.5 No53 125 15 1.14 6 −77.61 −103.56 1 0.5 0.5 0.5 1 3.5 No54 225 11.5 1.30 6 −82.05 −111.42 1 0.5 1 1 0.5 4 No55 175 23 1.19 18 −77.43 −105.77 1 1 1 1 0.5 4.5 No56 150 9 1.25 2 −77.70 −74.55 1 0.5 0 0.5 0 2 No57 275 13.5 1.25 10 −78.46 −107.77 1 0.5 1 0.5 0 3 No58 175 11 1.44 4 −76.72 −106.61 1 1 1 1 0.5 4.5 No59 150 12.5 1.27 5 −76.87 −106.38 1 1 1 1 1 5 No60 1200 33.5 1.16 264 −79.15 −111.05 1 0 1 1 1 4 No61 450 14.5 1.23 19 −79.60 −111.45 1 0 0 1 0.5 2.5 No62 200 6 1.40 1 −80.42 −114.00 1 0.5 0 1 0 2.5 No63 425 10 1.22 8 −75.22 −106.92 0 0.5 0.5 0.5 0.5 2 No64 450 18 1.12 29 −75.71 −108.40 1 0 1 0.5 1 3.5 No65 375 14.5 1.23 15 −76.11 −107.68 1 0 1 0.5 1 3.5 No66 400 17 1.27 23 −76.38 −109.78 1 0.5 1 1 1 4.5 No67 325 10.5 1.33 7 −74.60 −110.62 0.5 1 1 0.5 0.5 3.5 No68 400 19 1.24 28 −74.81 −110.57 1 1 1 0.5 0.5 4 No69 350 14 1.33 13 −75.00 −110.43 0.5 1 1 0.5 0.5 3.5 No70 750 30 1.14 132 −74.89 −111.26 1 1 1 0.5 0.5 4 No71 2300 51.5 1.15 1197 −75.60 −110.70 1 1 1 0.5 1 4.5 Yes
M.V
ANWYKDEVRIESETAL.
72 3200 58.5 1.13 2149 −76.52 −112.02 1 1 1 1 1 5 Yes73 250 15.5 1.07 12 −77.21 −111.92 1 0 0.5 0.5 1 3 No74 1025 36 1.00 261 −77.72 −112.64 1 0.5 1 1 0.5 4 No75 300 16 1.13 15 −77.67 −114.04 1 0.5 1 0.5 1 4 No76 625 26 1.17 83 −77.80 −115.00 1 1 1 0.5 1 4.5 No77 650 12 1.18 18 −78.08 −115.37 1 0 0.5 0.5 0 2 No78 400 10.5 1.33 9 −78.11 −115.93 1 1 0.5 0.5 0 3 No79 350 13.5 1.25 13 −78.93 −115.69 1 0 0.5 1 1 3.5 No80 325 20.5 1.28 27 −79.68 −113.53 1 1 0 1 1 4 No81 200 6 1.40 1 −80.38 −115.11 1 0.5 0 1 1 3.5 No82 125 4.5 1.25 0 −80.38 −115.11 1 0.5 0 1 1 3.5 No83 150 10 1.22 3 −80.34 −116.40 1 1 0 1 1 4 No84 1750 31.5 1.10 341 −80.30 −117.49 1 1 1 1 1 5 No85 800 20 1.22 63 −80.37 −118.90 1 0.5 1 1 1 4.5 No86 750 18.5 1.31 50 −80.73 −117.56 1 1 1 1 1 5 No87 150 10.5 1.33 3 −80.81 −118.65 1 1 0 1 1 4 No88 225 13 1.36 7 −80.87 −120.70 1 0 0 1 1 3 No89 100 9 1.25 2 −80.27 −117.62 1 1 0 0 0 2 No90 150 10.5 1.33 3 −80.41 −118.65 1 1 1 1 0.5 4.5 No91 550 29.5 1.19 94 −80.62 −120.12 1 0.5 1 1 1 4.5 No92 250 12.5 1.27 8 −79.96 −120.20 1 1 1 1 0.5 4.5 No93 150 10 1.22 3 −79.24 −119.18 1 1 0 1 0 3 No94 100 8 1.00 1 −79.37 −119.00 1 1 0 0 0 2 No95 125 7.5 1.14 1 −79.78 −115.18 1 0 0 0.5 0.5 2 No96 100 8.5 1.13 1 −78.46 −120.28 1 0 0.5 1 1 3.5 No97 1000 28.5 1.19 159 −77.54 −118.28 0.5 1 0.5 0.5 0.5 3 No98 2600 49.5 1.11 1250 −76.96 −117.78 1 1 1 0.5 1 4.5 Yes99 3850 58 1.11 2542 −76.07 −115.94 0.5 1 1 1 1 4.5 No100 1350 27.5 1.29 200 −76.73 −125.76 1 1 1 1 0.5 4.5 Yes101 1100 21 1.21 95 −76.93 −125.73 1 1 1 1 0.5 4.5 Yes102 1050 20 1.11 82 −77.11 −125.89 0.5 1 1 0.5 0.5 3.5 Yes103 2400 39 1.17 716 −77.32 −125.97 1 1 1 0.5 0.5 4 Yes104 1100 22 1.20 104 −77.46 −126.85 0.5 1 1 0.5 0.5 3.5 Yes105 550 29 1.15 91 −79.24 −128.12 0.5 0 1 0.5 0.5 2.5 No106 600 17 1.27 34 −81.34 −125.35 1 0.5 0 1 1 3.5 No107 150 11.5 1.30 4 −82.36 −127.50 1 1 1 1 1 5 No108 600 25.5 1.13 77 −83.98 −133.02 1 0 1 0.5 0.5 3 No109 500 39 1.11 149 −84.31 −131.87 1 0.5 1 0.5 0.5 3.5 No110 125 11.5 1.30 3 −81.82 −128.45 1 0.5 1 1 1 4.5 No111 100 8 1.29 1 −81.20 −129.58 1 1 0 0 0 2 No112 550 42 1.15 190 −81.62 −130.38 1 0 1 1 1 4 No
(Continued)
SUBGLACIA
LVOLCANOESIN
WESTANTARCTICA
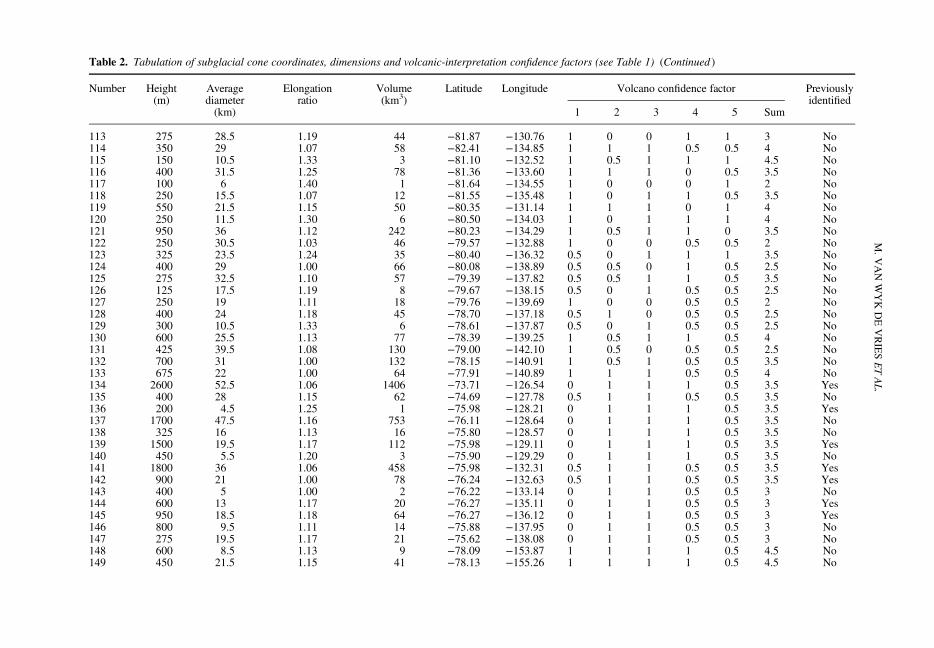
Table 2. Tabulation of subglacial cone coordinates, dimensions and volcanic-interpretation confidence factors (see Table 1) (Continued )
Number Height(m)
Averagediameter(km)
Elongationratio
Volume(km3)
Latitude Longitude Volcano confidence factor Previouslyidentified
1 2 3 4 5 Sum
113 275 28.5 1.19 44 −81.87 −130.76 1 0 0 1 1 3 No114 350 29 1.07 58 −82.41 −134.85 1 1 1 0.5 0.5 4 No115 150 10.5 1.33 3 −81.10 −132.52 1 0.5 1 1 1 4.5 No116 400 31.5 1.25 78 −81.36 −133.60 1 1 1 0 0.5 3.5 No117 100 6 1.40 1 −81.64 −134.55 1 0 0 0 1 2 No118 250 15.5 1.07 12 −81.55 −135.48 1 0 1 1 0.5 3.5 No119 550 21.5 1.15 50 −80.35 −131.14 1 1 1 0 1 4 No120 250 11.5 1.30 6 −80.50 −134.03 1 0 1 1 1 4 No121 950 36 1.12 242 −80.23 −134.29 1 0.5 1 1 0 3.5 No122 250 30.5 1.03 46 −79.57 −132.88 1 0 0 0.5 0.5 2 No123 325 23.5 1.24 35 −80.40 −136.32 0.5 0 1 1 1 3.5 No124 400 29 1.00 66 −80.08 −138.89 0.5 0.5 0 1 0.5 2.5 No125 275 32.5 1.10 57 −79.39 −137.82 0.5 0.5 1 1 0.5 3.5 No126 125 17.5 1.19 8 −79.67 −138.15 0.5 0 1 0.5 0.5 2.5 No127 250 19 1.11 18 −79.76 −139.69 1 0 0 0.5 0.5 2 No128 400 24 1.18 45 −78.70 −137.18 0.5 1 0 0.5 0.5 2.5 No129 300 10.5 1.33 6 −78.61 −137.87 0.5 0 1 0.5 0.5 2.5 No130 600 25.5 1.13 77 −78.39 −139.25 1 0.5 1 1 0.5 4 No131 425 39.5 1.08 130 −79.00 −142.10 1 0.5 0 0.5 0.5 2.5 No132 700 31 1.00 132 −78.15 −140.91 1 0.5 1 0.5 0.5 3.5 No133 675 22 1.00 64 −77.91 −140.89 1 1 1 0.5 0.5 4 No134 2600 52.5 1.06 1406 −73.71 −126.54 0 1 1 1 0.5 3.5 Yes135 400 28 1.15 62 −74.69 −127.78 0.5 1 1 0.5 0.5 3.5 No136 200 4.5 1.25 1 −75.98 −128.21 0 1 1 1 0.5 3.5 Yes137 1700 47.5 1.16 753 −76.11 −128.64 0 1 1 1 0.5 3.5 No138 325 16 1.13 16 −75.80 −128.57 0 1 1 1 0.5 3.5 No139 1500 19.5 1.17 112 −75.98 −129.11 0 1 1 1 0.5 3.5 Yes140 450 5.5 1.20 3 −75.90 −129.29 0 1 1 1 0.5 3.5 No141 1800 36 1.06 458 −75.98 −132.31 0.5 1 1 0.5 0.5 3.5 Yes142 900 21 1.00 78 −76.24 −132.63 0.5 1 1 0.5 0.5 3.5 Yes143 400 5 1.00 2 −76.22 −133.14 0 1 1 0.5 0.5 3 No144 600 13 1.17 20 −76.27 −135.11 0 1 1 0.5 0.5 3 Yes145 950 18.5 1.18 64 −76.27 −136.12 0 1 1 0.5 0.5 3 Yes146 800 9.5 1.11 14 −75.88 −137.95 0 1 1 0.5 0.5 3 No147 275 19.5 1.17 21 −75.62 −138.08 0 1 1 0.5 0.5 3 No148 600 8.5 1.13 9 −78.09 −153.87 1 1 1 1 0.5 4.5 No149 450 21.5 1.15 41 −78.13 −155.26 1 1 1 1 0.5 4.5 No
M.V
ANWYKDEVRIESETAL.
150 775 23 1.19 80 −77.88 −153.60 1 1 1 1 0.5 4.5 No151 275 16.5 1.06 15 −77.89 −154.81 1 1 1 1 0.5 4.5 No152 100 7 1.33 1 −78.19 −157.00 0 1 1 0.5 0.5 3 No153 125 18 1.25 8 −82.11 −154.71 0 0 1 0.5 0.5 2 No154 100 16.5 1.06 5 −81.96 −157.64 0 0 1 0.5 0.5 2 No155 150 24 1.18 17 −81.53 −163.39 1 1 1 0.5 0.5 4 No156 225 15 1.00 10 −78.00 −165.52 0 0.5 0.5 1 0.5 2.5 No157 100 12 1.18 3 −77.18 −164.77 0 0.5 0.5 1 0.5 2.5 No158 1400 34 1.13 318 −85.96 −163.98 0.5 1 1 0.5 0.5 3.5 Yes159 400 10.5 1.33 9 −78.39 167.56 0.5 1 1 1 0.5 4 Yes160 325 16.5 1.20 17 −78.50 166.04 0 1 1 1 0.5 3.5 Yes161 1600 29 1.07 264 −78.61 165.08 0 1 1 1 0.5 3.5 Yes162 2050 39.5 1.14 628 −78.73 163.67 0 1 1 1 0.5 3.5 Yes163 2250 33 1.13 481 −77.78 168.67 0 1 1 1 0.5 3.5 Yes164 1800 29.5 1.19 307 −77.70 166.83 0 1 1 1 0.5 3.5 Yes165 1250 21 1.10 108 −77.49 166.78 0 1 1 1 0.5 3.5 Yes166 425 22.5 1.14 42 −77.23 167.68 0 1 1 1 0.5 3.5 Yes167 350 20.5 1.16 29 −77.18 166.94 0 1 1 0.5 0.5 3 Yes168 750 16.5 1.20 40 −74.58 164.22 1 1 1 1 0.5 4.5 Yes169 600 26.5 1.21 83 −73.80 169.69 0.5 1 1 1 0.5 4 Yes170 950 33.5 1.09 209 −73.42 164.70 0 1 1 1 0.5 3.5 Yes171 1550 34.5 1.16 362 −72.78 169.89 0 1 1 0.5 0.5 3 Yes172 750 17.5 1.19 45 −71.93 170.41 0 1 1 1 0.5 3.5 Yes173 500 25.5 1.13 64 −76.45 −165.16 0 0.5 0.5 0.5 0.5 2 No174 450 34.5 1.09 105 −76.37 −166.16 0 0.5 0.5 0.5 0.5 2 No175 450 13.5 1.25 16 −76.12 −72.41 0.5 1 1 1 0.5 4 Yes176 400 9.5 1.38 7 −73.68 −78.91 0 1 1 0.5 0.5 3 No177 550 20 1.22 43 −73.70 −79.43 0.5 1 1 1 0.5 4 Yes178 300 17 1.27 17 −74.67 −78.72 0.5 1 1 1 0.5 4 YesAverage 621 21.3 1.18 121 −77.56 −120.28 0.69 0.69 0.71 0.74 0.57 3.40
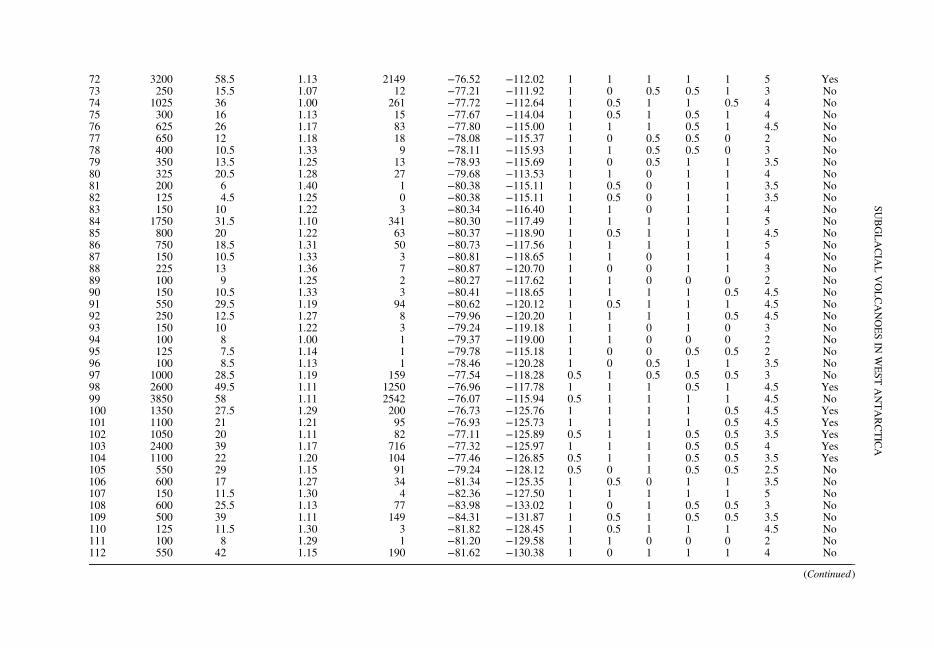
The final column identifies whether the cone was a previously recognized volcano (Yes) or a new discovery (No). Most of the previously identified volcanoes are catalogued in LeMasurier et al. (1990).
SUBGLACIA
LVOLCANOESIN
WESTANTARCTICA
unknown volcanic edifices across the ice-shroudedWARS.
Extent and activity of subglacial volcanism
We have identified at least 138 likely volcanicedifices distributed throughout the WARS. This
represents a significant advance on the total of 47identified volcanoes across the whole of West Ant-arctica, most of which are visible at the surface andare situated in Marie Byrd Land and the Transantarc-tic Mountains (LeMasurier et al. 1990). The widedistribution of volcanic structures throughout theWARS, along with the presence of clusters of
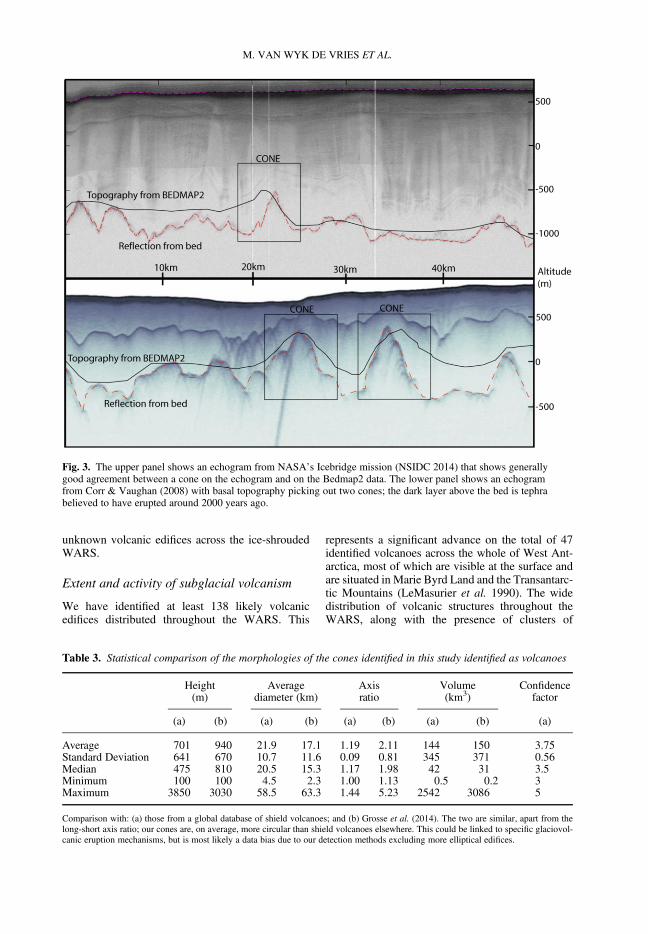
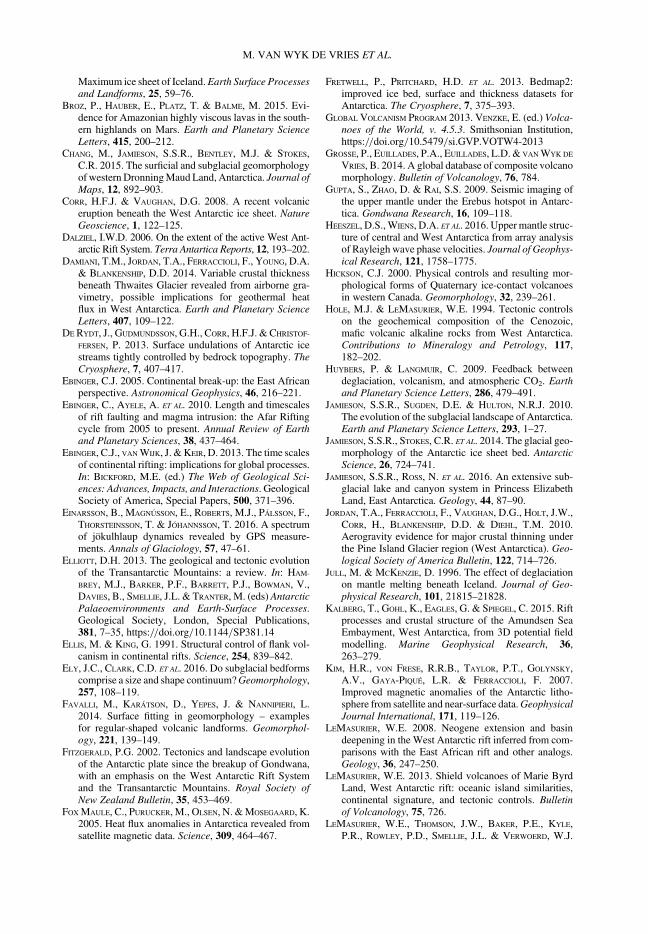
Fig. 3. The upper panel shows an echogram from NASA’s Icebridge mission (NSIDC 2014) that shows generallygood agreement between a cone on the echogram and on the Bedmap2 data. The lower panel shows an echogramfrom Corr & Vaughan (2008) with basal topography picking out two cones; the dark layer above the bed is tephrabelieved to have erupted around 2000 years ago.
Table 3. Statistical comparison of the morphologies of the cones identified in this study identified as volcanoes
Height(m)
Averagediameter (km)
Axisratio
Volume(km3)
Confidencefactor
(a) (b) (a) (b) (a) (b) (a) (b) (a)
Average 701 940 21.9 17.1 1.19 2.11 144 150 3.75Standard Deviation 641 670 10.7 11.6 0.09 0.81 345 371 0.56Median 475 810 20.5 15.3 1.17 1.98 42 31 3.5Minimum 100 100 4.5 2.3 1.00 1.13 0.5 0.2 3Maximum 3850 3030 58.5 63.3 1.44 5.23 2542 3086 5
Comparison with: (a) those from a global database of shield volcanoes; and (b) Grosse et al. (2014). The two are similar, apart from thelong-short axis ratio; our cones are, on average, more circular than shield volcanoes elsewhere. This could be linked to specific glaciovol-canic eruption mechanisms, but is most likely a data bias due to our detection methods excluding more elliptical edifices.
M. VAN WYK DE VRIES ET AL.
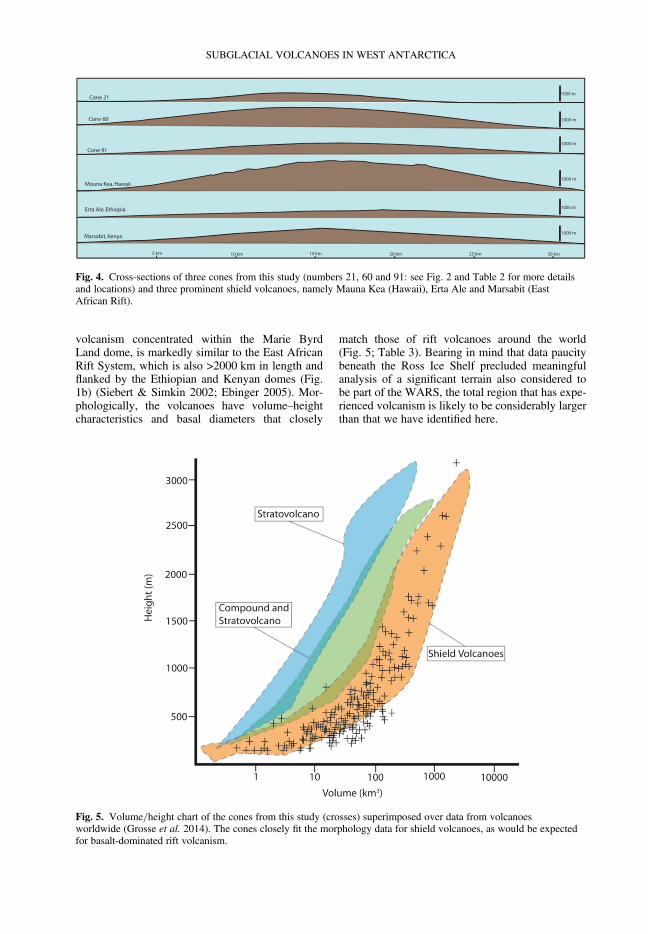
volcanism concentrated within the Marie ByrdLand dome, is markedly similar to the East AfricanRift System, which is also >2000 km in length andflanked by the Ethiopian and Kenyan domes (Fig.1b) (Siebert & Simkin 2002; Ebinger 2005). Mor-phologically, the volcanoes have volume–heightcharacteristics and basal diameters that closely
match those of rift volcanoes around the world(Fig. 5; Table 3). Bearing in mind that data paucitybeneath the Ross Ice Shelf precluded meaningfulanalysis of a significant terrain also considered tobe part of the WARS, the total region that has expe-rienced volcanism is likely to be considerably largerthan that we have identified here.
Cone 91
Cone 60
Cone 21
Mouna Kea, Hawaii
Erta Ale, Ethiopia
Marsabit, Kenya
5 km 10 km 15 km 20 km 25 km 30 km
1000 m
1000 m
1000 m
1000 m
1000 m
1000 m
Fig. 4. Cross-sections of three cones from this study (numbers 21, 60 and 91: see Fig. 2 and Table 2 for more detailsand locations) and three prominent shield volcanoes, namely Mauna Kea (Hawaii), Erta Ale and Marsabit (EastAfrican Rift).
Fig. 5. Volume/height chart of the cones from this study (crosses) superimposed over data from volcanoesworldwide (Grosse et al. 2014). The cones closely fit the morphology data for shield volcanoes, as would be expectedfor basalt-dominated rift volcanism.
SUBGLACIAL VOLCANOES IN WEST ANTARCTICA
The activity of the WARS has been the subject ofa longstanding debate, with one side advocating alargely inactive rift (LeMasurier 2008) and otherssuggesting large-scale volcanism (Behrendt et al.2002). The arguments in favour of an inactive riftare based on the anomalously low elevation of theWARS compared to other active continental rifts(Winberry & Anandakrishnan 2004; LeMasurier2008) and the relative absence of basalt pebblesrecovered from boreholes (LeMasurier pers. comm.2015). Conversely, high regional heat fluxes (Sha-piro & Ritzwoller 2004; Schroeder et al. 2014), geo-magnetic anomalies (Behrendt et al. 2002) andevidence of recent subglacial volcanism (Blanken-ship et al. 1993; Corr & Vaughan 2008) suggestthat the rift is currently active. This study providesevidence of a large number of subglacial volcanoes,with their quasi-conical shield volcano type geome-tries still intact. The largely uneroded nature of thecones suggests that many may be of Pleistoceneage or younger, which supports the argument thatthe rift remains active today.
From this study, we are not able to determinewhether the different volcanoes are active or not;however, the identification of multiple new volcanicedifices, and the improved regional sense of theirgeographical spread and concentration across theWARS, may guide future investigation of theiractivity. Several previous studies have suggestedthat the Marie Byrd Land massif is supported byparticularly low-density mantle, possibly compris-ing a volcanic ‘hotspot’ (Hole & LeMasurier1994; Winberry & Anandakrishnan 2004). Tephralayers recovered from the Byrd Ice Core near theWAIS divide suggest that multiple Marie ByrdLand volcanoes were active in the Late Quaternary(Wilch et al. 1999), while recent seismic activityin Marie Byrd Land has been interpreted as cur-rently active volcanism (Lough et al. 2013). In thePine Island Glacier catchment, strong radar-soundedenglacial reflectors have been interpreted as evi-dence of a local eruption that occurred approxi-mately 2000–2400 years ago (Fig. 3) (see Corr &Vaughan 2008) while, on the opposite rift flank inthe Transantarctic Mountains, Mount Erebus com-prises a known active volcano located above anotherpotential volcanic hotspot (Gupta et al. 2009). Vol-canism across the region is also likely to contributeto the elevated geothermal heat fluxes that have beeninferred to underlie much of the WAIS (Shapiro &Ritzwoller 2004; Fox Maule et al. 2005; Schroederet al. 2014). The deployment of broadband seismicsto recover the mantle structure beneath the WAIS isnow showing great promise (e.g. Heeszel et al.2016), and our map of potential volcanic locationscould help target further installations directed to-wards improved monitoring of the continent’s sub-glacial volcanic activity.
Implications for ice stability and futurevolcanism
The wide spread of volcanic edifices and the possi-bility of extensive volcanism throughout theWARS also provides potential influences on thestability of theWAIS. Many parts of theWAIS over-lie basins that descend from sea level with distanceinland, lending the ice sheet a geometry that isprone to runaway retreat (Bamber et al. 2009;Alley et al. 2015). Geological evidence points tothe likelihood that the WAIS experienced extensiveretreat during Quaternary glacial minima (Naishet al. 2009) and concurrently contributed severalmetres to global sea-level rise (O’Leary et al.2013). Currently, the WAIS may be undergoinganother such wholesale retreat, as ice in the Pacific-facing sector has consistently been retreating fromthe time of the earliest aerial and satellite observa-tions (Rignot 2002; McMillan et al. 2014; Mouginotet al. 2014). We do not consider it likely that volca-nism has played a significant role in triggeringthe current retreat, for which there is compellingevidence that the forcing has initiated from the mar-gins (Turner et al. 2017), but we do propose thatsubglacial volcanism has the potential to influencefuture rates of retreat by (1) producing enhancedbasal melting that could impact upon basal icemotion and (2) providing edifices that may act topin retreat.
On the first of these possibilities, some authorshave suggested that active subglacial volcanism,through providing enhanced basal melting thatmight ‘lubricate’ basal motion, could play a role inWAIS instability (Blankenship et al. 1993; Vogelet al. 2006; Corr & Vaughan 2008). A possible anal-ogy is provided by subglacial volcanism in Iceland,where subglacial eruptions have been known tomelt basal ice, flood the basal interface and induceperiods of enhanced ice flow (e.g. Magnússonet al. 2007; Einarsson et al. 2016); however, in Ice-land’s ice caps the ice is considerably thinner than inthe WAIS and, hence, more prone to subglacial-melt-induced uplift. Nevertheless, there is evidenceto suggest that changes to subglacial water distribu-tion can occur beneath the WAIS, and that they cansometimes have profound impacts on ice dynamics:examples are ice-dynamic variability over subglaciallakes (e.g. Siegfried et al. 2016) or the suggestionthat subglacial water pulses may have been responsi-ble for historical occurrences of ice-stream piracy(e.g. Anandakrishnan & Alley 1997; Vaughan et al.2008). Much recent attention has focused on thedrainage of subglacial lakes comprising plausibletriggers of such dynamic changes, but subglacialeruptions may represent another pulsed-water sourcewhose occurrence has rarely, if ever, been factoredinto ice-sheet models. Even inactive or dormant
M. VAN WYK DE VRIES ET AL.
volcanism has the potential to influence ice flow byincreasing heat flux to the subglacial interface; thismay generate a basal melt cavity and enhance iceflow (Bourgeois et al. 2000; Schroeder et al. 2014).
On the other hand, volcanic edifices, whetheractive or not, stand as significant protuberanceswhich may act geometrically as stabilizing influ-ences on ice retreat. Numerical models used to pro-ject potential rates of WAIS retreat show that, onceinitiated, ice retreat will continue unabated as longas the ice bed is smooth and downslopes inland,but that any increase in roughness or obstacle inthe bed can act to delay or stem retreat (Ritz et al.2015; Nias et al. 2016). We have identified herea number of volcanic edifices sitting within theWAIS’ deep basins; these edifices, which are likelyto owe their existence to volcanism, could representsome of the most influential pinning points for pastand future ice retreat.
Looking ahead, the thinning and potentialremoval of ice cover from the WARS volcanic prov-ince could have profound impacts for future volcanicactivity across the region. Research in Iceland hasshown that with thinning ice cover, magma pro-duction has increased at depth as a response todecompression of the underlying mantle (Jull &McKenzie 1996; Schmidt et al. 2013). Moreover,there is evidence that, worldwide, volcanism ismost frequent in deglaciating regions as the overbur-den pressure of the ice is first reduced and thenremoved (Huybers & Langmuir 2009; Praetoriuset al. 2016). Unloading of the WAIS from theWARS therefore offers significant potential toincrease partial melting and eruption rates through-out the rifted terrain. Indeed, the concentration ofvolcanic edifices along the WARS could be con-strued as evidence that such enhanced volcanic activ-ity was a feature of Quaternary minima. This raisesthe possibility that in a future of thinning ice coverand glacial unloading over the WARS, subglacialvolcanic activity may increase and this, in turn,may lead to enhanced water production and contrib-ute to further potential ice-dynamical instability.
Conclusions
By applying morphometric analysis to a digital ele-vation model of the West Antarctic Rift System,and assessing the results with respect to auxiliaryinformation from ice-surface expressions to aero-geophysical data, we have identified 138 subglacialvolcanic edifices spread throughout the rift. Thevolcanoes are widely distributed in the broad riftzone, with particular concentrations in MarieByrd Land and along the central WARS axis. Theresults demonstrate that the West Antarctic IceSheet shrouds one of the world’s largest volcanic
provinces, similar in scale to the East AfricanRift System. The overall volcano density beneathWest Antarctica was found to be one edifice per18 500 ± 500 km2, with a central belt along therift’s central sinuous ridge containing one edificeper 7800 ± 400 km2. The presence of such a volcanicbelt traversing the deepest marine basins beneath thecentre of the West Antarctic Ice Sheet could prove tobe a major influence on the past behaviour and futurestability of the ice sheet.
We would like to thank John Smellie and Matteo Spagnolofor insightful and thorough reviews of a first draft of thismanuscript that contributed, we hope, to a much improvedpaper.
References
ALLEY, R.B., ANANDAKRISHNAN, S. ET AL. 2015. Oceanicforcing of ice sheet retreat: West Antarctica and more.Annual Reviews in Earth and Planetary Sciences, 43,207–231.
ANANDAKRISHNAN, S. & ALLEY, R.B. 1997. Stagnation of icestreamC,West Antarctica bywater piracy.GeophysicalResearch Letters, 24, 265–268.
BAMBER, J.L., RIVA, R.E.M., VERMEERSEN, B.L.A. & LE
BROCQ, A.M. 2009. Reassessment of the potential sea-level rise from a collapse of the West Antarctic IceSheet. Science, 324, 901–903.
BEHRENDT, J.C., LEMASURIER, W.E., COOPER, A.K., TESSEN-
SOHN, F., TREHU, A. & DAMASKE, D. 1991. Geophysicalstudies of the West Antarctic Rift System. Tectonics,10, 1257–1273.
BEHRENDT, J.C., FINN, C.A., BLANKENSHIP,D.D.&BELL, R.E.1998. Aeromagnetic evidence for a volcanic caldera(?)complex beneath the divide of the West Antarctic IceSheet. Geophysical Research Letters, 25, 4385–4388.
BEHRENDT, J.C., BLANKENSHIP, D.D., MORSE, D.L., FINN,C.A. & BELL, R.E. 2002. Subglacial volcanic featuresbeneath the West Antarctic Ice Sheet interpreted fromaeromagnetic and radar ice sounding. In: SMELLIE, J.L.& CHAPMAN, M.G. (eds) Volcano–Ice Interaction onEarth and Mars. Geological Society, London, SpecialPublications, 202, 337–355, https://doi.org/10.1144/GSL.SP.2002.202.01.17
BINGHAM, R.G. & SIEGERT, M.J. 2009. Quantifying subgla-cial bed roughness in Antarctica: implications for ice-sheet dynamics and history. Quaternary ScienceReviews, 28, 223–236.
BINGHAM, R.G., FERRACCIOLI, F., KING, E.C., LARTER, R.D.,PRITCHARD, H.D., SMITH, A.M. & VAUGHAN, D.G. 2012.Inland thinning of West Antarctic Ice Sheet steeredalong subglacial rifts. Nature, 487, 468–471.
BLANKENSHIP, D.D., BROZENA, R.B., BEHRENDT, J.C. & FINN,C.A. 1993. Active volcanism beneath the West Antarc-tic ice sheet and implications for ice-sheet stability.Nature, 361, 526–529.
BO, S., SIEGERT, M.J. ET AL. 2009. The Gamburtsev moun-tains and the origin and early evolution of the AntarcticIce Sheet. Nature, 459, 690–693.
BOURGEOIS, O., DAUTEUIL, O. & VLIET-LANOE, B.V. 2000.Geothermal control on flow patterns in the Last Glacial
SUBGLACIAL VOLCANOES IN WEST ANTARCTICA
Maximum ice sheet of Iceland.Earth Surface Processesand Landforms, 25, 59–76.
BROZ, P., HAUBER, E., PLATZ, T. & BALME, M. 2015. Evi-dence for Amazonian highly viscous lavas in the south-ern highlands on Mars. Earth and Planetary ScienceLetters, 415, 200–212.
CHANG, M., JAMIESON, S.S.R., BENTLEY, M.J. & STOKES,C.R. 2015. The surficial and subglacial geomorphologyof western DronningMaud Land, Antarctica. Journal ofMaps, 12, 892–903.
CORR, H.F.J. & VAUGHAN, D.G. 2008. A recent volcaniceruption beneath the West Antarctic ice sheet. NatureGeoscience, 1, 122–125.
DALZIEL, I.W.D. 2006. On the extent of the active West Ant-arctic Rift System. Terra Antartica Reports, 12, 193–202.
DAMIANI, T.M., JORDAN, T.A., FERRACCIOLI, F., YOUNG, D.A.& BLANKENSHIP, D.D. 2014. Variable crustal thicknessbeneath Thwaites Glacier revealed from airborne gra-vimetry, possible implications for geothermal heatflux in West Antarctica. Earth and Planetary ScienceLetters, 407, 109–122.
DE RYDT, J., GUDMUNDSSON, G.H., CORR, H.F.J. & CHRISTOF-
FERSEN, P. 2013. Surface undulations of Antarctic icestreams tightly controlled by bedrock topography. TheCryosphere, 7, 407–417.
EBINGER, C.J. 2005. Continental break-up: the East Africanperspective. Astronomical Geophysics, 46, 216–221.
EBINGER, C., AYELE, A. ET AL. 2010. Length and timescalesof rift faulting and magma intrusion: the Afar Riftingcycle from 2005 to present. Annual Review of Earthand Planetary Sciences, 38, 437–464.
EBINGER, C.J., VANWIJK, J. &KEIR, D. 2013. The time scalesof continental rifting: implications for global processes.In: BICKFORD, M.E. (ed.) The Web of Geological Sci-ences: Advances, Impacts, and Interactions. GeologicalSociety of America, Special Papers, 500, 371–396.
EINARSSON, B., MAGNÚSSON, E., ROBERTS, M.J., PÁLSSON, F.,THORSTEINSSON, T. & JÓHANNSSON, T. 2016. A spectrumof jökulhlaup dynamics revealed by GPS measure-ments. Annals of Glaciology, 57, 47–61.
ELLIOTT, D.H. 2013. The geological and tectonic evolutionof the Transantarctic Mountains: a review. In: HAM-
BREY, M.J., BARKER, P.F., BARRETT, P.J., BOWMAN, V.,DAVIES, B., SMELLIE, J.L. & TRANTER, M. (eds) AntarcticPalaeoenvironments and Earth-Surface Processes.Geological Society, London, Special Publications,381, 7–35, https://doi.org/10.1144/SP381.14
ELLIS, M. & KING, G. 1991. Structural control of flank vol-canism in continental rifts. Science, 254, 839–842.
ELY, J.C., CLARK, C.D. ET AL. 2016. Do subglacial bedformscomprise a size and shape continuum?Geomorphology,257, 108–119.
FAVALLI, M., KARÁTSON, D., YEPES, J. & NANNIPIERI, L.2014. Surface fitting in geomorphology – examplesfor regular-shaped volcanic landforms. Geomorphol-ogy, 221, 139–149.
FITZGERALD, P.G. 2002. Tectonics and landscape evolutionof the Antarctic plate since the breakup of Gondwana,with an emphasis on the West Antarctic Rift Systemand the Transantarctic Mountains. Royal Society ofNew Zealand Bulletin, 35, 453–469.
FOXMAULE, C., PURUCKER, M., OLSEN, N. &MOSEGAARD, K.2005. Heat flux anomalies in Antarctica revealed fromsatellite magnetic data. Science, 309, 464–467.
FRETWELL, P., PRITCHARD, H.D. ET AL. 2013. Bedmap2:improved ice bed, surface and thickness datasets forAntarctica. The Cryosphere, 7, 375–393.
GLOBAL VOLCANISM PROGRAM 2013. VENZKE, E. (ed.) Volca-noes of the World, v. 4.5.3. Smithsonian Institution,https://doi.org/10.5479/si.GVP.VOTW4-2013
GROSSE, P., EUILLADES, P.A., EUILLADES, L.D. & VANWYK DE
VRIES, B. 2014. A global database of composite volcanomorphology. Bulletin of Volcanology, 76, 784.
GUPTA, S., ZHAO, D. & RAI, S.S. 2009. Seismic imaging ofthe upper mantle under the Erebus hotspot in Antarc-tica. Gondwana Research, 16, 109–118.
HEESZEL, D.S.,WIENS, D.A. ET AL. 2016. Uppermantle struc-ture of central and West Antarctica from array analysisof Rayleigh wave phase velocities. Journal of Geophys-ical Research, 121, 1758–1775.
HICKSON, C.J. 2000. Physical controls and resulting mor-phological forms of Quaternary ice-contact volcanoesin western Canada. Geomorphology, 32, 239–261.
HOLE, M.J. & LEMASURIER, W.E. 1994. Tectonic controlson the geochemical composition of the Cenozoic,mafic volcanic alkaline rocks from West Antarctica.Contributions to Mineralogy and Petrology, 117,182–202.
HUYBERS, P. & LANGMUIR, C. 2009. Feedback betweendeglaciation, volcanism, and atmospheric CO2. Earthand Planetary Science Letters, 286, 479–491.
JAMIESON, S.S.R., SUGDEN, D.E. & HULTON, N.R.J. 2010.The evolution of the subglacial landscape of Antarctica.Earth and Planetary Science Letters, 293, 1–27.
JAMIESON, S.S.R., STOKES, C.R. ET AL. 2014. The glacial geo-morphology of the Antarctic ice sheet bed. AntarcticScience, 26, 724–741.
JAMIESON, S.S.R., ROSS, N. ET AL. 2016. An extensive sub-glacial lake and canyon system in Princess ElizabethLand, East Antarctica. Geology, 44, 87–90.
JORDAN, T.A., FERRACCIOLI, F., VAUGHAN, D.G., HOLT, J.W.,CORR, H., BLANKENSHIP, D.D. & DIEHL, T.M. 2010.Aerogravity evidence for major crustal thinning underthe Pine Island Glacier region (West Antarctica). Geo-logical Society of America Bulletin, 122, 714–726.
JULL, M. & MCKENZIE, D. 1996. The effect of deglaciationon mantle melting beneath Iceland. Journal of Geo-physical Research, 101, 21815–21828.
KALBERG, T., GOHL, K., EAGLES, G. & SPIEGEL, C. 2015. Riftprocesses and crustal structure of the Amundsen SeaEmbayment, West Antarctica, from 3D potential fieldmodelling. Marine Geophysical Research, 36,263–279.
KIM, H.R., VON FRESE, R.R.B., TAYLOR, P.T., GOLYNSKY,A.V., GAYA-PIQUÉ, L.R. & FERRACCIOLI, F. 2007.Improved magnetic anomalies of the Antarctic litho-sphere from satellite and near-surface data.GeophysicalJournal International, 171, 119–126.
LEMASURIER, W.E. 2008. Neogene extension and basindeepening in the West Antarctic rift inferred from com-parisons with the East African rift and other analogs.Geology, 36, 247–250.
LEMASURIER, W.E. 2013. Shield volcanoes of Marie ByrdLand, West Antarctic rift: oceanic island similarities,continental signature, and tectonic controls. Bulletinof Volcanology, 75, 726.
LEMASURIER, W.E., THOMSON, J.W., BAKER, P.E., KYLE,P.R., ROWLEY, P.D., SMELLIE, J.L. & VERWOERD, W.J.
M. VAN WYK DE VRIES ET AL.
1990. Volcanoes of the Antarctic Plate and SouthernOceans Antarctic. American Geophysical Union, Ant-arctic Research Series, 48.
LINDBACK, K. & PETTERSSON, R. 2015. Spectral roughnessand glacial erosion of a land-terminating section of theGreenland Ice Sheet. Geomorphology, 238, 149–159.
LOUGH, A.C. & OTHERS. 2013. Seismic detection of an activesubglacial magmatic complex inMarie Byrd Land, Ant-arctica. Nature Geoscience, 6, 1031–1035.
MAGNÚSSON, E., ROTT, H., BJÖRNSSON, H. & PÁLSSON, F.2007. The impact of jökulhlaups on basal slidingobserved by SAR interferometry on Vatnajökull, Ice-land. Journal of Glaciology, 53, 232–240.
MCKNIGHT, S.B. &WILLIAMS, S.N. 1997. Old cinder cone oryoung composite volcano?: The nature of Cerro Negro,Nicaragua. Geology, 25, 339–342.
MCMILLAN, M., SHEPHERD, A. ET AL. 2014. Increased icelosses from Antarctica detected by CryoSat-2. Geo-physical Research Letters, 41, 3899–3905.
MOUGINOT, J., RIGNOT, E. & SCHEUCHL, B. 2014. Sustainedincrease in ice discharge from the Amundsen SeaEmbayment, West Antarctica, from 1973 to 2013.Geo-physical Research Letters, 41, 1576–1584.
NAISH, T., POWELL, R. ET AL. 2009. Obliquity-paced PlioceneWest Antarctic ice sheet oscillations. Nature, 458,322–328.
NIAS, I.J., CORNFORD, S.L. & PAYNE, A.J. 2016. Contrastingthe modelled sensitivity of the Amundsen Sea Embay-ment ice streams. Journal of Glaciology, 62, 552–562.
NSIDC 2014. IceBridge Accumulation Radar L1B Geolo-cated Radar Echo Strength Profiles. Version 2,IRMCR1B. NASA National Snow and Ice Data Center,Distributed Active Archive Center, Boulder CO, USA(updated 2015).
O’LEARY, M.J., HEARTY, P.J., THOMPSON, W.G., RAYMO,M.E., MITROVICA, J.X. & WEBSTER, J.M. 2013. Icesheet collapse following a prolonged period of stablesea level during the last interglacial. Nature Geosci-ence, 6, 796–800.
PEDERSEN, G.B.M. & GROSSE, P. 2014. Morphometry ofsubaerial shield volcanoes and glaciovolcanoes fromReykjanes Peninsula, Iceland: effects of eruption envi-ronment. Journal of Volcanology and GeothermalResearch, 282, 115–133.
POLLARD, D. & DECONTO, R.M. 2009. ModellingWest Ant-arctic ice sheet growth and collapse through the pastfive million years. Nature, 458, 329–332.
PRAETORIUS, S., MIX, A. ET AL. 2016. Interaction between cli-mate, volcanism, and isostatic rebound in SoutheastAlaska during the last deglaciation. Earth and Plane-tary Science Letters, 452, 79–89.
RIGNOT, E. 2002. Ice-shelf changes in Pine Island Bay,Antarctica, 1947–2000. Journal of Glaciology, 48,247–256.
RIGNOT, E., MOUGINOT, J. & SCHEUCHL, B. 2011. Ice flow ofthe Antarctic Ice Sheet. Science, 333, 1427–1430.
RITZ, C., EDWARDS, T.L., DURAND, G., PAYNE, A.J., PEYAUD,V. & HINDMARSH, R.C.A. 2015. Potential sea-level risefrom Antarctic ice-sheet instability constrained byobservations. Nature, 528, 115–118.
ROSE, K.C., FERRACCIOLI, F. ET AL. 2013. Early East Antarc-tic Ice Sheet growth recorded in the landscape of theGamburtsev Subglacial Mountains. Earth and Plane-tary Science Letters, 375, 1–12.
ROSE, K.C., ROSS, N. ET AL. 2014. A temperate formerWest Antarctic ice sheet suggested by an extensivezone of subglacial meltwater channels. Geology, 42,971–974.
ROSS, N., JORDAN, T.A. ET AL. 2014. The Ellsworth subgla-cial highlands: inception and retreat of theWest Antarc-tic Ice Sheet. Geological Society of America Bulletin,126, 3–15.
SCAMBOS, T., HARAN, T., FAHNESTOCK, M., PAINTER, T. &BOHLANDER, J. 2007. MODIS-based Mosaic of Antarc-tica (MOA) data sets: Continent-wide surface morphol-ogy and snow grain size. Remote Sensing ofEnvironment, 111, 242–257.
SCHEINERT, M., FERRACCIOLI, F. ET AL. 2016. New Antarcticgravity anomaly grid for enhanced geodetic and geo-physical studies in Antarctica. Geophysical ResearchLetters, 43, 600–610.
SCHMIDT, P., LUND, B., HIERONYMUS, C., MACLENNAN, J.,ÁRNARDÓTTIR, T. & PAGLI, C. 2013. Effects of pre-sent day deglaciation in Iceland on mantle melt pro-duction rates. Journal of Geophysical Research, 118,3366–3379.
SCHROEDER, D.M., BLANKENSHIP, D.D., YOUNG, D.A.&QUAR-
TINI, E. 2014. Evidence for elevated and spatially variablegeothermal flux beneath the West Antarctic Ice Sheet.Proceedings of the National Academy of Sciences ofthe United States of America, 111, 9070–9072.
SHAPIRO, N.M. & RITZWOLLER, M.H. 2004. Inferring surfaceheat flux distributions guided by a global seismicmodel: particular application to Antarctica. Earth andPlanetary Science Letters, 223, 213–224.
SIDDOWAY, C.S. 2008. Tectonics of the West Antarctic riftsystem: new light on the history and dynamics of dis-tributed intracontinental extension. In: COOPER, A.K.,BARRETT, P.J., STAGG, H., STOREY, B., STUMP, E. &WISE, W. (eds) Antarctica: A Keystone in a ChangingWorld, Proceedings of the 10th International Sympo-sium on Antarctic Earth Sciences. The National Acad-emies Press, Washington, DC, 91–114.
SIEBERT, L. & SIMKIN, T. 2002. Volcanoes of the World: anIllustrated Catalog of Holocene Volcanoes and theirEruptions. Smithsonian Institution, Global VolcanismProgram Digital Information Series, GVP-3.
SIEGFRIED, M.R., FRICKER, H.A., CARTER, S.P. & TULACZYK,S. 2016. Episodic ice velocity fluctuations triggered bya subglacial flood in West Antarctica. GeophysicalResearch Letters, 43, 2640–2648.
SMELLIE, J.L. 2008. Basaltic subglacial sheet-likesequences: Evidence for two types with different impli-cations for the inferred thickness of associated ice.Earth-Science Reviews, 88, 60–88.
SMELLIE, J.L. & EDWARDS, B.R. 2016. Glaciovolcanismon Earth and Mars. Cambridge University Press,Cambridge.
SPIEGEL, C., LINDOW, J. ET AL. 2016. Tectonomorphic evolu-tion of Marie Byrd Land – Implications for Cenozoicrifting activity and onset of West Antarctic glaciation.Global and Planetary Change, 145, 98–115.
STRETCH, R.C., MITCHELL, N.C. & PORTARO, R.A. 2006.A morphometric analysis of the submarine volcanicridge south-east of Pico Island, Azores. Journal of Vol-canology and Geothermal Research, 156, 1–2, 35–54.
STUDINGER, M., BELL, R.E., BLANKENSHIP, D.D., FINN, C.A.,ARKO, R.A., MORSE, D.L. & JOUGHIN, I. 2001.
SUBGLACIAL VOLCANOES IN WEST ANTARCTICA
Subglacial sediments: a regional geologic template forice flow inWest Antarctica. Geophysical Research Let-ters, 28, 3493–3496.
STUDINGER,M., BELL, R.E., FINN, C.A. &BLANKENSHIP, D.D.2002. Mesozoic and Cenozoic extensional tectonics ofthe West Antarctic Rift System from high-resolutionairborne geophysical mapping. Royal Society of NewZealand Bulletin, 35, 563–569.
TURNER, J., ORR, A., GUDMUNDSSON, G.H., JENKINS, A., BING-
HAM, R.G., HILLENBRAND, C.-D. & BRACEGIRDLE, T.J.2017. Atmosphere-ice-ocean interactions in theAmundsen Sea Embayment, West Antarctica. Reviewsof Geophysics, 55, 235–276.
VAUGHAN, D.G., CORR, H.F.J., SMITH, A.M., PRITCHARD, H.D. & SHEPHERD, A. 2008. Flow-switching and waterpiracy between Rutford Ice Stream and Carlson Inlet,West Antarctica. Journal of Glaciology, 54, 41–48.
VOGEL, S.W., TULACZYK, S., CARTER, S., RENNE, P., TURRIN,B. & GRUNOW, A. 2006. Geologic constraints on
the existence and distribution of West Antarctic subgla-cial volcanism. Geophysical Research Letters, 33,L23501.
WARDELL, L.J., KYLE, P.R. & CHAFFIN, C. 2014. Carbondioxide and carbon monoxide emission rates from analkaline intra-plate volcano: Mt. Erebus, Antarctica.Journal of Volcanology and Geothermal Research,131, 109–121.
WILCH, T.I., MCINTOSH, W.C. & DUNBAR, N.W. 1999. LateQuaternary volcanic activity in Marie Byrd Land:potential 40Ar/39Ar-dated time horizons in West Ant-arctic ice andmarine cores.Geological Society of Amer-ica Bulletin, 111, 1563–1580.
WINBERRY, J.P. & ANANDAKRISHNAN, S. 2004. Crustal struc-ture of the West Antarctic Rift System and Marie ByrdLand hotspot. Geology, 32, 977–980.
YOUNG, D.A. & OTHERS. 2011. A dynamic early East Ant-arctic Ice Sheet suggested by ice-covered fjord land-scapes. Nature, 474, 72–75.
M. VAN WYK DE VRIES ET AL.