a nonlinear time history analysis of ten storey rcc … · analysis of multistoried rcc buildings...
TRANSCRIPT

International Research Journal of Engineering and Technology (IRJET) e-ISSN: 2395-0056
Volume: 07 Issue: 06 | June 2020 www.irjet.net p-ISSN: 2395-0072
© 2020, IRJET | Impact Factor value: 7.529 | ISO 9001:2008 Certified Journal | Page 7153
A NONLINEAR TIME HISTORY ANALYSIS OF TEN STOREY RCC BUILDING
Kaushal Vijay Rathod1, Sumit Gupta2
1M. Tech Scholar, Bhilai Institute of Technology, Durg, India 2Assistant Professor, Bhilai Institute of Technology, Durg, India
---------------------------------------------------------------------***----------------------------------------------------------------------Abstract - This research paper describe the result of the time history analysis on the ten storey structure. Earthquake occurred in multistoried building shows that if the structures are not well designed and constructed with and adequate strength it leads to the complete collapse of the structures. To ensure safety against seismic forces of multi-storied building hence, there is need to study of seismic analysis to design earthquake resistance structures. TIME HISTORY ANALYSIS provides for linear or nonlinear evaluation of dynamic structural response under loading which may vary according to the specified time function. Dynamic equilibrium equations, given by K u(t) + C d/dt u(t) + M d2/dt u(t) = r(t), are solved using either modal or direct-integration methods. “In this seminar report, a nonlinear time history analysis is performed on a ten storey RCC building frame considering time history of el centro earthquake 1940 using ETABS. The main parameters of the seismic analysis of structures are load carrying capacity, ductility, stiffness, damping and mass. The various response parameters like base shear, storey drift, storey displacements etc are calculated. The storey drift calculated is compared with the minimum requirement of storey drift as per IS 1893:2002. Index Terms—Base Shear, Finite Element, Storey Drift, Roof displacement, Time history analysis, Response spectrum curve.
1. INTRODUCTION-
All real physical structures, when subjected to loads
or displacements, behave dynamically. The
additional inertia forces, from Newton’s second law,
are equal to the mass times the acceleration. If the
loads or displacements are applied very slowly then
the inertia forces can be neglected and a static load
analysis can be justified. Hence, dynamic analysis is a
simple extension of static analysis
In addition, all real structures potentially have an
infinite number of displacements. Therefore, the
most critical phase of a structural analysis is to
create a computer model, with a finite number of
mass less members and a finite number of node
(joint) displacements, that will simulate the behavior
of the real structure. The mass of a structural system,
which can be accurately estimated, is lumped at the
nodes. Also, for linear elastic structures the stiffness
properties of the members, with the aid of
experimental data, can be approximated with a high
degree of confidence.
However, the dynamic loading, energy dissipation
properties and boundary (foundation) conditions for
many structures are difficult to estimate. This is
always true for the cases of seismic input or wind
loads.
“The current version of the IS: 1893 - 2016 states
that linear dynamic analysis shall be performed to
obtain the design lateral force (design seismic base
shear, and its distribution to the different levels
along the height of the building, and to the various
lateral load resisting element) for all building, other
than regular building lower than 15m in seismic zone
II. Practically all multistoried buildings be analyzed
as three-dimensional systems. This is due to the fact
that the buildings have generally irregularities in
plan or elevation or in both.
As per Indian standard code 1893 (part 1) : 2016
Time history method shall be based on an
appropriate ground motion (preferably compatible
with the design acceleration spectrum in the desired
range of natural period ) and shall be performed
using accepted principles of the earthquake
structural dynamics.

International Research Journal of Engineering and Technology (IRJET) e-ISSN: 2395-0056
Volume: 07 Issue: 06 | June 2020 www.irjet.net p-ISSN: 2395-0072
© 2020, IRJET | Impact Factor value: 7.529 | ISO 9001:2008 Certified Journal | Page 7154
2. DIFFERNENT METHOD OF THE SEISMIC
ANALYSIS-
Seismic analysis is a subset of structural analysis and
is the calculation of the response of a building
(or non building) structure to earthquakes. It is part
of the process of structural design, earthquake
engineering or structural assessment and retrofit
(see structural engineering) in regions where
earthquakes are prevalent.
Based on the type of external action and behavior of
structure, the analysis can be further classified as:
(1).Linear Static Analysis, (2).Nonlinear Static
Analysis, (3).Linear Dynamic Analysis and (4).
Nonlinear Dynamic Analysis.
Linear static analysis or equivalent static method
can be used for regular structure with limited height.
Linear dynamic analysis can be performed by
response spectrum method. The significant
difference between linear static and linear dynamic
analysis is the level of the forces and their
distribution along the height of structure. Nonlinear
static analysis is an improvement over linear static or
dynamic analysis in the sense that it allows inelastic
behavior of structure. A nonlinear dynamic analysis
is the only method to describe the actual behavior of
a structure during an earthquake. The method is
based on the direct numerical integration of the
differential equations of motion by considering the
elasto-plastic deformation of the structural element.
2.1 Equivalent Static Analysis-
This procedure does not require dynamic analysis,
however, it account for the dynamics of building in
an approximate manner. The static method is the
simplest one-it requires less computational efforts
and is based on formulate given in the code of
practice. First, the design base shear is computed for
the whole building, and it is then distributed along
the height of the building. The lateral forces at each
floor levels thus obtained are distributed to
individuals lateral load resisting elements (Duggal,
2010).
2.2 Nonlinear Static Analysis-
It is practical method in which analysis is carried out
under permanent vertical loads and gradually
increasing lateral loads to estimate deformation and
damage pattern of structure. Non linear static
analysis is the method of seismic analysis in which
behavior of the structure is characterized by capacity
curve that represents the relation between the base
shear force and the displacement of the roof. It is also
known as Pushover Analysis.
2.3 Linear Dynamic Analysis-
Response spectrum method is the linear dynamic
analysis method. In that method the peak response of
structure during an earthquake is obtained directly
from the earthquake response, but this is quite
accurate for structural design applications (Duggal,
2010).
2.4 Nonlinear Dynamic Analysis-
It is known as Time history analysis. It is an
important technique for structural seismic analysis
especially when the evaluated structural response is
nonlinear. To perform such an analysis, a
representative earthquake time history is required
for a structure being evaluated. Time history analysis
is a step-by step analysis of the dynamic response of
a structure to a specified loading that may vary with
time. Time history analysis is used to determine the
seismic response of a structure under dynamic
loading of representative earthquake (Wilkinson and
Hiley, 2006).
3. TIME FUNCTION-
CSI Software handles the initial conditions of a time
function differently for linear and nonlinear time-
history load cases.
Linear cases always start from zero, therefore the
corresponding time function must also start from
zero.
Nonlinear cases may either start from zero or may continue from a previous case. When starting from zero, the time function is simply defined to start with a zero value. When analysis continues from a previous case, it is assumed that the time function

International Research Journal of Engineering and Technology (IRJET) e-ISSN: 2395-0056
Volume: 07 Issue: 06 | June 2020 www.irjet.net p-ISSN: 2395-0072
© 2020, IRJET | Impact Factor value: 7.529 | ISO 9001:2008 Certified Journal | Page 7155
also continues relative to its starting value. A long record may be broken into multiple sequential analyses which use a single function with arrival times. This prevents the need to create multiple modified functions.
Here for analysis of the ten storey RC building the time function of linear case has been chosen for the time history analysis. 4. MODAL ANALYSIS METHOD-
Fast Nonlinear Analysis (FNA) is a modal analysis
method useful for the static or dynamic evaluation of
linear or nonlinear structural systems. Because of its
computationally efficient formulation, FNA is well-
suite for time-history analysis, and often
recommended over direct-integration applications.
During dynamic-nonlinear FNA application,
analytical models should-
1-Be primarily linear-elastic.
2-Have a limited number of predefined nonlinear
members.
3-Lump nonlinear behavior within link objects.
Here for analysis of the ten storey RC building the
time function of linear case and Fast non linear
modal analysis method has been chosen for the time
history analysis.
5. GROUND MOTION EXCITATION-
Selecting the seismic loading for design and/or
assessment purposes is not an easy task due to the
uncertainties involved in the very nature of seismic
excitations. One possible approach for the treatment
of the seismic loading is to assume that the structure
is subjected to a set of records that are more likely to
occur in the region where the structure is located.
FIGURE 1- ARTIFICIAL ACCELEROGRAM
GENERATOR
This figure shows the example of an artificial
accelerogram generator code written in software
with iteration program.
FIGURE 2- TIMEV/SACCELERATION OF ELCENTRO
International Research Journal of Engineering and Technology (IRJET) e-ISSN: 2395-0056
Volume: 07 Issue: 06 | June 2020 www.irjet.net p-ISSN: 2395-0072
© 2020, IRJET | Impact Factor value: 7.529 | ISO 9001:2008 Certified Journal | Page 7156
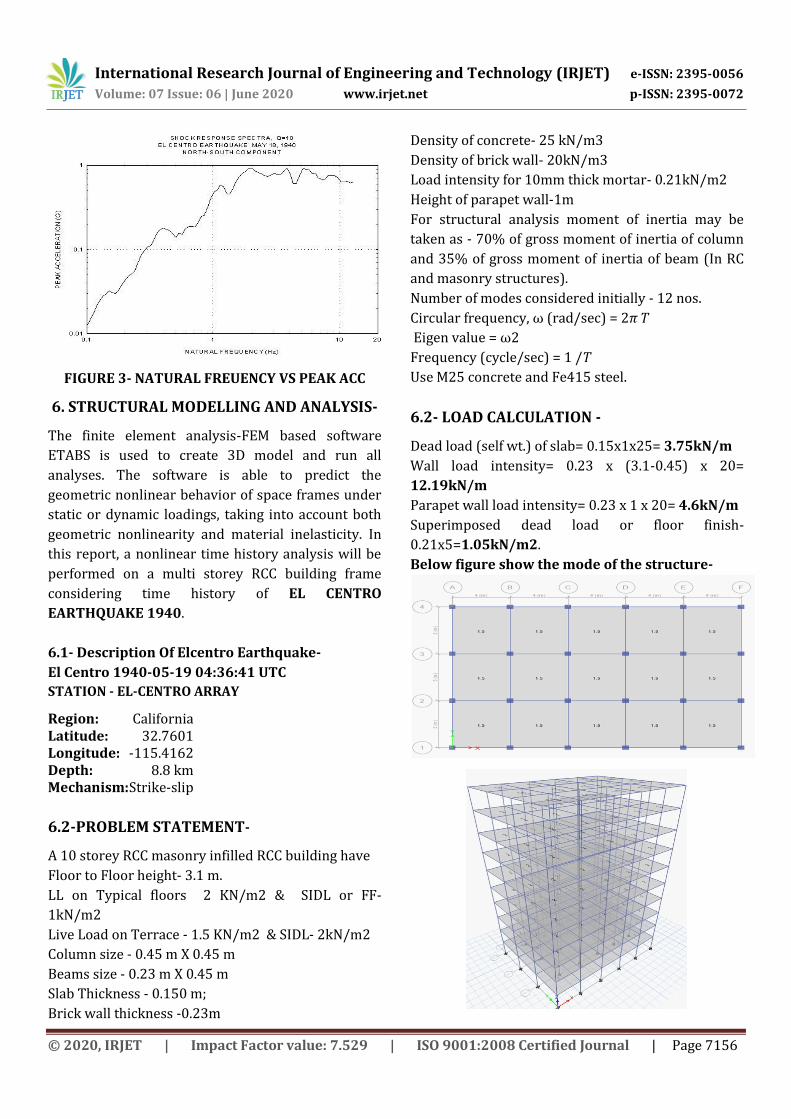
FIGURE 3- NATURAL FREUENCY VS PEAK ACC
6. STRUCTURAL MODELLING AND ANALYSIS-
The finite element analysis-FEM based software
ETABS is used to create 3D model and run all
analyses. The software is able to predict the
geometric nonlinear behavior of space frames under
static or dynamic loadings, taking into account both
geometric nonlinearity and material inelasticity. In
this report, a nonlinear time history analysis will be
performed on a multi storey RCC building frame
considering time history of EL CENTRO
EARTHQUAKE 1940.
6.1- Description Of Elcentro Earthquake-
El Centro 1940-05-19 04:36:41 UTC
STATION - EL-CENTRO ARRAY
Region: California Latitude: 32.7601 Longitude: -115.4162 Depth: 8.8 km Mechanism: Strike-slip
6.2-PROBLEM STATEMENT-
A 10 storey RCC masonry infilled RCC building have
Floor to Floor height- 3.1 m.
LL on Typical floors 2 KN/m2 & SIDL or FF-
1kN/m2
Live Load on Terrace - 1.5 KN/m2 & SIDL- 2kN/m2
Column size - 0.45 m X 0.45 m
Beams size - 0.23 m X 0.45 m
Slab Thickness - 0.150 m;
Brick wall thickness -0.23m
Density of concrete- 25 kN/m3
Density of brick wall- 20kN/m3
Load intensity for 10mm thick mortar- 0.21kN/m2
Height of parapet wall-1m
For structural analysis moment of inertia may be
taken as - 70% of gross moment of inertia of column
and 35% of gross moment of inertia of beam (In RC
and masonry structures).
Number of modes considered initially - 12 nos.
Circular frequency, ω (rad/sec) = 2𝜋 𝑇
Eigen value = ω2
Frequency (cycle/sec) = 1 /T
Use M25 concrete and Fe415 steel.
6.2- LOAD CALCULATION -
Dead load (self wt.) of slab= 0.15x1x25= 3.75kN/m
Wall load intensity= 0.23 x (3.1-0.45) x 20=
12.19kN/m
Parapet wall load intensity= 0.23 x 1 x 20= 4.6kN/m
Superimposed dead load or floor finish-
0.21x5=1.05kN/m2.
Below figure show the mode of the structure-

International Research Journal of Engineering and Technology (IRJET) e-ISSN: 2395-0056
Volume: 07 Issue: 06 | June 2020 www.irjet.net p-ISSN: 2395-0072
© 2020, IRJET | Impact Factor value: 7.529 | ISO 9001:2008 Certified Journal | Page 7157
7. ANALYSIS RESULTS-
7.1- BASE REACTION-
FIGURE 4- BASE REACTION FX IN X-DIR
FIGURE 5- BASE REACTION FX IN Y-DIR
TIME SEC BASE- FX
0.296 12.8005 2.664 273.5706 3.256 359.866 3.552 298.7083 5.328 275.788 5.624 664.143 6.216 512.0627 7.992 240.5218 8.288 387.0604
11.248 300.2585
TABLE: Time History Plot
Time Base FY
sec kN
0.592 27.1071
0.888 0.4892
5.624 472.3558
5.92 389.9112
6.216 540.7972
6.512 505.5179
8.88 393.5661
9.176 547.1206
9.472 551.5677
11.84 213.5987
TIME MAX BASE REACTION
5.624 sec 2.96 sec
664.143 kN in X-dir 565.974 kN in y-dir
7.2 MODAL PERIODS AND FREUENCY-
TOTAL NOS OF MODES- changed to 15 (modal
participation factor of mode k contributes to the
overall vibration of the structure under horizontal
and vertical ground motion. since the amplitude of
95 percent mode shape can be scale arbitrarily, the
value of this factor depends on the scaling used for
mode shapes
FUNDAMENTAL NATURAL PERIOD - it is the first
(longest)modal time period of vibration in our case
the fundamental natural period is found out to be
2.97 sec and the frequency of 0.377 cyc/sec
TABLE: Modal Periods And Frequencies
Case Mode Period Frequency CircFreq sec cyc/sec rad/sec
Modal 1 2.97 0.337 2.1156 Modal 2 2.644 0.378 2.3766 Modal 3 2.489 0.402 2.5245 Modal 4 0.944 1.06 6.6582 Modal 5 0.848 1.179 7.4074 Modal 6 0.797 1.255 7.8876 Modal 7 0.529 1.889 11.8707 Modal 8 0.483 2.07 13.0053 Modal 9 0.452 2.211 13.8947 Modal 10 0.347 2.885 18.1252 Modal 11 0.322 3.103 19.4982

International Research Journal of Engineering and Technology (IRJET) e-ISSN: 2395-0056
Volume: 07 Issue: 06 | June 2020 www.irjet.net p-ISSN: 2395-0072
© 2020, IRJET | Impact Factor value: 7.529 | ISO 9001:2008 Certified Journal | Page 7158
Modal 12 0.3 3.338 20.9726 Modal 13 0.242 4.136 25.9899 Modal 14 0.228 4.388 27.5684 Modal 15 0.211 4.744 29.8094
7.3-STORY DRIFTS-
Story X-Dir HEIGHT STORY DRIFT
Story10 0.000512 2950 1.5104
Story9 0.000836 2950 2.4662
Story8 0.001158 2950 3.4161
Story7 0.001461 2950 4.30995
Story6 0.00171 2950 5.0445
Story5 0.001757 2950 5.18315
Story4 0.001779 2950 5.24805
Story3 0.001638 2950 4.8321
Story2 0.001567 2950 4.62265
Story1 0.000926 2950 2.7317
Base 0 2950 0
Story Y-Dir HEIGHT STORY DRIFT
Story10 0.000779 2950 2.29805
Story9 0.001296 2950 3.8232
Story8 0.001754 2950 5.1743
Story7 0.002141 2950 6.31595
Story6 0.002377 2950 7.01215
Story5 0.002234 2950 6.5903
Story4 0.002025 2950 5.97375
Story3 0.002145 2950 6.32775
Story2 0.001965 2950 5.79675
Story1 0.001048 2950 3.0916
Base 0 2950 0
This story drift is due to the load case- of time history
analysis not for any type of individual or load
combinations.
Figure6 - Maximum Story Drifts In X- Dir
Figure7 - Maximum Story Drifts In Y- Dir
7.4-RESPONSE SPECTRUM CURVES-
Response-spectrum analysis provides insight into
dynamic behavior by measuring pseudo-spectral
acceleration, velocity, or displacement as a function
of structural period for a given time history and level
of damping. It is practical to envelope response
spectra such that a smooth curve represents the peak
response for each realization of structural period.

International Research Journal of Engineering and Technology (IRJET) e-ISSN: 2395-0056
Volume: 07 Issue: 06 | June 2020 www.irjet.net p-ISSN: 2395-0072
© 2020, IRJET | Impact Factor value: 7.529 | ISO 9001:2008 Certified Journal | Page 7159
Figure8 - Response In X- Dir
Figure9 - Response In Y- Dir
RESULTS FROM RESPONSE SPECTRUM CURVES-
Time history case - X
Story 10
Joint lable 1
Response direction X
X- Axis period in sec
Y-axis PSA in mm/sec2
Max Snapped To ( 0.833, 1432.84)
TIME HISTORY CASE - Y
Story 10
Joint lable 1
Response direction Y
X- Axis period in sec
Y-axis PSA in mm/sec2
Max Snapped To ( 0.7142, 1174.7142)
7.5- COMBINED STOREY DISPLACEMENT-
Figure10 - Displacement In X- Dir
Figure11 - Displacement In Y- Dir
8. CONCLUSIONS-
1. Results from the base reaction conclude that
the base reaction increases with the time in
sec from the time history plot we can see that
the base reaction is max at 5.624 sec with
664.147 kN at x- direction where as the max
base reaction obtain on in y direction is at
3.5sec with 565.974 kN. both reaction are
comparably very high and should be designed
appropriately.
2. The numbers of mode shapes considered are
12 (initially)and then change to 15 after a
trial modal analysis to match the MPM ratio
and for each mode number the time period,
frequency and eigen values are mentioned
above.

International Research Journal of Engineering and Technology (IRJET) e-ISSN: 2395-0056
Volume: 07 Issue: 06 | June 2020 www.irjet.net p-ISSN: 2395-0072
© 2020, IRJET | Impact Factor value: 7.529 | ISO 9001:2008 Certified Journal | Page 7160
3. The variation of base shear in X and Y
direction with respect to time history of el
centro earthquake ground motion is plotted.
4. Similarly the variation of storey drift in X and
Y direction with respect to time history is
also plotted. which shows that the max drift
obtain in x-dir is at storey 4 of 5.24mm and
that of in y- direction is at storey 6 of 7.01mm
5. Psuedo spectral acceleration is max snapped
to ( 0.833, 1432.84) for response in X-
direction and max snapped to ( 0.7142,
1174.7142) for response in Y- direction.
where(X,Y) is ( seconds, acceleration )
6. Maximum displacement is 42.34mm &
53.15mm at X and Y direction respectively as
shown in figure 10 and 11.
9. REFERENCES
1. IS: 456 -2000, “Code of Practice for Plain and Reinforced Concrete”, Bureau of Indian Standards, New Delhi.
2. IS: 875 -1987 (Part I), “Unit Weight of Materials”, Bureau of Indian standards, New Delhi.
3. IS: 875 -1987 (Part II), “Design Loads (other than earthquake) for Buildings and Structures, Imposed Load”, Bureau of Indian Standards, Delhi.
4. IS: 875 -2015(Part III), “Design Loads (other than earth quake) for Buildings and Structures, Wind Load”, Bureau of Indian Standards, New Delhi.
5. IS: 1893(Part I)-2016 “Criteria for Earth quake Resistant Design of Structure”, (Fifth Revision), Bureau of Indian Standards, New Delhi.
6. A S Patil and P. D. Kumbhar, Time History Analysis of Multistoried Rcc Buildings For Different Seismic Intensities.
7. Alhamd Farqaleet, Dynamic Analysis Of Multi-Storey RCC Building.
8. https://wiki.csiamerica.com
9. https://peer.berkeley.edu. peer ground motion data
10. Dynamics Of Structures Book By Anil K. Chopra.
11. Earthquake Resistant Design Of Structures, Book By Pankaj Agarwal And Manish Shrikhande.