a novel extraction procedure for stir bar sorptive ... · stir bar sorptive extraction (sbse):...
TRANSCRIPT

Ap
pN
ote
12/
2008
A Novel Extraction Procedure for Stir Bar Sorptive Extraction (SBSE): Sequential SBSE for Uniform Enrichment of Organic Pollutants in Water Samples
Nobuo Ochiai, Kikuo Sasamoto, Hirooki KandaGERSTEL K.K., 2-13-18 Nakane, Meguro-ku, Tokyo, 152-0031 Japan
Edward PfannkochGerstel, Inc., 701 Digital Drive, Suite J, Linthicum, MD 21090, USA
KEYWORDSSequential stir bar sorptive extraction (Sequential SBSE), Thermal Desorption, GC – MS, Uniform Enrichment, Organic Pollutants, Water Sample.
ABSTRACTA novel stir bar sorptive extraction (SBSE) procedure termed sequential SBSE was developed. Compared to conventional SBSE, sequential SBSE provides more uniform enrichment over the entire polarity/volatility range for organic pollutants at ultra-trace levels in water. Sequential SBSE consists of a SBSE performed sequentially on a 5-mL sample fi rst without modifi er using one stir bar, then on the same sample after addition of 30 % NaCl using a second stir bar. The fi rst extraction with unmodifi ed sample is mainly targeting solutes with high Ko/w (log Ko/w > 4.0), the second extraction with modifi ed sample solution (containing 30 % NaCl) is targeting solutes with low and medium Ko/w (log Ko/w < 4.0). After extraction the two stir bars are placed in a single glass desorption liner and are simultaneously desorbed. The desorbed compounds were analyzed by thermal desorption and gas chromatography – mass spectrometry (TD – GC – MS). Recovery of model compounds consisting of 80 pesticides

AN/2008/12 - 2
(organochlorine, carbamate, organophosphorous, pyrethroid, and others) for sequential SBSE was evaluated as a function of log Ko/w (1.70 - 8.35). The recovery using sequential SBSE was compared with those of conventional SBSE with or without salt addition (30 % NaCl). The sequential approach provided very good recovery in the range of 82 to 113 % for most of the solutes, and recovery less than 80 % for only 5 solutes with low Ko/w (log Ko/w < 2.5), while conventional approaches (with or without salt addition) showed less than 80 % recovery for 23 and 41 solutes, respectively. The method showed good linearity (r2 > 0.9900) and high sensitivity (limit of detection: < 10 ng/L) for most of the model compounds even with the scan mode in the MS. The method was successfully applied to screening of pesticides at ng/L level in river water samples.
INTRODUCTIONAnalytical methods usually include extraction and enrichment steps for determining trace amounts of organic pollutants in a variety of solid, liquid (aqueous) and gaseous samples. For aqueous samples, liquid-liquid extraction (LLE) has been the most widely used technique. However, LLE is tedious, time-consuming, and labor intensive, and large amounts of organic solvents are required. Solid-phase extraction (SPE) was introduced as an alternative extraction method. Compared to traditional LLE, this method can greatly reduce solvent consumption. The major drawbacks of SPE are the large sample volumes required, e.g. > 500 mL [1], and the fact that the enrichment factor (original sample amount versus fi nal extract volume) obtained with this technique is rather limited. In order to achieve adequate detection limits, it is often necessary to either perform concentration to a small volume (< 1 mL) or to use large volume injection. For this reason, miniaturized methods were introduced, e.g. solid-phase microextraction (SPME) and stir bar sorptive extraction (SBSE), which are simple, solvent-less techniques allowing the extraction and concentration in a single step [2, 3]. These sorptive extraction methods have been successfully applied to determination of organic compounds in various sample matrices, e.g. water, soil, food and biological fl uid [4-8]. Also, these methods provide enhanced sensitivity because the extracted fraction (on a fi ber or on a stir bar) can be introduced quantitatively into a GC system by thermal desorption. Moreover, the enrichment factor for SBSE, which is determined by the analyte recovery in the extraction
phase (polydimethylsiloxane: PDMS), is higher than that of SPME because of 50-250 times larger volume of extraction phase on the stir bar. Several authors indicated that the SBSE method allows high recovery and extremely low limit of detection (LOD) at sub-ng/L level, particularly for solutes having hydrophobic characteristics [7, 8].
SBSE recovery can be estimated if the octanol-water distribution coeffi cient (Ko/w) of the analyte is known. Ko/w is the ratio of the equilibrium concentrations of a chemical in octanol and in water at a specified temperature. Hydrophobic solutes with a high Ko/w can be extracted with high recovery, while hydrophilic solutes with a low Ko/w, e.g. polar pesticides, show lower recovery [3, 9]. To increase recovery of more hydrophilic solutes, one could employ salt addition, e.g. 20-30 % NaCl. However, salt addition resulted in decreasing recovery of more hydrophobic solutes [10-12]. Salt addition in SBSE using a single stir bar will therefore have limited benefi t when developing multi-residue methods that include compounds of widely varying polarities. Recently, we proposed dual SBSE performed simultaneously on two aliquots of a sample under different extraction conditions [12]. The optimized method consists of a dual SBSE performed simultaneously on respectively a 20 mL sample containing 30 % NaCl and a 20 mL sample without modifi er (100 % sample solution). After extraction, two stir bars were simultaneously desorbed with a thermal desorption system. The dual SBSE approach reduced the negative effect of the salt, while improving recovery for hydrophilic solutes. The method showed good linearity (r2 > 0.9900) and high sensitivity (limit of detection: < 10 ng/L) for most of the target pesticides. However, the recovery of the method was still limited (in the range of 11-72 % recovery), especially for more hydrophobic compounds (log Ko/w > 6.0; less than 33 % recovery).
In this study, we developed a new SBSE procedure termed sequential SBSE for exhaustive enrichment of 80 model compounds, which is performed sequentially for one aliquot under two extraction conditions using two stir bars. In this case, sequential SBSE was performed sequentially on a 5 mL sample without modifi er (fi rst extraction) and then the same 5 mL sample after addition of 30 % NaCl (second extraction). Comparison with conventional SBSE with or without salt addition was also examined.
AN/2008/12 - 3
EXPERIMENTALReagents and Materials. Standard solutions of pesticide mixtures at 10 μg/mL each in acetone were purchased from Kanto Kagaku (Tokyo, Japan). Some pesticides in stock solutions are composed of several isomers. For these compounds, the concentration (10 μg/mL) is the sum of the concentrations of the individual isomers. Stock standard solutions were diluted with acetone to prepare a test mixture containing 80 solutes. The stock standard solutions were kept at -20ºC. All solvents, pesticide residues grade, were purchased from Kanto Kagaku. Sodium chloride (NaCl), reagent grade, was also purchased from Kanto Kagaku and baked at 350ºC for several hours before use.Instrumentation. The TD–GC–MS analysis was performed with a TDU thermal-desorption unit equipped with a MPS 2 auto-sampler and a CIS 4 programmed temperature vaporization (PTV) inlet (Gerstel, Mülheim an der Ruhr, Germany) installed on an Agilent 6890N gas chromatograph with a 5973 inert mass-selective detector (Agilent Technologies, CA, USA).Sequential SBSE. Stir bars coated with 24 μL of PDMS (Twister) were obtained from Gerstel. For the fi rst SBSE, fi ve milliliters of water sample were transferred to 10 mL headspace vials. A stir bar was added and the vial was sealed with a screw cap. SBSE
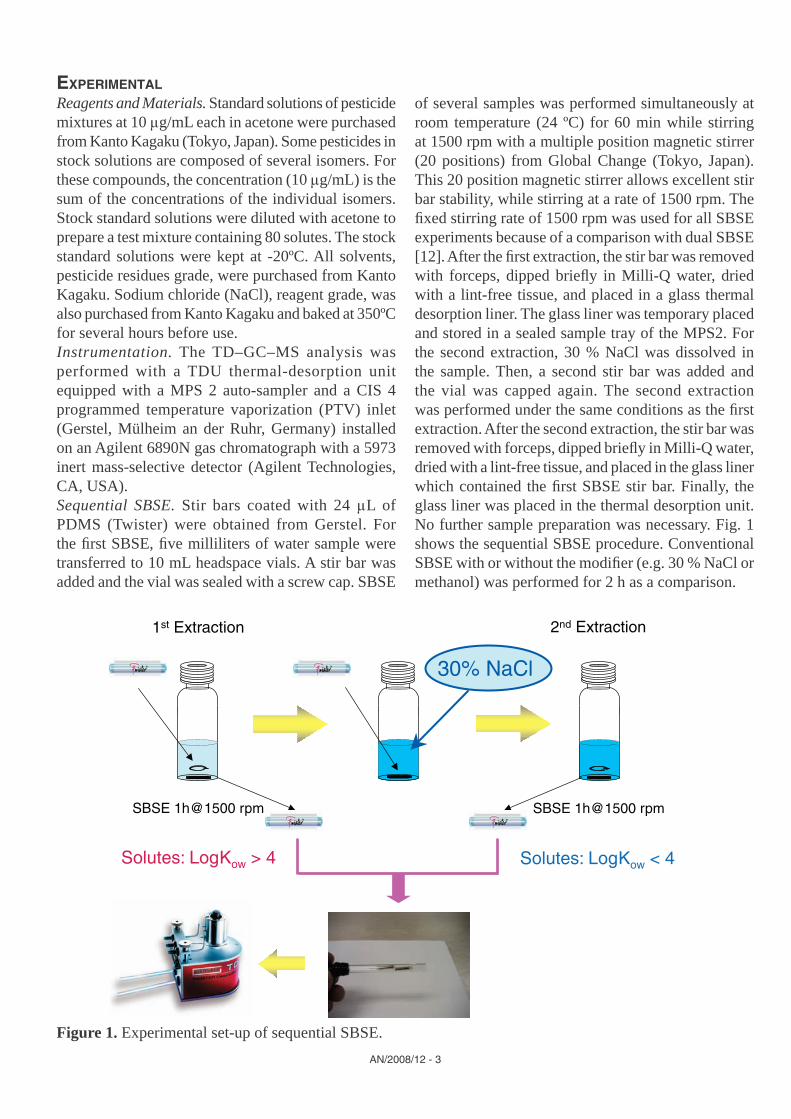
of several samples was performed simultaneously at room temperature (24 ºC) for 60 min while stirring at 1500 rpm with a multiple position magnetic stirrer (20 positions) from Global Change (Tokyo, Japan). This 20 position magnetic stirrer allows excellent stir bar stability, while stirring at a rate of 1500 rpm. The fi xed stirring rate of 1500 rpm was used for all SBSE experiments because of a comparison with dual SBSE [12]. After the fi rst extraction, the stir bar was removed with forceps, dipped briefl y in Milli-Q water, dried with a lint-free tissue, and placed in a glass thermal desorption liner. The glass liner was temporary placed and stored in a sealed sample tray of the MPS2. For the second extraction, 30 % NaCl was dissolved in the sample. Then, a second stir bar was added and the vial was capped again. The second extraction was performed under the same conditions as the fi rst extraction. After the second extraction, the stir bar was removed with forceps, dipped briefl y in Milli-Q water, dried with a lint-free tissue, and placed in the glass liner which contained the fi rst SBSE stir bar. Finally, the glass liner was placed in the thermal desorption unit. No further sample preparation was necessary. Fig. 1 shows the sequential SBSE procedure. Conventional SBSE with or without the modifi er (e.g. 30 % NaCl or methanol) was performed for 2 h as a comparison.
Figure 1. Experimental set-up of sequential SBSE.
SBSE 1h@1500 rpm SBSE 1h@1500 rpm
30% NaCl
Solutes: LogKow > 4 Solutes: LogKow < 4
1st Extraction 2nd Extraction

AN/2008/12 - 4
Sequential SBSE using a single stir bar is also possible when using 30 % NaCl as modifi er. However, if the second extraction is performed with a different kind of modifi er such as an organic solvent (e.g. 20 % methanol), a derivatizing reagent, or pH adjustment, then using 2 different stir bars is preferred. The reason is that such modifiers may influence the solutes absorbed in the stir bar during the fi rst extraction. Also, sequential SBSE using two stir bars can be performed with two different types of stir bars, e.g. a conventional PDMS-coated stir bar and a restricted access material (RAM)-coated stir bar [13]. Therefore, we have selected sequential SBSE using two stir bars both for the present study and for future work.
Reconditioning of stir bars after use was done by soaking, fi rst in Milli-Q purifi ed water for 24 h and then in a mixture of methylene chloride-methanol (1:1) for 24 h. Stir bars were then removed from the solvent and dried on a clean surface at room temperature for 1 h. Finally, the stir bars were thermally conditioned for 30 min at 300ºC in a fl ow of helium. Typically, 30 extractions could be performed with the same stir bar.TD–GC–MS. The two stir bars were thermally desorbed by programming the TDU from 40ºC (held for 0.5 min) to 280ºC (held for 5 min) at 720ºC/min with 50 mL/min desorption fl ow. Desorbed compounds were cryo-focused at -100ºC on a quartz wool packed liner in the PTV inlet for subsequent GC-MS analysis. After desorption, the PTV inlet was programmed from -100ºC to 280ºC (held for 5 min) at 720ºC/min to inject trapped compounds onto the analytical column. The injection was performed in the splitless mode with a 2 min splitless time. The separation was performed with helium carrier gas on a HP-5ms fused silica capillary column (30 m x 0.25 mm i.d., 0.25 μm film thickness, Agilent Technologies). The oven temperature was programmed from 70ºC (held for 2 min) at 25ºC/min to 150ºC, at 3ºC/min to 200ºC , and fi nally at 8ºC/min to 300ºC using the retention time locking (RTL) database from Agilent Technologies. The head pressure was adjusted to elute chlorpyrifos methyl at a fi xed retention time of 16.59 min. The mass spectrometer was operated in scan mode using electron-impact ionization (electron-accelerating voltage: 70 V). Scan range was set from m/z 58 to 510 and sampling rate of two, resulting in scan rate of 3.20 scan/s. The selected ions for determination are shown in Table 1. The Italicized and underlined ion was used as quantifi er.
RESULTS AND DISCUSSIONComparison of extraction efficiency between conventional SBSE and sequential SBSE. Fig.2 (a) shows the SBSE recovery as a function of log Ko/w using a typical combination of PDMS volume (24 μL) and sample volume (10 mL; natural water) [8] without modifier for the 80 test solutes. Additionally, the theoretical recovery line for the given phase ratio (ß: sample volume/PDMS volume=417) was also drawn. If the recovery of each analyte matched the theoretical value, then the more polar analytes should be more poorly recovered than the less polar analytes. It would be benefi cial if conditions could be found to drive recovery toward 100 % for all analytes, giving more uniform recovery and detection limits across a wider analyte polarity range. SBSE was performed for 2 h at ambient temperature and each extraction was carried out in duplicate. Concentrations of the test solutes were 500 ng/L each. The recovery was calculated by comparing peak areas with those obtained from a standard solution used for calibration curves. The standard solution was injected directly into the TDU through a septum head. The TDU contained two stir bars inside a glass desorption liner. Log Ko/w values were calculated with a SRC-KOWWIN software package (Syracuse Research, Syracuse, NY, USA) according to a fragment constant estimation methodology [14] for all analytes. Although recovery values for more than 50 solutes with log Ko/w values lower than 6.0 show good correspondence with theoretical recovery values, large deviations are observed for the rest of the solutes, especially for more hydrophobic compounds with log Ko/w of more than 6.0. This is mainly due to adsorption onto the glass wall of the extraction vessel [3, 10]. Several authors have reported results from adding organic solvent, e.g. 5-50 % methanol, to reduce the adsorption of more hydrophobic compounds onto the glass wall of the extraction vessel [9, 10, 15]. Fig. 2 (b) shows the recovery using the same SBSE conditions but with 20 % methanol addition. For more hydrophobic compounds with log Ko/w values more than 6.00, the recovery reached more than 70 %. However, as expected, 20 % methanol reduced the recovery for most of the compounds with log Ko/w of less than 6.0. In SBSE, there are many important parameters, for example Ko/w, sample volume, PDMS volume, phase ratio, extraction time, stirring speed, modifi er addition (e.g. methanol, salt), which infl uence SBSE recovery [3, 8, 16]. Several authors indicated that a smaller phase ratio (ß) provides practical benefi ts, e.g.

AN/2008/12- 5
c
Tabl
e 1.
Pes
ticid
es s
tudi
ed a
nd c
orre
spon
ding
oct
anol
-wat
er p
artit
ioni
ng c
oeffi
cien
ts (l
og K
o/w
), ca
tego
ry, s
elec
ted
ions
for q
uant
ifi ca
tion,
theo
retic
al
reco
very
, act
ual r
ecov
ery,
rep
eata
bilit
y, li
near
ity, a
nd li
mit
of d
etec
tion
(LO
D)
obta
ined
for
Seq
uent
ial S
BSE
-TD
-GC
-MS
anal
ysis
of
spik
ed n
atur
al
wat
er.

AN/2008/12- 6
c

AN/2008/12- 7
c

AN/2008/12 - 8
faster equilibration, and higher extraction effi ciency combined with an acceptable extraction time [8]. Also, using a small sample volume can reduce the effect of adsorption of hydrophobic solutes onto the glass wall of the extraction vessel due to the reduced exposure to glass surface [12]. In addition, the extraction of polar compounds does not result in signifi cantly higher quantities if the sample volume is increased above 10 mL [8]. Fig. 3 (a) shows the recovery with a smaller sample volume of 5 mL without modifi er. Compared to the 10 mL sample, the 5 mL sample shows much better correspondence with the theoretical recovery values (for ß = 208). Good recovery values in the range from 80 to 112 % were obtained for 46 solutes with log Ko/w values higher than 4.0.
Figure 2. Theoretical and experimental recovery as a function of log Ko/w for the 80 test solutes obtained by conventional SBSE of a 10 mL-sample spiked at 500 ng/L using a 24 μL PDMS coated stir bar; (a) without modifi er, and (b) with 20 % methanol. SBSE was performed for 2 hours.
Figure 3. Theoretical and experimental recovery as a function of log Ko/w for the 80 test solutes obtained by conventional SBSE and sequential SBSE of a 5 mL sample spiked at 500 ng/L using a 24 μL PDMS coated stir bar; (a) conventional SBSE without modifi er, (b) conventional SBSE with 30 % NaCl, and (c) sequential SBSE. Conventional SBSE without modifi er (a) and
AN/2008/12 - 9
Conventional SBSE with 30 % NaCl were performed for 2 hours. The fi rst extraction and the second extraction of sequential SBSE were performed for 1 hour.
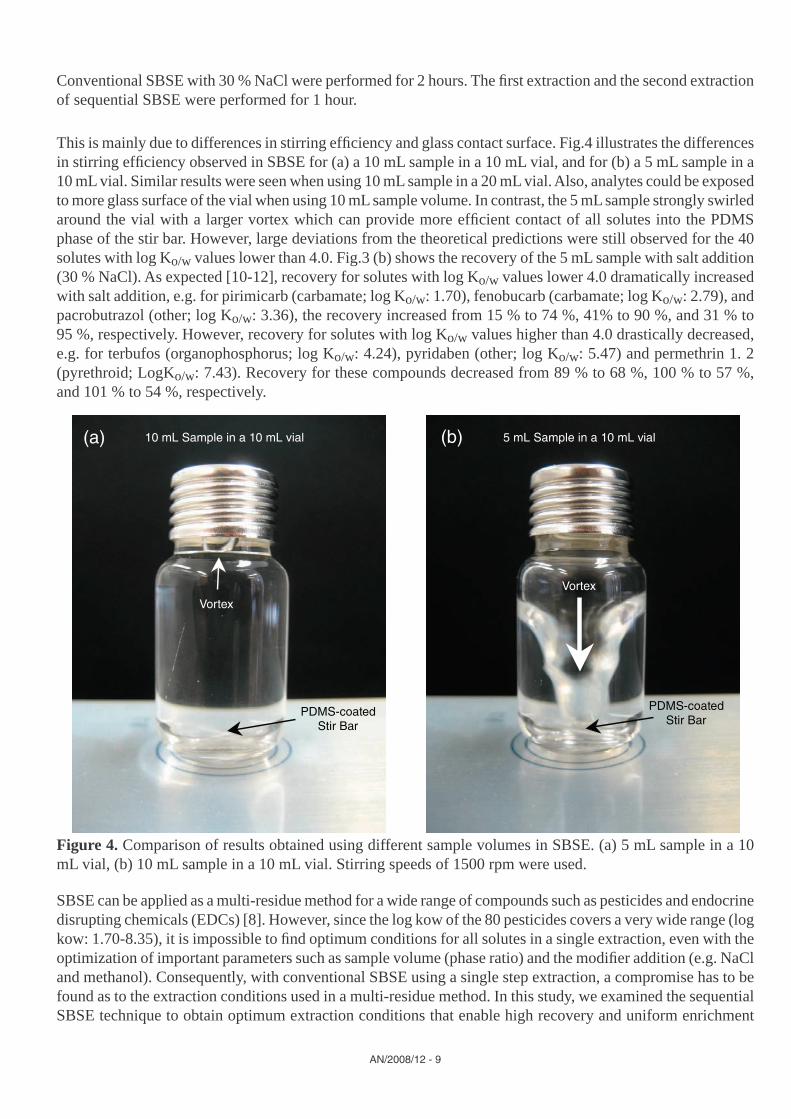
This is mainly due to differences in stirring effi ciency and glass contact surface. Fig.4 illustrates the differences in stirring effi ciency observed in SBSE for (a) a 10 mL sample in a 10 mL vial, and for (b) a 5 mL sample in a 10 mL vial. Similar results were seen when using 10 mL sample in a 20 mL vial. Also, analytes could be exposed to more glass surface of the vial when using 10 mL sample volume. In contrast, the 5 mL sample strongly swirled around the vial with a larger vortex which can provide more effi cient contact of all solutes into the PDMS phase of the stir bar. However, large deviations from the theoretical predictions were still observed for the 40 solutes with log Ko/w values lower than 4.0. Fig.3 (b) shows the recovery of the 5 mL sample with salt addition (30 % NaCl). As expected [10-12], recovery for solutes with log Ko/w values lower 4.0 dramatically increased with salt addition, e.g. for pirimicarb (carbamate; log Ko/w: 1.70), fenobucarb (carbamate; log Ko/w: 2.79), and pacrobutrazol (other; log Ko/w: 3.36), the recovery increased from 15 % to 74 %, 41% to 90 %, and 31 % to 95 %, respectively. However, recovery for solutes with log Ko/w values higher than 4.0 drastically decreased, e.g. for terbufos (organophosphorus; log Ko/w: 4.24), pyridaben (other; log Ko/w: 5.47) and permethrin 1. 2 (pyrethroid; LogKo/w: 7.43). Recovery for these compounds decreased from 89 % to 68 %, 100 % to 57 %, and 101 % to 54 %, respectively.
10 mL Sample in a 10 mL vial 5 mL Sample in a 10 mL vial
Vortex
Vortex
PDMS-coatedStir Bar
(a) (b)
PDMS-coatedStir Bar
Figure 4. Comparison of results obtained using different sample volumes in SBSE. (a) 5 mL sample in a 10 mL vial, (b) 10 mL sample in a 10 mL vial. Stirring speeds of 1500 rpm were used.
SBSE can be applied as a multi-residue method for a wide range of compounds such as pesticides and endocrine disrupting chemicals (EDCs) [8]. However, since the log kow of the 80 pesticides covers a very wide range (log kow: 1.70-8.35), it is impossible to fi nd optimum conditions for all solutes in a single extraction, even with the optimization of important parameters such as sample volume (phase ratio) and the modifi er addition (e.g. NaCl and methanol). Consequently, with conventional SBSE using a single step extraction, a compromise has to be found as to the extraction conditions used in a multi-residue method. In this study, we examined the sequential SBSE technique to obtain optimum extraction conditions that enable high recovery and uniform enrichment

AN/2008/12 - 10
for 80 pesticides across a very wide range of polarities. There are several possible combinations of the fi rst extraction (1st step) and the second extraction (2nd step) using the modifi ers. By using a sample volume of only 5 mL, the adsorption of more hydrophobic solutes onto glass the surface of the vial was eliminated for natural water samples. For samples such as beverages, fruit and vegetables, however, the recovery of more hydrophobic solutes can be reduced because of the high matrix content, especially solids, even with the smaller 5 mL sample. In this case, the use of organic modifi ers such as methanol has to be examined. For the present study, river water samples which have low matrix content were used as real sample (see further). Therefore, unmodifi ed sample was used for the 1st step. Salt (30 % NaCl) is a very important modifi er that is used to increase recovery for more hydrophilic solutes. However, 30 % NaCl in the 1st step can reduce recovery for more hydrophobic solutes. Consequently, salt addition was used for more hydrophilic solutes in the 2nd step after more hydrophobic solutes had already been extracted in the 1st step. Fig. 3 (c) shows the recovery values achieved using sequential SBSE on a 5 mL sample. In contrast with conventional SBSE with or without salt addition, the sequential approach eliminated the negative effect of the salt for solutes with log Ko/w of more than 4.0, while maintaining increased recovery for hydrophilic solutes with salt addition, resulting in high recovery in the range of 80 to 113 % for 75 solutes with log Ko/w of more than 2.5. Although the recovery for the 5 solutes with log Ko/w of less than 2.5 was in the range of 39 to 79 %, these values were higher than the theoretically predicted recovery. To achieve improved recovery values, it is of course necessary to do two extractions on each sample. This does include one additional manual step, and it can take longer than conventional SBSE. Table 1 shows theoretical SBSE recovery with a 5 mL sample volume and a 24 μL PDMS volume: SBSE recovery without modifi er, SBSE recovery with 30 % NaCl, sequential SBSE recovery, and repeatability of sequential SBSE recovery (n = 6).Screening of pesticides in river water. The linearity of the sequential SBSE method was evaluated over a concentration range from 20 to 1000 ng/L for 80 pesticides in natural water. Data was collected at six concentration levels. For each level, duplicate analyses were performed. For all solutes, good linearity was achieved with a correlation coeffi cient (r2) above 0.9900. There are several methods to determine the limit of detection (LOD). The most widely accepted
defi nition is based on estimating the LOD using low concentration spikes and calculating the standard deviation of the determination. The LOD is then defi ned as 3 times the standard deviation (for six replicates) obtained for an analyte concentration not higher than 10 times the LOD [17]. LOD values were calculated using repeat analyses of fortifi ed natural water spiked at 20 ng/L (lowest concentration of the calibration curves). For 67 solutes, very low LODs in the range of 2.1-10 ng/L were obtained, even when using a conventional quadrupole MS in scan mode. For 13 solutes, LODs were in the range of 11-74 ng/L. The linearity and the LODs of the method are listed in Table 1.
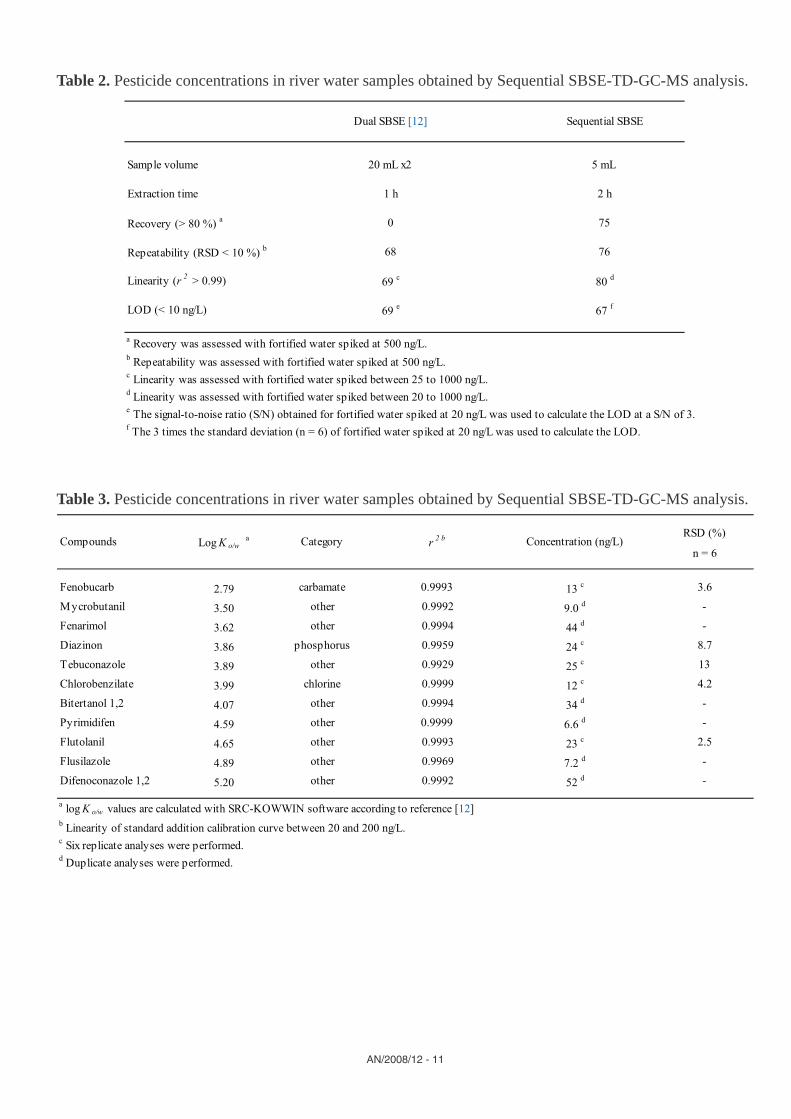
The results of the present study were compared with the results from dual SBSE recently reported by our group (Table 2) [12]. In contrast to dual SBSE, sequential SBSE provided excellent recovery values of more than 80 % for 75 solutes, resulting in more uniform enrichment. A higher recovery and uniform enrichment across the polarity range can provide several practical advantages. First, comparable values of very low LODs at less than 10 ng/L for a wide range of pesticides with dual SBSE could be achieved even with an 8 times smaller sample volume of 5 mL. Secondly, a large number of solutes showed better repeatability (< RSD 10 %) and linearity (r2 > 0.99). Thirdly, the resulting chromatogram more accurately refl ects the actual analyte concentrations without the need to correct for widely varying recovery values in the stir bar. Forth, this technique effectively extends the useful extraction range of the PDMS coating, reducing the need to develop additional coatings for SBSE.
Finally, the method was applied to several river water samples obtained from Tama River and Tsurumi River for screening of pesticide multi-residues. Determination of pesticides was carried out in six replicate analyses or duplicate analyses using standard addition calibration over the range from 20 to 100 ng/L. Table 3 shows the determined concentration levels of the detected pesticides, linearity of the standard addition calibration curve and repeatability (n = 6) of six replicate analyses for the selected samples. Eleven pesticides involving a variety of pesticide types were determined in the range from 7.2 to 52 ng/L. The log Ko/w values of the detected pesticides were in the range from 2.79 (fenobucarb) to 5.40 (difenoconazole 1, 2). Additionally, non-targeted pesticides, e.g. propetamphos (log Ko/w: 2.50) and isoprothiolan (log Ko/w: 2.79) were found with the Agilent RTL pesticide screener [18-20] but were not quantifi ed.
AN/2008/12 - 11
Table 2. Pesticide concentrations in river water samples obtained by Sequential SBSE-TD-GC-MS analysis.
Table 3. Pesticide concentrations in river water samples obtained by Sequential SBSE-TD-GC-MS analysis.

AN/2008/12 - 12
CONCLUSIONSA new SBSE procedure referred as sequential SBSE has been developed. When using sequential SBSE involving a first extraction of unmodified sample and a second extraction of modifi ed sample (30 % salt addition), a wide range of solutes with different polarities can be uniformly extracted and enriched, while the negative effect of salt addition on recovery of solutes with log Ko/w of more than 4.0 is eliminated. Also, much higher recovery values for a wider range of pesticides could be obtained using the proposed method compared to dual SBSE as well as to conventional SBSE, even when a smaller sample volume of 5 mL was used. Moreover, the method allows screening of a variety of pesticides (log Ko/w: 2.79 – 5.40) at ng/L levels in river water samples.
ACKNOWLEDGEMENTSThe authors thank Dr. Frank David of the Research Institute for Chromatography for his helpful advice.
REFERENCES[1] Analytical Methods for Target Chemicals in
Water Quality Control, Ministry of Health, Labor and Welfare, Tokyo, 2003.
[2] C. L. Arthur, J. Pawliszyn, J. Anal. Chem., 62 (1990) 2145.
[3] E. Baltussen, P. Sandra, F. David, C. A. Cramers, J. Microcol. Sep., 11 (1999) 737.
[4] H. Lord, J. Pawliszyn, J. Chromatogr. A, 885 (2000) 153.
[5] M. de F. Alpendurada, J. Chromatogr. A, 889 (2000) 3.
[6] J. Beltran, F. J. Lopez, F. Hernandez, J. Chromatogr. A, 885 (2000) 389.
[7] M. Kawaguchi, R. Ito, K. Saito, H. Nakazawa, J. Pharm. Biomed. Anal., 40 (2006) 500.
[8] F. David, P. Sandra, J. Chromatogr. A, 1152 (2007) 54.
[9] P. Serodio, J. M. F. Nogueira, Anal. Chim. Acta, 517 (2004) 21.
[10] V. M. Leon, B. Alvarez, M. A. Cobollo, S. Munoz, I. Valor, J. Chromatogr. A, 999 (2003) 91.
[11] S. Nakamura, S. Daishima, Anal. Bioanal. Chem., 382 (2005) 99.
[12] N. Ochiai, K. Sasamoto, H. Kanda, S. Nakamura, J. Chromatogr. A, 1130 (2006) 83.
[13] J. –P. Lambert, W. M. Mullett, E. Kwong, D. Lubda, J. Chromatogr. A, 1075 (2005) 43.
[14] W. M. Meylan, P. H. Howard, J. Pharm. Sci., 84 (1995) 83.
[15] T. Benijts, J. Vercammen, R. Dams, H. P. Tuan, W. Lambert, P. Sandra, J. Chromatogr. B, 755 (2001) 137.
[16] C. Bicchi, C. Cordero, P. Rubiolo, P. Sandra, J. Sep. Sci., 26 (2003) 1650.
[17] J. Pawliszyn, Solid Phase Microextraction Theory and Practice, Wiley-VCH, New York, 1997, pp. 123-125, 137.
[18] Ph. Wylie, B. Quimby, Agilent Application Note 5967-5860EN (2000), Agilent Technologies, Wilmington, DE, www.agilent.com/chem
[19] C. Kai Meng, Agilent Application Note 5988-4392EN (2001), Agilent Technologies, Wilmington, DE, www.agilent.com/chem
[20] P. Sandra, B. Tienpont, F. David, J. Chromatogr. A, 1000 (2003) 299.

AN/2008/12 - 13

������������� ��������������������������������� !�"#���$��%������&��
'�(�)*+�,*-��� �.��*!�*'�(�)*+�,*-��� �.��*!�!!/������0/�������1�222�/�������1�
��������3%1� *���$/$������$4�5��&$���6�$%��$1&5�"��,�*(*
'��)��*+�,� ��--�'��)��*+�,� ��-- $%7�0/������&��1�222�/������&��1�
��������8��%���9�$���&��%������������* ��.,�*��&����
'���)��+�(�,��( �,!'���)��+�(�,��( �,�/������01��/�������1�222�/���������
�������������,��!��-�:�;�%�5�"�/&���;&��$��<�;&���$�$����$��&��$��;$���=��/�,>��,�**!����;<�
'-��!�� !���!,�'���!�� !���!,,$%7�01��/�������1��?9222�/�������1��?9
������������� �������1�%$�1����=#���=���$%"��&�/�������@��!�* -(�=���$%
)*�!*+�,��(*�(-�,-)*�!*+�,��(*�(-�, �A���$%0/���������
������������� �������1�%$�1����=#���=���%���;�������� ,-,*(�=���%
)*��,�+�!�� ��.�,�)*��,�+�!�� ��.��,�A���%0/���������
������������� �������1�%$�1����=#���������&������1��1�����@��.� .,,(�������&��
)* �,�+�(�.!�(,��*)* �,�+�(�.!�(,�,,�A;�����&��0/���������
������������� �������1�%$�1����=#���"#%1��%���7�%�����/���$%/�,(-�(,(�"#%1��%
)*��,�+�!�� ��.�,�)*��,�+�!�� ��.��,�A���%0/���������
�������5���8���8 ��&%���B3�����$%���$%/����/�%��B���%��$1��%����������������� �����C%���&%/�%�4��������%
3%7����$�%5����1�$9�$�%���%���9�1$7$1��$�%��$%���$��&�$1��$�%������&?�1�����1��%/��2$���&��%��$1���������5���8���8 ���%���B3����������/$��������������;���7�������������� ������
��$%����$%�������9���7�����%<
D� �9<�$/���<�������������� �����