a novel framework for longitudinal atlas construction with ... novel framework for longitudinal...
TRANSCRIPT

NeuroImage 59 (2012) 1275–1289
Contents lists available at SciVerse ScienceDirect
NeuroImage
j ourna l homepage: www.e lsev ie r .com/ locate /yn img
A novel framework for longitudinal atlas construction with groupwise registration ofsubject image sequences
Shu Liao, Hongjun Jia, Guorong Wu, Dinggang Shen ⁎, The Alzheimer's Disease Neuroimaging Initiative 1
IDEA Lab, Department of Radiology and BRIC, University of North Carolina at Chapel Hill, NC, USA
⁎ Corresponding author at: Department of RadiologyCarolina at Chapel Hill, MRI Building, CB #7515, 106 MNC 27599, USA. Fax: +1 919 843 2641.
E-mail address: [email protected] (D. Shen).1 Data used in preparation of this article were obtaine
Neuroimaging Initiative (ADNI) database (adni.loni.ucltors within the ADNI contributed to the design and improvided data but did not participate in analysis or wrilisting of ADNI investigators can be found at: http:/uploads/how to apply/ADNI Authorship List.pdf.
1053-8119/$ – see front matter © 2011 Elsevier Inc. Alldoi:10.1016/j.neuroimage.2011.07.095
a b s t r a c t
a r t i c l e i n f oArticle history:Received 25 April 2011Revised 1 July 2011Accepted 26 July 2011Available online 22 August 2011
Keywords:Longitudinal atlas constructionGroupwise registrationUnbiased atlas
Longitudinal atlas construction plays an important role in medical image analysis. Given a set of longitudinalimages from different subjects, the task of longitudinal atlas construction is to build an atlas sequence whichcan represent the trend of anatomical changes of the population. The major challenge for longitudinal atlasconstruction is how to effectively incorporate both the subject-specific information and population informa-tion to build the unbiased atlases. In this paper, a novel groupwise longitudinal atlas construction frameworkis proposed to address this challenge, and the main contributions of the proposed framework lie in the fol-lowing aspects: (1) The subject-specific longitudinal information is captured by building the growth modelfor each subject. (2) The longitudinal atlas sequence is constructed by performing groupwise registrationamong all the subject image sequences, and only one transformation is needed to transform each subject'simage sequence to the atlas space. The constructed longitudinal atlases are unbiased and no explicit templateis assumed. (3) The proposed method is general, where the number of longitudinal images of each subjectand the time points at which they are taken can be different. The proposed method is extensively evaluatedon two longitudinal databases, namely the BLSA and ADNI databases, to construct the longitudinal atlas se-quence. It is also compared with a state-of-the-art longitudinal atlas construction algorithm based on kernelregression on the temporal domain. Experimental results demonstrate that the proposed method consistent-ly achieves higher registration accuracies and more consistent spatial–temporal correspondences than thecompared method on both databases.
and BRIC, University of Northason Farm Road, Chapel Hill,
d from the Alzheimers Diseasea.edu). As such, the investiga-plementation of ADNI and/orting of this report. A complete/adni.loni.ucla.edu/wpcontent/
rights reserved.
© 2011 Elsevier Inc. All rights reserved.
Introduction
Longitudinal atlas construction is an active research topic in longi-tudinal data analysis and it plays an important role in medical imageanalysis. Its applications include, but not limited to, disease tracking(Fox et al., 2000), population analysis (Freeborough and Fox, 1997)and anatomical structure analysis (Cardenas et al., 2007). The taskof longitudinal atlas construction is to estimate an atlas sequence inthe temporal domain which can reflect the trend of anatomicalchanges in the population based on a given set of longitudinalimage sequences from different subjects. The major challenge for lon-gitudinal atlas construction is how to effectively encode both the
intra-subject longitudinal change and the inter-subject difference inthe constructed atlas sequence.
Longitudinal atlas construction methods can be broadly classifiedinto two categories: (1) Longitudinal atlas construction by kernel re-gression or mixture modeling over the temporal domain (Davis et al.,2007, 2010; Sabuncu et al., 2009; Hart et al., 2010); (2) Longitudinalatlas sequence estimated by joint alignment of subject image se-quences to a template sequence (Durrleman et al., 2009). A represen-tative of the kernel regression based atlas construction methods is themethod proposed by Davis et al. (Davis et al., 2007, 2010), where thelongitudinal atlases at different time points are constructed by a ker-nel regression process over the temporal domain on the Riemannianmanifold represented by diffeomorphisms. The contribution of eachimage during the regression process to construct the atlases is deter-mined by the kernel weight. In Davis et al. (2007, 2010), the Nadar-aya–Watson kernel regression process is extended by formulatingthe regression problem based on the Fréchet mean. This method isdesigned for random design data and therefore there is no subject-specific longitudinal information considered. Also, it may lead to tem-poral inconsistency between the images taken at different time pointsof the same subject. The schematic representation of this method isshown by Fig. 1(a). Also, Durrleman et al. (2009) proposed a jointspatial–temporal registration approach to construct the

Fig. 1. (a) Schematic representation of the longitudinal atlas construction method proposed by Davis et al. (2007, 2010), where the atlas at each time point is estimated by the ker-nel regression process over the temporal domain. However, the subject-specific longitudinal information is not considered in this approach. (b) Schematic representation of thelongitudinal atlas construction method proposed by Durrleman et al. (2009), where the evolution model for each subject is estimated first, as indicated by solid lines, and theneach subject's image sequence is registered to the atlas sequence. (c) The proposed method. For each subject i, its corresponding growth model is established based on the 4Dimage registration approach. Then, a single transformation ϕi is estimated to map subject i's image sequence to the atlas space. Each image of subject i can be transformed tothe atlas space by the composite deformation field formed by ϕi and subject i's growth model. The evolution model χ in the atlas space can warp each transformed image fromthe subject space to any time point in the atlas space. Finally the atlas at each time point is estimated by the kernel regression process on the warped images.
1276 S. Liao et al. / NeuroImage 59 (2012) 1275–1289
longitudinal atlas and its schematic representation is illustrated byFig. 1(b). In Durrleman et al. (2009), the subject-specific longitudi-nal information is explicitly modeled. More specifically, the subject-specific evolution model is first established by the regression pro-cess based on large deformations (Durrleman et al., 2008; Vaillantand Glaunes, 2005), which is represented by the solid lines acrossthe images belonging to the same subject in Fig. 1(b). Then, eachsubject image sequence is aligned to the atlas sequence, and thetemplate used in Durrleman et al. (2009) is explicitly determinedbased on the generative statistical model, which may lead to bias.
In this paper, we incorporate the subject-specific longitudinal infor-mation as the second layer together with the population informationinto a unified framework for longitudinal atlas construction. Therefore,the proposed method is a further step beyond the random design set-ting in Davis's method (Davis et al., 2007, 2010) for longitudinal atlasconstruction. The schematic representation of the proposed method isillustrated by Fig. 1(c). The proposed method captures the subject-specific longitudinal information by estimating the growth model foreach subject, which is illustrated by the dotted lines across the imagesbelonging to the same subject. The growth model of each subject is es-timated by a feature based 4D image registration method proposed inShen and Davatzikos (2004). After estimating the growth model ofeach subject, the longitudinal information contained in each subjectcan be propagated to each time point in the subject space based onthe growth model. Without loss of generality, the earliest time pointof each subject is selected as the time point atwhich the longitudinal in-formation of the subject is propagated in this paper. Moreover, the pop-ulation information is also considered by performing groupwiseregistration among all the subject image sequences. Therefore, no ex-plicit template is used in the proposedmethodwhich largely overcomesthe bias of the template. In the proposedmethod, only one transforma-tion is needed for each subject to map from its space to the atlas spacesince image of any time point of the same subject's image sequencehas already been well aligned in its own space based on the growthmodel. Finally, atlases at different time points are jointly estimated byapplying the kernel regression process on all the warped images fromdifferent subjects and different time points in the atlas space.
The proposed method has been extensively evaluated on two lon-gitudinal databases: the BLSA and ADNI databases for longitudinalatlas construction. The proposed method is also compared with astate-of-the-art longitudinal atlas construction approach proposedby Davis et al. (2007, 2010). Experimental results demonstrate thatthe proposed method consistently achieves higher registration accu-racy as well as more consistent temporal correspondences than thecompared method on both databases.
The rest of the paper is organized as follows:Wewill first present ourproposed method for longitudinal atlas construction and analyze itsproperties. Then, experimental results of the proposed method will begiven. Finally, the whole paper is concluded in the Conclusion section.
Formulation of the proposed longitudinal atlasconstruction framework
Data used in the preparation of this article were obtained from theAlzheimers Disease Neuroimaging Initiative (ADNI) database (adni.-loni.ucla.edu). The ADNI was launched in 2003 by the National Insti-tute on Aging (NIA), the National Institute of Biomedical Imagingand Bioengineering (NIBIB), the Food and Drug Administration(FDA), private pharmaceutical companies and non-profit organiza-tions, as a $60 million, 5-year public-private partnership. The primarygoal of ADNI has been to test whether serial magnetic resonance im-aging (MRI), positron emission tomography (PET), other biologicalmarkers, and clinical and neuropsychological assessment can be com-bined to measure the progression of mild cognitive impairment (MCI)and early Alzheimers disease (AD). Determination of sensitive andspecific markers of very early AD progression is intended to aid re-searchers and clinicians to develop new treatments and monitortheir effectiveness, as well as lessen the time and cost of clinical trials.
In this section, the details of the proposed longitudinal atlas con-struction framework are given. The proposed framework mainly con-sists of four steps: (1) Subject-specific growth model estimation;(2) Transformation ϕi estimation for each subject i to map from thesubject space to the atlas space; (3) Atlas construction at each timepoint in the atlas space by performing kernel regression; (4) The evo-lution model χ estimation in the atlas space. It should be noted thatthe subject-specific growth model in the first step needs to be esti-mated only for one time, while the other three steps are performed it-eratively until convergence. The flow chart of the proposedframework is illustrated in Fig. 2.
The preprocessing step illustrated in Fig. 2 includes the histogrammatching and rigid alignment process of all the images to the baselineimage of the subject. It should be noted that this preprocessing step isalso applied to Davis's method (Davis et al., 2007, 2010) implementedin this paper for fair comparison, since the initial rigid alignment hassignificant influence on the diffeomorphic registration results.
Suppose there are N different time points where we want to con-struct the atlas sequence, denoted as T={t1, t2,…, tN}. We also denotethe atlas at each time point t∈T as Mt. To construct the atlas se-quence, we are also given image sequences of different subjects, andthe number of longitudinal images of each subject and the time points

Fig. 2. The flow chart of the proposed method.
1277S. Liao et al. / NeuroImage 59 (2012) 1275–1289
at which the images are scanned can be different. Without loss ofgenerality, suppose that there are C different subjects, and each sub-ject i (i=1,…,C) has ni longitudinal images. We denote the longitudi-nal image taken at the jth time point of subject i as Stji, where tj
i
denotes the jth time point of subject i. The proposed framework forlongitudinal atlas construction can be formulated by Eq. (1):
E Mt ;ϕi;χ;Vi
� �
¼ Σt∈TΣCi¼1
∑ti0≤tij≤tini−1
d Mt ;χti0→t Itij
� �� �2Kh t−tij
� �
∑ti0≤tij≤tini−1
Kh t−tij� � þ ψ ϕi
;χ� �
8>>>><>>>>:
9>>>>=>>>>;; ð1Þ
where Itji denotes the transformed image of Stji to the atlas space,which is defined by Eq. (2):
Itij ¼ ϕi∘Vitij→ti0
� � Stij
� �; ð2Þ
where Vi denotes the subject-specific growth model for subject i, andV(tji→ t0
i)i (Stji) denotes the operation of transforming the image Stji of sub-
ject i to the first timepoint t0i of subject i based on its growthmodel.ϕi isthe transformation to map the subject space of subject i to the atlasspace, and ∘ denotes the operation of composing deformations.
In Eq. (1), d(·) denotes the distance metric between two imagesbased on the theory of diffeomorphisms (Beg et al., 2005; Dupuisand Grenander, 1998; Joshi and Miller, 2000; Miller, 2004; Millerand Younes, 2001; Miller et al., 2002), which is defined by Eq. (3):
d G1;G2ð Þ2 ¼ min ∫10jjvsjj2Udsþ
1σ2 jjG1 φ−1
� �−G2jj2L2
� �; ð3Þ
where G1 and G2 denote two input images, φ(·) denotes the diffeo-morphic transformation, and vs is its related velocity field. The rela-tionship between φ(·) and vs at each voxel position tx is expressedby Eq. (4). || · ||U2 denotes the Sobelev norm and ||· ||L22 denotes theL2 norm. In this paper we followed the settings of large deformationdiffeomorphic metric mapping (LDDMM) (Beg et al., 2005) forEq. (3) where the velocity fields were integrated via the semi-Lagrangian scheme and the Cauchy–Navier type operatorwas adoptedas the differential operator to construct the self-adjoint kernel.
φ xð Þ ¼ xþ ∫1
0vs φs xð Þð Þds; ð4Þ
where φs(x) denotes the displacement at voxel position x at times∈ [0,1].
In Eq. (1), χ denotes the evolution model in the atlas space, andχt0i → t(Itji) denotes the operation of warping the transformed imageItji from time point t0
i to the underlying time point t in the atlasspace based on the evolution model χ. Kh(·) is the kernel functionwhich assigns different weights to each image to reflect the contribu-tion of the image to construct the atlas. h is the bandwidth of the ker-nel function Kh(·). Kh tð Þ ¼ 1
h Kth
� �, where K(·) is a function satisfying
Eq. (5):
∫K tð Þdt ¼ 1: ð5Þ
In this paper, the Gaussian function is adopted as the kernel func-tion Kh(·) similar to Davis et al., 2007 (2010). In this paper, the kernelbandwidth is empirically determined in a way similar to Davis et al.(2007, 2010) according to the following rule: If the number of longi-tudinal images of each subject image sequence is relatively small, alarger kernel bandwidth is adopted in order to include a sufficientnumber of images from different subjects to robustly construct thelongitudinal atlas sequence. On the other hand, if the number of lon-gitudinal images of each subject image sequence is relatively large,then a smaller kernel bandwidth is enough to include a sufficientnumber of images from different subjects to robustly construct thelongitudinal atlas sequence, and the longitudinal changes across theconstructed atlases at different time points are more obvious with asmaller and sharper kernel bandwidth.
The last term Ψ(ϕi,χ) in Eq. (1) is the overall smoothness termdefined by Eq. (6):
Ψ ϕi;χ
� �¼ γϕi Reg ϕi
� �þ γχReg χð Þ; ð6Þ
where Reg(·) denotes the regularization function, and γφi and γχ areconstants reflecting the trade-off between the accuracy in imagematching and the smoothness of the deformation field.
Therefore, the physical meaning of Eq. (1) can be explained as fol-lows: First, the growth model Vi is estimated for each subject i to en-code the subject-specific longitudinal information. Based on theestimated growth model, each longitudinal image Stji of subject i iswarped to the first time point t0i of subject i. Then, the transformationϕi is estimated based on the warped images of subject i at time pointt0i to project the image sequence of subject i to the atlas space, the cor-responding projected image of Stji is Itji. The projected images in theatlas space are propagated to each time point t∈T in the atlas spaceby the evolution model χ in the atlas space. Finally, the kernel regres-sion process is performed at each time point t∈T on the propagated

1278 S. Liao et al. / NeuroImage 59 (2012) 1275–1289
images χt0i → t(Itji) (i=1,…,C, j=0,…,ni−1) to construct the atlas Mt
at t.To minimize the energy function in Eq. (1), we need to estimate
the optimal variables Vi, ϕi, Mt and χ. As stated in the beginning ofthis section, the growth model Vi of each subject only needs to beestimated once, while the transformation ϕi to map each subject'sspace to the atlas space, the atlas Mt at time point t, and the evo-lution model χ in the atlas space need to be iteratively estimatedand updated. In this paper, variables ϕi, Mt and χ in Eq. (1) are op-timized by using the three-step alternated minimization strategyas also adopted in Durrleman et al. (2009). In the following sec-tions, details of the optimization strategy with respect to each var-iable are given.
Subject-specific growth model construction
The first step of the proposed framework after the preprocessingstage is the estimation of the subject-specific growth model, as illus-trated in Fig. 2. In this paper, the subject-specific growth model ofeach subject is estimated based on the 4D feature based image regis-tration method proposed in (Shen and Davatzikos, 2004). This stepcan be summarized by Algorithm 1.
Algorithm 1. Growth model estimation for subject i
Input: The rigidly-aligned and histogram-matched image se-quence St0i , St1i ,…, Stni− 1
i of subject i, where ni denotes the total numberof images in the image sequence of subject i.
Output: Deformation fields V(t0i → t0i
)i , V(t1i → t0i
)i , …, V(tni− 1i → t0
i)i map-
ping from St0i , St1i , …, Stni− 1
i to St0i .
1. Construct the moving image sequence as St0i , St1i , …, Stni− 1
i .2. Construct the reference image sequence by repeating the first time
point image as St0i , St0i , …, St0i .3. Register the moving image sequence to the reference image se-
quence using the 4D HAMMER method in Shen and Davatzikos(2004). Denote the resulting deformation field that warps Stji(j=0,…,ni−1) to St0i as V(tji→ t0
i)i , where V(t0i → t0
i)i is the identify de-
formation field.4. Return V(t0i → t0
i)i , V(t1i → t0
i)i , …, V(tni− 1
i→ t0
i)i .
Therefore, the growth model of each subject i is represented bydeformation fields V(t0i → t0
i)i , V(t1i → t0
i)i , …, V(tni− 1
i→ t0
i)i which warp eachfollow-up scan of subject i to the baseline scan. The estimated growthmodel Vi can establish reliable temporal correspondences among thelongitudinal images of the same subject i to preserve the trajectoryconstraints. The role of growth model Vi is to serve as a longitudinalinformation flow which can propagate the subject-specific longitudi-nal information contained in each longitudinal image of subject i to acommon space. Without loss of generality, in this paper each longitu-dinal image is warped to the earliest time point of its correspondingsubject. Therefore, for each subject i, its subject-specific longitudinalinformation is now propagated and aggregated at its earliest timepoint t0i .
Another advantage of building the growth model Vi for each sub-ject i is that when there is a large gap between two consecutivetime points, the growth model can interpolate the longitudinal im-ages between two time points. This interpolation process can bridgethe gap of the dramatic anatomical changes between two time pointsto ensure the temporal smoothness during the atlas constructionstep. As stated at the beginning of Section , the subject-specificgrowth model estimation step only needs to be estimated once foreach subject.
In the following sections, the optimization strategy to iterativelyestimate the rest of the variables ϕi, Mt and χ in Eq. (1) is given.
Estimation of the transformation to project each subject's space to theatlas space
After estimating the growth model Vi of each subject i in Section ,the next step is to estimate the transformation ϕi to project each sub-ject i's space to the atlas space in Eq. (1), which is a diffeomorphic de-formation field. We can estimate ϕi by fixing the rest of the variablesMt and χ in Eq. (1). Also, to estimate ϕi, the image distance metric d(Mt,χt0i → t(Itji)) in Eq. (1) can be rewritten as d((χt0i → t)−1Mt, Itji), andit should be noted that this conversion is valid only if the evolutionmodel χ is a diffeomorphic transformation.
The converted image distance metric d((χt0i → t)−1Mt, Itji) can beinterpreted as: Each atlas Mt at time point t∈T is first warped to theearliest time point t0
i of subject i by the reversed evolution modelχ−1 in the atlas space. Then, each image Stji of subject i is warped tothe earliest time point t0i of subject i in the subject space by subjecti's growth model Vi. Finally, the warped atlas in the atlas space andthe warped image in the subject space are matched by the transfor-mation ϕi. Therefore, by fixing the rest of the variables in Eq. (1),Eq. (1) with respect to ϕi can be rewritten as:
J ϕi� �
¼ Σt∈T
∑ti0≤tij≤tini−1
d χti0→t
� �−1Mt ; Itij
� 2Kh t−tij
� �
∑ti0≤tij≤tini−1
Kh t−tij� � þ γϕi Reg ϕi
� �8>>>>><>>>>>:
9>>>>>=>>>>>;;
ð7Þ
where Itji=ϕi ∘V(tji→ t0i)
i (Stji). Eq. (7) denotes the process of warping theatlases at different time point t∈T to the earliest time point t0i of sub-ject i by the reversed evolution model χ−1 in the atlas space, and allthe images Stji of subject i have been warped and aggregated at timepoint t0i in the subject space via the growthmodel Vi. Thus the optimaltransformation ϕi can be estimated by performing diffeomorphic reg-istration between the warped images in subject i's space and thewarped atlases in the atlas space by minimizing the sum of theweighted image intensity differences between each pair of imagesin the subject space and in the atlas space, with the weights deter-mined by the kernel function. The schematic illustration on how toestimate ϕi is given in Fig. 3.
After estimating ϕi, the next step of the proposed method is toconstruct and update the atlases at different time points in the atlassequence, which will be described in the next section.
The atlas sequence construction
In order to construct and update the atlas Mt at different timepoint t∈T in the atlas space after estimating ϕi in Section , we alsofix the rest of the variables Vi, ϕi and χ in Eq. (1). Then, Eq. (1) withrespect to Mt can be rewritten as:
J Mtð Þ ¼ ΣCi¼1
∑ti0≤tij≤tini−1
d Mt ;χti0→t Itij
� �� �2Kh t−tij
� �
∑ti0≤tij≤tini−1
Kh t−tij� �
8>>>><>>>>:
9>>>>=>>>>;: ð8Þ
The optimal solution of Mt of Eq. (8) can be obtained by Eq. (9):
Mt ¼ arg minMopt∈Λ
∑C
i¼1
∑ni−1j¼0 Kh t−tij
� �d Mopt ;χti0→t Itij
� �� �2
∑ni−1j¼0 Kh t−tij
� �0B@
1CA; ð9Þ
where Λ denotes the whole possible image space, C denotes the num-ber of subjects, and ni denotes the number of longitudinal images of

Fig. 3. Illustration of the process to estimate ϕi. Each atlas is warped to the earliest time point t0i of subject i in the atlas space by the reversed evolution model χ−1, which is repre-sented by the blue arrows. Each image Stji of subject i is warped to the earliest time point t0i of subject i in the subject space via the growth model, which is represented by the dashedred arrow. Then, the transformation ϕi to map the subject space to the atlas space can be estimated by performing diffeomorphic registration between the warped images in thesubject space and the warped atlases in the atlas space both at time point t0i .
1279S. Liao et al. / NeuroImage 59 (2012) 1275–1289
subject i. d(·) is the distance metric between two images definedbased on diffeomorphisms by Eq. (3).
Therefore, Eq. (9) denotes the kernel regression process to con-struct the atlas Mt at different time point t∈T. In this paper, thegreedy iterative optimization strategy proposed in Joshi et al.(2004) is adopted to estimate the optimal atlasMt in Eq. (9). The iter-ative optimization strategy consists of two steps: First, the groupmean of all the warped images based on φ(x) in Eq. (4) is computed,and set it asMt. Then, each image is registered to the currentMt to up-date φ(x) and return to the first step until convergence. After estimat-ing Mt, the last step of the proposed framework is to estimate theevolution model χ in the atlas space, and details will be given in thenext section.
Evolution model estimation in the atlas space
The last step of the proposed algorithm is to estimate the evolu-tion model χ in the atlas space, which is represented by a set of dif-feomorphic deformation fields mapping the atlas Mt at each timepoint t to its consecutive timepoint atlas Mt+1. By fixing the rest ofthe variables Vi, ϕi and Mt in Eq. (1), Eq. (1) becomes:
J χð Þ ¼ Σt∈TΣCi¼1
∑ti0≤tij≤tini−1
d Mt ;χti0→t Itij
� �� �2Kh t−tij
� �
∑ti0≤tij≤tini−1
Kh t−tij� � þ γχReg χð Þ
8>>>><>>>>:
9>>>>=>>>>;:
ð10Þ
To obtain the optimal solution χ in Eq. (10), each image of eachsubject i is first warped to the first time point of subject i and pro-jected to the atlas space by the estimated transformation ϕi. Then,similar to the estimation of ϕi in Section , χt0i → t can be estimated byperforming diffeomorphic registration between the projected imagesof subject i in the atlas space with Mt. The overall evolution model χcan be obtained by stitching all χt0i → t. The role of the kernel functionKh(·) here is to reflect the weight of each projected image to estimateχ.
Experimental results
In this section, the proposed method is evaluated by constructinglongitudinal atlas sequence on two longitudinal databases: The ADNI2
and BLSA databases (Resnick et al., 2000). The proposed method is
2 www.loni.ucla.edu/ADNI.
also compared with a state-of-the-art longitudinal atlas constructionmethod proposed by Davis et al. (2007, 2010) on both the registrationaccuracy and temporal consistency. The proposed method and thecompared method proposed by Davis et al. are both implementedbased on ITK.3 In the following sections, experimental results on theADNI and BLSA databases will be given. For fair comparison, the lon-gitudinal atlas sequence of the proposed method is initialized byusing Davis's method under comparison. More specifically, eachatlas Mt is initialized with kernel regression over the temporal do-main at each time point t.
Experimental results on the ADNI database
In this section, the experimental results on the ADNI database aregiven. In this experiment, 20 normal subjects are selected from theADNI database, and each subject has 4 longitudinal MRI imagesscanned at different time points. For each subject, the time points atwhich its 4 longitudinal images are scanned are: Baseline timepoint, 6 months after the baseline time point, 1 year after the baselinetime point, and 2 years after the baseline time point. Therefore, thetime gap between the third time point and the fourth time point islarger than any other two consecutive time points for each subject.The baseline time points of the 20 normal subjects vary from ages70 to 88, and the coverage of the scan times of the 20 normal subjectsis plotted in Fig. 4. It can be observed from Fig. 4 that the number ofimages scanned at different ages is approximately the same, whichavoids the bias in a specific age during the longitudinal atlas construc-tion process. Before we conduct the proposed algorithm on this data-base, each image is preprocessed by the following procedures: First,the anterior commissure (AC)–posterior commissure (PC) correctionis applied to each image, and each image is resampled to resolution256×256×256 with voxel size 1mm×1mm×1mm. The N3 algorithm(Sled et al., 1998) is then adopted for intensity inhomogeneity correc-tion. After the intensity inhomogeneity correction step, the skull-stripping process is performed on each image. In this paper, we takeadvantages of two popular skull-stripping methods, which are theBrain Surface Extractor (BSE) (Shattuck et al., 2001) and the Brain Ex-traction Tool (BET) (Smith, 2002), followed by further manual editingto ensure the skull-stripping results. Finally, the FAST algorithm in FSL(Zhang et al., 2001) is adopted to segment each image into three dif-ferent types of tissues: white matter (WM), gray matter (GM) and thecerebrospinal fluid (CSF). Fig. 5 shows some sample images takenfrom different subjects, and it can be observed from Fig. 5 that there
3 http://www.itk.org/.

70 71 72 73 74 75 76 77 78 79 80 81 82 83 84 85 86 87 88 89 90
Subject 1Subject 2Subject 3Subject 4Subject 5Subject 6Subject 7Subject 8Subject 9Subject 10Subject 11Subject 12Subject 13Subject 14Subject 15Subject 16Subject 17Subject 18Subject 19Subject 20
Fig. 4. The coverage of the scanned times for each of the 20 normal subjects selected from the ADNI database.
Fig. 5. Sample images taken from different subjects of the ADNI database. Large structural variations can be observed across different subjects.
1280 S. Liao et al. / NeuroImage 59 (2012) 1275–1289
are large structural variations across different subjects in thisdatabase.
In this paper, we construct the longitudinal atlases from ages 72 to86 with time gap 2 years between two consecutive time points on the
Age=72 74
80 82
Fig. 6. The same cross-sectional images obtained from the atlas constructed by the proposedobtained which preserve subtle anatomical structures.
ADNI database. Since there are only 4 longitudinal images of eachsubject, empirically the kernel bandwidth should be larger in orderto cover sufficient population information. In this paper, the Gaussiankernel with bandwidth σ=6 years are adopted in Eq. (1) to construct
76 78
84 86
method at different ages on the ADNI database. It can be observed that sharp atlases are

Fig. 7. 3D rendering of the atlas of age 80 constructed by: (a) the method proposed by Davis et al. (2007, 2010) and (b) the proposed method on the ADNI database. Significantdifferences are highlighted with the green circles.
1281S. Liao et al. / NeuroImage 59 (2012) 1275–1289
the atlases. To visualize the atlas construction performance of theproposed method, Fig. 6 shows the same cross-sectional images ofthe constructed atlases at different ages on the ADNI database. Itcan be observed that the constructed atlases are sharp and preservesubtle anatomical structures.
Moreover, to visually compare the registration accuracy of theproposed method and the method proposed by Davis et al. (2007,2010), Figs. 7(a) and (b) show the 3D rendering of the atlases atage 80 constructed by Davis's method and the proposed method,respectively.
It can be observed from Fig. 7 that the atlas constructed by theproposed method is much sharper than the one obtained by Davis'sapproach (Davis et al., 2007, 2010). Moreover, it can be observedfrom Fig. 7 that the atlas constructed by the proposed method pre-serves more anatomical details than the one obtained by Davis'smethod. Significant differences between the atlases constructed bythe proposed method and Davis's method are highlighted by thegreen circles in Fig. 7.
(a) (b) (c)
0
128
255
(d)0
128
256
(e)
Fig. 8. (a) The constructed atlas at age 80. (b) A subject image scanned at the same ageas the atlas shown in (a). (c) An image scanned at age 82 from the same subject as (b),which is different from the age of the constructed atlas shown in (a). The correspond-ing image residuals obtained between the constructed atlas shown in (a) and thewarped subject images shown in (b) and (c) are shown in (d) and (e), respectively.
In order to illustrate the effectiveness of the proposed method inlongitudinal atlas reconstruction, we also conduct an experiment toshow the similarity between images obtained from different agesand a constructed atlas at a specific age. Figs. 8(d) and (e) show theimage residuals obtained between the constructed atlas at age 80and two registered images from the same subject scanned at age 80and 82, respectively. The corresponding constructed atlas at age 80and the two original subject images used to calculate the residualsare shown in Figs. 8(a) to (c), respectively for reference. It can be ob-served from Fig. 8 that the image residual obtained between the con-structed atlas at age 80 and the warped subject image obtained at thesame age is significantly smaller than the one obtained between theconstructed atlas and the warped subject image obtained at a differ-ent age. Therefore, the effectiveness of the proposed method in longi-tudinal atlas reconstruction can be visually implied by Fig. 8.
Moreover, quantitative experimental results to evaluate the effec-tiveness of the proposed method in longitudinal atlas reconstructionare also given in Fig. 9, which shows the whisker plot of the absoluteintensity errors of image residuals obtained between the constructedatlas at age 80 and warped subject images scanned at three differentage ranges: ages from 74 to 76, ages from 80 to 82 and ages from 84 to86, respectively. Ten images are taken from each age range for the cal-culation of Fig. 9. It can be observed from Fig. 9 that the absolute in-tensity errors obtained from age range from 80 to 82 (i.e., the age
74 to 76 80 to 82 84 to 860
1
2
3
4
5
6
7
8
9
10
Ages
Abs
olut
e In
tens
ity E
rror
s
Fig. 9. The absolute intensity errors between the constructed atlas at age 80 and all thewarped subject images taken from three different age ranges. The horizontal lines ineach box represent the 25th percentile, median, and 75th percentile, respectively.The whiskers extend to the most extreme data points.

Age=72 74 76 78
80 82 84 86
Fig. 10. Atlases constructed by the proposed method at different ages on the 20 selected ADNI subjects with AD. It can be observed that the longitudinal changes over time are moreobvious for the constructed atlases from the AD subjects.
1282 S. Liao et al. / NeuroImage 59 (2012) 1275–1289
range closest to the age of the constructed atlas) are consistentlysmaller than those obtained from the other two age ranges. It isreflected that the image residuals obtained between the constructed
72 74 76 78 80 82 84 8650
55
60
65
70
75
80
85
90
Age
WM
Ove
rlapp
ing
Rat
io (
in %
)
Proposed MethodDavis
(a)
72 74 76 7850
55
60
65
70
75
80
85
90
Ven
tric
ular
CS
F O
verla
ppin
g R
atio
(in
%)
Fig. 11. Average tissue overlap ratios for: (a) white matter, (b) gray matter, and (c) ventricubars) and the proposed method (blue bars) on the ADNI database.
atlas and the warped subject images scanned at closer ages with theatlas are smaller than those with the warped subject images scannedat further ages with the atlas, which matches with the longitudinal
72 74 76 78 80 82 84 86
Age
50
55
60
65
70
75
80
85
90
GM
Ove
rlapp
ing
Rat
io (
in %
)
Proposed MethodDavis
(b)
80 82 84 86
Age
(c)
Proposed MethodDavis
lar CSF across different ages by using Davis's method (Davis et al., 2007, 2010) (yellow

1283S. Liao et al. / NeuroImage 59 (2012) 1275–1289
time differences. These results demonstrate the effectiveness of theproposed method in longitudinal atlas reconstruction.
Besides constructing the longitudinal atlas sequence for thehealthy subjects, we also perform the longitudinal atlas constructionexperiment on the subjects with the Alzheimer's disease (AD),which exhibit larger longitudinal variations over time than thehealthy subjects. Similar to the experimental settings of the healthysubjects, 20 AD subjects are selected from the ADNI database withthe same baseline time point ranges as the healthy subjects, and thesame preprocessing procedures such as intensity inhomogeneity cor-rection and skull-stripping are also performed on the AD subject im-ages. The longitudinal atlases from ages 72 to 86 with a 2-years timegap between two consecutive time points are constructed for theseADNI subjects and shown in Fig. 10. It can be observed from Fig. 10that the longitudinal changes over time in the constructed AD atlassequence are much more obvious than those from the healthy subjectsequence (i.e., the expansion behavior in the ventricle regions overtime can be clearly observed). Moreover, it can be visually observedthat the constructed atlases are sharp and preserve most of the ana-tomical details.
In this paper, we also quantitatively measure the registration ac-curacy and temporal consistency of the proposed method. All thequantitative experimental results in this section are obtained fromthe 20 normal subjects selected from ADNI, while the 20 AD subjectsselected from ADNI are only used for demonstrating the longitudinalchanges of built atlases. The tissue overlap ratio function proposed in
72 74 76 78 80 82 84 8650
55
60
65
70
75
80
85
90
Age
WM
Ove
rlapp
ing
Rat
io (
in %
)
Proposed MethodDavis
(a)
72 74 76 7850
55
60
65
70
75
80
85
90
Ven
tric
ular
CS
F O
verla
ppin
g R
atio
(in
%)
Fig. 12. Subject-specific mean tissue overlap ratios for: (a) white matter, (b) gray matter, andand the proposed method on the ADNI database.
Crum et al. (2004) is adopted to measure the registration accuracy,which is defined by Eq. (11):
P ¼ A∩Bj jA∪Bj j ; ð11Þ
where A and B denote the regions of a specific type of tissue in twoimages, and |· | denotes the number of voxels inside the region of in-terest. In this paper, since both the proposed method and Davis'smethod do not explicitly select the template image, the segmentationground-truths of the template images (i.e., the atlases constructed atdifferent time points) are obtained by majority voting from all alignedimages by setting the tissue type of each voxel in each template imageas the majority of tissue labels from all aligned images. The averagetissue overlap ratios of WM, GM and ventricular CSF obtained bythe proposed method and Davis's method at different ages areshown in Figs. 11(a) to (c). The tissue overlap ratio at each age iscomputed by the following procedure: First, for each image Stji of sub-ject i taken at the jth time point, it is warped to the atlas space bycomposing the growth model Vi of subject i with the transformationϕi which projects subject i's space to the atlas space (i.e., byEq. (2)). Then, each warped image is further propagated to the ageof interest by the evolution model in the atlas space. Finally, the ma-jority voting scheme is applied to the propagated images at the age ofinterest in the atlas space to obtain the segmentation ground-truth ofthe atlas, and the corresponding tissue overlap ratios are calculated. It
80 82 84 86
Age
(c)
72 74 76 78 80 82 84 86
Age
(b)
50
55
60
65
70
75
80
85
90
GM
Ove
rlapp
ing
Rat
io (
in %
)
Proposed MethodDavis
Proposed MethodDavis
(c) ventricular CSF across different ages with Davis's method (Davis et al., 2007, 2010)

1284 S. Liao et al. / NeuroImage 59 (2012) 1275–1289
can be observed from Figs. 11(a) to (c) that the average tissue overlapratios of different types of tissues obtained by the proposed methodare generally 3% to 5% higher than those obtained by Davis's method,which is a significant improvement as the standard deviations of thetissue overlap ratios of different types of tissues across different agesare no more than 1%.
In this paper, we also measure the registration accuracy of the pro-posed method within each individual subject. More specifically, eachsubject is considered as a group, thus images from the same subjectare from the same group. Since there are 20 normal subjects usedfor the ADNI database, there are 20 separate groups in total. The tis-sue overlap ratio measure expressed in Eq. (11) of different types oftissues across different ages of each group is calculated independent-ly. The calculation procedure is similar to the calculation of the wholepopulation tissue overlap ratios shown in Fig. 11 except that now themajority voting scheme is performed for each group independentlyand the corresponding tissue overlap ratios are calculated from eachgroup. The average tissue overlap ratios of WM, GM and the ventric-ular CSF obtained by different methods across the 20 groups of differ-ent ages are shown in Figs. 12(a) to (c). It can be observed fromFigs. 12(a) to (c) that the subject-specific tissue overlap ratios of dif-ferent types of tissues are higher than those obtained from the wholepopulation as shown in Fig. 11 because the longitudinal changes inthe images of the same subject are much smaller than the shape var-iations between images of different subjects. It can also be observedthat the subject-specific tissue overlap ratios obtained by the pro-posed method are consistently higher than those obtained by using
1 2 3 4 5 6 7 8 9 10 11 12 13 14 15 16 17 18 19 2065
70
75
80
85
90
Subject Index
Ave
rage
of T
C (
in %
)
Proposed MethodDavis
(a)
1 2 3 4 5 6 7 8 9
Sub
65
70
75
80
85
90
Ave
rage
of T
C (
in %
)
Fig. 13. Average temporal consistency (TC) values for different subjects of: (a) white matterand the proposed method on the ADNI database.
Davis's method, which illustrates the superior registration accuracyof the proposed method.
It should be noted that for the task of 4D atlas construction, enfor-cing the temporal consistency among the longitudinal images of eachsubject is also an important requirement besides the high registrationaccuracy. Therefore, in this paper we also measure the temporal con-sistency (TC) factor of different types of tissues for each subject. Theaverage TC factor of each subject is calculated based on Eq. (12)(Xue et al., 2006):
TC ¼ 1jjΩjjΣi∈Ω 1−Li= Y−1ð Þð Þ; ð12Þ
where Ω denotes the regions of interest of a particular tissue type tomeasure the temporal consistency, and ||Ω|| denotes the number ofvoxels in Ω. Li denotes the number of tissue label changes of the cor-responding voxel i across time, and Y denotes the number of longitu-dinal images of the subject. The higher the value of TC, the moreconsistent the temporal consistency is.
The average TC value of WM, GM and ventricular CSF for each sub-ject obtained by using the proposed method and Davis's method areshown in Figs. 13(a) to (c), respectively.
It can be observed from Fig. 13 that the average TC values of differ-ent types of tissue for each subject obtained by the proposed methodare consistently higher than those obtained by Davis's method (Daviset al., 2007, 2010). The main reason for the higher TC values obtainedby using the proposed method than using Davis's method is that the
10 11 12 13 14 15 16 17 18 19 20
ject Index
(c)
1 2 3 4 5 6 7 8 9 10 11 12 13 14 15 16 17 18 19 20
Subject Index
(b)
65
70
75
80
85
90
Ave
rage
of T
C (
in %
)
Proposed MethodDavis
Proposed MethodDavis
, (b) gray matter, and (c) ventricular CSF with Davis's method (Davis et al., 2007, 2010)

72 74 76 78 80 82 84 864
4.1
4.2
4.3
4.4
4.5
4.6
4.7
4.8
4.9 x 105 x 104
Ages
GM
Vol
ume
Proposed MethodDavis
(a)
72 74 76 78 80 82 84 86
Ages
(b)
1.4
1.6
1.8
2
2.2
2.4
2.6
2.8
Ven
tric
ular
CS
F V
olum
e
Proposed MethodDavis
Fig. 14. Longitudinal changes with respect to the (a) GM volume and (b) ventricular CSF volume over time by using Davis et al. (2007, 2010) method and the proposed method onthe ADNI database.
Fig. 15. Images shown in the first row are taken from the same subject from age 68 to age 75. Significant longitudinal changes can be observed. Images shown in the second row aretaken from different subjects, which reflect the large structural variations across different subjects in the dataset.
1285S. Liao et al. / NeuroImage 59 (2012) 1275–1289
subject-specific longitudinal information is considered by establish-ing the subject-specific growth model in the proposed method,while in Davis's method the atlas is constructed by performing re-gression over the temporal domain on all the images without consid-ering the subject-specific longitudinal information. Therefore, theproposed method can achieve higher temporal consistency thanDavis's method.
Age=68 70
76 78
Fig. 16. The same cross-sectional images obtained from the atlases constructed by the propothe ventricle region is captured.
In order to quantitatively analyze the effectiveness of the pro-posed method with respect to the characterization of brain develop-ment, Figs. 14(a) and (b) show the progression of the gray matter(GM) and ventricular CSF tissue volumes over time, respectively, forboth Davis's method and the proposed method on the ADNI database.It can be observed from Fig. 14 that both methods can capture the ex-pansion behavior of the ventricular CSF volume over time as such
72 74
80 82
sed method at different ages on the BLSA database. The obvious expansion behavior of

Fig. 17. 3D rendering of the atlas of age 80 constructed by: (a) the method proposed by Davis et al. (2007, 2010) and (b) the proposed method on the BLSA database. Significantdifferences are highlighted with the green circles.
1286 S. Liao et al. / NeuroImage 59 (2012) 1275–1289
changes are quite obvious. However, regarding to the GM volumechanges over time, it is demonstrated that the proposed methodachieves more consistent and steady decrease behavior of the GMvolume over time for the constructed atlas sequence, which is consis-tent with those reported in the literature. On the other hand, it is ob-served that the longitudinal changes with respect to the GM volumefor Davis's method are not smooth and stable over time as nosubject-specific longitudinal information is considered in Davis'smethod.
68 70 72 74 76 78 80 8250
55
60
65
70
75
80
85
90
Age
WM
Ove
rlapp
ing
Rat
io (
in %
)
Proposed MethodDavis
(a)
68 70 72 750
55
60
65
70
75
80
85
90
Ven
tric
ular
CS
F O
verla
ppin
g R
atio
(in
%)
Fig. 18. Average tissue overlap ratios for: (a) white matter, (b) gray matter, and (c) ventricularand the proposed method (blue bars) on the BLSA database.
Experimental results on the BLSA database
Besides evaluating the proposed method on the ADNI database inSection , in this section we also evaluate the proposed method on amore challenging database, namely the BLSA longitudinal database(Resnick et al., 2000).
The task of 4D atlas construction in the BLSA database is morechallenging than in the ADNI database because in the BLSA databaseeach subject has much more longitudinal images than in the ADNI
68 70 72 74 76 78 80 82
Age
(b)
4 76 78 80 82
Age
(c)
50
55
60
65
70
75
80
85
90
GM
Ove
rlapp
ing
Rat
io (
in %
)
Proposed MethodDavis
Proposed MethodDavis
CSF across different ages by using Davis's method (Davis et al., 2007, 2010) (yellow bars)

68 70 72 74 76 78 80 8250
55
60
65
70
75
80
85
90
Age
WM
Ove
rlapp
ing
Rat
io (
in %
)
Proposed MethodDavis
(a)
68 70 72 74 76 78 80 82
Age
(b)
68 70 72 74 76 78 80 82
Age
(c)
50
55
60
65
70
75
80
85
90
GM
Ove
rlapp
ing
Rat
io (
in %
)
Proposed MethodDavis
50
55
60
65
70
75
80
85
90V
entr
icul
ar C
SF
Ove
rlapp
ing
Rat
io(in
%)
Proposed MethodDavis
Fig. 19. Subject-specific mean tissue overlap ratios for: (a) white matter, (b) gray matter, and (c) ventricular CSF across different ages with Davis's method (Davis et al., 2007, 2010)and the proposed method on the BLSA database.
1287S. Liao et al. / NeuroImage 59 (2012) 1275–1289
database. Moreover, the longitudinal changes within each subject inthe BLSA database are generally larger than those in the ADNI data-base. In this paper, 20 subjects are selected from the BLSA databaseto evaluate the performance of the proposed method. Each subjecthas around ten longitudinal images taken at different time points,and the period between two consecutive time points is around1 year. Each image has resolution 256×256×124, with voxel size0.9375mm×0.9375mm×1.5mm. The age at which the first timepoint image is taken for each subject ranges from 66 to 85 of the 20selected subjects.
The first row shown in Fig. 15 illustrates longitudinal images of thesame subject taken from ages 68 to 75, and obvious longitudinalchanges can be observed (i.e., the expansion of the ventricle region).The second row in Fig. 15 shows images taken from different subjects,and large inter-subject shape variations can be observed across differ-ent subjects in the BLSA database.
In this paper, we evaluate the performance of the proposed meth-od by constructing 4D atlases at ages 68, 70, 72, 74, 76, 78, 80 and 82for the BLSA database. A smaller kernel bandwidth is adopted for theBLSA database than in the ADNI database as there are more longitudi-nal images for each subject. The bandwidth of the Gaussian kernel inEq. (1) is set to σ=1 year for the BLSA database. The constructedatlases at different ages by using the proposed method are shown inFig. 16. It can be observed from Fig. 16 that the constructed atlasesby using the proposed method are sharp and preserve many anatom-ical details. It can also be observed from Fig. 16 that the longitudinalexpansion behavior in the ventricle region of the constructed atlasesis captured.
To visually illustrate the registration accuracy of the proposedmethod, Figs. 17(a) and (b) show the 3D rendering of the constructedatlases by using Davis's method and the proposed method, respec-tively, at age 80 on the BLSA database. It can be observed that theatlas constructed by the proposed method is sharper and preservesmore anatomical details than the one constructed by using Davis's
method, which implies the superior registration accuracy of the pro-posed method. Significant differences between Figs. 17(a) and (b)are highlighted with green circles.
We also quantitatively evaluate the registration accuracy of theproposed method. Similar to Section , the tissue overlap ratios mea-sure expressed in Eq. (11) is adopted to evaluate the registration ac-curacies of different approaches. The overlap ratios of WM, GM, andventricular CSF at different ages obtained by the proposed methodand Davis's method are shown in Fig. 18. Following the same trendin Section with respect to the results obtained on the ADNI database,it can be observed from Fig. 18 that the tissue overlap ratios of differ-ent types of tissue obtained by the proposed method are consistentlyhigher than those obtained by Davis's method. Therefore, the superiorregistration accuracy of the proposed method is strongly implied.
Moreover, the subject-specific registration accuracy is also evalu-ated on the BLSA database. Similar to Section , each subject is treatedas a separated group, and the tissue overlap ratios expressed inEq. (11) for different types of tissue are calculated for each group.Since there are 20 subjects used in the BLSA database, there are intotal 20 groups. The average subject-specific based tissue overlap ra-tios of different types of tissue are given in Fig. 19. Similar to Section ,it can be observed from Fig. 19 that the average subject-specific basedtissue overlap ratios of different types of tissue are higher than thoseobtained from the whole population as illustrated in Fig. 18. The rea-son is that the anatomical changes due to the longitudinal changeswithin each subject are much smaller than the inter-subject shapevariations. Also, it can be observed from Fig. 19 that the tissue overlapratios obtained by the proposed method are consistently higher thanthose obtained by Davis's method, which illustrates the superior reg-istration accuracy of the proposed method.
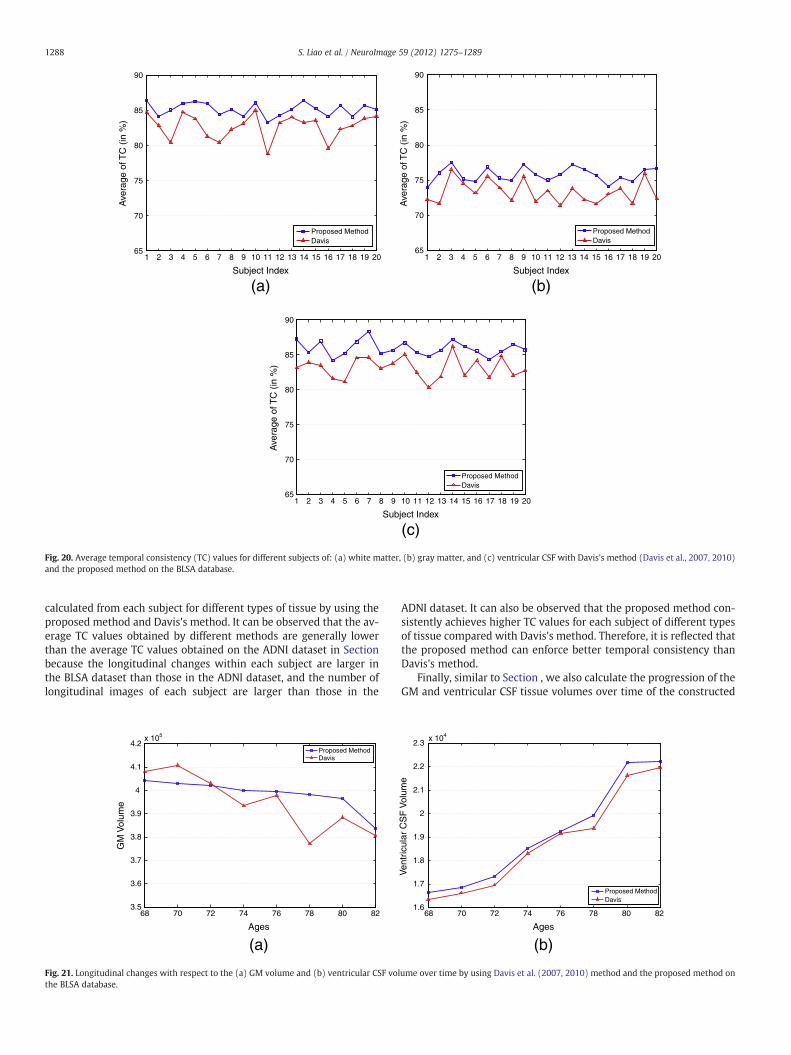
We also measure the temporal consistency enforced to each sub-ject of the proposed method. The average temporal consistency (TC)factor expressed in Eq. (12) is adopted as the temporal consistencymeasure similar to Section , and Fig. 20 shows the average TC value
1 2 3 4 5 6 7 8 9 10 11 12 13 14 15 16 17 18 19 2065
70
75
80
85
90
Subject Index
Ave
rage
of T
C (
in %
)
Proposed MethodDavis
(a)
1 2 3 4 5 6 7 8 9 10 11 12 13 14 15 16 17 18 19 20
Subject Index
(c)
1 2 3 4 5 6 7 8 9 10 11 12 13 14 15 16 17 18 19 20
Subject Index
(b)
65
70
75
80
85
90
Ave
rage
of T
C (
in %
)
Proposed MethodDavis
65
70
75
80
85
90
Ave
rage
of T
C (
in %
)
Proposed MethodDavis
Fig. 20. Average temporal consistency (TC) values for different subjects of: (a) white matter, (b) gray matter, and (c) ventricular CSF with Davis's method (Davis et al., 2007, 2010)and the proposed method on the BLSA database.
1288 S. Liao et al. / NeuroImage 59 (2012) 1275–1289
calculated from each subject for different types of tissue by using theproposed method and Davis's method. It can be observed that the av-erage TC values obtained by different methods are generally lowerthan the average TC values obtained on the ADNI dataset in Sectionbecause the longitudinal changes within each subject are larger inthe BLSA dataset than those in the ADNI dataset, and the number oflongitudinal images of each subject are larger than those in the
68 70 72 74 76 78 80 823.5
3.6
3.7
3.8
3.9
4
4.1
4.2
Ages
GM
Vol
ume
Proposed MethodDavis
(a)
x 105
Fig. 21. Longitudinal changes with respect to the (a) GM volume and (b) ventricular CSF volthe BLSA database.
ADNI dataset. It can also be observed that the proposed method con-sistently achieves higher TC values for each subject of different typesof tissue compared with Davis's method. Therefore, it is reflected thatthe proposed method can enforce better temporal consistency thanDavis's method.
Finally, similar to Section , we also calculate the progression of theGM and ventricular CSF tissue volumes over time of the constructed
68 70 72 74 76 78 80 82
Ages
(b)
1.6
1.7
1.8
1.9
2
2.1
2.2
2.3
Ven
tric
ular
CS
F V
olum
e
Proposed MethodDavis
x 104
ume over time by using Davis et al. (2007, 2010) method and the proposed method on

1289S. Liao et al. / NeuroImage 59 (2012) 1275–1289
atlas sequence by using Davis's method and the proposed method.Figs. 21(a) and (b) show the GM and ventricular CSF tissue volumesat each age, respectively, by using both methods. It can be observedthat both methods capture the expansion behavior of the ventricularCSF volumes over time. However, for the longitudinal changes of theGM volume, the proposed method again achieves more consistentand steady decreasing behavior, which matches with the literatureobservations. On the other hand, the longitudinal changes of the GMvolume over time obtained by Davis's method are not smooth andstable as there is no subject-specific longitudinal information consid-ered in Davis's method.
Conclusion
In this paper, a novel framework for longitudinal atlas construc-tion is proposed. The proposed framework considered both thesubject-specific longitudinal information and the global populationinformation. The subject-specific longitudinal information is consid-ered by constructing the growth model for each subject by usingthe 4D HAMMER registration approach. Based on the built growthmodel of each subject, the longitudinal information contained ineach subject can be propagated to any time point in the subjectspace. The global population information is captured by performinggroupwise registration among all the subject image sequences andonly one transformation is required for each subject to project thesubject image sequence to the atlas space. Moreover, the constructedatlases are unbiased since no explicit template sequence is selected.The temporal consistency in the atlas space is enforced by jointly es-timating the atlases at different time points by the regression process.The proposed method is evaluated on two longitudinal databases: theADNI and BLSA databases to construct longitudinal atlas sequence forelderly subjects, and it is compared with a state-of-the-art 4D atlasconstruction method proposed by Davis et al.. Experimental resultsdemonstrate that the proposed method consistently achieves higherregistration accuracies and better temporal consistency than Davis'smethod, which reflects the superior performance of the proposedmethod. Future work includes extending the proposed frameworkto construct 4D infant atlas sequence.
Acknowledgment
This work was supported in part by NIH grants EB006733,EB008374, EB009634 and MH088520. The BLSA dataset used in thispaper was provided by Dr. Susan Resnick and Dr. Christos Davatzikos.
Data collection and sharing for this project was funded by theAlzheimer's Disease Neuroimaging Initiative (ADNI) (National Institutesof Health Grant U01 AG024904). ADNI is funded by the National Insti-tute on Aging, the National Institute of Biomedical Imaging and Bioengi-neering, and through generous contributions from the following: Abbott,AstraZeneca AB, Bayer Schering Pharma AG, Bristol-Myers Squibb, EisaiGlobal Clinical Development, ElanCorporation, Genentech,GEHealthcare,GlaxoSmithKline, Innogenetics, Johnson and Johnson, Eli Lilly and Co.,Medpace, Inc., Merck and Co., Inc., Novartis AG, Pfizer Inc, F. Hoffman-LaRoche, Schering-Plough, Synarc, Inc., as well as non-profit partners theAlzheimer's Association and Alzheimer's Drug Discovery Foundation,with participation from the U.S. Food and Drug Administration. Privatesector contributions to ADNI are facilitated by the Foundation for the Na-
tional Institutes of Health (www.fnih.org). The grantee organization is theNorthern California Institute for Research and Education, and the study iscoordinated by the Alzheimer's Disease Cooperative Study at the Univer-sity of California, SanDiego. ADNI data are disseminated by the Laboratoryfor Neuro Imaging at the University of California, Los Angeles. This re-search was also supported by NIH grants P30 AG010129, K01AG030514, and the Dana Foundation.
References
Beg, M., Miller, M., Trouve, A., Younes, L., 2005. Computing large deformation metricmappings via geodesic flows of diffeomorphisms. Int. J. Comput. Vis. 61, 139–157.
Cardenas, V., Studholme, C., Gazdzinski, S., Durazzo, T., Meyerhoff, D., 2007. Deforma-tion-based morphometry of brain changes in alcohol dependence and abstinence.Neuroimage 34, 879–887.
Crum, W., Rueckert, D., Jenkinson, M., Kennedy, D., Smith, S., 2004. A framework for de-tailed objective comparison of non-rigid registration algorithms in neuroimaging.Medical image computing and computer assisted intervention, pp. 679–686.
Davis, B., Fletcher, P., Bullitt, E., Joshi, S., 2007. Population shape regression from ran-dom design data. International Conference on Computer Vision, pp. 1–7.
Davis, B., Fletcher, P., Bullitt, E., Joshi, S., 2010. Population shape regression from ran-dom design data. Int. J. Comput. Vis. 90, 255–266.
Dupuis, P., Grenander, U., 1998. Variational problems on flows of diffeomorphisms forimage matching. Q. Appl. Math. 3, 587–600.
Durrleman, S., Pennec, X., Trouve, A., Thompson, P., Ayache, N., 2008. Inferring brainvariability from diffeomorphic deformations of currents: an integrative approach.Med. Image Anal. 12, 626–637.
Durrleman, S., Pennec, X., Gerig, G., Trouve, A., Ayache, N., 2009. Spatiotemporal atlasestimation for developmental delay detection in longitudinal datasets. MICCAI,pp. 297–304.
Fox, N., Jenkins, R., Leary, S., Stevenson, V., Losseff, N., Crum, W., Harvey, R., Rossor, M.,Miller, D., Thompson, A., 2000. Progressive cerebral atrophy in ms: a serial studyusing registered, volumetric mri. Neurology 54, 807–812.
Hart, G., Shi, Y., Zhu, H., Sanchez, M., Styner, M., Niethammer, M., 2010. DTI Longitu-dinal Atlas Construction as an Average of Growth Models, MICCAI 2010 Work-Shop on Spatio-Temporal Image Analysis for Longitudinal and Time-SeriesImage Data.
Freeborough, P., Fox, N., 1997. The boundary shift integral: an accurate and robustmeasure of cerebral volume changes from registered repeat mri. IEEE Trans. Med.Imaging 16, 623–629.
Joshi, S., Miller, M., 2000. Landmark matching via large deformation diffeomorphisms.IEEE Trans. Image Process. 9, 1357–1370.
Joshi, S., Davis, B., Jomier, M., Gerig, G., 2004. Unbiased diffeomorphic atlas constructionfor computational anatomy. Neuroimage 23, 151–160.
Miller, M., 2004. Computational anatomy: shape, growth, and atrophy comparison viadiffeomorphisms. Neuroimage 23, 19–33.
Miller, M., Younes, L., 2001. Group actions, homeomorphisms, and matching: a generalframework. Int. J. Comput. Vis. 41, 61–84.
Miller, M., Trouve, A., Younes, L., 2002. On the metrics and Euler–Lagrange equations ofcomputational anatomy. Annu. Rev. Biomed. Eng. 4, 375–405.
Resnick, S., Goldszal, A., Davatzikos, C., Golski, S., Kraut, M.A., Metter, E., Bryan, R., Zon-derman, A., 2000. One-year age changes in mri brain volumes in older adults.Cereb. Cortex 10, 464–472.
Sabuncu, R., Balci, K., Shenton, E., Golland, P., 2009. Image-driven population analysisthrough mixture modeling. IEEE Trans. Med. Imaging 28, 1473–1487.
Shattuck, D., Sandor-Leahy, S., Schaper, K., Rottenberg, D., Leahy, R., 2001. Magneticresonance image tissue classification using a partial volume model. Neuroimage13, 856–876.
Shen, D., Davatzikos, C., 2004. Measuring temporal morphological changes robustly inbrain MR images via 4-dimensional template warping. Neuroimage 21,1508–1517.
Sled, J., Zijdenbos, A., Evans, A., 1998. A nonparametric method for automatic correc-tion of intensity nonuniformity in mri data. IEEE Trans. Med. Imaging 17, 87–97.
Smith, S., 2002. Fast robust automated brain extraction. Hum. Brain Mapp. 17,143–155.
Vaillant, M., Glaunes, J., 2005. Surface matching via currents. Information Processing inMedical Imaging, pp. 381–392.
Xue, Z., Shen, D., Davatzikos, C., 2006. Classic: consistent longitudinal alignment andsegmentation for serial image computing. Neuroimage 30, 388–399.
Zhang, Y., Brady, M., Smith, S., 2001. Segmentation of brain MR images through a hid-den Markov random field model and the expectation maximization algorithm.IEEE Trans. Med. Imaging 20, 45–57.