a novel high efficiency fine particulate and mercury
TRANSCRIPT
A NOVEL HIGH EFFICIENCY FINE PARTICULATE AND MERCURY CONTROL DEVICE
Final Report for the Department of Energy Contract Number DE-FG02-95ER81968
Environmental Elemen
This Phase Ii SBlR program was conducted to demonstra bed (CFB) of flyash to cause particle agglomeration and co of fine particulate emissions from the system. Another objective was to show that carbon addition to the bed would result in the removal of mercury compounds from the flue gas at carbon utilization levels significantly better than duct injection of activated carbon.
eduction in the quantity
The pilot scale testing was carried out at Public Service Electric and Gas' Mercer Generating Station in 1997. The pilot scale fluid bed reactor was a 1000 CFM system, drawing gas from a slipstream of the exhaust of a 325 MW coal-fired boiler, Mercer Station Unit #2. Flue gas for the pilot unit was drawn downstream of the Unit #2 air preheater and was returned to the same location after passing through the pilot unit.
Particle agglomeration testing was carried out for which the parameters of gas flow rate and water evaporation rate were varied and the particle size distribution leaving the fluid bed system was monitored. It was found that the bed was able to cause a reduction in total particulate concentration by a factor of 10 and in fine particulate concentration by a factor of 5, and it was found that the best agglomeration of particles was obtained with simultaneous water spray evaporation.
A series of tests were then carried out in which activated carbon was added to the fluid bed for mercury adsorption. Carbon addition in the bed was shown to yield both higher mercury removal and higher carbon utilization than normal carbon addition without the bed. The fluid bed fly ash alone, without the injection of activated carbon, will capture 50% of the inlet mercury vapor. A total of 80% removal of mercury vapor is achieved with the addition to the bed of 1000 gm iodine impregnated activated carbon per gm of inlet mercury.
The ability of the fluid bed to capture SO2 and HCI was also evaluated, using hydrated lime added to the bed. It was found that the fluid bed alone, without lime injection, removes 16% of the S02. Complete utilization of hydrated lime is achieved for SO2 removal at mole ratios up to 0.66, and concomitant to the SO2 removal, over 90% of the HCI was removed.
Sulfur dioxide control by a CFB is already a competitive, commercial system. Adding mercury adsorption capability to the CFB system has been shown to result in a significantly lower levelized cost for mercury control than that for duct injection of activated carbon, with or without gas cooling. The improvement of fine particle capture is a benefit of the CFB obtained at no additional cost. It is clear that this multipollutant control device can address both PM25 issues, as well as potential mercury vapor emission regulations.

DISCLAIMER
This report was prepared as an account of work sponsored by an agency of the United States Government. Neither the United States Government nor any agency Thereof, nor any of their employees, makes any warranty, express or implied, or assumes any legal liability or responsibility for the accuracy, completeness, or usefulness of any information, apparatus, product, or process disclosed, or represents that its use would not infringe privately owned rights. Reference herein to any specific commercial product, process, or service by trade name, trademark, manufacturer, or otherwise does not necessarily constitute or imply its endorsement, recommendation, or favoring by the United States Government or any agency thereof. The views and opinions of authors expressed herein do not necessarily state or reflect those of the United States Government or any agency thereof.

DISCLAIMER Portions of this document may be illegible in electronic image products. Images are produced from the best available original document.
i k ..
Table of Contents
Subject
1. Introduction
2. Activated Carbon Evaluation
3. Pilot System Arrangement
4. Operational Parameters
5. Test Results 5.1. Particle Agglomeration 5.2. Mercury Adsorption 5.3. Acid Gases
6. Economic Cons id e rat ions
7. Conclusions
8. Acknowledgements
9. References
Appendices
Page
1
4
7
10
13
14 18 20
22
23
24
24
25

Tables
Table Page
1. Proximate Analysis
2. Ultimate Analysis
3. Ash Analysis
4. Pilot System Inlet Conditions
5. FBR System Material Balance Calculation
6. Comparative Economics for Mercury Control
10 10
10
10 13 22
Figures
Figure Page
1. Agglomeration Efficiency vs. Bed Density
2. Minutes to 50% Mercury Breakthrough
3. Activated Carbon Comparisons
4. System Arrangement
5. Pilot System Photo
6. Precipitator clean surface current-voltage curves
7. Pilot System Instrumentation
8. Inlet Fly Ash Particle Size Distribution 9. The Affect of Fluid Bed Density on Pressure Drop
IO. Typical Material Balance
11. The Effect of Evaporative Cooling at 1000 CFM
12. The Effect of Evaporative Cooling at 500 CFM
13. The Effect of ADA Additive Injection at 1000 CFM
14. Particle Penetration after Flow Improvements at 1000 CFM
15. Particle Penetration after Flow Improvements at 500 CFM
16. Batch Addition of Activated Carbon
17. Injection of Iodine impregnated Activated Carbon
18. Injection of Non-impregnated Activated Carbon
19. SO2 and HCI Removal by Hydrated Lime
2
4
5
7 7 8
9 12 12
14
15 16
16 17 17 18
19 20 21
... Ill

1. Introduction
Utilities are faced with economic challenges to remain competitive as a result of the ongoing movement to allow the transmission of low cost electricity across state lines. In addition, environmental pressures are forcing most of these utilities to be prepared to reduce the air emissions such as NOx, SOX, fine particulates and mercury from coal- burning plants. The new PM2.5 regulations will require improved fine particle control from existing equipment, and potential mercury vapor regulations may impose the installation of new control equipment. A fluid bed of ash particles containing some activated carbon can address both of these challenges.
The fact that a bed of particles will cause the a glomeration of smaller particles through collisional processes has been demonstrated." Small particles, traveling at high velocity through a fluid bed composed of almost stationery larger particles will impact with these particles, forming agglomerates of small particles attached to larger target particles. The resulting larger agglomerates are then more readily captured by conventional means. This can be illustrated by considering the passage of 0.1 pm particles through a bed of 5 pm stationery particles. Figure 1 shows that the efficiency of collision between the 0.1 and the 5 pm particles increases as the bed density increases. The efficiency of agglomeration also depends upon whether collided particles to stick together, and this effect is shown by the influence of increasing cohesion, One principal objective of the work described here is a demonstration of this effect, using a circulating fluid bed device to improve the fine particle collection capability of a conventional electrostatic precipitator.
It is also known that activated carbon adsorbs both elemental and ionic mercury, typically found in flue gas in vapor form. Demonstrations of this phenomenon using fixed beds of carbon and by means of the injection of powdered carbon into the duct have been performed.334v5 demonstration of good mercury adsorption by powdered carbon within and part of the circulating fluid bed.
The second objective of this work is therefore the
I

00
Figure 1. Agglomeration Efficiency vs. Bed Density
A successful demonstration of both of these objectives would define a control device for combined fine particulate and mercury control and would suggest that a commercial product could be constructed from systems that are already in full scale use for acid gas absorption. These experiments, using a pilot scale version of a commercial fluid bed contactor for sulfur dioxide and hydrogen chloride control, were designed to accomplish this task.
Environmental Elements carried out Phase I laboratory and Phase I 1 pilot scale testing of this concept in a Department of Energy SBlR program in 1995 - 1997. A laboratory scale (200 CFM) system used heated air and injected solids to demonstrate the principle. The laboratory work was previously described in the Phase I Final Report and in reference 6, and the conclusions of this work are repeated here as a preface to the Phase II results. The conclusions of the Phase I effort were:
and can result in an order of magnitude decrease in the exit concentration of fine particles. The number density of particles smaller than 1 micron, as measured at the precipitator exit, decrease by an order of magnitude following the action of the circulating bed, while keeping the precipitator voltage constant.
It was shown that increasing the bed density increases fine particle agglomeration
It was demonstrated that low temperatures and high relative humidity enhance fine particulate agglomeration through cohesivity enhancement, and even greater reduction of fine particle emissions would have been possible through higher voltage operation of the precipitator, which the low temperature, high humidity conditions allow.
2

e The flyash bed itself accounted for about 50% reduction of an inlet concentration of 50 pgm/m3 of elemental mercury vapor at 230°F. A single injection of iodine- impregnated activated carbon, equaling about 1% of the bed weight, was shown to then adsorb virtually all of the remaining mercury for longer than two hours, representing a carbon capacity for mercury of about 770 gm carbon/ gm mercury
The Phase II pilot scale fluid bed reactor was constructed to expand upon these results and to demonstrate that similar results can be obtained at larger scale. The 1000 CFM system drew gas from a slipstream of the exhaust of a 325 MW coal-fired boiler, unit #2, at PSE&G's Mercer Station. The pilot unit employed a circulating fluid bed composed of fly ash particles in order to achieve a high particle density within the device, promoting the agglomeration of these particles. A water spray within the fluid bed increases the cohesivity of the particulate, also enhancing agglomeration. The fine particles entering the system form larger agglomerates, which are then readily captured by an electrostatic precipitator. The precipitator returned these agglomerates to the bed such that the bed density remained constant. Activated carbon and/or lime were injected into the circulating bed in order to adsorb mercury vapor and/or absorb SO2 and HCI. High residence time, due to the recirculation, allowed very effective utilization of the carbon and lime. Water spray within the circulating bed promoted the cohesive forces of agglomeration as well as promoted mercury adsorption and SO*/HCI absorption.
3
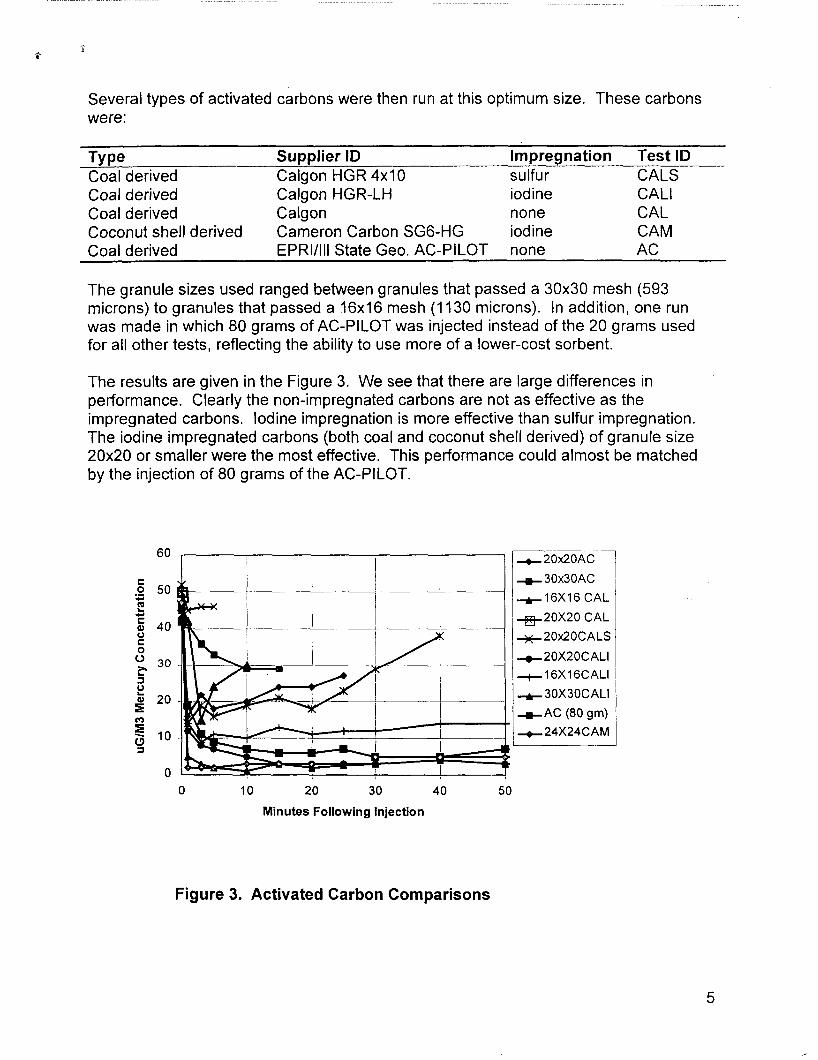
Several types of activated carbons were then run at this optimum size. These carbons were:
Type Supplier ID Impregnation Test ID Coal derived Calgon HGR 4x1 0 sulfur CALS Coal derived Calgon HGR-LH iodine CALI Coal derived Calgon none CAL Coconut shell derived Cameron Carbon SG6-HG iodine CAM Coal derived EPRI/III State Geo. AC-PILOT none AC
The granule sizes used ranged between granules that passed a 30x30 mesh (593 microns) to granules that passed a 16x16 mesh (1 130 microns). In addition, one run was made in which 80 grams of AC-PILOT was injected instead of the 20 grams used for all other tests, reflecting the ability to use more of a lower-cost sorbent.
The results are given in the Figure 3. We see that there are large differences in performance. Clearly the non-impregnated carbons are not as effective as the impregnated carbons. Iodine impregnation is more effective than sulfur impregnation. The iodine impregnated carbons (both coal and coconut shell derived) of granule size 20x20 or smaller were the most effective. This performance could almost be matched by the injection of 80 grams of the AC-PILOT.
C 0 .- U
C E C 0, 0 C 0 0
60
50
40
30
20
10
0
+ 2Ox20AC + 30~30AC
0 10 20 30 40 50
Minutes Following Injection
-
+ 16x1 6 CAL +j20X20 CAL +2Ox20CALS +20X20CALI +16X16CALI + 30X30CALI
+AC (80 gm) -24X24CAM
i
Figure 3. Activated Carbon Comparisons
5

These tests considered only the adsorption of elemental mercury in air and are not necessarily representative carbon behavior for other forms of mercury in a flue gas atmosphere. Also, a fixed temperature (230' F) was used, and the carbon ranking at other temperatures may change.
Based upon these results, it was decided to use the Calgon iodine impregnated activated carbon as an expensive but very effective carbon and to use the non- impregnated Calgon as an inexpensive but less effective carbon in the operation at Mercer Station.
6

3. Pilot System Arrangement
The pilot system was erected at Mercer Station during the Summer of 1997. The general arrangement of the fluid bed reactor system in relation to Mercer station is shown in Figure 4, and a photograph is shown in Figure 5. The slipstream of gas for the pilot unit is drawn downstream of the Unit #2 air preheater and is returned to the same location after passing through the pilot unit. The Mercer Station boiler is a pulverized coal-fired unit of 320 MW capacity. It burns Eastern, low sulfur, bituminous coal with heating value of 14,000 Btu/lb and sulfur content below 1%. Mercury in coal varies between 0.05 ppm and 0.1 1 ppm by weight.
Gas is drawn from the plant duct downstream of the air heater through approximately 100' of ten inch diameter, insulated duct. When used, activated carbon and lime are injected into this duct. The gas then enters the fluid bed reactor, consisting of a tube, 30' long and 24" in diameter, with a venturi section at the bottom to prevent bed collapse. A water spray nozzle is located in the reactor just downstream of the venturi. The gas exits the fluid bed reactor at the top and enters a twelve-tube electrostatic precipitator,
Figure 4. System Arrangement Figure 5. Pilot System Photo
7

i i
designed such that the flow velocity and electric field strength give it collection performance similar to the first collection field of a full scale precipitator. All of the particles collected by this tubular precipitator are returned to the fluid bed. The flow and particles not collected by this precipitator then enter a single passage, plate type pilot precipitator, where final removal of the finest particles and agglomerates takes place. The gas is then returned to the station duct near the initial take-off point.
Appendix I gives a detailed system/process schematic of the pilot unit. All ductwork and vessels were insulated with 3" of glasswool. Additionally, the vessels were maintained at high temperature with resistance heaters. Rappers were used to clean the discharge and collecting electrodes of the tube and plate precipitators. The ash that was rapped from the plate precipitator was air-transported into the return duct to a point downstream of instrumentation, and subsequently returned to the Mercer Station system.
The tube precipitator consisted of 12, ten inch diameter tubes, each with a central discharge wire. The total collecting surface area of the tube precipitator was 250 sq. ft. The plate precipitator consisted of three, single channel, sections in series. The collecting plates were separated by 12 inches, with a central discharge electrode. The total collecting surface area of this precipitator was 180 sq. ft. The tube-type precipitator and the plate precipitator each had an individual power supply, and the clean plate current voltage characteristics are given by Figure 6.
I I !
100 -
80 I , !
1 1 1 I -+Tube ESP
40
20
0
I I
I
0 10 20 30 40 50 60 Kilovolts
Figure 6. Precipitator Clean Surface Current-Voltage Curves
Analytic instrumentation included an lnsitec particle size analyzer, Anderson particle size impactors, ASME total particulate filters, a Method 101 mercury concentration
8

measurement, and concentration measurements of SO2 and HCI by solvent absorption in impinger trains. Periodic data taken includes temperatures by thermocouple, total flow by orifice meter, water spray flow by rotameter, chemical feed rates, and pressure drops. An instrumentation diagram (Figure 7) shows the locations of the test ports and instrumentation. The lnsitec analyzer was permanently located at SP4, and the Anderson impactor was used at points SPI, SP2, and SP3.
Gash
DP1
TC2
Fluid Bed
TC4 TC3
TC = them~~up le SP = sanpiiq port DP =differential presswe
Figure 7. Pilot System Instrumentation
9

4. 0 pe ra tion a I Parameters
% Moisture YO Carbon
The Mercer Station Unit #2 burns a low sulfur, Eastern bituminous coal, 14,186 Btullb, having proximate and ultimate analyses given below in Tables 1 and 2. The characteristics of the fly ash and inlet stream conditions to the pilot system are given in Tables 3 and 4:
5.80 82.57
% Moisture % Ash
5.80 4.06
I Table 2. Ultimate Analvsis 1
% Volatile YO Fixed Carbon
17.70 72.44
% Hydrogen % Nitroaen
Table 3. Ash Analysis SDecie I % of Total
3.21 1.31
N&O
CaO 7.20 Fe203 15.63
TemPerature. dearee F. 240
I % Sulfur 10.73 I
Particle Concentration, gr./CF SO:, Concentration, m m
I %Ash 14.06 I
1.5 300
I % Oxygen 12.32 I
HCI Concentration, ppm Mercury Concentration, pgm/m
50 1.5
A1203 Si02
27.26 39.75
The inlet temperature, at 240 degree F., is lower than normally encountered and limits the amount of water that can be evaporated by the pilot system spray. The mercury concentration at 1.5 pgm/m3 is also lower than generally encountered.
The system was operated continuously to maintain temperature, but testing was carried out on a daily basis. Typical daily operation consisted of: (a) setting flow rate and temperature, (b) measuring inlet concentrations, (c) measuring outlet concentrations in the absence of bed material, (d) adding bed material - generally 30 pounds of fly ash, (e) measuring outlet concentrations in the presence of the bed. Typical system inlet conditions were 240' F, a fly ash concentration of 1.5 gr./CF, an SO2 concentration of 300 ppm, an HCI concentration of 50 ppm, and an Hg concentration of 1.5 pgm/m3, as shown in Table 4.
The particle size distribution at the pilot system inlet, as measured by Anderson Impactor and by lnsitec optical particle counter, is given by Figure 8. Anderson impactor samples were taken at the system inlet, while the lnsitec counter was applied at the system outlet, in this case with no fluid bed and with the precipitators turned off.
10

Flow rate had little effect on the inlet size distribution as can be seen in the comparison between the impactor runs carried out at 500 and 1000 CFM system flows. The lnsitec instrument covers a much larger range of particle size, as seen in Figure 8. The size distribution given by the lnsitec shows a smaller mass mean diameter, which implies some drop out of larger particles in passage through the deactivated pilot equipment.
A key indicator of the circulating bed concentration was the pressure drop across the reactor containing the bed. The relationship between the bed density, measured by ASME thimble at point SP2, and pressure drop is shown in Figure 9 for a flow of 1000 CFM. The pressure drop fluctuated because the bed density varied significantly between electrode raps in the tube ESP. Figure 9 shows that tube rapping yields about a 0.3" pressure drop increase across the bed due to its increased ash concentration after the rap.
Documentation of the pilot system start-up procedure is attached as Appendix II.
11

Figure 8. Inlet fly ash particle size distribution
1.4 0 g 1.2
6 1 2 0 0.8 L 3 0.6
2 0.4 n a 0.2
v) v)
z o
i , ~
I I i 0 I
I--; I --- I _I I
+ 0 100 200 300 400
Circulating Load, GrlCF
I
Figure 9. The Affect of Fluid Bed Density on Pressure Drop
12

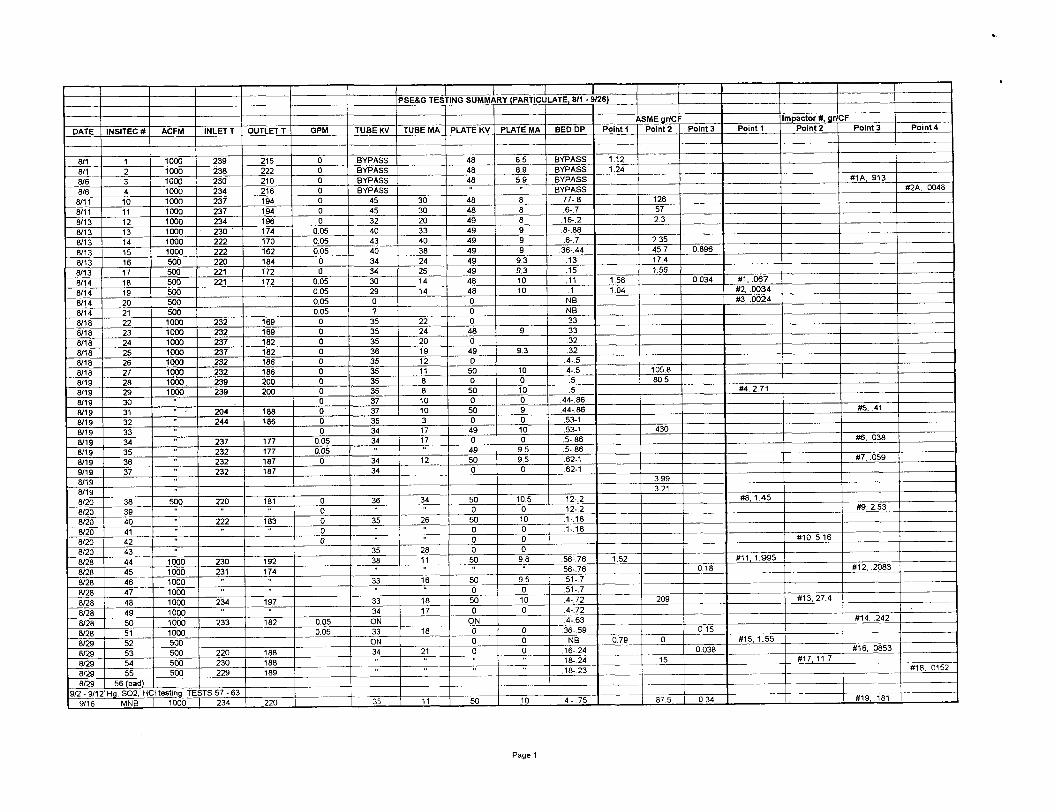
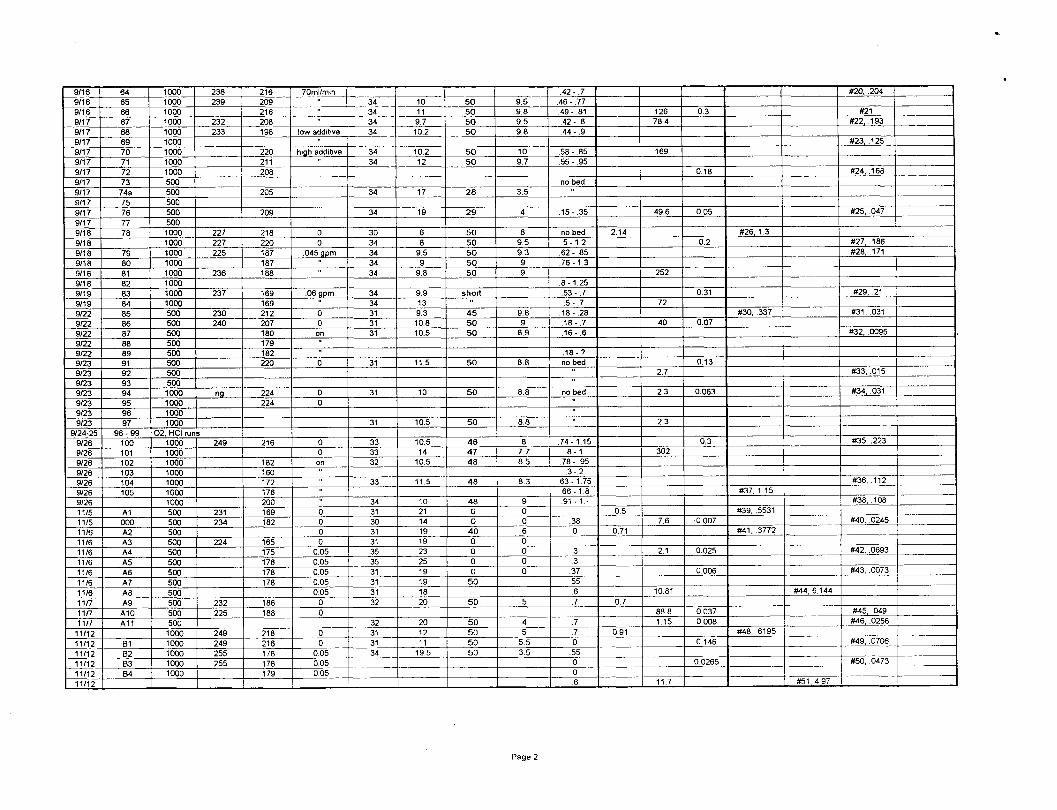
5. Test Results
Over 100 individual test runs were carried out to characterize the effect of the circulating bed on fine particle agglomeration. The specifics of each test are contained in Appendix Ill. The principal measurements were particle size analysis at the exit of the tube precipitator (sampling point SP3) by means of impactor and particle size analysis at the system exit (sampling point SP4) by means of lnsitec optical sizer. The results of the 57 impactor measurements are summarized in Appendix IV. The most useful data comparison for illustrating the effect of the circulating bed is that of the difference in mass of fine particles exiting the tube precipitator when the bed is - and is not developed. Success is obtained when the fine particle concentration at the exit of the tube precipitator is reduced by the addition of an upstream circulating bed. A critical adjustment to the flow pattern in the fluid bed reactor was made prior to the last third of the test program. This modification improved the agglomerating performance of the fluid bed reactor for all tests carried out in November. This adjustment will be described in more detail, and those tests that benefit from the modification will be identified.
A material balance was carried out for the system in order to characterize how changes in feed rates would affect material flow rates within the reactor. Table 5. shows how the material balance is used to illustrate typical conditions during operation.
Table 5. FBR System Material Balance Calculation
Flow = acfm Inlet Temperature = degree F Residence Time = 3.19 second Plate ESP Eff = Tube ESP Eff = Inlet Ash Load (1) = gr/CF = 0.286 lblmin Inlet SO2 ppm = 2.42E-02 Ib/min Inlet Mercury ugm/m3 = 7 09E-08 Ib/min Mole Lime/Mole SO2 Lb CarbonlLb Mercury Inlet Carbon Feed (2) = Inlet Lime Feed (3) = Bed Weight = Ib
Draw Off of CB (5) = Tube ESP Outlet (6) = 0.14 Ib/min = 0.99 gr/CF Plate ESP Outlet (7) = 0.001 Ib/min = 0.01 gr/CF Overall Efficiency = 0.995
Ib/min 2.80E-02 lblmin
28.2 Ib/min = 197.74 gr/CF - Fraction Circulating (4)= - 0.173 Ib/min
indicates input value
13

When these values are inserted into an inlet/outlet diagram of the system, Figure 10, below, results. One sees that the particle loading carried from the fluid bed into the tube precipitator (4) is 100 times larger than the system inlet particle loading (1). Such an arrangement will work only if the tube precipitator is extremely efficient, and this will be so only if the particles in its inlet stream 4, are agglomerates much larger than the incoming particles in stream 1.
1 Fluid 4 Tu be 6 Plate t Bed F w ESP ESP
I
7 *
Solids Stream # Solids lblmin
5
1 0.286 2 0.0001 3 0.0280 4 28.249 5 0.173 6 0.141 7 0.001
Figure I O . Typical Material Balance
5.1. Particle Agglomeration
Figures I 1 and 12 show the effects of bed characteristics on the total particle concentration, which exit the tube precipitator (measured at point 3), and on that portion less than 2.5 microns. Figure 11 shows the particle concentrations at the inlet of the system, and at the tube ESP outlet (SP3) for the following situations: (a) no circulating bed present - the tube ESP sees only the system inlet concentration, (b) with 30 pounds of bed ash injected, followed by evaporative cooling to three temperatures, and (c) with 40 pounds of bed material present and evaporative cooling to 172OF. The fine particle exit concentration is seen to increase considerably upon injection of bed material, but the concentration decreases as more water vapor is added and as more bed material is
14

added; however, the fine particle concentration could not be reduced to the level of the zero bed case.
Figure 12 gives these results for operation at 500 CFM. The results shown here are different from those of Figure 1 I in two ways: ( I ) all particle concentrations are lower due to upstream drop-out at the lower velocity, and (2) the fine particle concentration can be driven lower than the no-bed case when sufficient water spray is used.
Several runs were made in which a proprietary cohesion enhancing agent supplied by ADA, Inc. was injected into the fluid bed during operation. The objective was to promote particle agglomeration upon contact, as is assumed to also happen for water spray injection. The agent was injected at rates similar to those used for bagfilter cake enhancement (low agent) and at twice that level (high agent). The results are shown in Figure 13, where the exit particle concentrations for no agent and low and high agent injections are given. Injection of the agent gave a small decrease in the concentration of particles less than 2.5 microns, similar to water injection. A report of the additive testing by ADA is contained in Appendix V.
Modifications were made to the reactor flow profile subsequent to the runs shown in Figures 1 I , 12, and 13. In order to create a more uniform velocity profile, and consequently a more controlled and stable bed, flow straightening vanes and a perforated plate were added to the venturi section of the reactor vessel. Runs similar to those described for Figures 11 and 12 were then carried out, resulting in Figures 14 and 15. Figure 14 shows that the addition of a bed results in higher fine particle ( ~ 2 . 5 pm) concentration at 1000 CFM; however, Figure 15 shows that, at 500 CFM, both the total concentration and the fine particle concentration are considerably reduced with the addition of a bed. The improvement resulting from the flow correction can be seen upon comparison of Figures 11 with 14 and 12 with 15.
10
lpTotal GrlCF
A
System Inlet No Bed 220 deg F 186 deg F 167 deg F 172 deg F, more bed
Figure 11. The Effect of Evaporative Cooling at 1000 CFM
15

.
1
0 . 1
0 . 0 1
0 . 0 0 1 N o B e d 2 1 2 d e g F 1 7 9 d e g F In l e t
Figure 12. The Effect of Evaporative Cooling at 500 CFM
1
c, 0 0
0 a
0.1 .- 3 \ a 0.01
E CI
c .-
0.001 Bed only Low agent high agent
Figure 13. The Effect of ADA Additive Injection at 1000 CFM
16

1
0.1
0.01
0.001
Q GrlCF c 2.5 Microns
System Inlet Tube ESP Out, No Bed Tube ESP Out with Bed
Figure 14. Particle Penetration after Flow Improvements at 1000 CFM, 179' F
1
0.1
0.01
0.001
GrlCF c 2.5 Microns
System Inlet Tube ESP Out, No Bed Tube ESP Out with Bed
Figure 15. Particle Penetration after Flow Improvements at 500 CFM, 178' F
17

5.2. Mercury Adsorption
The results of activated carbon injection into the laboratory system have been reported in Phase I, but it is instructive describe these results here because the laboratory tests were time dependent batch tests and shed light on the mechanisms involved. The effect of an activated carbon spiked bed on mercury vapor adsorption is shown in Figure 16 for the laboratory system. The system was initially run with no bed, 150 ACFM, 230' F temperature, and an elemental mercury vapor inlet concentration of about 50 pgm/m3 as measured at the precipitator outlet with no bed. Measurements were made by means of an EPM, UV extinction, mercury monitor. Once steady conditions were verified, approximately 4 pounds of bed particulate was added (at approximately the 20 minute point of Figure 16). The mercury vapor levels were cut in half through adsorption by the bed material. 20 gm of iodine impregnated activated carbon, ground to approximately 1/16 inch average size, was added to the bed at the 50 minute mark. The carbon addition resulted in an immediate decrease of outlet mercury vapor, to almost zero, and the mercury levels remained this low for more than two hours, without the injection of additional carbon. The unit was allowed to run in this way until the carbon became saturated and mercury breakthrough could be observed. Mercury breakthrough occurred 170 minutes after the injection of 20 gm of carbon to the circulating bed. The mercury concentration was held to below 20 pgm/m3 even after it had saturated the activated carbon, due to continued adsorption by the fly ash bed.
The mercury adsorption capabilities of the pilot unit were evaluated during the week of 9/1/97. Two activated carbons were run, each at two levels of injection rate. The carbons were an iodine impregnated and a non-impregnated, both produced by Calgon.
45 -
40
35
30 3 9 25 cs, I rn 20 I
w
s 8 10
y 5 K
0
Ash Added
k C a r b o n Added
Carbon Saturation
0 50 100 150 200 250 300 350 400 MINWES
Figure 16. Batch Addition of Activated Carbon to the Laboratory System
18

They were ground to a sub-20 mesh and injected at the entrance of the fluid bed reactor. The injection rates used were 1000 and 2000 Ib/lb for the impregnated carbon and 2000 and 8000 Ib/lb for the non-impregnated carbon, all based upon a 1.55 pgm/m3 inlet mercury concentration. The carbon was injected after first being mixed at a 1 to 100 ratio with fly ash, so as to control the small carbon feed rate. In one case carbon was injected at the system inlet without a recirculating bed in order to yield a comparison value with conventional carbon injection. Injection temperature was 230 degree F. The effect on total mercury concentration was measured by means of EPA Method 101 at the system exit.
The results are given in Figures 17 and 18. We see that 50% removal of mercury was accomplished by the fluid bed alone, with no carbon present. Figure 17 shows that 80% mercury removal can be achieved with injection of 1000 Ib/lb iodine impregnated mercury into the fluid bed. This can be compared to conventional carbon injection with no bed present, shown in Figure 17 as 50% removal for 2000 IbAb injection. Figure 18 shows that the injection of 20001b/lb Hg of non-impregnated acyivated carbon results in 70% mercury removal. The iodine impregnated carbon was clearly much more effective than the non-impregnated carbon, as can be seen by comparing the results of Figures 17 and 18.
1.6
I .4
1.2
1
0.8
0.6
0.4
0.2
0 System Only Bed Only 10001bllbHg 20001bllbHg 20001bllbHg No Bed No Carbon Injection Injection Injection
With Bed With Bed No Bed
Figure 17. Injection of Iodine Impregnated Activated Carbon
19

1.6 ,
1.4
1.2
1
0.8
0.6
0.4
0.2
0 System Only Bed Only 2OOOlWlbHg 80001WlbHg
No Carbon Injection Injection With Bed With Bed
NoBed
Figure 18. Injection of Non-impregnated Activated Carbon
5.3. Acid Gases
A series of tests were carried out to demonstrate the effectiveness of the fluid bed system to remove SO2 and HCI. In these tests a commercial grade hydrated lime was injected into the bed reactor at various feed rates. The effect of feed rate on absorption was determined by the measured change in exit SO2 and HCI. The results of these tests are presented in Figure 19. This figure shows the percent removal of SO2 and HCI caused by absorption by the bed ash itself and by the absorption of the bed ash plus the injected lime. The mole ratios given are calculated as the moles of injected lime divided by the moles of inlet S02. We see that 90% of the HCI and a stoichiometric amount of SO2 can be removed at a mole ratio of 0.66.
Both the mercury adsorption tests and the SO*/HCI absorption tests reported above were carried out before the flow straightening modifications were installed in the fluid bed reactor. As seen by the improvements made by these flow corrections to fine particle agglomeration, it is expected that improved mercury, S02, and HCI removals would also be obtained.
20

100
80
60
40
20
0 Bed only .33 SR .66 SR
Figure 19. SO2 and HCI Removal by Hydrated Lime
21

6. Economic Considerations
The circulating fluid bed device is a multi-pollutant removal device. It is capable of fine particle removal enhancement, acid gas absorption, and mercury vapor control. As such, it would be expected to perform at least two of these functions in any installation. The system was originally designed for acid gas adsorption, and it is used commercially in many installations for this purpose. The need for SO2 and HCI control would therefore be the principal reason for its selection. Ireland, et a16 have shown that the CFB device is more efficient and very economically competitive with five other commercial SO2 absorbing devices. If we assume that price paid for the basic CFB absorber is attributed to SO2 removal, then the cost for the removal of an additional pollutant, such as mercury vapor, is simply the cost of the equipment and sorbents needed for this additional control capability.
We can compare the cost of CFB mercury removal with that of activated carbon injection, using Brown's' cost analysis as a basis. Brown, et al. give costs for the injection of activated carbon at 31 5OF and injection following spray cooling at 199OF. These costs are shown in Table 6 for a 975 MW utility boiler. The last column of this table are the additional capital and operating costs for CFB mercury vapor control. Although much less activated carbon is injected into the CFB system, it is assumed that the capital equipment costs are the same as for 315' F injection. The cost per pound of iodine impregnated carbon, injected into the CFB system, is estimated to be 8 times the carbon cost of the other systems. The rate of carbon injection of the CFB system is low enough not to affect the sale of ash for use in cement.
Table 6 Comparative Economics for Mercury Control
The mercury control costs are dominated by the activated carbon operating cost, and Table 6 shows that efforts to reduce this operating cost, such as through spray cooling, are worth the additional capital cost. Adding mercury adsorption capability to the CFB system results in a significantly lower levelized cost for mercury control than that for duct injection of activated carbon, with or without gas cooling. This is true despite the fact that the CFB system was assumed to inject higher-priced impregnated carbon.
22
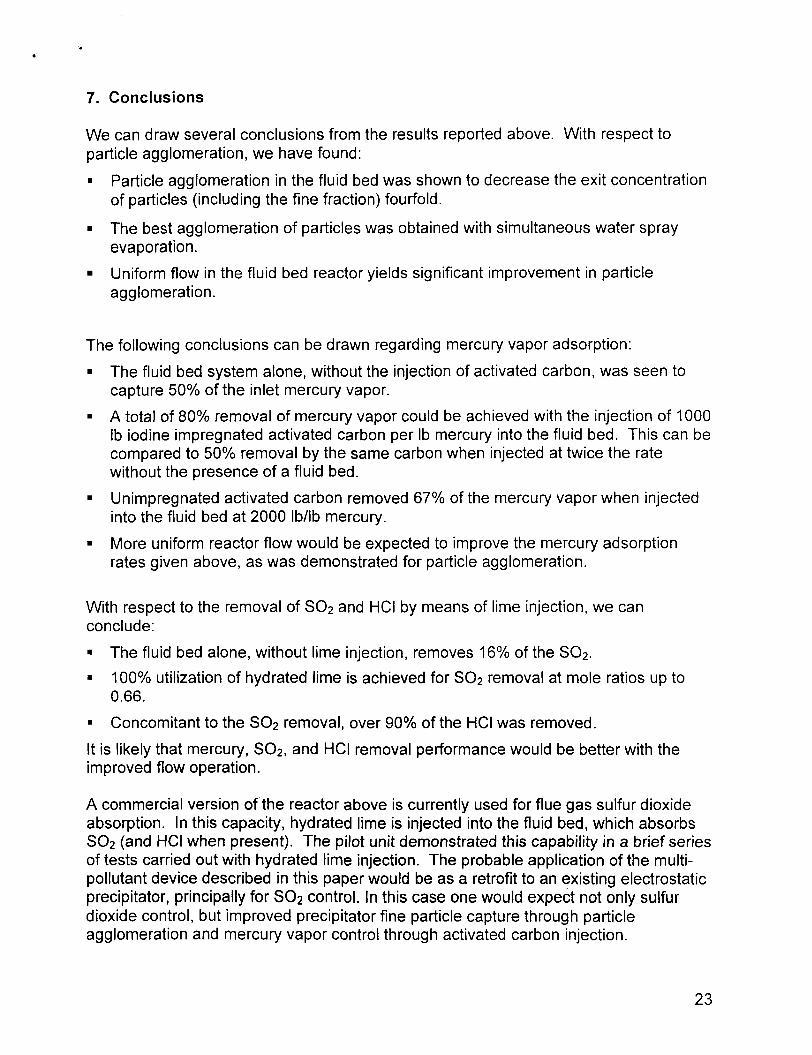
7. Conclusions
We can draw several conclusions from the results reported above. With respect to particle agglomeration, we have found: 9 Particle agglomeration in the fluid bed was shown to decrease the exit concentration
of particles (including the fine fraction) fourfold.
9 The best agglomeration of particles was obtained with simultaneous water spray evaporation.
Uniform flow in the fluid bed reactor yields significant improvement in particle agglomeration.
The following conclusions can be drawn regarding mercury vapor adsorption: 9 The fluid bed system alone, without the injection of activated carbon, was seen to
capture 50% of the inlet mercury vapor. 9 A total of 80% removal of mercury vapor could be achieved with the injection of 1000
Ib iodine impregnated activated carbon per Ib mercury into the fluid bed. This can be compared to 50% removal by the same carbon when injected at twice the rate without the presence of a fluid bed.
Unimpregnated activated carbon removed 67% of the mercury vapor when injected into the fluid bed at 2000 Ib/lb mercury.
More uniform reactor flow would be expected to improve the mercury adsorption rates given above, as was demonstrated for particle agglomeration.
. 9
With respect to the removal of SO2 and HCI by means of lime injection, we can conclude: 9 The fluid bed alone, without lime injection, removes 16% of the S02. 9 100% utilization of hydrated lime is achieved for SO2 removal at mole ratios up to
0.66. . Concomitant to the SO2 removal, over 90% of the HCI was removed.
It is likely that mercury, S02, and HCI removal performance would be better with the improved flow operation.
A commercial version of the reactor above is currently used for flue gas sulfur dioxide absorption. In this capacity, hydrated lime is injected into the fluid bed, which absorbs SO2 (and HCI when present). The pilot unit demonstrated this capability in a brief series of tests carried out with hydrated lime injection. The probable application of the multi- pollutant device described in this paper would be as a retrofit to an existing electrostatic precipitator, principally for SO2 control. In this case one would expect not only sulfur dioxide control, but improved precipitator fine particle capture through particle agglomeration and mercury vapor control through activated carbon injection.
23

. 8. Acknowledgements
The work reported here was sponsored by the Federal Energy Technology Center, and the Project Officer was Henry Pennline. Public Service Electric and Gas of New Jersey hosted the pilot unit, and Edward Waugh headed the efforts of PSE&G.
9. References
1. H. Arastoopour, et al., “Effect of Temperature and Gas Velocity on the Fluidization of Sticky Particles”, International Conference on Fluidization, May, 1986.
2. M Benlyamani, et al., “Agglomeration of Particles During Roasting of Zinc Sulfide”, Metallurgical Transactions, December, 1986.
3. C. D. Livengood, et al., “Experimental Evaluation of Sorbents for the Capture of Mercury in Flue Gases”, Paper 94-RA114A.04, 87th Annual Meeting of the A&WMA, June, 1994.
4. S. J. Miller, et al., “Laboratory-Scale Investigation of Sorbents for Mercury Control”, Paper 94-RA114A.01 , 87th Annual Meeting of the A&WMA, June, 1994.
5. E. Waugh, et al., “Mercury Control in Utility Baghouses through Dry Carbon-Based Sorbent Injection - Pilot Scale Demonstration”, EPRI-DOE-EPA Combined Utility Air Pollutant Control Symposium, August, 1997.
6. P. Ireland, et al., “Site-Specific Evaluation of Six Sorbent Injection Processes”, 1 st Combined FGD and Dry FGD Symposium, 1988.
7. T. Brown, et al., “Control of Mercury Emissions from Coal-Fired Power Plants: A Preliminary Cost Assessment”, DOEIEERC Conference on Air Quality, December, 1998.
24

Appendix 1. Pilot Unit System Schematic

r I I L
t-
4
.. ... ..-. ....
1;
......
<e; 2%
1. ' 1.
......
$5; tf 1;
e Si 23 1:
..*..-

Appendix II. Pilot Unit Startup Report

STARTUP REPORT
COMPANY: PSE&G ENGINEER: John H Umberger Mercer Generating Station Trenton NJ
M.O.R.0. NO.: 461 007
LOCATION: Pilot Fluidized Bed Agglomerator
DATE: July 15 - 17, 1997 EEC NO:
CONTACT: Chet Gorsky Site Manager
PURPOSE: Commission 2 HV power supplies, one FRC
INSTALLATION: This is a pilot installation to explore mechanical particle agglomeration phenomena. Flyash particles caught in a tubular ESP are recycled to the Fluidized Bed Reactor upstream. It is expected that the dust concentration will increase by 2 orders of magnitude between the FBR and the tube ESP. A parallel plate ESP at the end of the stream is utilized for two purposes. One, for performance comparison and two, catch any residual from the Tube ESP - FBR system.
SUMMARY: 0 Fixed open on lOOKV divider circuit. The 160 megohm voltage divider meggered open
when the TR was checked. The divider resistor utilizes the NWL D30013 dual resistor card assembly which is normally employed on double bushing 55KV TRs. One of the pins in the MOLEX jumper between the two 80 meg resister assemblies had worked out of it’s case. Completed wiring of rappers to FRC All seven ESI rappers were terminated to terminals in the FRC by the EEC FE. PS&G electricians had run cables and terminated the rapper end of same. Aligned, Plumbed rapper coils and set piston exposure EEC FE set all rapper piston exposures to 5” per normal specification and verified that coil assemblies were plumb. Additionally the both DE and CE rappers were centered over their respective rapper rods by loosening their support bolts moving them.
0
0
’PSE&G Mercer Station 2 Pilot FB Agglomerater Startup
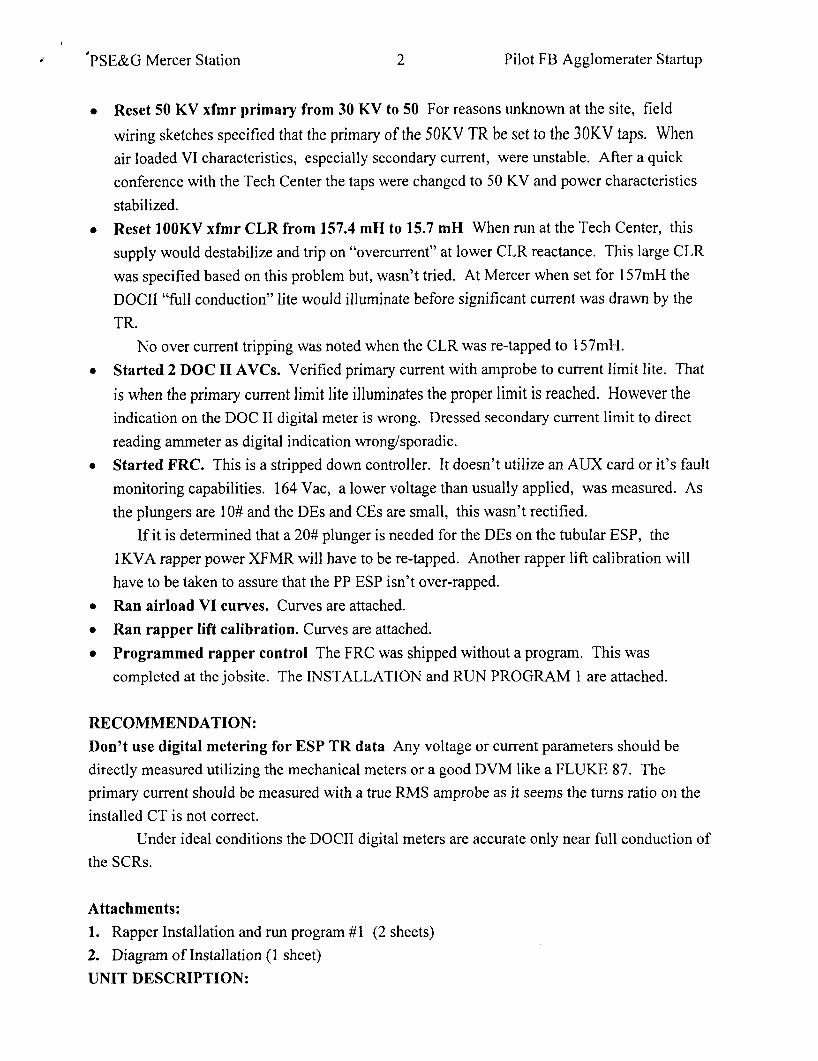
Reset 50 KV xfmr primary from 30 KV to 50 For reasons unknown at the site, field
wiring sketches specified that the primary of the 50KV TR be set to the 3OKV taps. When air loaded VI characteristics, especially secondary current, were unstable. After a quick conference with the Tech Center the taps were changed to 50 KV and power characteristics stabilized. Reset 1OOKV xfmr CLR from 157.4 mH to 15.7 mH When run at the Tech Center, this supply would destabilize and trip on “overcurrent” at lower CLR reactance. This large CLR was specified based on this problem but, wasn’t tried. At Mercer when set for 157mH the DOCII “full conduction” lite would illuminate before significant current was drawn by the TR.
0
No over current tripping was noted when the CLR was re-tapped to 157mH. 0 Started 2 DOC I1 AVCs. Verified primary current with amprobe to current limit lite. That
is when the primary current limit lite illuminates the proper limit is reached. However the indication on the DOC I1 digital meter is wrong. Dressed secondary current limit to direct reading ammeter as digital indication wrong/sporadic. Started FRC. This is a stripped down controller. It doesn’t utilize an AUX card or it’s fault monitoring capabilities. 164 Vac, a lower voltage than usually applied, was measured. As the plungers are 10# and the DES and CEs are small, this wasn’t rectified.
If it is determined that a 20# plunger is needed for the DES on the tubular ESP, the lKVA rapper power XFMR will have to be re-tapped. Another rapper lift calibration will have to be taken to assure that the PP ESP isn’t over-rapped.
0 Ran airload VI curves. Curves are attached. 0 Ran rapper lift calibration. Curves are attached. 0 Programmed rapper control The FRC was shipped without a program. This was
completed at the jobsite. The INSTALLATION and RUN PROGRAM 1 are attached.
0
RECOMMENDATION: Don’t use digital metering for ESP TR data Any voltage or current parameters should be directly measured utilizing the mechanical meters or a good DVM like a FLUKE 87. The primary current should be measured with a true RMS amprobe as it seems the turns ratio on the installed CT is not correct.
Under ideal conditions the DOCII digital meters are accurate only near full conduction of the SCRs.
Attachments: 1. Rapper Installation and run program #1 (2 sheets) 2. Diagram of Installation (1 sheet) UNIT DESCRIPTION:

* ’PSE&G Mercer Station 3 Pilot FB Agglomerater Startup
Process: Pilot fluidized bed ESP on slipstream of PC utility steam generator. Tubular ESP catch is recirculated to a Fluidized Bed Reactor upstream. This concentrates flyash approximately 100 x inlet dust concentration, the purpose to mechanically increase the particle size. A second parallel plate ESP is used for comparison and to collect residual from the pilot prcess.
TUBULAR ESP: Twelve parallel 10” diameter by 6’ long tubes. Tubes are vertically oriented gas and flow is upward. PARALLEL PLATE: A three field, one pass unit made of two, 72”high by 60” deep, 3 panel collecting electrodes. The gas pass is 12” wide.
TUBULAR: Rigid discharge electrodes of spiraled pipe-spike design. The tip of each discharge spike is spaced 2.75” away from the tubular collecting surface. All 12 DES are cleaned by one ESI- 1 rapper with 1 O# plunger. PARALLEL PLATE: Rigid discharge electrodes of 3” staggered pin pipe-spike design. Each Field has 3 electrodes which are rapped by one ESI-I rapper with IO# plunger.
TUBULAR: The 12 tubes are rapped by an ESP Specialties 120Vac spring loaded plunger-type rapper with built in timer. PARALLEL PLATE: The two CEs in each field are rapped by one ESI-1 rapper with 1 O# plunger.
Configuration:
Discharge System:
Collecting system Rapping:
Rapping Timing:
Power Supplys:
CE:3 min,5 min, 10 min (All at DE:5 min,30 min,60 min,2 min (Tubular)
TUBULAR: Transformer Rectifier - NWL Mod# 36754 Single bushing 14.3 KVA, 100
KVdc, 1 OOMadc (480Vac, 3 1 Aac) s/n 92- 1346 Voltage multiplier resister is 160 megohm Current limiting reactor - NWL mod# 40433, Taps 1-3 = 157.4mH. Taps 1-2 = 15.7 mH (present setting) PARALLEL PLATE: Transformer Rectifier - NWL Mod# 24527A 1.2KVA SOKVdc, 30Madc (480Vac,5Aac) s/n 76239 Voltage multiplier resister is 80 megohm. Primary has three taps for 30,40, and 50 KV secondary voltages. Presently set at 50KV. Current limiting reactor is a multi tap unit (63.6, 101.8, 146.4mH) which is presently set at 146.4 mH.
AVCs: DOC I1 with modified metering circuitry to handle the low currents and high Kilovoltage. A peak KV meter and requisite circuitry is also included.
RAPPER: Stripped down Forry ERC with one output card without circuit protecting monitor card.

'PSE&G Mercer Station 4 Pilot FB Agglomerater Startup
100 KV Tubular ESP Airload VI - 92oF
100.0
90.0
80.0
70.0
60.0
50.0
40.0
30.0
20.0
10.0
0.0 0 10 20 30 40 50 60 70 80 90 100
Kilovolts

h E & G Mercer Station 5 Pilot FB Agglomerater Startup
50 KV Parallel Plate ESP Airload VI - 92oF
30.0
25.0
20.0
P .I 15.0 CI CI
2
10.0
5.0
0.0 10 20 30 40 50 60 0
Kilovolts

h E & G Mercer Station 6 Pilot FB Agglomerater Startup
PSE&G,Mercer STn Pilot Agglomerator Rapper Lift Curves, lO#plunger, 164Vac, 5" exposure
7/17/97 12.
10.
8
t+ Irc H la
6 8 V z
4
2
0
0 1 2 3 4 5 6
PULSES
7 8 9 10 11 12

Appendix 111. Summary of Tests
Page 2

. Appendix IV. Summary of Impactor Tests

IMPTOT.XLS

IMPTOT XLS

IMPTOT XLS
Appendix V. Summary of Additive Tests
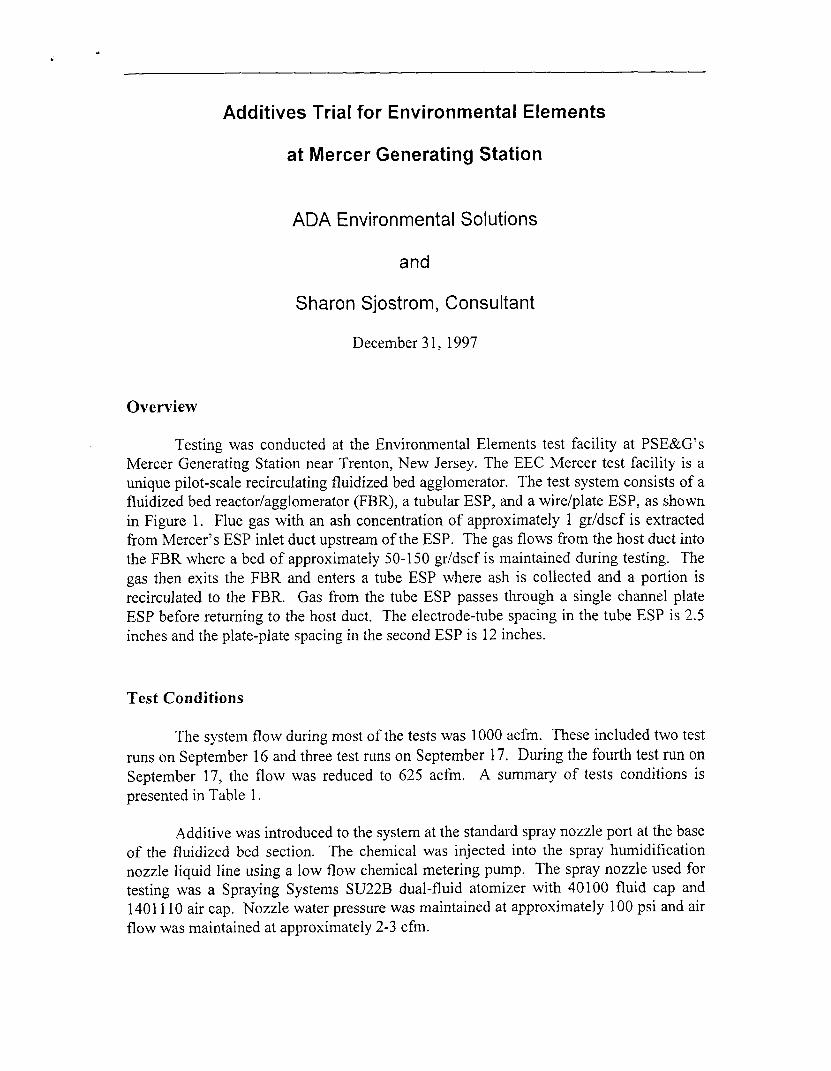
Additives Trial for Environmental Elements
at Mercer Generating Station
ADA Environmental Solutions
and
Sharon Sjostrom, Consultant
December 3 1, 1997
Overview
Testing was conducted at the Environmental Elements test facility at PSE&G’s Mercer Generating Station near Trenton, New Jersey. The EEC Mercer test facility is a unique pilot-scale recirculating fluidized bed agglomerator. The test system consists of a fluidized bed reactor/agglomerator (FBR), a tubular ESP, and a wire/plate ESP, as shown in Figure 1. Flue gas with an ash concentration of approximately 1 gr/dscf is extracted from Mercer’s ESP inlet duct upstream of the ESP. The gas flows from the host duct into the FBR where a bed of approximately 50-150 gr/dscf is maintained during testing. The gas then exits the FBR and enters a tube ESP where ash is collected and a portion is recirculated to the FBR. Gas from the tube ESP passes through a single channel plate ESP before returning to the host duct, The electrode-tube spacing in the tube ESP is 2.5 inches and the plate-plate spacing in the second ESP is 12 inches.
Test Conditions
The system flow during most of the tests was 1000 acfm. These included two test runs on September 16 and three test runs on September 17. During the fourth test run on September 17, the flow was reduced to 625 acfm. A summary of tests conditions is presented in Table 1.
Additive was introduced to the system at the standard spray nozzle port at the base of the fluidized bed section. The chemical was injected into the spray humidification nozzle liquid line using a low flow chemical metering pump. The spray nozzle used for testing was a Spraying Systems SU22B dual-fluid atomizer with 40100 fluid cap and 140 1 1 IO air cap. Nozzle water pressure was maintained at approximately 100 psi and air flow was maintained at approximately 2-3 cfm.

A D A Environmentul Solutions
Host Duct
I
1
ESP 117 FBR
Figure 1. Sketch of test arrangement.
Table I . Summary of Test Conditions
Date Test Condition System Flow (acfm)
9/16 Baseline (no water and no additive) 1000
911 6 Water injection at 70 ml/min 1000
1000 9/17 Water injection at 70 ml/min
911 7 Water at 70 ml/min and additive solution at 0.13 ml/min
9/17 Water at 70 ml/min and additive solution at 0.6 mumin
9/17 Water at 70 mVmin and additive solution at 0.33 ml/min
1000
1000
625
Host Duct
2
ADA Environmentul Solutions
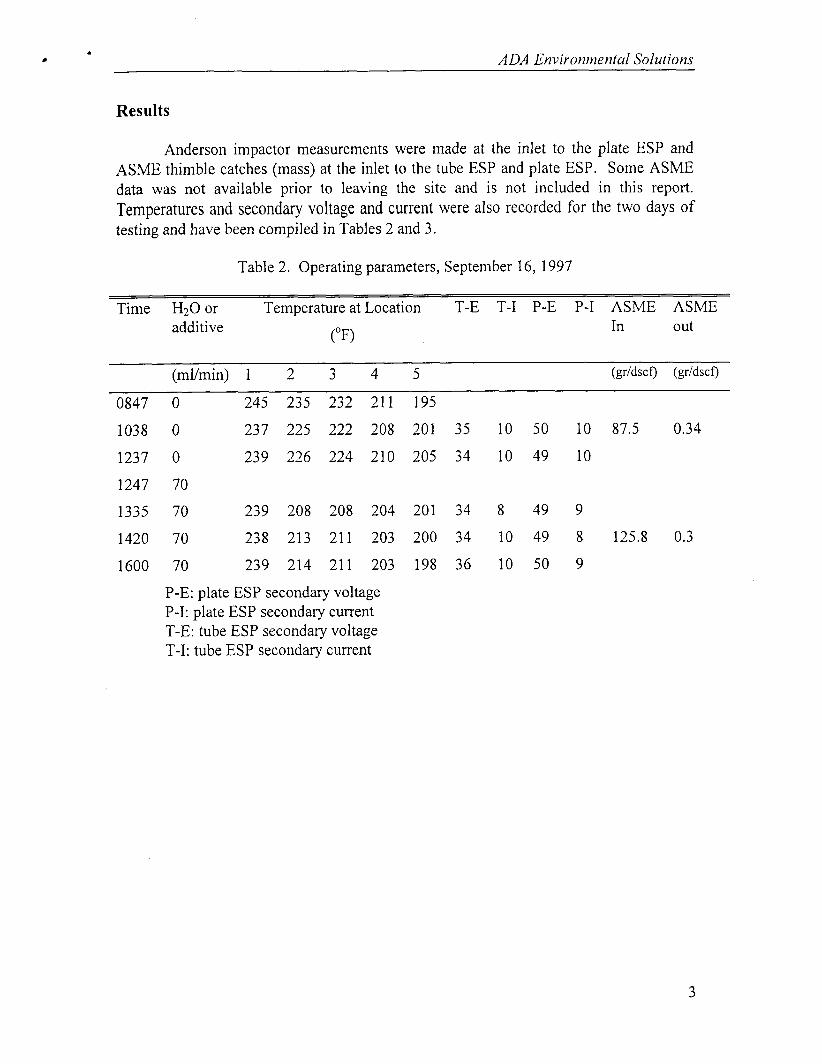
Results
Anderson impactor measurements were made at the inlet to the plate ESP and ASME thimble catches (mass) at the inlet to the tube ESP and plate ESP. Some ASME data was not available prior to leaving the site and is not included in this report. Temperatures and secondary voltage and current were also recorded for the two days of testing and have been compiled in Tables 2 and 3.
Table 2. Operating parameters, September 16, 1997
Time H20or Temperatureat Location T-E T-I P-E P-I ASME ASME In out
(OF) additive
(mI/min) 1 2 3 4 5 (gddscf) (gddscf)
0847 0 245 235 232 211 195
1038 0 237 225 222 208 201 35 10 50 10 87.5 0.34
1237 0 239 226 224 210 205 34 10 49 10
1247 70
1335 70 239 208 208 204 201 34 8 49 9
1420 70 238 213 211 203 200 34 10 49 8 125.8 0.3
1600 70 239 214 211 203 198 36 10 50 9
P-E: plate ESP secondary voltage P-I: plate ESP secondary current T-E: tube ESP secondary voltage T-I: tube ESP secondary current
3

. ADA Environmenlul Solutions
Table 3. Operating parameters, September 17, 1997
Time H20or Temperatureat Location T-E T-I P-E P-I ASME ASME In out
( O F ) additive
W m i n ) 1 2 3 4 5 (gddscf) (gr/dscf)
751 70 232 209 207 198 190 33 7 50 10
902 70 236 215 213 200 190 35 8 50 9
910 70 0.11
946 0.13 233 213 211 198 190 36 10 48 9
1021 0.13 235 216 214 201 192 35 7 50 10 78.4 0.75
1116 0.13 236 206 205 198 192 35 10 50 9
1213 0.6 238 214 212 201 192 35 9 49 9
1337 0.6 237 212 210 205 198 34 10 48 9 169.1 0.18
1402 0.6 238 212 211 204 198 34 11 50 10
1510 0.6 236 217 216 204 198 34 10 48 10
1537 625 acfm
1635 0.32 228 208 205 195 193 35 17 49 9
1806 0.33 229 209 207 204 189 35 19 37 4 49.6
1840 0.34 228 210 207 192 189 34 19 39 4
The tables indicate that the secondary voltage and current in both ESPs were fairly stable at 34-36 kV, 8-10 mA in the tube ESP and 48-50 kV, 8-10 mA in the plate ESP at 1000 acfm. On the morning of September 17 the wire rapper on the tube ESP tripped off and was not observed until the current began dropping below 8 mA during the first additive injection run. It was turned on during this run. It appears that the secondary current may have been increasing slightly during the high additive injection condition, presumably due to additive injection. There was no baseline test at the lower flow for comparison to evaluate the effect of additive injection.
4

, ADA Environmentul Solulions
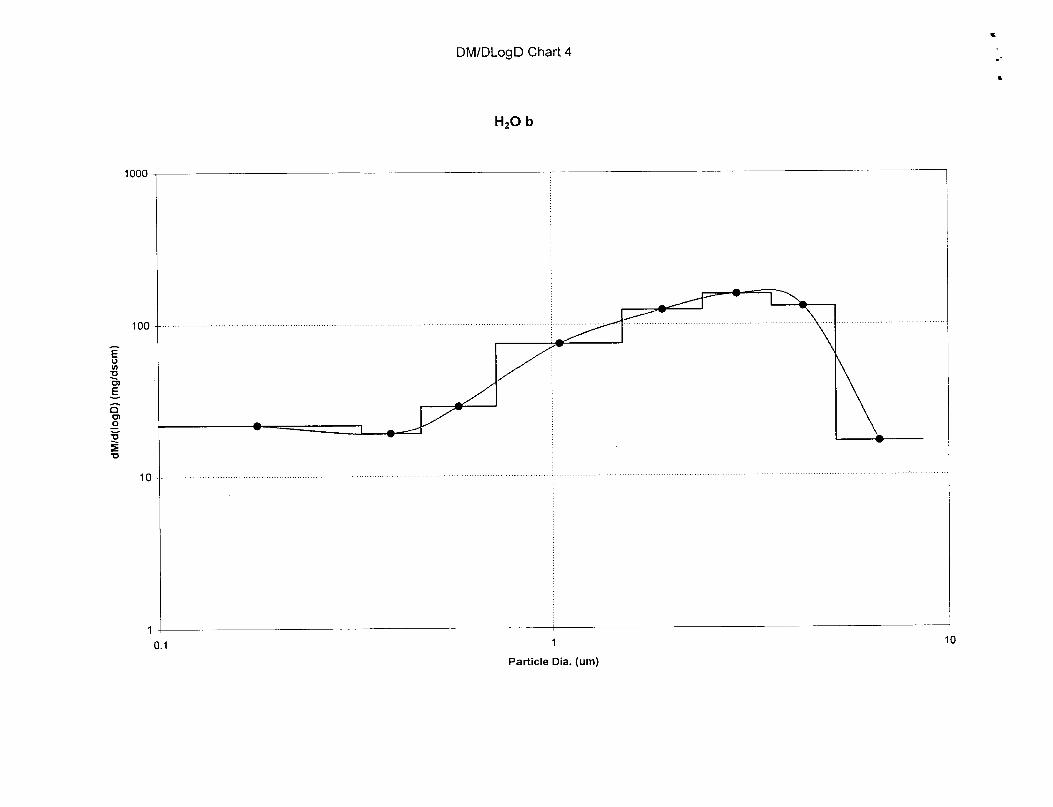
The results of the Anderson measurements are shown in Figure 2 as the cumulative weight percent collected in the stages. One sample was collected per test condition. The impactor data is further expressed by differential distribution in a group plot (Chart 1) and individual run plots (Charts 2 - 7). Differential distributions were developed to more clearly delineate the change in fine particle mass fraction at the various test conditions. As can be seen, the mass on the fine particle stages below 1 pm is decreased significantly for the additive tests compared to the baseline tests with and without water spray. This shift of the distribution indicates agglomeration in the finest size ranges with the ADA additive. Table 4 presents the mass concentration collected on each Anderson stage for the 1000 acfm tests on September 17 in units of mg/dscm.
Comparing the data collected on September 16 (baseline and water only) with data collected on September 4 17 (water only, low and high additive injection) suggests that the decreased particulate captured on the final stages, and the overall decrease in particulate < 8.6 pm with the high additive injection may be due in part to an increased bed density or water injection. The baseline cumulative concentration < 8.6 pm collected earlier in the day on 9/16 was measured to be 44%. Later in the day after the bed density had increased somewhat, the water injection (test H20 a) resulted in a cumulative percent < 8.6 pm of 34%. The bed density (inlet to the tube ESP), as measured by the ASME thimble, was 87 and 126 gr/dscf respectively for these two conditions. It would be useful to have measured a baseline at two different bed densities to evaluate the effect of bed density alone on particle agglomeration.
Table 4. 1000 acfm Anderson Results from September 17, 1997
Size Range H20 b low add high add (mg/dscm) (mg/dscm) (mg/dscm)
> 8.6
5.2-8.6
3.6-5.2
2.4-3.6
1.5-2.4
0.73-1.5
0.47-0.73
0.33-0.47
0-0.33
Total
3 18.6
10.8
24.9
26.6
23.7
19.3
7.2
3.3
7.4
416.4
109.0
29.3
34.0
43.0
41.2
17.5
8.7
2.2
2.6
287.5
201.6
103.1
16.5
14.1
21.8
18.0
5.7
2.1
1.5
384.4
5

.i * ADA Environmenlul Solutions
Summary
Limited data was collected during additive injection and no duplicate mass or size measurements were made, therefore caution should be exercised when drawing conclusions from this data set. A few observations from testing include:
0 The cumulative weight percent less than 8.6 pm collected in the Anderson decreased due to the combined effect of increased bed density and water injection. Sufficient data was not available from these tests to determine the effect of water injection or increased bed density independently.
The cumulative weight percent less than 8.6 pm collected in the Anderson decreased due to the combined effect of increased bed density and the high additive injection condition. Sufficient data was not available from these tests to determine the effect of additive injection or increased bed density independently.
The fine particle fraction on the last stages decreased for the tests with additive compared to the immediately preceding test with water spray and to the initial baseline with no spray, indicating agglomeration in the finest particle sizes.
Tube ESP secondary current was slightly higher during the high additive injection test. Increased current is a characteristic conditioning effect, however, there is insufficient stable electrical data to determine if this was positively an additive effect.
0
0
0

\\
', \
\\
\\
I
'\ ' '\ \'
\ \
\*
\ \ \
\\ '. \ '.
\
'\
'\
\
\

t n
3
r
U
m

B t L-

_. \ L

0
7


P
a
4
a 0
dM/d
( IogD
) (m
glds
cm)
4
0
....
-
\
A
0
0