a novel in vitro device to deliver induced electromagnetic
TRANSCRIPT

arX
iv:2
011.
0969
8v1
[ph
ysic
s.bi
o-ph
] 1
9 N
ov 2
020
Manuscript submitted to BiophysicalJournal
Article
A novel in vitro device to deliver induced
electromagnetic fields to cell and tissue cultures
Rea Ravin1,2*, Teddy X. Cai2*, Randall H. Pursley3, Marcial Garmendia-Cedillos3, Tom Pohida3, Raisa Z. Freidlin3, Herui
Wang4, Zhengping Zhuang4, Amber J. Giles4, Nathan H. Williamson2,5, Mark R. Gilbert4, and Peter J. Basser2†
*Indicates equal contribution1Celoptics, Inc., Rockville, MD, USA2Section on Quantitative Imaging and Tissue Sciences Eunice Kennedy Shriver National Institutes of Child Health and Human
Development, National Institutes of Health, Bethesda, MD, USA3The Signal Processing and Instrumentation Section, Center for Information Technology, National Institutes of Health,
Bethesda, MD, USA4Neuro-Oncology Branch, Center for Cancer Research, National Cancer Institute, National Institutes of Health, Bethesda, MD,
USA5National Institute of General Medical Sciences, National Institutes of Health, Bethesda, MD, USA†Correspondence: [email protected]
ABSTRACT We have developed a novel in vitro instrument that can deliver intermediate frequency (100 – 400 kHz), mod-
erate intensity (up to and exceeding 6.5 V/cm pk-pk) electric fields (EFs) to cell and tissue cultures generated using induced
electromagnetic fields (EMFs) in an air-core solenoid coil. A major application of these EFs is as an emerging cancer treatment
modality. In vitro studies by Novocure Ltd. reported that intermediate frequency (100 – 300 kHz), low amplitude (1 – 3 V/cm)
EFs, which they called “Tumor Treating Fields (TTFields)”, had an anti-mitotic effect on glioblastoma multiforme (GBM) cells.
The effect was found to increase with increasing EF amplitude. Despite continued theoretical, preclinical, and clinical study, the
mechanism of action remains incompletely understood. All previous in vitro studies of “TTFields” have used attached, capaci-
tively coupled electrodes to deliver alternating EFs to cell and tissue cultures. This contacting delivery method suffers from a
poorly characterized EF profile and conductive heating that limits the duration and amplitude of the applied EFs. In contrast,
our device delivers EFs with a well-characterized radial profile in a non-contacting manner, eliminating conductive heating and
enabling thermally regulated EF delivery. To test and demonstrate our system, we generated continuous, 200 kHz EMF with an
EF amplitude profile spanning 0 – 6.5 V/cm pk-pk and applied them to exemplar human thyroid cell cultures for 72 hours. We
observed moderate reduction in cell density (< 10%) at low EF amplitudes (< 4 V/cm) and a greater reduction in cell density
of up to 25% at higher amplitudes (4 – 6.5 V/cm). Our device can be readily extended to other EF frequency and amplitude
regimes. Future studies with this device should contribute to the ongoing debate about the efficacy and mechanism(s) of action
of “TTFields” by better isolating the effects of EFs and providing access to previously inaccessible EF regimes.
SIGNIFICANCE Previous work reported that intermediate frequency (100 – 300 kHz), low amplitude (1 – 3 V/cm) electric
fields (EFs) have an anti-mitotic effect capable of inhibiting the growth rate of cancers cell in vitro and in the clinic, although
the mechanism of action remains unclear. Existing EF delivery systems use capacitively coupled electrodes placed in direct
contact with the specimen holder. This direct contact generates unwanted heat and limits the amplitude and duration of
EF stimulation. We have developed a novel in vitro system capable of continuous thermal regulation and delivery of well-
characterized (200 kHz, 0 – 6.5 V/cm pk-pk), electromagnetic fields (EMFs) to cell cultures, paving the way for improved
mechanistic biophysical studies.
INTRODUCTION
There is an extensive body of literature describing the effects of low (DC-kHz) and high (above 1 MHz) frequency electric fields
(EFs) on living cells (1). Very low frequency EFs (< 2 kHz) are used to stimulate excitable cells while high frequency EFs are
used to heat cells and tissues. Intermediate frequency EFs (kHz-MHz) were previously considered to have no biological effects.
Manuscript submitted to Biophysical Journal 1

ACCEPTED
MANUSCRIP
T
Ravin, R. & Cai, T. X.
However, Kirson, et al. (2) reported that EFs at frequencies of 100− 300 kHz and amplitudes between 1− 3 V/cm had an anti-
mitotic effect, inhibiting the proliferation rate of human and rodent tumor cell lines while having no effect on non-cancerous
cells. The inhibitory effect was reported to be frequency-dependent with a peak effect at 200 kHz for glioblastoma multiforme
(GBM) cell lines (2). The inhibitory effect was also found to increase with EF amplitude (3). At higher EF amplitudes (≥ 2
V/cm), significant (> 50%) inhibition relative to temperature-matched controls was reported (2, 3). Kirson et al. labelled these
EFs as “Tumor Treating Fields (TTFields)”.
GBM is the most common and lethal adult brain tumor. Prognosis remains poor. Despite a combined treatment plan of
maximal safe aggressive surgery, chemotherapy with temozolomide, and radiation, patients’ median survival is only 14 – 16
months from the time of diagnosis; 1 in 4 patients survive more than 2 years and fewer than 1 in 20 survive more than 5
years (4, 5). One significant feature of GBM is the highly invasive character of the cancer cells. This makes complete surgical
resection impossible, leading to a recurrence rate of almost 100% (5, 6). Based on preclinical results, “TTFields” entered
clinical trials (7, 8) and were approved by the FDA for newly diagnosed GBM cases in 2015, representing the first new GBM
treatment modality in decades. “TTFields” have also been approved for treatment of pleural mesothelioma as of 2019 (9).
Despite ongoing, theoretical, preclinical, and clinical research, the mechanism(s) of action of “TTFields” is not well
understood. Abnormal cell mitotic morphology including blebbing followed by apoptosis (2, 3, 10) was observed when these
EFs were applied to proliferating cells, suggesting a biophysical anti-mitotic mechanism of action. Computational models
predicted that the penetration of EFs into cells is indeed frequency-dependent, as suggested by findings by Kirson et al. (2).
At ultra-low frequency, EFs are largely screened and do not penetrate the cell membrane, whereas in the low to intermediate
(100 – 500 kHz) frequency range, EFs are predicted to penetrate cells and could have a biophysical effect (11–14).
In initial preclinical studies, Kirson et al. (2, 3) proposed two specific mechanisms by which penetrative intermediate
frequency EFs could cause mitotic arrest and apoptosis. The first mechanism is an interaction of these EFs with the electric
dipoles of tubulin dimers which results in changes in tubulin dimer rotational dynamics, disrupting the formation and function
of the mitotic spindle (2, 15, 16). The exact effects of EFs on microtubule polymerization were predicted to depend on the
length of the microtubule filament as well as the frequency and amplitude of the applied EF. Effects on septin dimers were
also proposed (10). However, more recent computational modeling suggests that EFs in the range of 1 – 3 V/cm are orders of
magnitude too small to affect the rotational dynamics of tubulin and septin dimers (11, 13, 14, 17, 18).
The second mechanism of action proposed by Kirson et al. (2, 3) was dielectrophoretic (DEP) forces resulting in electroki-
netic effects on polarizable bio-macromolecules (i.e., those capable of producing a counter-ion cloud). During cytokinesis,
a cleavage furrow appears between the dividing daughter cells. Computational models (13) predict that in and around these
furrows, non-uniform EFs (i.e., EF gradients) produce DEP forces on charged, polarizable macromolecules and organelles
(13, 17). These DEP forces could potentially cause molecules to migrate toward or away from the furrow, impeding cell
cleavage (11, 13, 17). Modeling studies incorporating Stokes drag (18), however, suggests that DEP forces are too small to
cause substantial displacement over the course of telophase. Both of these proposed mechanisms also depend on the relative
orientation of the dividing cells and the applied EF. Parallel alignment results in a maximal effect (3, 13, 14).
Recent preclinical studies support additional potential mechanisms and downstream effects, including but not limited
to mitotic checkpoint inhibition (19), tubulin mediated conductance effects (20), permeability changes (21), DNA damage
(22, 23), migratory inhibition (24), and autophagy (24, 25). More recently, Neuhaus et. al (26) suggested voltage-gated calcium
channels and Li et al. (18) suggested tumor cell membrane potential as mediating factors for the anti-proliferative effect of
intermediate frequency EFs. While several biophysical mechanisms are plausible, none have been conclusively demonstrated.
To advance their preclinical research on the use and mechanism(s) of action of “TTFields”, Novocure Ltd. developed an in
vitro test system (Inovitro™) designed to deliver EFs to cell cultures using two pairs of capacitively coupled electrodes insulated
by a high dielectric constant ceramic (3), placed orthogonal to each other inside a cell culture dish (3, 27). The electrode
pairs are connected to a high voltage sinusoidal waveform generator. The stimulated electrode pair is switched periodically to
maximize the orientational efficiency of EF application (3). While contact between the culture dish and electrodes creates a
direct means for EFs to be delivered to cell or tissue cultures, it also results in heat conduction from the electrodes to the dish
and subsequently from the dish to the culture media, making continuous temperature control problematic. Joule or Ohmic
heating from the EFs themselves also significantly contributes to heating of the conductive cell media.
In order to maintain a temperature of 37◦C in the culture dish, EF application with the Inovitro™ device is performed in
an 18 ◦C incubator (28). Electric current limits and on-off operation are also imposed as necessary to maintain temperature
(3, 28). A consequence of keeping the apparatus in this refrigerated environment is a lower surrounding water vapor pressure,
which accelerates cell media evaporation. Assuming 95% relative humidity in the incubator, a loss of about 0.2 mL of media
per day can be expected from a 35 mm diameter dish (see Supp. Sec. 1). As a result, media replacement is required every 24
hours according to procedures for operating the Inovitro™device (2, 28). This rapid media loss and replacement may have
inadvertent confounding effects, such as causing time-varying hyperosmotic bath conditions. Hyperosmotic conditions can
result in nuclear lamina buckling (29), cell cycle disruption (30), or protein aggregation (31). Another issue is that the geometry
2 Manuscript submitted to Biophysical Journal
Induced EMF delivery to cells
of the EF delivery device does not lend itself to easily predicting the electric field or current density produced within the tissue
or cell culture (12, 14).
To overcome some of these limitations associated with delivering EFs via contacting electrodes, here we describe a novel
device that uses electromagnetic induction to deliver EFs/electromagnetic fields (EMFs) in vitro, like those generated by
Transcranial Magnetic Simulation (TMS) devices (32) but in a higher frequency range. More specifically, we propose the use
of an air-core double solenoid coil in an LC resonant circuit to induce intermediate frequency EMF in cell or tissue cultures
placed within the coil. This non-contacting method of EMF delivery thermally isolates the current-carrying coil from the
culture dishes. Temperature uniformity and osmolarity control of the culture medium is improved. Greater power delivery is
made possible, providing potential access to high, previously inaccessible EF amplitudes. Furthermore, the radial, linearly
varying amplitude of the induced circumferential EF within the coil allows each culture dish to be exposed to a known and
well-characterized range of EF amplitudes or “doses”. Induced EMFs represent a promising alternative EF delivery method
for in vitro experimentation and may better elucidate the biophysical mechanisms of action of “TTFields” than the current
state-of-the-art.
MATERIALS AND METHODS
200 kHz induced EMF generation
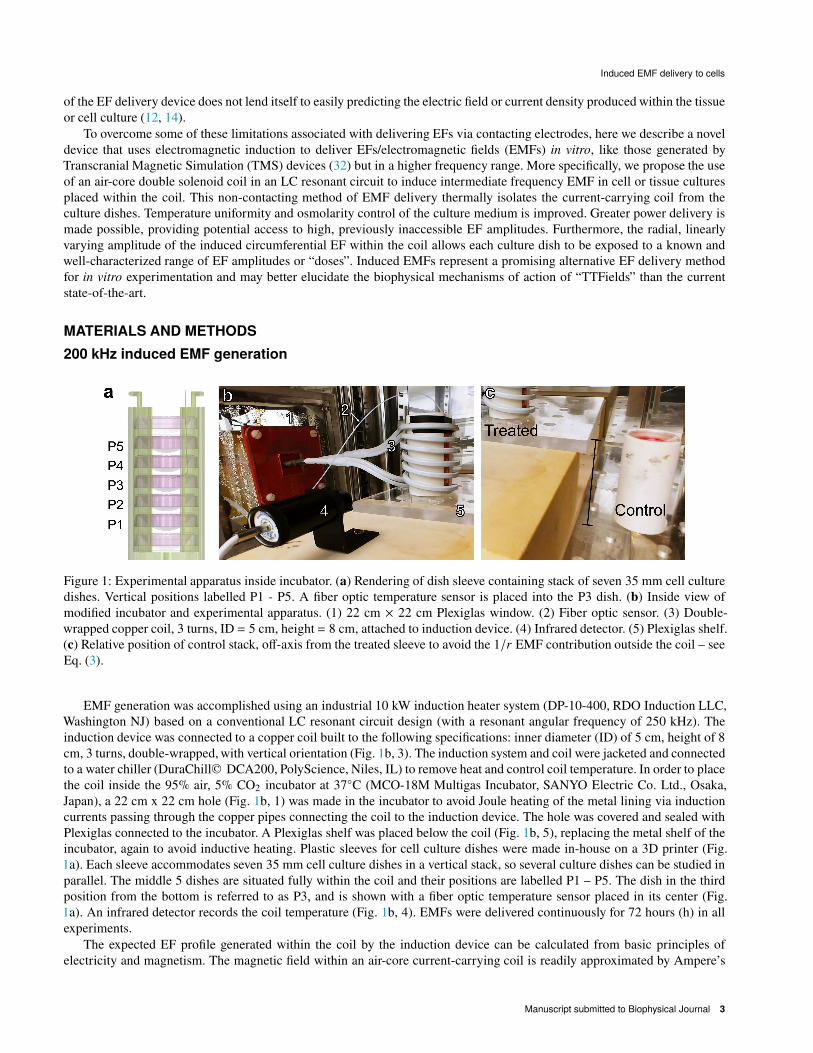
Figure 1: Experimental apparatus inside incubator. (a) Rendering of dish sleeve containing stack of seven 35 mm cell culture
dishes. Vertical positions labelled P1 - P5. A fiber optic temperature sensor is placed into the P3 dish. (b) Inside view of
modified incubator and experimental apparatus. (1) 22 cm × 22 cm Plexiglas window. (2) Fiber optic sensor. (3) Double-
wrapped copper coil, 3 turns, ID = 5 cm, height = 8 cm, attached to induction device. (4) Infrared detector. (5) Plexiglas shelf.
(c) Relative position of control stack, off-axis from the treated sleeve to avoid the 1/A EMF contribution outside the coil – see
Eq. (3).
EMF generation was accomplished using an industrial 10 kW induction heater system (DP-10-400, RDO Induction LLC,
Washington NJ) based on a conventional LC resonant circuit design (with a resonant angular frequency of 250 kHz). The
induction device was connected to a copper coil built to the following specifications: inner diameter (ID) of 5 cm, height of 8
cm, 3 turns, double-wrapped, with vertical orientation (Fig. 1b, 3). The induction system and coil were jacketed and connected
to a water chiller (DuraChill© DCA200, PolyScience, Niles, IL) to remove heat and control coil temperature. In order to place
the coil inside the 95% air, 5% CO2 incubator at 37◦C (MCO-18M Multigas Incubator, SANYO Electric Co. Ltd., Osaka,
Japan), a 22 cm x 22 cm hole (Fig. 1b, 1) was made in the incubator to avoid Joule heating of the metal lining via induction
currents passing through the copper pipes connecting the coil to the induction device. The hole was covered and sealed with
Plexiglas connected to the incubator. A Plexiglas shelf was placed below the coil (Fig. 1b, 5), replacing the metal shelf of the
incubator, again to avoid inductive heating. Plastic sleeves for cell culture dishes were made in-house on a 3D printer (Fig.
1a). Each sleeve accommodates seven 35 mm cell culture dishes in a vertical stack, so several culture dishes can be studied in
parallel. The middle 5 dishes are situated fully within the coil and their positions are labelled P1 – P5. The dish in the third
position from the bottom is referred to as P3, and is shown with a fiber optic temperature sensor placed in its center (Fig.
1a). An infrared detector records the coil temperature (Fig. 1b, 4). EMFs were delivered continuously for 72 hours (h) in all
experiments.
The expected EF profile generated within the coil by the induction device can be calculated from basic principles of
electricity and magnetism. The magnetic field within an air-core current-carrying coil is readily approximated by Ampere’s
Manuscript submitted to Biophysical Journal 3

ACCEPTED
MANUSCRIP
T
Ravin, R. & Cai, T. X.
law,
�I (C) = `0� (C)(#
!
)(1)
where �I (C) is the axial component of the applied magnetic field, B, `0 is the permeability of a vacuum, � is the current
amplitude, # is the number of coil turns, and ! is the length of the coil. The direction of the magnetic field is normal to the
direction of the current and can be determined by the right hand rule as being along the coil axis. Faraday’s law in integral
form relates the magnetic field to the electromotive force, Y,
Y =
∮
;
E · 3l = − 3
3C
∬
(
B · 3S, (2)
where E is the induced EF, S denotes some bounded surface, and 3l is an infinitesimal arc length. If the surface is chosen to be
a circular cross section of the coil with radius A from the center of the coil then the following solutions are obtained for |E(C) |,
|E(A, C) | = |� \ (A, C) | =
( A2
) 3�I (C)3C
= `0
(#
!
) ( A2
) ����3�
3C
���� A < ',
('2
2A
)3�I (C)3C
= `0
(#
!
) ('2
2A
) ����3�
3C
���� A ≥ ',
(3)
where ' is the radius of the coil, and � \ (A, C) is the azimuthal component of the electric field. By symmetry, the other two
components of the electric field vanish. The direction of the EF is anti-parallel to the current flowing in the coils. If the applied
current is sinusoidal, e.g., � (C) = �0 cos(lC), then the induced EF will oscillate at the same frequency in the circumferential
direction. By Eq. (3), our induction system delivering current at 200 kHz results in a circumferential 200 kHz EF profile within
the coil with a linearly increasing amplitude from the center of the coil. Importantly, the radial profile of the generated EFs
makes each treated dish its own “dose titration” experiment, with little to no EFs dose or amplitude in the center of the dish
and high dose at the periphery. The effects of EF amplitude can be isolated from any dish-to-dish experimental confounds by
analyzing radially dependent differences within a single treated dish.
Note, the electric field outside of the coil is expected to decay by 1/A according to Eq. (3). The EF in the incubator outside
the coil is therefore not 0. Because of this decaying EF, the control dish sleeve is placed in the incubator at a distance and
vertical height offset (off axis from the coil) such that little to no EF should be present, as shown in Fig. 1c.
Temperature monitoring and control
Joule heating remains a major hurdle to delivering increased EF amplitudes while maintaining controlled temperatures,
even in the absence of conductive heating from contacting electrodes. Heating of an electrically conductive material by a
spatially-varying EF is described by the power delivered per unit volume
3%
3+= J · E = f |E|2
by J = fE (microscopic Ohm′s Law),(4)
where % is power, + is volume, J is current density, E is the EF, and f is the conductivity of the material. In the case of a
solenoid coil (cylindrical geometry) surrounding some uniform conductive material, the rate of heat generation, ¤@, delivered
by the current-carrying coil to the material of height, !I , can be calculated from the within-coil part of Eq. (3) and Eq. (4) as
¤@ ≡ %total = f
∭
+
|E(A) |2rms 3+ = f
∫!I
0
3I
∫ 2c
0
3\
∫'
0
A |E(A) |2rms 3A =cf!I<
2'4
16, (5)
where∭
+3+ is a volume integral and < is the radial slope of the within-coil part of Eq. (3) using peak-to-peak amplitudes
such that |E(A) |rms = <A/(2√
2),< :=
`0
2
(#
!
) ����3�
3C
����pk−pk
[=] V · m−2, (6)
where rms is the root-mean-square. According to Eqs. (4), (5), and (6), Joule heat generation increases with the square of
the delivered EF amplitude. Thus, delivering higher EF amplitudes while maintaining well-controlled temperatures requires
careful regulation of environmental conditions. Not only does the current-carrying solenoid coil require cooling, the cell
4 Manuscript submitted to Biophysical Journal

Induced EMF delivery to cells
cultures themselves require negative heat flux to the surroundings to balance Joule heating. This negative heat flux is attained
by cooling the coil below the incubator temperature. A complex interplay of incubator temperature, a cooled coil temperature,
and various thermal resistances (Fig. S2, Table S2) determines the steady-state temperature profile within the cell culture
dishes. See Supp. Sec. 2 for a more complete discussion of heat transfer and expected temperature profiles (Figs. S3 – S5).
A data acquisition and analysis system was used to monitor the environmental conditions within the incubator during
experiments. The system can acquire data from as many as four temperature probes and two electric field sensors. The
data acquisition software was developed using LabVIEW (National Instruments, Austin, TX). During operation, the system
collected temperature data from Opsens multi-channel signal conditioners (TempSens TMS-G2-1–100ST-M1, Opsens, Quebec,
Canada). Data from sensors was measured every second and transmitted to the system computer via an RS-232 interface. An
infrared detector was used to monitor the coil temperature. Fiber optic sensors (OTG-A-10-62ST-1, Opsens, Quebec, Canada),
rather than traditional thermistors, were used to measure temperature within the cell media to avoid both inductive heating
effects and any parasitic inductance and capacitance potentially contributed by thermistors. Fiber optic sensors were attached
to dishes (e.g., Fig. 1b, 2) using bone wax (Lukens™ #901, Surgical Specialties, Westwood, MA).
The water chiller set-point and temperature were also monitored and controlled. The water temperature of the chiller was
measured once per second and transmitted to the system computer using an RS-232 interface. The temperature set-point of
the chiller was managed by the controller software and was adjusted based on the fiber optic temperature measurements from
the center of the P3 control dish. When the measured temperature deviated from the desired range, an alarm was triggered
and the set-point temperature of the water chiller was adjusted remotely via open-loop control. The status of the system was
monitored remotely using a cloud service (Blynk Inc., New York, NY). The LabVIEW software communicated with the Blynk
cloud service to transmit real-time data. A Blynk cellphone app was used to receive data from the Blynk cloud and provide
the status of the ongoing experiment. The app also had the ability to transmit data through the Blynk cloud to remotely adjust
the chiller set-point in real-time in order to maintain stable temperature conditions throughout 72 h experiments.
Osmolarity regulation
Cooler air near the dishes can result in accelerated loss of media due to water vapor pressure gradients (see Supp. Sec. 1). As
a result, osmolarity can change over the course of experiments. We opted to take two preparatory steps to mitigate osmolarity
changes, as opposed to replacing cell media during the course of the experiment. First, we used 3 mL of media rather than
the conventional 2 mL; increasing the total volume decreases the proportion of media lost. Second, we shaped the lids of all
dishes by heating the lids with a heat gun, placing them on a sharpened ring mold, and depressing them while malleable with
a steel ball. The end result was a curved or domed lid that is partially submerged in the media. This lid shape mitigated media
loss primarily by decreasing the exposed liquid surface area and thus the area undergoing mass transport with the surrounding
air (Fig. S1). The lid also directs condensate back into the media volume. These changes reduced the predicted osmolarity
change by over 60% (Table S1). Note, increased media volume and decreased exposed surface area should not affect dissolved
gas (O2, CO2, etc.) concentrations in media. According to Henry’s law, a dissolved gas in liquid is only a function of the
partial pressure of the gas above the liquid and temperature, which are both unchanged by these modifications. Osmolarity
measurements with a Vapro 5520 vapor pressure osmometer (Wescor, Logan, UT) were used to experimentally validate the
efficacy of these regulation measures.
Human thyroid cell culture
We used a human thyroid cell line (Nthy-ori 3-1 Sigma, Sigma-Aldrich, St. Louis, MO) as an exemplar test cell culture system.
Cells were infected with lentivirus green fluorescent protein (GFP) and selected for high expression of GFP over several cycles.
Cells were maintained in 75ml flasks in DMEM media (Gibco, Thermo Fisher Scientific, Waltham, MA) supplemented with
10% FBS (Gibco), 1% Penicillin Streptomycin (Gibco). GFP-expressing cells were passaged twice a week and cell cultures
were maintained in a 95% air, 5% CO2 incubator at 37◦C. Before each 72 h experiment, cells were detached from the culture
vessel with Accutase© (Sigma-Aldrich) and re-suspended in media at a density of 3.33×10⁴ cells/ml. 3 ml of cell suspension
was placed in each 35 mm culture dish (Corning, Falcon) for a plating density of 1×10⁵ cells per dish. Dishes were previously
coated with Poly-D-Lysine to enhance attachment. Dishes were incubated for 24 h to allow for attachment prior to 72 h
experiments. Markings were made on the external part of the dishes – consistent relative to manufacturer markings – to keep
the orientation of dishes consistent during treatment and imaging.
A series of cell counting calibration experiments using different initial seeding densities ranging from 3×10⁴ to 1.2×10⁵
cells per dish were also performed. Cells were again detached with Accutase© , plated at different densities, incubated for 24
h, and then incubated for an additional 72 h. At the end of 72 h, the cell culture dishes were scanned using confocal imaging,
described below, and all cells were subsequently lifted and counted using a Countess™ II FL Automated Cell Counter (Thermo
Manuscript submitted to Biophysical Journal 5

ACCEPTED
MANUSCRIP
T
Ravin, R. & Cai, T. X.
Fisher). Final cell densities ranged from ∼ 100 to 1200 cells/sq. mm. 3 series of calibration experiments were performed for a
total of 56 cell counts and images. Results from these calibration experiments were used to relate imaging observables to the
experimental cell counts.
In situ confocal imaging and ethidium homodimer-1 and propidium iodide staining
A unique challenge of the study design is the presence of a radial dependence in the experimental conditions. This radial
dependence precluded more obvious approaches like lifting and counting all cells and informed our choice to use GFP-
expressing cells. Entire dishes were imaged in situ to retain radial information, i.e., what EF amplitude treated cells experienced
during the 72 h EMF application. Stitched images were acquired and analyzed.
At the end of experiments, sleeves with dishes were removed from the coil and dishes were gently removed from the
sleeves so as not detach cells. Orientation information was retained using dish markings. All dishes were incubated until
imaged. The dishes were mounted to the stage of a Zeiss LSM 780 laser scanning confocal microscope system. For imaging,
an EC Plan-NeoFluor 5x, 0.16 N.A. was used. All the visible parts of the 35 mm culture dish were imaged using stitching
mode, stitching 484 areas of interest with 5% overlap. The final image size was 10, 726× 10, 726 pixels (px). For GFP, a 488
nm excitation wavelength, a beam splitter of 488/562 nm, and emission filters of 500 - 555 nm were used. Special care was
taken to use non-saturating parameters. Imaging parameters were kept constant across dishes and experiments.
In 4 experiments, additional ethidium homodimer-1 (E1169, Thermo Fisher) (EthD-1) and propidium iodide (V13241,
Thermo Fisher) (PI) staining was performed following GFP imaging. For PI, at the end of EF application and 5 minutes prior
to microscope imaging, 750 `L of DMEM was removed from the dishes and mixed with 0.5 `L of 1 mg/mL stock solution
and added back to the dish to a final concentration of 2 × 10⁻⁴ mg/mL. This procedure was used to avoid agitating all media
in the dish and losing spatial information on floating, or incompletely adhered cells. For EthD-1, an identical procedure was
performed but for a final concentration of 0.4 `M. No additional washes were performed to avoid loss of the floating cell
population. For both PI and EthD-1, a 561 nm excitation wavelength and emission filters of 578 -739 nm were used. Stitching
was identical.
Image processing
Two populations were visible in images of the GFP-expressing thyroid cells: a brighter, high fluorescence population, which
might correspond to cellular debris, mitotic cells, pre-apoptotic cells, or a rounded cell morphology; and a dim, lower
fluorescence population that corresponds to attached cells. The primary population of interest is the attached cell population.
Therefore, one goal of image processing is to segment these bright and dim px populations for downstream analyses. This
segmentation was performed in 3 steps: contrast enhancement and denoising (e.g., Fig. 2a and b, Fig. S7), 3-level intensity
thresholding (Figs. 2c, Fig. S8), and classification error correction (Fig. 2d, Fig. S9), outlined below. EthD-1 and PI staining
images underwent a simpler procedure of contrast enhancement and denoising (Figs. 2e and f) followed by 2-level intensity
thresholding (Fig. 2g) and size thresholding (Fig. 2h) to identify stained dead cells. See Supp. Sec. 3 for more details and
MATLAB code. After processing, images were binned radially (Fig. 2i) to encode radial information in the analysis. Edge
regions and dish regions occluded by fitments were excluded. The image processing pipeline is summarized in Fig. 2.
Contrast enhancement and denoising
The contrast enhancement step (Figs. 2b and f, Fig. S7, Supp. Sec. 3.1) was based on a morphological transform method
(33, 34) (Supp. Sec. 3). An image, �, can be contrast enhanced by computing
�Enhanced = � + [� − (� ◦ �)] − [(� • �) − �] (7)
where � is a structuring element, ◦ denotes an opening operation, and • denotes a closing operation. Opening is erosion
followed by dilation while closing is dilation followed by erosion. The middle term on the right-hand side of Eq. (7) is a
‘top hat’ of the original image, weighted to brighter regions, and the rightmost term is a ‘bottom hat’, weighted to darker
regions. Morphological contrast enhancement can therefore be conceptualized as ‘adding’ to bright regions, and ‘subtracting’
from dark regions (33). All images underwent morphological contrast enhancement using a ‘disk’ shaped structuring element
with a 3 px radius. Operations were performed using MATLAB 2019a (MathWorks, Natick, MA) and the imtophat() and
imbottomhat() functions found in the Image Processing Toolbox. After contrast enhancement, a denoising step was performed
with a 3×3 Wiener filter. Identical contrast enhancement and denoising was performed for all GFP, EthD-1, and PI images.
6 Manuscript submitted to Biophysical Journal

Induced EMF delivery to cells
Figure 2: Overview of image processing pipeline. (a - d) Processing of GFP images. (a) Raw image. (b) Contrast enhanced image.
(c) Segmented image using 3-level intensity thresholding prior to corrections. (cyan arrow) Example of “spot” classification
error. (green arrow) Example of “halo” classification error. (d) Segmented image after corrections, demonstrating good
agreement with qualitative segmentation of (a). (e - h) Processing of PI and EthD-1 images. (e) Raw image. (f) Contrast
enhanced image. (g) Segmented image using 2-level intensity thresholding. (h) Counted particles or cells based on size
thresholding. (i) Schematic representation of radial binning and exclusion of occluded regions on an example stitched dish
image. Shaded region is included. Image has been linearly contrast enhanced ([0.01, 0.2] → [0.1, 1]) and down sampled to
20% resolution to aid visualization.
Segmentation via thresholding
To segment the contrast enhanced GFP image, two intensity thresholds were needed: a lower threshold to separate the
background and dim px population and an upper threshold to separate the bright and dim px populations (Supp. Sec. 3.2).
The upper threshold (0.3727) was selected by applying Otsu’s method (35) with 3 clusters to intensity histograms drawn
from a central region of all control dish images from positions P2, P4, and P5 and then taking the average of the larger
of the two returned intensity thresholds. The lower intensity threshold (0.0635) was selected by first filtering the contrast
enhanced and denoised image region using a 3 × 3 matrix of ones, i.e., a standard deviation filter. The filtered image was then
thresholded using Otsu’s method with 2 clusters. The px population with intermediate standard deviation values was identified
as corresponding to attached cell edges (Fig. S8a). An intensity threshold was then selected such that no more than 25% of
the identified edges were excluded by the threshold (Fig. S8c). This process was repeated for all central regions of P2, P4, and
P5 control dish images. The averages of the selected lower and upper intensity thresholds (Fig. S10) were used for all images
(e.g., Fig. 2c, Fig. S9).
To segment the contrast enhanced EthD-1 and PI images, Otsu’s method was used to generate a single intensity threshold.
After quantizing (see Fig. 2g), contiguous regions larger than 3 px and smaller than 50 px were counted as stained cells (Fig.
2h).
Classification error correction
After applying thresholds and quantizing filters to cluster the GFP image into background, dim, and bright populations, two
types of classification errors were corrected (Supp. Sec. 3.3, Fig. S9). The first was a “halo” effect around bright regions caused
by intensity drop-off such that the edges of bright regions were incorrectly classified as dim px. The second was a “spot” effect
in the center of dim regions caused by intensity peaks. To correct the first type of error, all bright regions exceeding 8 px in size
with a surrounding px population of at least 60% dim px were expanded by one px layer to fill the surrounding dim px (Figs.
2c and d, green arrow), i.e., a flood fill. To correct the second type of error, all small bright regions (< 8 px) that were fully
enclosed by dim px were converted to dim px (Figs. 2c and d, cyan arrow). Two passes of these corrections were performed.
Radial binning and exclusion
Data was analyzed as a function of radius by constructing radial bins or bands. For GFP images, an arbitrary number of
equal annular width bands, 25, was used to divide the total image area starting from the dish center. The choice of band
Manuscript submitted to Biophysical Journal 7

ACCEPTED
MANUSCRIP
T
Ravin, R. & Cai, T. X.
number results in approximately 0.72 mm wide bands. The bottom portion of the dish is occluded by a fitment and also shows
irregularities. To avoid this area, only an upper portion of the band was kept from band 17 and on. The edge of the dish was
also excluded due to irregularities and observed temperature differences: bands 23 – 25 were discarded from all analyses (Fig.
2i). For the EthD-1 and PI stained images, a similar binning procedure with 12 bands of approximately 1.46 mm annular wide
was used, with exclusion of lower regions after band 8, and a complete exclusion from band 10 onward.
Study design
In each experiment, 10 dishes were simultaneously seeded. Dishes were then randomized to either the control or treated dish
sleeve/stack. Pairs of dishes were assigned to the same height position (P1 – P5). For the dishes assigned to P3, one dish is
discarded and a dish with only media is used to continuously probe temperature in the treated dish sleeve. After 24 h incubation
followed by 72 h of incubation and continuous 200 kHz induced EMF application to the treated dish sleeve, dishes were imaged
and processed as described. Using data from cell counting calibration experiments, the imaged dim px density was related
to cell density using an empirical fit, shown later. Each treated dish’s radially dependent cell density was normalized to its
position matched (e.g., P2 treated vs. P2 control) control dish. In 4 experiments, additional PI and EthD-1 staining, imaging,
and image processing was performed to clarify the role of cell death in results.
Each experiment generated 3 replicates of dish pairs at P2, P4, and P5. Pairs of dishes assigned to P1 were discarded from
all analyses due to a substantial temperature difference, discussed later. Each dish pair was treated as a single experimental
observation of the effect of 200 kHz EFs. Data from Kirson et al. (3) suggest that treatment of proliferating human cells with
an EF of 200 kHz and 1 V/cm results in a decrease of roughly 20 ± 10% in cell number after 72 h compared to untreated
cells. Presuming an effect of this magnitude, 18 replicates are needed to obtain a conservative statistical power of 0.95 and a
confidence level of U = 0.01. 12 experiments were performed using our system, resulting in # = 36 replicates. In 2 of these
experiments (6 replicates), PI staining and imaging was performed after primary imaging. In 2 other experiments, EthD-1
staining and imaging was performed for a total of = = 12 out of 36 replicates assessing cell death.
Statistical analysis and methods
All statistical analyses were performed in R 3.6.2. The linear fit for the experimentally measured EF amplitude was performed
using the typical linear least squares (lm) approach. The bounded exponential fit for dim px density vs. cell density calibration
(of the form: [Dim Px Density] ∼ 1− exp {V1 × [Cell Density] + V0}) was performed using the Gauss-Newton nonlinear least
squares (nls) approach. Initial guesses of V1 = −0.001 and V2 = 0 were provided. Bootstrapping for 95% confidence intervals
was performed using the bias-corrected and accelerated (BCa) approach provided in the R boot package (ver. 1.3-24). For
bootstrapping, 1000 re-samplings were performed, following convention. Two-sample independent C-tests were performed
using the base R t.test function assuming unequal variances, i.e., Welch’s C-test.
RESULTS
Delivery of 200 kHz EFs up to ∼ 6.5 V/cm pk-pk to cell cultures via induced EMFs
Figure 3: Measurements of EF amplitude as a function of pickup coil radius/radial distance at different dish stack positions.
Black line is a zero-intercept linear least squares fit using data from all positions ([EF Amplitude] = 4.242 × [Radial Distance],
Std. Error = 0.071, Adj. R2 = 0.9902, p < 0.001).
The EF amplitude and frequency delivered to the treated dish sleeve were measured using pickup coils (i.e., loops) of
8 Manuscript submitted to Biophysical Journal
Induced EMF delivery to cells
several different radii composed of insulated twisted wire pairs to minimize stray inductance. These pickup loops were hot
glued to dishes, aligned centrally, and placed within the sleeve. The generated peak-to-peakvoltage (Vpk−pk) was measured with
a two-channel oscilloscope (Hantek6022BL, Hantek Electronic Co., Ltd., Qingdao, China) and EF amplitude was determined
by |E| = Vpk−pk/(2cA) where A is the loop radius. Results from these measurements are shown in Fig. 3, and agree with
the expected linear EF amplitude profile predicted within the coil from Eq. (3). 200 kHz oscillation was also observed in all
measurements, confirming the linearity of the system. Note, EF amplitudes throughout refer to pk-pk values. We obtained a
maximal EF amplitude of ∼ 6 – 7 V/cm at the periphery of the dish with a power level of 3.19 kW. The power level is a
consequence of 220 VAC operation and the inductive load of the culture dishes and fixture system. We report a method of
delivering EFs with a large dynamic amplitude range and well-characterized amplitude profile.
Temperature and osmolarity control during 72 h continuous 200 kHz EMF delivery
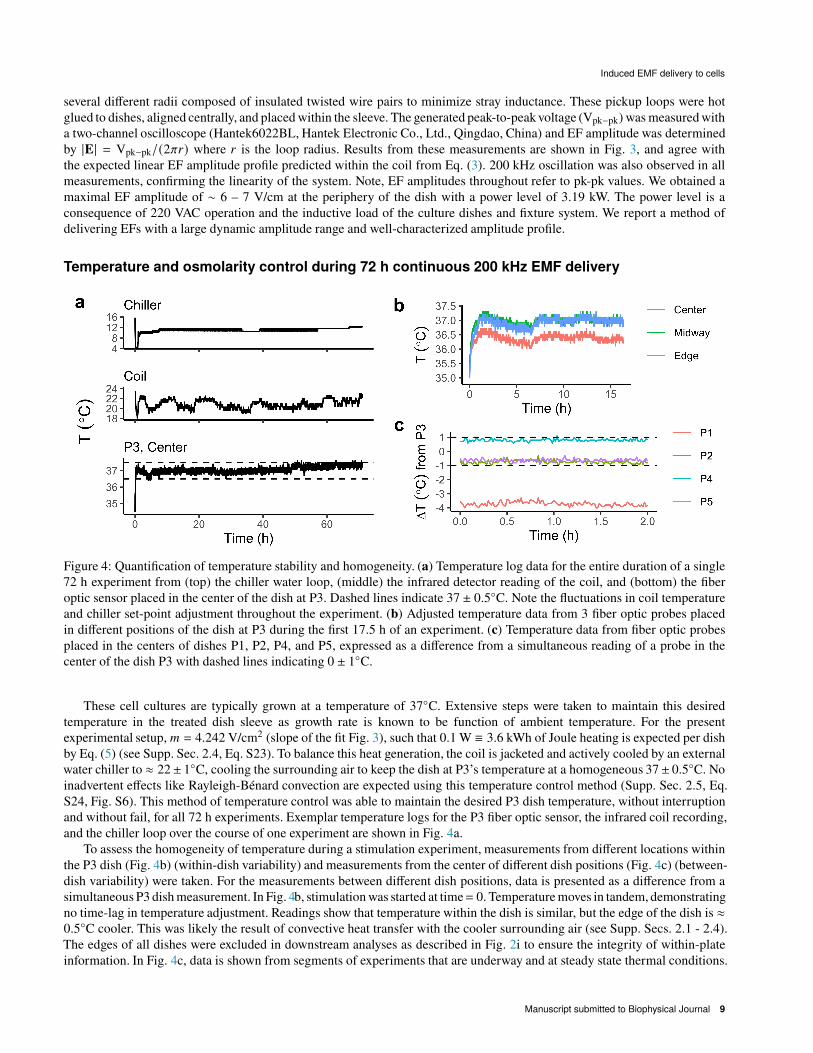
Figure 4: Quantification of temperature stability and homogeneity. (a) Temperature log data for the entire duration of a single
72 h experiment from (top) the chiller water loop, (middle) the infrared detector reading of the coil, and (bottom) the fiber
optic sensor placed in the center of the dish at P3. Dashed lines indicate 37 ± 0.5◦C. Note the fluctuations in coil temperature
and chiller set-point adjustment throughout the experiment. (b) Adjusted temperature data from 3 fiber optic probes placed
in different positions of the dish at P3 during the first 17.5 h of an experiment. (c) Temperature data from fiber optic probes
placed in the centers of dishes P1, P2, P4, and P5, expressed as a difference from a simultaneous reading of a probe in the
center of the dish P3 with dashed lines indicating 0 ± 1◦C.
These cell cultures are typically grown at a temperature of 37◦C. Extensive steps were taken to maintain this desired
temperature in the treated dish sleeve as growth rate is known to be function of ambient temperature. For the present
experimental setup, < = 4.242 V/cm2 (slope of the fit Fig. 3), such that 0.1 W ≡ 3.6 kWh of Joule heating is expected per dish
by Eq. (5) (see Supp. Sec. 2.4, Eq. S23). To balance this heat generation, the coil is jacketed and actively cooled by an external
water chiller to ≈ 22± 1◦C, cooling the surrounding air to keep the dish at P3’s temperature at a homogeneous 37± 0.5◦C. No
inadvertent effects like Rayleigh-Bénard convection are expected using this temperature control method (Supp. Sec. 2.5, Eq.
S24, Fig. S6). This method of temperature control was able to maintain the desired P3 dish temperature, without interruption
and without fail, for all 72 h experiments. Exemplar temperature logs for the P3 fiber optic sensor, the infrared coil recording,
and the chiller loop over the course of one experiment are shown in Fig. 4a.
To assess the homogeneity of temperature during a stimulation experiment, measurements from different locations within
the P3 dish (Fig. 4b) (within-dish variability) and measurements from the center of different dish positions (Fig. 4c) (between-
dish variability) were taken. For the measurements between different dish positions, data is presented as a difference from a
simultaneous P3 dish measurement. In Fig. 4b, stimulation was started at time= 0. Temperature moves in tandem, demonstrating
no time-lag in temperature adjustment. Readings show that temperature within the dish is similar, but the edge of the dish is ≈0.5◦C cooler. This was likely the result of convective heat transfer with the cooler surrounding air (see Supp. Secs. 2.1 - 2.4).
The edges of all dishes were excluded in downstream analyses as described in Fig. 2i to ensure the integrity of within-plate
information. In Fig. 4c, data is shown from segments of experiments that are underway and at steady state thermal conditions.
Manuscript submitted to Biophysical Journal 9

ACCEPTED
MANUSCRIP
T
Ravin, R. & Cai, T. X.
Temperature measurements from the centers of P2, P4, and P5 remained within 1◦C of measurements from the center of P3 and
were stable. Measurements from the center of P1, however, were several ◦C cooler and so P1 was excluded from all analyses.
Overall, temperature control was satisfactory and allowed us to retain most data with confidence that temperature differences
were minimal and unlikely to contribute to observed differences between experimental conditions.
Figure 5: Quantification of osmolarity regulation improvements. (a) Lid shaping process with steel ball impressing a pre-heated
lid placed on a sharpened ring mold. Note exposed surface area reduction in shaped lid. (b) Osmolarity changes after a 72 h
experiment in different conditions and configurations with 3 repetitions. Error bars = ±1 SD.
Osmolarity was measured after a 72 h experiment for control and treated dishes in 3 different dish configurations: (1) flat
lid, 2 mL media, (2) flat lid, 3 mL media, and (3) curved lid, 3 mL media, to quantify the efficacy of the described mitigation
methods (Fig. 5, Table S1). 3 repetitions of each condition (P2, P4, P5 from one experiment) were performed. No cells were
present in the media during these osmolarity experiments. Results in Fig. 5b are expressed as a percentage change from the
measured initial average osmolarity of 314 mOsm. The combined mitigation techniques reduced the osmolarity increase in
the treated condition from about 39% to 17% and in the control condition from about 10% to 6.5% (Supp. Sec. 1, Eq. S10).
The reduction in osmolarity increase translated to a final osmolarity of about 370 mOsm in the treated condition compared to
about 335 mOsm for the control condition. The mitigation was imperfect but nonetheless a marked improvement from a final
osmolarity of about 440 mOsm in the unmitigated, treated condition.
Estimating counted cell density using segmented px density obtained via in situ imaging of
GFP-expressing thyroid cells
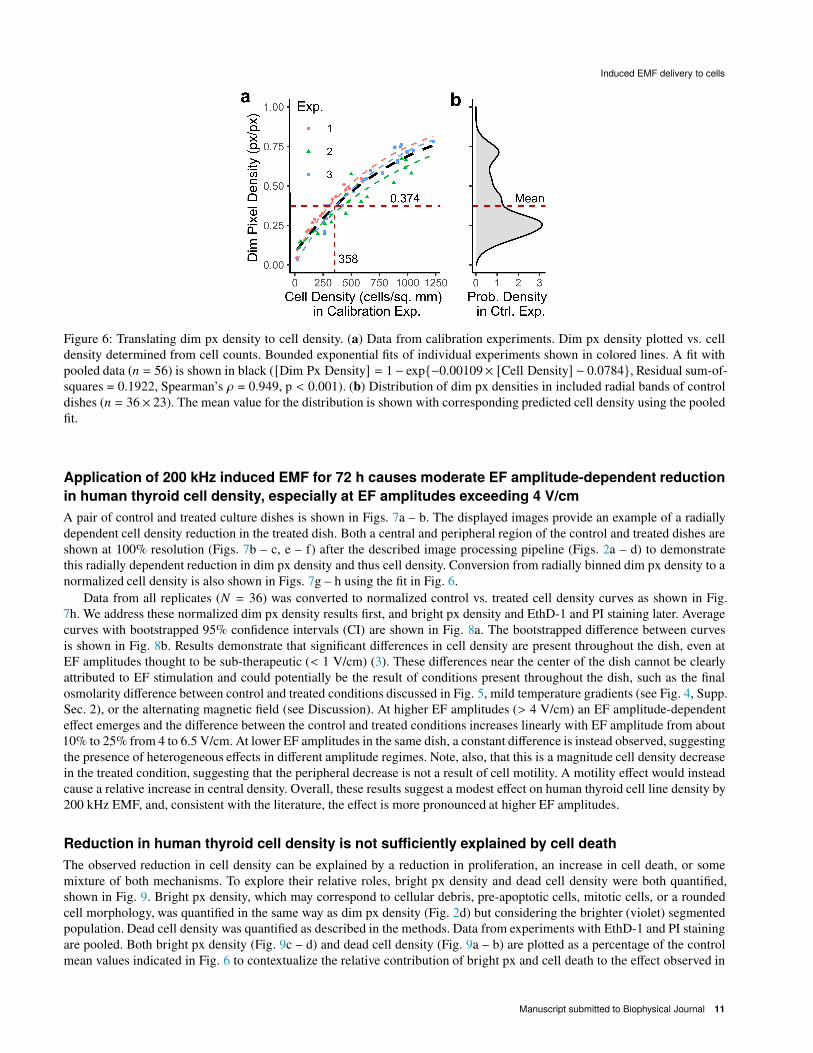
GFP images from calibration experiments were processed as described in Fig. 2. Data from these calibration experiments
is expressed as total (whole dish) dim px density (px/px) vs. cell count per area (cells/sq. mm) in Fig. 6a. Grouped data
corresponded well to a bounded exponential fit, allowing for the robust conversion of px densities to approximate cell densities.
The bounded exponential form of the fit may arise due to changes in the size and morphology of thyroid cells as they
approach confluence. To demonstrate that our ‘calibration curve’ was valid for the range of data observed, a probability density
distribution of dim px densities in all included radial bands of all P2, P4, and P5 control dishes is shown alongside the fit
(Fig. 6b). Observed dim px densities fell within the range of the calibration curve. The mean value of this distribution is also
indicated. The mean dim px density is 0.374 and the corresponding cell density from the fit is 358 cells/sq. mm.
10 Manuscript submitted to Biophysical Journal
Induced EMF delivery to cells
Figure 6: Translating dim px density to cell density. (a) Data from calibration experiments. Dim px density plotted vs. cell
density determined from cell counts. Bounded exponential fits of individual experiments shown in colored lines. A fit with
pooled data (= = 56) is shown in black ([Dim Px Density] = 1− exp{−0.00109× [Cell Density] − 0.0784}, Residual sum-of-
squares = 0.1922, Spearman’s d = 0.949, p < 0.001). (b) Distribution of dim px densities in included radial bands of control
dishes (= = 36× 23). The mean value for the distribution is shown with corresponding predicted cell density using the pooled
fit.
Application of 200 kHz induced EMF for 72 h causes moderate EF amplitude-dependent reduction
in human thyroid cell density, especially at EF amplitudes exceeding 4 V/cm
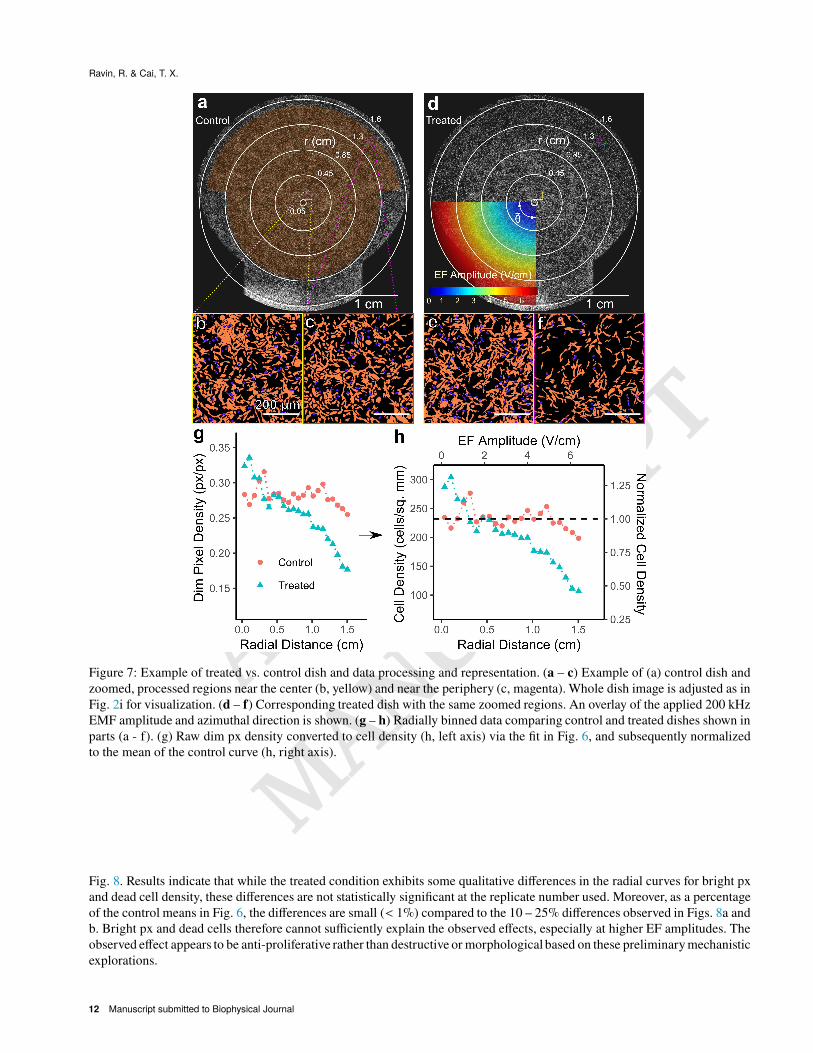
A pair of control and treated culture dishes is shown in Figs. 7a – b. The displayed images provide an example of a radially
dependent cell density reduction in the treated dish. Both a central and peripheral region of the control and treated dishes are
shown at 100% resolution (Figs. 7b – c, e – f) after the described image processing pipeline (Figs. 2a – d) to demonstrate
this radially dependent reduction in dim px density and thus cell density. Conversion from radially binned dim px density to a
normalized cell density is also shown in Figs. 7g – h using the fit in Fig. 6.
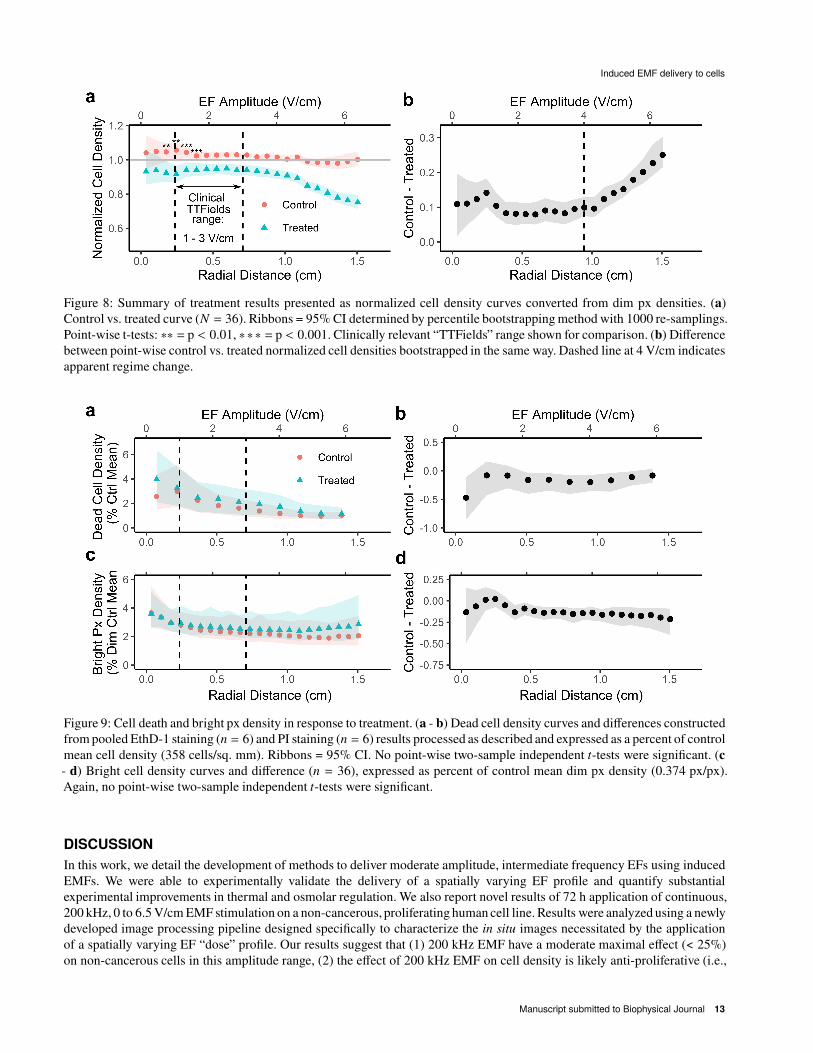
Data from all replicates (# = 36) was converted to normalized control vs. treated cell density curves as shown in Fig.
7h. We address these normalized dim px density results first, and bright px density and EthD-1 and PI staining later. Average
curves with bootstrapped 95% confidence intervals (CI) are shown in Fig. 8a. The bootstrapped difference between curves
is shown in Fig. 8b. Results demonstrate that significant differences in cell density are present throughout the dish, even at
EF amplitudes thought to be sub-therapeutic (< 1 V/cm) (3). These differences near the center of the dish cannot be clearly
attributed to EF stimulation and could potentially be the result of conditions present throughout the dish, such as the final
osmolarity difference between control and treated conditions discussed in Fig. 5, mild temperature gradients (see Fig. 4, Supp.
Sec. 2), or the alternating magnetic field (see Discussion). At higher EF amplitudes (> 4 V/cm) an EF amplitude-dependent
effect emerges and the difference between the control and treated conditions increases linearly with EF amplitude from about
10% to 25% from 4 to 6.5 V/cm. At lower EF amplitudes in the same dish, a constant difference is instead observed, suggesting
the presence of heterogeneous effects in different amplitude regimes. Note, also, that this is a magnitude cell density decrease
in the treated condition, suggesting that the peripheral decrease is not a result of cell motility. A motility effect would instead
cause a relative increase in central density. Overall, these results suggest a modest effect on human thyroid cell line density by
200 kHz EMF, and, consistent with the literature, the effect is more pronounced at higher EF amplitudes.
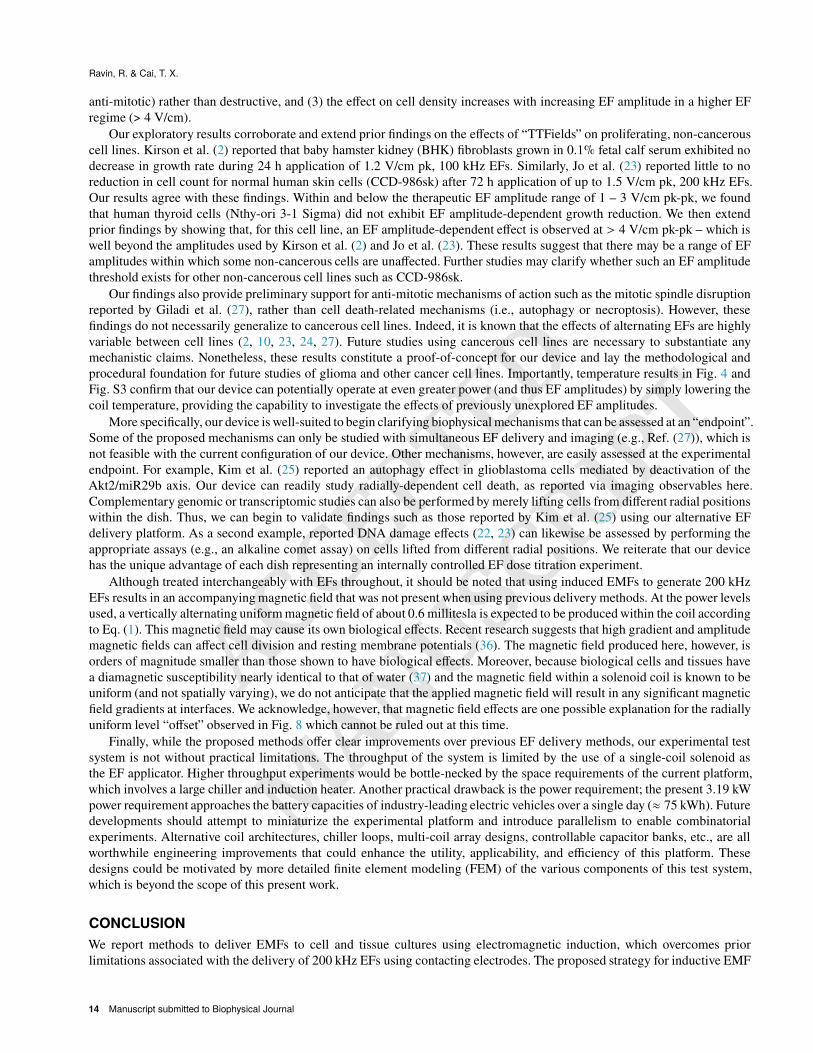
Reduction in human thyroid cell density is not sufficiently explained by cell death
The observed reduction in cell density can be explained by a reduction in proliferation, an increase in cell death, or some
mixture of both mechanisms. To explore their relative roles, bright px density and dead cell density were both quantified,
shown in Fig. 9. Bright px density, which may correspond to cellular debris, pre-apoptotic cells, mitotic cells, or a rounded
cell morphology, was quantified in the same way as dim px density (Fig. 2d) but considering the brighter (violet) segmented
population. Dead cell density was quantified as described in the methods. Data from experiments with EthD-1 and PI staining
are pooled. Both bright px density (Fig. 9c – d) and dead cell density (Fig. 9a – b) are plotted as a percentage of the control
mean values indicated in Fig. 6 to contextualize the relative contribution of bright px and cell death to the effect observed in
Manuscript submitted to Biophysical Journal 11
ACCEPTED
MANUSCRIP
T
Ravin, R. & Cai, T. X.
Figure 7: Example of treated vs. control dish and data processing and representation. (a – c) Example of (a) control dish and
zoomed, processed regions near the center (b, yellow) and near the periphery (c, magenta). Whole dish image is adjusted as in
Fig. 2i for visualization. (d – f) Corresponding treated dish with the same zoomed regions. An overlay of the applied 200 kHz
EMF amplitude and azimuthal direction is shown. (g – h) Radially binned data comparing control and treated dishes shown in
parts (a - f). (g) Raw dim px density converted to cell density (h, left axis) via the fit in Fig. 6, and subsequently normalized
to the mean of the control curve (h, right axis).
Fig. 8. Results indicate that while the treated condition exhibits some qualitative differences in the radial curves for bright px
and dead cell density, these differences are not statistically significant at the replicate number used. Moreover, as a percentage
of the control means in Fig. 6, the differences are small (< 1%) compared to the 10 – 25% differences observed in Figs. 8a and
b. Bright px and dead cells therefore cannot sufficiently explain the observed effects, especially at higher EF amplitudes. The
observed effect appears to be anti-proliferative rather than destructive or morphological based on these preliminary mechanistic
explorations.
12 Manuscript submitted to Biophysical Journal
Induced EMF delivery to cells
Figure 8: Summary of treatment results presented as normalized cell density curves converted from dim px densities. (a)
Control vs. treated curve (# = 36). Ribbons = 95% CI determined by percentile bootstrapping method with 1000 re-samplings.
Point-wise t-tests: ∗∗ = p < 0.01, ∗∗∗ = p < 0.001. Clinically relevant “TTFields” range shown for comparison. (b) Difference
between point-wise control vs. treated normalized cell densities bootstrapped in the same way. Dashed line at 4 V/cm indicates
apparent regime change.
Figure 9: Cell death and bright px density in response to treatment. (a - b) Dead cell density curves and differences constructed
from pooled EthD-1 staining (= = 6) and PI staining (= = 6) results processed as described and expressed as a percent of control
mean cell density (358 cells/sq. mm). Ribbons = 95% CI. No point-wise two-sample independent C-tests were significant. (c
- d) Bright cell density curves and difference (= = 36), expressed as percent of control mean dim px density (0.374 px/px).
Again, no point-wise two-sample independent C-tests were significant.
DISCUSSION
In this work, we detail the development of methods to deliver moderate amplitude, intermediate frequency EFs using induced
EMFs. We were able to experimentally validate the delivery of a spatially varying EF profile and quantify substantial
experimental improvements in thermal and osmolar regulation. We also report novel results of 72 h application of continuous,
200 kHz, 0 to 6.5 V/cm EMF stimulation on a non-cancerous, proliferating human cell line. Results were analyzed using a newly
developed image processing pipeline designed specifically to characterize the in situ images necessitated by the application
of a spatially varying EF “dose” profile. Our results suggest that (1) 200 kHz EMF have a moderate maximal effect (< 25%)
on non-cancerous cells in this amplitude range, (2) the effect of 200 kHz EMF on cell density is likely anti-proliferative (i.e.,
Manuscript submitted to Biophysical Journal 13
ACCEPTED
MANUSCRIP
T
Ravin, R. & Cai, T. X.
anti-mitotic) rather than destructive, and (3) the effect on cell density increases with increasing EF amplitude in a higher EF
regime (> 4 V/cm).
Our exploratory results corroborate and extend prior findings on the effects of “TTFields” on proliferating, non-cancerous
cell lines. Kirson et al. (2) reported that baby hamster kidney (BHK) fibroblasts grown in 0.1% fetal calf serum exhibited no
decrease in growth rate during 24 h application of 1.2 V/cm pk, 100 kHz EFs. Similarly, Jo et al. (23) reported little to no
reduction in cell count for normal human skin cells (CCD-986sk) after 72 h application of up to 1.5 V/cm pk, 200 kHz EFs.
Our results agree with these findings. Within and below the therapeutic EF amplitude range of 1 – 3 V/cm pk-pk, we found
that human thyroid cells (Nthy-ori 3-1 Sigma) did not exhibit EF amplitude-dependent growth reduction. We then extend
prior findings by showing that, for this cell line, an EF amplitude-dependent effect is observed at > 4 V/cm pk-pk – which is
well beyond the amplitudes used by Kirson et al. (2) and Jo et al. (23). These results suggest that there may be a range of EF
amplitudes within which some non-cancerous cells are unaffected. Further studies may clarify whether such an EF amplitude
threshold exists for other non-cancerous cell lines such as CCD-986sk.
Our findings also provide preliminary support for anti-mitotic mechanisms of action such as the mitotic spindle disruption
reported by Giladi et al. (27), rather than cell death-related mechanisms (i.e., autophagy or necroptosis). However, these
findings do not necessarily generalize to cancerous cell lines. Indeed, it is known that the effects of alternating EFs are highly
variable between cell lines (2, 10, 23, 24, 27). Future studies using cancerous cell lines are necessary to substantiate any
mechanistic claims. Nonetheless, these results constitute a proof-of-concept for our device and lay the methodological and
procedural foundation for future studies of glioma and other cancer cell lines. Importantly, temperature results in Fig. 4 and
Fig. S3 confirm that our device can potentially operate at even greater power (and thus EF amplitudes) by simply lowering the
coil temperature, providing the capability to investigate the effects of previously unexplored EF amplitudes.
More specifically, our device is well-suited to begin clarifying biophysical mechanisms that can be assessed at an “endpoint”.
Some of the proposed mechanisms can only be studied with simultaneous EF delivery and imaging (e.g., Ref. (27)), which is
not feasible with the current configuration of our device. Other mechanisms, however, are easily assessed at the experimental
endpoint. For example, Kim et al. (25) reported an autophagy effect in glioblastoma cells mediated by deactivation of the
Akt2/miR29b axis. Our device can readily study radially-dependent cell death, as reported via imaging observables here.
Complementary genomic or transcriptomic studies can also be performed by merely lifting cells from different radial positions
within the dish. Thus, we can begin to validate findings such as those reported by Kim et al. (25) using our alternative EF
delivery platform. As a second example, reported DNA damage effects (22, 23) can likewise be assessed by performing the
appropriate assays (e.g., an alkaline comet assay) on cells lifted from different radial positions. We reiterate that our device
has the unique advantage of each dish representing an internally controlled EF dose titration experiment.
Although treated interchangeably with EFs throughout, it should be noted that using induced EMFs to generate 200 kHz
EFs results in an accompanying magnetic field that was not present when using previous delivery methods. At the power levels
used, a vertically alternating uniform magnetic field of about 0.6 millitesla is expected to be produced within the coil according
to Eq. (1). This magnetic field may cause its own biological effects. Recent research suggests that high gradient and amplitude
magnetic fields can affect cell division and resting membrane potentials (36). The magnetic field produced here, however, is
orders of magnitude smaller than those shown to have biological effects. Moreover, because biological cells and tissues have
a diamagnetic susceptibility nearly identical to that of water (37) and the magnetic field within a solenoid coil is known to be
uniform (and not spatially varying), we do not anticipate that the applied magnetic field will result in any significant magnetic
field gradients at interfaces. We acknowledge, however, that magnetic field effects are one possible explanation for the radially
uniform level “offset” observed in Fig. 8 which cannot be ruled out at this time.
Finally, while the proposed methods offer clear improvements over previous EF delivery methods, our experimental test
system is not without practical limitations. The throughput of the system is limited by the use of a single-coil solenoid as
the EF applicator. Higher throughput experiments would be bottle-necked by the space requirements of the current platform,
which involves a large chiller and induction heater. Another practical drawback is the power requirement; the present 3.19 kW
power requirement approaches the battery capacities of industry-leading electric vehicles over a single day (≈ 75 kWh). Future
developments should attempt to miniaturize the experimental platform and introduce parallelism to enable combinatorial
experiments. Alternative coil architectures, chiller loops, multi-coil array designs, controllable capacitor banks, etc., are all
worthwhile engineering improvements that could enhance the utility, applicability, and efficiency of this platform. These
designs could be motivated by more detailed finite element modeling (FEM) of the various components of this test system,
which is beyond the scope of this present work.
CONCLUSION
We report methods to deliver EMFs to cell and tissue cultures using electromagnetic induction, which overcomes prior
limitations associated with the delivery of 200 kHz EFs using contacting electrodes. The proposed strategy for inductive EMF
14 Manuscript submitted to Biophysical Journal
Induced EMF delivery to cells
delivery eliminates conductive heating of culture dishes and improves temperature control and regulation. Additional design
enhancements of our culture dishes improved osmoregulation by mitigating media loss. We report results of stimulation of
human thyroid cell line cultures with 200 kHz EMFs exceeding 3 V/cm pk-pk and as high as 6.5 V/cm. Results support a
moderate anti-proliferative effect, especially at EF amplitudes exceeding 4 V/cm. The effect is unlikely to be due to cell death
based on secondary PI and EthD-1 staining. In summary, the 200 kHz EMF delivery method reported here is a carefully vetted
and well-characterized in vitro experimental platform for future exploration of the effect of intermediate frequency EMFs on
living (and non-living) systems.
AUTHOR CONTRIBUTIONS
R.R., P.J.B. conceived the study. R.R., P.J.B., T.X.C. designed the study. R.H.P., M.G.C., T.P. contributed to electric field
delivery and monitoring setup. R.R., H.W., A.G. contributed to cell culture methods. R.R. performed all experiments and
acquired data. T.X.C. designed the analysis, analyzed data, and wrote the supplementary material. R.Z.F. contributed to image
data analysis. T.X.C., R.R., P.J.B. wrote the manuscript. N.H.W. gave technical advice. M.R.G. and Z.Z. provided cancer and
cell biology expertise and contributed to the discussion. P.J.B. supervised the project. All authors edited the manuscript.
ACKNOWLEDGMENTS
Light microscopy was performed at the NICHD Microscopy & Imaging Core with the assistance of Dr. Vincent Schram and
Mrs. Lynne Holtzclaw. We would also like to thank Dr. Nicole Morgan for helpful discussions. The authors declare no conflicts
of interest. Support for this study comes from the Intramural Research Program (IRP) of the Eunice Kennedy Shriver National
Institute of Child Health and Human Development.
SUPPORTING MATERIAL
Supporting material accompanies this article and contains supplemental sections concerning: (1) estimated media loss calcu-
lations, (2) heat transfer and temperature profile calculations, (3) image processing and threshold selection implementation.
References (38–51) appear in the supporting material. The supporting material can be found by visiting BJ Online at
http://www.biophysj.org.
REFERENCES
1. Cifra, M., J. Z. Fields, and A. Farhadi, 2011. Electromagnetic cellular interactions. Progress in Biophysics and Molecular
Biology 105:223 – 246. Muscle Excitation-Contraction Coupling: Elements and Integration.
2. Kirson, E. D., Z. Gurvich, R. Schneiderman, E. Dekel, A. Itzhaki, Y. Wasserman, R. Schatzberger, and Y. Palti, 2004.
Disruption of Cancer Cell Replication by Alternating Electric Fields. Cancer Research 64:3288–3295.
3. Kirson, E. D., V. Dbalý, F. Tovarys, J. Vymazal, J. F. Soustiel, A. Itzhaki, D. Mordechovich, S. Steinberg-Shapira,
Z. Gurvich,R. Schneiderman,Y. Wasserman, M. Salzberg, B. Ryffel, D. Goldsher, E. Dekel, and Y. Palti, 2007. Alternating
electric fields arrest cell proliferation in animal tumor models and human brain tumors. Proceedings of the National
Academy of Sciences of the United States of America : PNAS 104:10152–10157.
4. Batash, R., N. Asna, P. Schaffer, N. Francis, and M. Schaffer, 2017. Glioblastoma Multiforme, Diagnosis and Treatment;
Recent Literature Review. Current Medicinal Chemistry 24:3002–3009.
5. Gilbert, M. R., J. J. Dignam, T. S. Armstrong, J. S. Wefel, D. T. Blumenthal, M. A. Vogelbaum, H. Colman, A. Chakravarti,
S. Pugh, M. Won, R. Jeraj, P. D. Brown, K. A. Jaeckle, D. Schiff, V. W. Stieber, D. G. Brachman, M. Werner-Wasik, I. W.
Tremont-Lukats, E. P. Sulman, K. D. Aldape, W. J. J. Curran, and M. P. Mehta, 2014. A randomized trial of bevacizumab
for newly diagnosed glioblastoma. New England Journal of Medicine: NEJM 370:699–708.
6. Stupp, R., W. P. Mason, M. J. van den Bent, M. Weller, B. Fisher, M. J. Taphoorn, K. Belanger, A. A. Brandes, C. Marosi,
U. Bogdahn, J. Curschmann, R. C. Janzer, S. K. Ludwin, T. Gorlia, A. Allgeier, D. Lacombe, J. G. Cairncross, E. Eisenhauer,
and R. O. Mirimanoff, 2005. Radiotherapy plus Concomitant and Adjuvant Temozolomide for Glioblastoma. New England
Journal of Medicine: NEJM 352:987–996.
7. Stupp, R., E. T. Wong, A. A. Kanner, D. Steinberg, H. Engelhard, V. Heidecke, E. D. Kirson, S. Taillibert, F. Liebermann,
V. Dbalý, Z. Ram, J. L. Villano, N. Rainov, U. Weinberg, D. Schiff, L. Kunschner, J. Raizer, J. Honnorat, A. Sloan,
Manuscript submitted to Biophysical Journal 15
Ravin, R. & Cai, T. X.
M. Malkin, J. C. Landolfi, F. Payer, M. Mehdorn, R. J. Weil, S. C. Pannullo, M. Westphal, M. Smrcka, L. Chin, H. Kostron,
S. Hofer, J. Bruce, R. Cosgrove, N. Paleologous, Y. Palti, and P. H. Gutin, 2012. NovoTTF-100A versus physician’s choice
chemotherapy in recurrent glioblastoma: A randomised phase III trial of a novel treatment modality. European Journal
of Cancer 48:2192 – 2202.
8. Stupp, R., S. Taillibert, A. Kanner, W. Read, D. Steinberg, B. Lhermitte, S. Toms, A. Idbaih, M. S. Ahluwalia, K. Fink,
F. Di Meco, F. Lieberman, J.-J. Zhu, G. Stragliotto, D. Tran, S. Brem, A. Hottinger, E. D. Kirson, G. Lavy-Shahaf,
U. Weinberg, C.-Y. Kim, S.-H. Paek, G. Nicholas, J. Bruna, H. Hirte, M. Weller, Y. Palti, M. E. Hegi, and Z. Ram, 2017.
Effect of Tumor-Treating Fields Plus Maintenance Temozolomide vs Maintenance Temozolomide Alone on Survival in
Patients With Glioblastoma: A Randomized Clinical Trial. JAMA 318:2306–2316.
9. Ceresoli, G. L., J. G. Aerts, R. Dziadziuszko, R. Ramlau, S. Cedres, J. P. van Meerbeeck, M. Mencoboni, D. Planchard,
A. Chella, L. Crinò, M. Krzakowski, J. Rüssel, A. Maconi, L. Gianoncelli, and F. Grosso, 2019. Tumour Treating Fields
in combination with pemetrexed and cisplatin or carboplatin as first-line treatment for unresectable malignant pleural
mesothelioma (STELLAR): a multicentre, single-arm phase 2 trial. The Lancet Oncology 20:1702–1709.
10. Gera, N., A. Yang, T. S. Holtzman, S. X. Lee, E. T. Wong, and K. D. Swanson, 2015. Tumor Treating Fields Perturb the
Localization of Septins and Cause Aberrant Mitotic Exit. PLOS ONE 10:1–20.
11. Tuszynski, J. A., C. Wenger, D. E. Friesen, and J. Preto, 2016. An Overview of Sub-Cellular Mechanisms Involved in the
Action of TTFields. International Journal of Environmental Research and Public Health 13:1128.
12. Wenger, C., M. Giladi, Z. Bomzon, R. Salvador, P. J. Basser, and P. C. Miranda, 2015. Modeling Tumor Treating Fields
(TTFields) application in single cells during metaphase and telophase. In 2015 37th Annual International Conference of
the IEEE Engineering in Medicine and Biology Society (EMBC). 6892–6895.
13. Wenger, C., R. Salvador, P. J. Basser, and P. C. Miranda, 2015. The electric field distribution in the brain during TTFields
therapy and its dependence on tissue dielectric properties and anatomy: a computational study. Physics in medicine and
biology 60:7339–7357.
14. Wenger, C., P. C. Miranda, R. Salvador, A. Thielscher, Z. Bomzon, M. Giladi, M. M. Mrugala, and A. R. Korshoej, 2018.
A Review on Tumor-Treating Fields (TTFields): Clinical Implications Inferred From Computational Modeling. IEEE
Reviews in Biomedical Engineering 11:195–207.
15. Davies, A. M., U. Weinberg, and Y. Palti, 2013. Tumor treating fields: a new frontier in cancer therapy. Annals of the New
York Academy of Sciences 1291:86–95.
16. Bomzon, Z., C. Wenger, M. Giladi, N. Urman, R. S. Schneiderman, T. Voloshin Sela, Y. Porat, M. Munster, R. Blat,
s. sherbo, U. Weinberg, E. Kirson, P. C. Miranda, Y. Wasserman, and Y. Palti, 2016. Quantifying the Effect of Electric
Fields in the Frequency Range of 100-500 khz on Mitotic Spindle Structures. Biophysical Journal 110:619a.
17. Berkelmann, L., A. Bader, S. Meshksar, A. Dierks, G. Hatipoglu Majernik, J. K. Krauss, K. Schwabe, D. Manteuffel, and
A. Ngezahayo, 2019. Tumour-treating fields (TTFields): Investigations on the mechanism of action by electromagnetic
exposure of cells in telophase/cytokinesis. Scientific Reports 9:7362.
18. Li, X., F. Yang, and B. Rubinsky, 2020. A Theoretical Study on the Biophysical Mechanisms by Which Tumor Treating
Fields Affect Tumor Cells during Mitosis. IEEE Transactions on Biomedical Engineering 1–1.
19. Kessler, A. F., G. E. Frömbling, F. Gross, M. Hahn, W. Dzokou, R.-I. Ernestus, M. Löhr, and C. Hagemann, 2018. Effects
of tumor treating fields (TTFields) on glioblastoma cells are augmented by mitotic checkpoint inhibition. Cell Death
Discov 4:12–12.
20. Santelices, I. B., D. E. Friesen, C. Bell, C. M. Hough, J. Xiao, A. Kalra, P. Kar, H. Freedman, V. Rezania, J. D. Lewis,
K. Shankar, and J. A. Tuszynski, 2017. Response to Alternating Electric Fields of Tubulin Dimers and Microtubule
Ensembles in Electrolytic Solutions. Scientific Reports 7:9594.
21. Chang, E., C. B. Patel, C. Pohling, C. Young, J. Song, T. A. Flores, Y. Zeng, L.-M. Joubert, H. Arami, A. Natarajan,
R. Sinclair, and S. S. Gambhir, 2018. Tumor treating fields increases membrane permeability in glioblastoma cells. Cell
Death Discovery 4:113.
16 Manuscript submitted to Biophysical Journal
Induced EMF delivery to cells
22. Giladi, M., M. Munster, R. S. Schneiderman, T. Voloshin, Y. Porat, R. Blat, K. Zielinska-Chomej, P. Hååg, Z. Bomzon,
E. D. Kirson, U. Weinberg, K. Viktorsson, R. Lewensohn, and Y. Palti, 2017. Tumor treating fields (TTFields) delay DNA
damage repair following radiation treatment of glioma cells. Radiat Oncol 12:206–206.
23. Jo, Y., S.-G. Hwang, Y. B. Jin, J. Sung, Y. K. Jeong, J. H. Baek, J.-M. Cho, E. H. Kim, and M. Yoon, 2018. Selective
toxicity of tumor treating fields to melanoma: an in vitro and in vivo study. Cell Death Discovery 4:46.
24. Silginer, M., M. Weller, R. Stupp, and P. Roth, 2017. Biological activity of tumor-treating fields in preclinical glioma
models. Cell Death Dis 8:e2753–e2753.
25. Kim, E. H., Y. Jo, S. Sai, M.-J. Park, J.-Y. Kim, J. S. Kim, Y.-J. Lee, J.-M. Cho, S.-Y. Kwak, J.-H. Baek, Y. K. Jeong, J.-Y.
Song, M. Yoon, and S.-G. Hwang, 2019. Tumor-treating fields induce autophagy by blocking the Akt2/miR29b axis in
glioblastoma cells. Oncogene 38:6630–6646.
26. Neuhaus, E., L. Zirjacks, K. Ganser, L. Klumpp, U. Schüler, D. Zips, F. Eckert, and S. M. Huber, 2019. Alternating
Electric Fields (TTFields) Activate Ca(v)1.2 Channels in Human Glioblastoma Cells. Cancers 11:110.
27. Giladi, M., R. S. Schneiderman, T. Voloshin, Y. Porat, M. Munster, R. Blat, S. Sherbo, Z. Bomzon, N. Urman, A. Itzhaki,
S. Cahal, A. Shteingauz, A. Chaudhry, E. D. Kirson, U. Weinberg, and Y. Palti, 2015. Mitotic Spindle Disruption
by Alternating Electric Fields Leads to Improper Chromosome Segregation and Mitotic Catastrophe in Cancer Cells.
Scientific reports 5:18046–18046.
28. Porat, Y., M. Giladi, R. S. Schneiderman, R. Blat, A. Shteingauz, E. Zeevi, M. Munster, T. Voloshin, N. Kaynan, O. Tal,
E. D. Kirson, U. Weinberg, and Y. Palti, 2017. Determining the Optimal Inhibitory Frequency for Cancerous Cells Using
Tumor Treating Fields (TTFields). JoVE e55820.
29. Finan, J. D., and F. Guilak, 2010. The effects of osmotic stress on the structure and function of the cell nucleus. Journal
of cellular biochemistry 109:460–467.
30. Radmaneshfar, E., D. Kaloriti, M. C. Gustin, N. A. R. Gow, A. J. P. Brown, C. Grebogi, M. C. Romano, and M. Thiel,
2013. From START to FINISH: The Influence of Osmotic Stress on the Cell Cycle. PLOS ONE 8:1–14.
31. Fragniere, A. M. C., S. R. W. Stott, S. V. Fazal, M. Andreasen, K. Scott, and R. A. Barker, 2019. Hyperosmotic stress
induces cell-dependent aggregation of a-synuclein. Scientific Reports 9:2288.
32. Bickford, R., and B. Fremming, 1956. Neuronal stimulation by pulsed magnetic fields in animals and man. In Digest of
the 6th International Conference in Medical Electronics and Biological Engineering. IFMBE, 112.
33. Hassanpour, H., N. Samadiani, and S. M. M. Salehi, 2015. Using morphological transforms to enhance the contrast of
medical images. The Egyptian Journal of Radiology and Nuclear Medicine 46:481 – 489.
34. Soille, P., 2004. Morphological Image Analysis : Principles and Applications. Springer Berlin Heidelberg, Berlin,
Heidelberg.
35. Otsu, N., 1979. A Threshold Selection Method from Gray-Level Histograms. IEEE Transactions on Systems, Man, and
Cybernetics 9:62–66.
36. Zablotskii, V., T. Polyakova, O. Lunov, and A. Dejneka, 2016. How a High-Gradient Magnetic Field Could Affect Cell
Life. Scientific Reports 6:37407.
37. Schenck, J. F., 1996. The role of magnetic susceptibility in magnetic resonance imaging: MRI magnetic compatibility of
the first and second kinds. Medical Physics 23:815–850.
38. Welty, J., C. E. Wicks, G. L. Rorrer, and R. E. Wilson, 2015. Fundamentals of momentum, heat, and mass transfer. Wiley,
Hoboken, NJ.
39. Herning, F., and L. Zipperer, 1936. Calculation of the viscosity of technical gas mixtures from the viscosity of the
individual gases. Gas u. Wasserfach 79:69.
40. Schwertz, F. A., and J. E. Brow, 1951. Diffusivity of Water Vapor in Some Common Gases. The Journal of Chemical
Physics 19:640–646.
Manuscript submitted to Biophysical Journal 17

Ravin, R. & Cai, T. X.
41. Teske, V., E. Vogel, and E. Bich, 2005. Viscosity Measurements on Water Vapor and Their Evaluation. Journal of
Chemical & Engineering Data 50:2082–2087.
42. Arnold, W., and G. Fuhr, 1994. Increasing the permittivity and conductivity of cellular electromanipulation media. In
Proceedings of 1994 IEEE Industry Applications Society Annual Meeting. volume 2, 1470–1476 vol.2.
43. Chen, M.-T., C. Jiang, P. T. Vernier, Y.-H. Wu, and M. A. Gundersen, 2009. Two-dimensional nanosecond electric field
mapping based on cell electropermeabilization. PMC Biophysics 2:9.
44. Chapman, S., T. G. Cowling, and D. Burnett, 1990. The Mathematical Theory of Non-uniform Gases: An Account of the
Kinetic Theory of Viscosity, Thermal Conduction and Diffusion in Gases. Cambridge University Press.
45. Wilke, C. R., 1950. A Viscosity Equation for Gas Mixtures. The Journal of Chemical Physics 18:517–519.
46. Harper, C. A., 2000. Modern Plastics Handbook. McGraw-Hill Professional.
47. Churchill, S. W., and H. H. S. Chu, 1975. Correlating equations for laminar and turbulent free convection from a horizontal
cylinder. International Journal of Heat and Mass Transfer 18:1049 – 1053.
48. McAdams, W. H., 1985. Heat Transmission. Krieger Pub Co.
49. Bird, R. B., W. E. Stewart, and E. N. Lightfoot, 2006. Transport Phenomena, Revised 2nd Edition. John Wiley & Sons,
Inc.
50. Haynes, W. M., 2011. CRC Handbook of Chemistry and Physics, 92nd Edition. CRC Press.
51. Mittal, N., A. Rosenthal, and J. Voldman, 2007. nDEP microwells for single-cell patterning in physiological media. Lab
on a Chip 7:1146.
18 Manuscript submitted to Biophysical Journal