a novel method for the visualization of deformation data · ts number – session title (e.g. ts 1a...
TRANSCRIPT

TS number – Session title (e.g. TS 1A – Standards )
Alexander Reiterer, Peter Rautek, Eduard Gröller
A Novel Method for the Visualization of Deformation Data
FIG Congress 2010
Facing the Challenges – Building the Capacity
Sydney, Australia, 11-16 April 2010
1/15
A Novel Method for the Visualization of Deformation Data
Alexander REITERER, Peter RAUTEK, Eduard GRÖLLER, Austria
Key words: Visualization, Deformation Data, Image-Based Measurement System, Point
Cloud.
SUMMARY
Modern deformation monitoring systems, such as laser scanner or image based tacheometer
are producing a vast number of object points. One of the main problems concerning the
analysis and interpretation of high density deformation measurements is the visualization of
the data respectively of the underlying deformation. Most existing geodetic deformation
visualization techniques are based on plotted displacement vectors or on a colour coded
representation. A visualization of displacement vectors is unsuitable for high density point
clouds; colour coded representation is more apprporiated with some limitions regarding the
interpretation (e.g. direction of movements or deformations can represented restriced only). In
this paper a novel technique for the visualization of deformation data is presented – we call
this technique exaggerated visualization. The exaggeration of the deformation accents subtle
deviations and supports the viewer in correctly interpretating of the underlying deformation.
The paper at hand presents the new method for the visualization of deformation data, as well
as some examples.

TS number – Session title (e.g. TS 1A – Standards )
Alexander Reiterer, Peter Rautek, Eduard Gröller
A Novel Method for the Visualization of Deformation Data
FIG Congress 2010
Facing the Challenges – Building the Capacity
Sydney, Australia, 11-16 April 2010
2/15
A Novel Method for the Visualization of Deformation Data
Alexander REITERER, Peter RAUTEK, Eduard GRÖLLER, Austria
1. INTRODUCTION
For monitoring an object subject to deformation the object and its surrounding have to be
modelled. The continuum needs to be represented by discrete points in such a way that the
points characterize the object, and that the movements of the discrete points represent the
movement and distortion of the object (Scheickl et al. 2006). Modelling the actual
deformation of an object requires observing the characteristic points in certain time intervals
by means of a suitable measurement system in order to properly monitor the temporal course
of the movements.
Up-to-date sensor systems for deformation monitoring comprise e.g. GNNS, theodolites,
tacheometers, laser scanners, photogrammetric cameras and/or geotechnical devices (Reiterer
et al. 2009, Scheickl et al. 2006, Schultz 2005). Newest developments follow the trend to
capture point clouds of high density to represent object deformations. The analysis of high
density point clouds is challenging due to the vast number of data points.
This paper concentrates on the visualization of deformation data based on high-density point
clouds using a totally new approach which we call exaggerated visualization. The basic idea
of these visualization techniques is guided by the workflow of a caricaturist. A caricaturist has
a reference model in his mind (e.g. the “ideal/normal” human face) and draws a caricature of
a specimen deviating from the norm (e.g. a man with a large nose). The caricature is a result
of the exaggerated depiction of the deviations of the specimen from the reference model (e.g.
a picture of the man with an even larger nose). In Figure 1a the head of Michelangelo’s David
statue is shown as an idealized model among the subjects of interest. In Figure 1b a specimen
is shown (Albert Einstein). In Figure 1c a hand drawn caricature of the specimen is shown. A
caricature requires the existence of a reference model.
(a)
(b)
(c)
Figure 1: Example of a non automatic caricature drawing (Photograph Einstein: ©Halsman Philippe;
Caricature Einstein: © John Pritchett).

TS number – Session title (e.g. TS 1A – Standards )
Alexander Reiterer, Peter Rautek, Eduard Gröller
A Novel Method for the Visualization of Deformation Data
FIG Congress 2010
Facing the Challenges – Building the Capacity
Sydney, Australia, 11-16 April 2010
3/15
Like in traditional caricature, the exaggerated visualization technique takes a reference model
and a deviating specimen and depicts the deviations in an exaggerated way. In the case of
deformation data the reference model is a measurement of the object of interest; a specimen is
the consecutive epoch. The caricaturistic visualization of such a specimen depicts the
deformation of the object of interest in an exaggerated way. A simplified scheme of the
processing sequence is shown in Figure 2 – the data (point cloud, images, etc.) are captured in
the data acquisition stage and then processed to derive intermediate data structures that are
necessary for the visualization process (data processing may involve triangulation, re-
sampling, etc. of multi-epoch point clouds). The user can interactively manipulate the
visualization parameters to achieve the desired visualizations and to gain insight into the data.
Figure 2: Simplified pipeline of the exaggerated visualization system for deformation data based on high density
point clouds.
The remainder of this paper is structured as follows: First of all, the state of the art of
deformation visualization is presented; the main part of the paper focuses on the new
visualization method, the mathematical formulations and on examples.
2. EXISTING GEODETIC DEFORMATION VISUALIZATION TECHNIQUES
The main task of geodetic object monitoring is the determination of the deformation of
objects and of rigid body movements. To detect these, deformation analysis techniques are
used. In the simplest case measurements taken at two different points in time (two epochs) are
compared. More details about deformation analysis can be found in (Pelzer 1985,
Teskey 1985).
Most existing geodetic deformation visualization techniques are based on plotted
displacement vectors (i.e. connected corresponding points from two measurement epochs) –
see Figure 3a. This is a suitable method for point clouds of low density. For high density point
clouds the plotting becomes cluttered and the user may get a confusing impression about the
existing movements and deformations. The orientation and the dimension of movement
vectors in 3D are even more difficult to interpret.
Colour coding (see Figure 3b) is another method for the visualization of deformations. Pre-
defined intervals of “displacement magnitudes” are represented by selected colours. This form
of geodetic deformation visualization is more suited for complex objects and high density
point clouds. However, colour coding fails to represent the direction of the movements.

TS number – Session title (e.g. TS 1A – Standards )
Alexander Reiterer, Peter Rautek, Eduard Gröller
A Novel Method for the Visualization of Deformation Data
FIG Congress 2010
Facing the Challenges – Building the Capacity
Sydney, Australia, 11-16 April 2010
4/15
(a)
(b)
Figure 3: Examples of two different visualization techniques: (a) displacement vectors, (b) colour
coding. We acknowledge the use of the pictures of the Joanneum Research Graz (Austria).
3. EXAGGERATED VISUALIZATION
Caricatures are pieces of art depicting persons or sociological conditions in a manner which
exaggerates one or more particular features of the subject. In both cases a caricature refers to a
reference model. The deviations from the reference model are the characteristic features of the
depicted subject. The goal of traditional caricature is the entertainment of the beholder.
Exaggerated visualization follows similar principles as traditional caricature but with a
different goal. Exaggerated visualization aims to highlight the characteristics of a subject.
Figure 4: Illustration of the exaggerated visualization concepts.
In Figure 4 an illustration of the concepts of exaggerated visualization (i.e., caricaturization, ,
anti-caricaturization and stylization) is shown. The opposite of caricaturization is anti-
caricaturization, i.e. the exaggeration of the deviations of the reference model from the
specimen. In the lower row of Figure 4 a simple shape is used to illustrate caricaturization and
anti-caricaturization. In the upper row of Figure 4 stylized visual representations of the shapes
of the lower row are shown. The more stylized versions of the shapes are sparse
representations and can therefore be used as overlays for the original image.
TS number – Session title (e.g. TS 1A – Standards )
Alexander Reiterer, Peter Rautek, Eduard Gröller
A Novel Method for the Visualization of Deformation Data
FIG Congress 2010
Facing the Challenges – Building the Capacity
Sydney, Australia, 11-16 April 2010
5/15
Related work concerning exaggerated visualization mostly focuses on facial caricatures.
Computer aided facial caricature generation was addressed in several previous publications
(Akleman et al. 2000, Benson & Perret 1991, Brennan 1985, Rhodes et al. 1994,
Stevenage 1995). The perception and recognition of faces in association to caricatures was an
extensive subject of research (Benson & Perret 1994, Hagen & Perkins 1983, Perking &
Hagen 1981, Rhodes et al. 1987, Rhodes & Tremewan 1994, Rhodes & Tremewan 1996,
Stevenage 1995). While some publications (Benson & Perret 1994, Rhodes et al. 1987,
Rhodes & Tremewan 1994, Rhodes & Tremewan 1996) report an advantage in recognition or
learning using facial caricatures, other papers (Hagen & Perkins 1983, Perking &
Hagen 1981) found no evidence that caricatures of people are better than photographs. Gooch
et al. (2004) present a more extensive discussion about human facial illustration and an
evaluation of caricature techniques for face illustration.
For objects in general it was reported (Dwyer 1967, Ryan & Schwartz 1956) that stylized,
accentuated drawings are more easily identified. They aid learning more than photographs of
the same objects. The work dealing with illustrative volume visualization focuses on imitating
traditional illustration techniques. High level abstraction techniques as presented in the work
of Viola et al. (2004, 2005) and Svakhine et al. (2005) control the appearance of different
features at varying degrees of sparseness and complexity.
An illustrative visualization approach for time varying data was presented by Joshi et al.
(2005). Weigle and Taylor (2005) present a related technique for the comparison of different
datasets. They investigate visualization techniques for intersecting surfaces and compare the
performance of existing techniques and a novel glyph based approach. Liu et al. (2005)
present an approach to make subtle motions in video scenes clearly visible. The motions are
accentuated by exaggerating the motion of objects in the video.
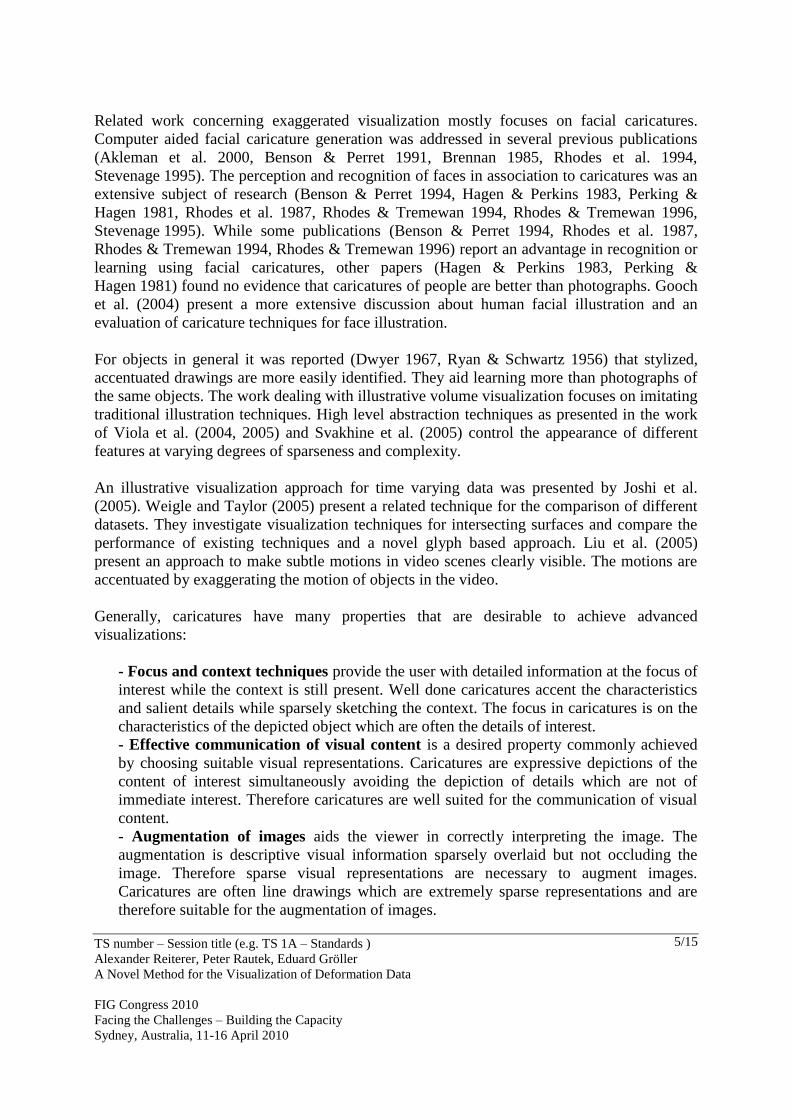
Generally, caricatures have many properties that are desirable to achieve advanced
visualizations:
- Focus and context techniques provide the user with detailed information at the focus of
interest while the context is still present. Well done caricatures accent the characteristics
and salient details while sparsely sketching the context. The focus in caricatures is on the
characteristics of the depicted object which are often the details of interest.
- Effective communication of visual content is a desired property commonly achieved
by choosing suitable visual representations. Caricatures are expressive depictions of the
content of interest simultaneously avoiding the depiction of details which are not of
immediate interest. Therefore caricatures are well suited for the communication of visual
content.
- Augmentation of images aids the viewer in correctly interpreting the image. The
augmentation is descriptive visual information sparsely overlaid but not occluding the
image. Therefore sparse visual representations are necessary to augment images.
Caricatures are often line drawings which are extremely sparse representations and are
therefore suitable for the augmentation of images.

TS number – Session title (e.g. TS 1A – Standards )
Alexander Reiterer, Peter Rautek, Eduard Gröller
A Novel Method for the Visualization of Deformation Data
FIG Congress 2010
Facing the Challenges – Building the Capacity
Sydney, Australia, 11-16 April 2010
6/15
- Steering attention to regions of interest is commonly done by visual cues. Caricatures
provide intensive cues toward the details of interest. Highly exaggerated regions attract
the user’s attention. In contrast photorealistic rendering often fails to direct the attention to
relevant details. Therefore caricaturistic visualization is especially suitable for datasets
where deviations from a reference model are of interest.
Caricaturists identify features and exaggerate certain properties of these features such as
spatial extent, displacement, or angularity. We want to exaggerate the deviations of an object
from the corresponding reference model (difference between measurement epochs). Therefore
we analyze the difference between the model and the object for each property.
For each property we define a difference function over the domain of the property. The
domain of property i is denoted as Pi and the difference function is denoted as Θi.
A feature describes the characteristics of the specimen with respect to the reference model. A
feature is therefore defined as a property vector P:
P = P1 × P2 × . . . × Pn−1 × Pn
We define an exaggeration function for each property of the feature. This function describes
the behavior of a feature as its properties are exaggerated. It is desirable that the deviating
properties of the feature are even further deviated. We call this kind of exaggeration of a
property intra property exaggeration. On the other hand an inter property exaggeration is the
exaggeration of a property caused by the deviation of another property. We therefore define
the exaggeration function ei for property i as:
iinnniniiii xxxxdcxxdcxxe ~~,...~,, i1111
,
where δ is the exaggeration parameter, dj is the distance function for property j, jx~ is the
value of the reference model for the property j, ijc for i, j = 1…n are the coefficients
describing the inter and intra property exaggeration, and ii xx ~i is given by
)~,(
1~~i
iii
iiiiixxd
xxxx ,
where iii Pxx ~, . The coefficient cij determines the influence of the deviation of property j on
the exaggeration of property i. Intra and inter property exaggerations can be observed in real
caricatures. In our approach we focus on intra property exaggerations. We therefore set all
coefficients cij = 0 for i ≠ j.
As mentioned above each feature consists of a set of properties. Simple features may only
consist of few properties like position, orientation and elongation. More complicated features
may consist of hundreds of properties describing the shape of the feature. Designing
appropriate features is crucial for exaggerated visualization.

TS number – Session title (e.g. TS 1A – Standards )
Alexander Reiterer, Peter Rautek, Eduard Gröller
A Novel Method for the Visualization of Deformation Data
FIG Congress 2010
Facing the Challenges – Building the Capacity
Sydney, Australia, 11-16 April 2010
7/15
We designed our features to meet the following criteria:
- Flexibility: The set of properties is able to describe a wide variety of features.
- Simplicity: Each property is easy and fast to specify. Features which are complicated to
specify may distract the user. Following the constraint of simplicity is not a restriction to
the complexity of the feature. The automatically generated shape may be complicated
while the user only specified few settings.
- Measurability: Each property is measurable and has a corresponding distance function.
A pair of corresponding features differs only in the specified values of the properties. The
distance between these values must be measurable.
While the first two constraints are guidelines to design features suitable for the visualization
of deformations the third constraint is a technical prerequisite for exaggerated visualization.
The flexibility and simplicity constraints seem at first glance to result in a trade-off. On one
hand the features should have the flexibility to describe the subject of exaggeration, on the
other hand it should not be too complicated for the user to specify. For our application in the
simplest case the position of the single object points can be used as feature. When points are
moving an exaggerated movement is depicted catching the attention of the viewer. For more
complex exaggerated visualizations different features and reference models can be used. A
simple threshold for the maximal value of deformation can for instance be used as a reference
model. This threshold can be set by an expert user globally (for the whole dataset) or
regionally (manually specified for specific regions). In both cases the exaggeration
emphasizes the regions of interest.
For the purpose of demonstration of the exaggerated visualization approach we define a three
dimensional superquadric using the implicit function:
222
),,( zys
xzyxf
x
.
We define sx; to be the parameters of the implicit function. The property vector space
P = P1×P2 of the implicit function is therefore defined as . As a reference model we
choose the superquadric with the property vector (1,1) which is a sphere. We define eight
different objects with all combinations of the properties sx = 0.8, 1.0, 1.2 and γ = 0.6, 1.0, 2.5.
As visual representation for the implicitly defined function ),,( zyxf we choose an iso-
surface of the function:
2),,(
1),,(
zyxfzyxg at an iso-value of 0.5.
An example is shown in Figure 5 – in the inner square of the figure eight deviating objects
(i.e., the specimen) are shown. In the center of this square the reference model is shown. The
vertical axis corresponds to the property which describes the actual shape of the iso-surface of
the implicit function. The horizontal axis corresponds to the property sx which describes the
spatial extent of the iso-surface in x-direction. The object in the lower left corner of the inner
TS number – Session title (e.g. TS 1A – Standards )
Alexander Reiterer, Peter Rautek, Eduard Gröller
A Novel Method for the Visualization of Deformation Data
FIG Congress 2010
Facing the Challenges – Building the Capacity
Sydney, Australia, 11-16 April 2010
8/15
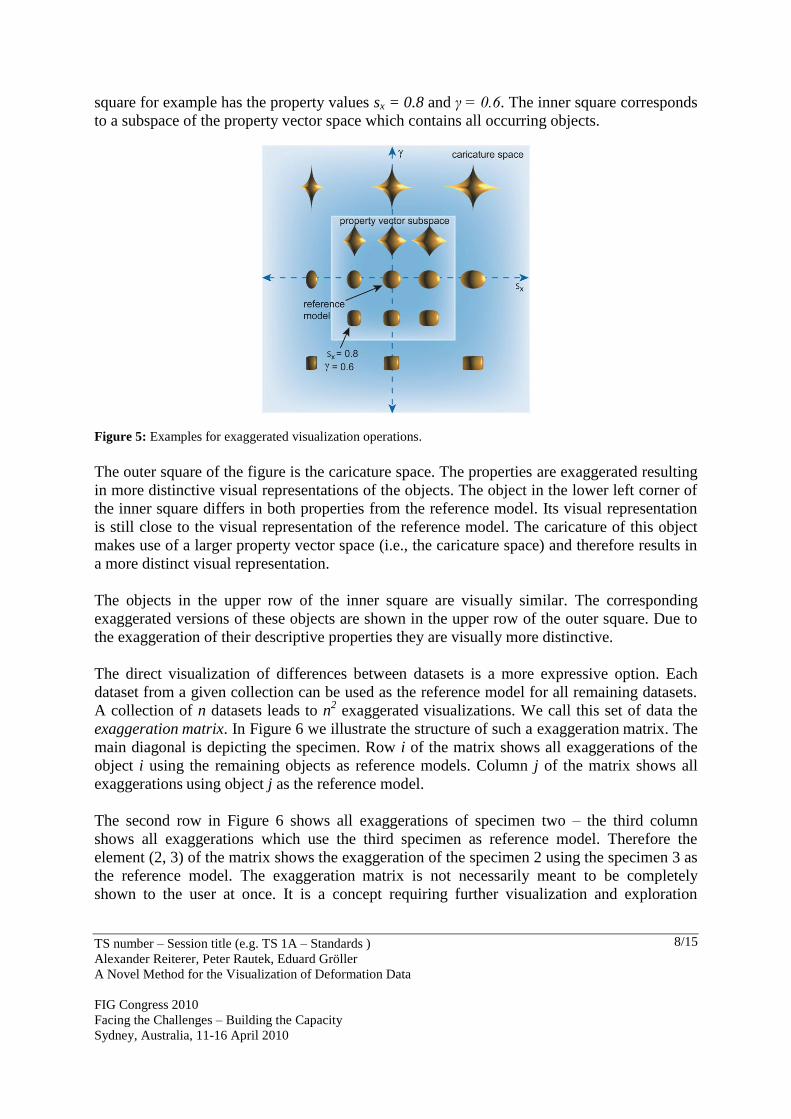
square for example has the property values sx = 0.8 and γ = 0.6. The inner square corresponds
to a subspace of the property vector space which contains all occurring objects.
Figure 5: Examples for exaggerated visualization operations.
The outer square of the figure is the caricature space. The properties are exaggerated resulting
in more distinctive visual representations of the objects. The object in the lower left corner of
the inner square differs in both properties from the reference model. Its visual representation
is still close to the visual representation of the reference model. The caricature of this object
makes use of a larger property vector space (i.e., the caricature space) and therefore results in
a more distinct visual representation.
The objects in the upper row of the inner square are visually similar. The corresponding
exaggerated versions of these objects are shown in the upper row of the outer square. Due to
the exaggeration of their descriptive properties they are visually more distinctive.
The direct visualization of differences between datasets is a more expressive option. Each
dataset from a given collection can be used as the reference model for all remaining datasets.
A collection of n datasets leads to n2 exaggerated visualizations. We call this set of data the
exaggeration matrix. In Figure 6 we illustrate the structure of such a exaggeration matrix. The
main diagonal is depicting the specimen. Row i of the matrix shows all exaggerations of the
object i using the remaining objects as reference models. Column j of the matrix shows all
exaggerations using object j as the reference model.
The second row in Figure 6 shows all exaggerations of specimen two – the third column
shows all exaggerations which use the third specimen as reference model. Therefore the
element (2, 3) of the matrix shows the exaggeration of the specimen 2 using the specimen 3 as
the reference model. The exaggeration matrix is not necessarily meant to be completely
shown to the user at once. It is a concept requiring further visualization and exploration

TS number – Session title (e.g. TS 1A – Standards )
Alexander Reiterer, Peter Rautek, Eduard Gröller
A Novel Method for the Visualization of Deformation Data
FIG Congress 2010
Facing the Challenges – Building the Capacity
Sydney, Australia, 11-16 April 2010
9/15
techniques. While the average of datasets is distorted by outliers the exaggeration matrix
depicts the direct comparison of all datasets to each other.
Figure 6: Illustration of the exaggeration matrix.
4. EXAMPLES OF GEODETIC EXAGGERATED VISUALIZATION
4.1 Exaggerated Visualization of 2D Deformations – Example: Façade
For the first example we have chosen a 2D deformation on a façade. Displacements have been
measured and documented over a long period (geo-referenced images including high density
point cloud / displacement vectors – details about the measurement system can be found in
(Reiterer et al. 2009)). Figure 7 shows an overview of the exaggerated visualization of the
object deformation. The left column shows a schematic visualization of two measurement
epochs of the object. The upper image serves as a reference model for the exaggeration of the
lower image. Note that the differences between the two images are hardly visible.
The measured vector field will be used to exaggerate the observed deformation and to
visualize the happen deformation directly in the image. First a Delaunay triangulation of the
unstructured points is computed. This enables us to interpolate a vector for each position on
the image plane. The user chooses an exaggeration parameter, which determines the
visualization of the deformation.
The exaggeration is either applied directly to the original image of the deformed object or to a
more stylized representation thereof. Figure 7 shows the visualization pipeline. During data
acquisition a reference model and deformed object are measured (two different time and
measurement epochs). Point clouds are captured by point detection algorithms (IOP),
corresponding points by a matching routine. Result is an unstructured vector field of
displacement vectors. The actual visualization step maps the unstructured field of vectors to
exaggerated visual representations.

TS number – Session title (e.g. TS 1A – Standards )
Alexander Reiterer, Peter Rautek, Eduard Gröller
A Novel Method for the Visualization of Deformation Data
FIG Congress 2010
Facing the Challenges – Building the Capacity
Sydney, Australia, 11-16 April 2010
10/15
In the right most column of Figure 7 the result of the direct as well as of the stylized
exaggeration is shown. The stylized exaggeration is generated by the deformation of an
automatically derived edge image. The stylized exaggeration results in a sparser
representation and is therefore also suitable to be overlaid over the original image.
Figure 7: Overview of the exaggerated visualization pipeline for 2D object deformation data.
Figure 8 shows an overlay of the stylized exaggeration on the deformed object. The
deformation is depicted with different exaggeration factors. The exaggeration of the
deformation allows a fast inspection of the underlying data and provides an intuitive
representation of the deformation.
Figure 8: Exaggerated visualization of 2D object deformation. The images of the deformed object are overlaid
with the exaggerated versions. The exaggeration parameter is increased from left to right.
4.2 Exaggerated Visualization of 3D Deformations – Example: Landslides
The second example shows a 3D deformation of a landslide. Landslides are movements of the
ground such as rock falls or slopes. The growing number of highly populated landslide areas

TS number – Session title (e.g. TS 1A – Standards )
Alexander Reiterer, Peter Rautek, Eduard Gröller
A Novel Method for the Visualization of Deformation Data
FIG Congress 2010
Facing the Challenges – Building the Capacity
Sydney, Australia, 11-16 April 2010
11/15
has increased the demand for fast deformation measurement, analysis and visualization
systems.
Figure 9: Overview of the exaggerated visualization pipeline for 3D deformation data.
In Figure 9 all steps to achieve more advanced visualizations of an unstructured 3D point
clouds and their deformation are shown. The left column of Figure 9 shows a part of the
measurement epochs of an exemplary point cloud of a landslide. The underlying data was
measured with an image-based measurement system (see Reiterer et al. (2009)). The point
cloud is difficult to interpret due to its unstructured appearance and needs further visualization
techniques. For each epoch a point cloud is measured. The reference point cloud (epoch i) as
well as the deformed point cloud (epoch i+1) are triangulated using Delaunay triangulation.
The triangle mesh is re-sampled on a regular mesh.
The regular mesh of the deformed point cloud is used to draw a shaded surface. Iso-lines of
constant height are applied to the surface to aid the recognition of the shape of the depicted
hill. A regular mesh is used as stylized representation and overlaid over the shaded surface for
the purpose of exaggeration. Two corresponding meshes (of the reference model and the
deformed point cloud) are used to draw caricatures respectively anti-caricatures. In the
rightmost column of Figure 9 an example of a caricature and an anti-caricature are shown.
In Figure 10 a “zoom-in” on a exaggerated visualization is shown which emphasises the
deformation of the landslide. In the left image of Figure 10 the deformed surface is shown
with a regular grid as overlay. In the right image of Figure 10 the grid is deformed in an
exaggerated way. It clearly accents the deformation that is represented in the underlying
deformation data. The exaggerated deformation of the grid clearly shows where the
underlying deformations occur and supports the correct interpretation and classification of the
deformation. The exaggerations in Figure 10 accent regions of lifting while within regions of
settlement the grid lines are hidden by the shaded surface. However, the regions of settlement
can be accented with the corresponding anti-caricature.

TS number – Session title (e.g. TS 1A – Standards )
Alexander Reiterer, Peter Rautek, Eduard Gröller
A Novel Method for the Visualization of Deformation Data
FIG Congress 2010
Facing the Challenges – Building the Capacity
Sydney, Australia, 11-16 April 2010
12/15
The shown examples have been focused on one feature only (displacement of the points). As
mentioned above using additional features for a more complex visualization is possible. An
example for such a feature is the maximal forthcoming deformation rate. The user gets an
easily interpretable visual feedback for points or areas which are exceeding or nearly
exceeding the predefined maximal deformation rate.
Figure 10: Exaggerated visualization of a landslide.
5. CONCLUSION
In this paper a new method for the visualization of geodetic deformations is presented that is
inspired by traditional caricature. The main goal of caricatures is a humorous depiction of the
object of interest. In contrast exaggerated visualization uses the principles inspired by
traditional caricatures for the purpose of an accentuated depiction of outstanding features. The
developed method can be applied to a huge number of different data sets. For the paper at
hand we have used high density point clouds which have been extended by image-based data.
The experiments have shown that the developed techniques constitute a distinguished method
for the visualization of complex deformations and movements.
Advantages in comparison with traditional deformation visualization techniques such as
colour coded representations or vector fields are:
- More than one feature can be visualized (e.g. displacement vectors, threshold for a
maximal deformation rate, etc.). This makes the visual interpretation of complicate
deformation behavior including influence factors possible.
- Visualization can be done (if necessary) in the 3D space without a transformation into
separated 2D representations.
- Visualization can combine/fuse measurement data and images and can be used for
animated and/or interactive representation (see Figure 11).
- Datasets can be compared to a reference model, a global threshold, or a locally modeled
threshold. In the absence of a reference model and a threshold (that usually needs to be

TS number – Session title (e.g. TS 1A – Standards )
Alexander Reiterer, Peter Rautek, Eduard Gröller
A Novel Method for the Visualization of Deformation Data
FIG Congress 2010
Facing the Challenges – Building the Capacity
Sydney, Australia, 11-16 April 2010
13/15
defined by an expert), the datasets can be compared to each other. The direct comparison
of datasets allows the immediate detection of outliers and abnormalities.
Figure 11: Screenshots of the implemented interactive deformation visualization tool.
Future work will implement the presented methods for visualization of deformation in an on-
line deformation measurement and analysis system (Reiterer et al. 2009). A combined system
of this kind will be a great challenge in the future. Advanced visualization techniques can help
for the fast and correct interpretation of the large amounts of data produced by new
measurement technologies.
ACKNOWLEDGEMENTS
The research presented in this paper is supported by the Austrian Science Foundation (FWF)
Projects P18322 “exvisation” and L514 “i-MeaS”.
REFERENCES
Akleman, Palmer, Logan (2000): Making extreme caricatures with a new interactive 2D
deformation technique with simplicial complexes. In: Proceedings of Visual 2000, pp. 165-
170.
Benson, Perret (1991): Perception and recognition of photographic quality facial caricatures:
Implications for the recognition of natural images. European Journal of Cognitive
Psychology, Vol.: 3-1, pp. 105-135.
Benson, Perret (1994): Visual processing of facial distinctiveness. Journal of Perception, Vol.:
23-1, pp. 75–93.
Brennan (1985): Caricature generator: The dynamic exaggeration of faces by computer.
Leonardo, Vol.: 18-3, pp. 170-178.
Dwyer (1967): Adapting visual illustrations for effective learning. Harvard Educational
Review, Vol.: 37-2, pp. 250-263.
Gooch, Reinhard, Gooch (2004): Human facial illustrations: Creation and psychophysical
evaluation. ACM Transactions on Graphics, Vol.: 23-1, pp. 27-44.
Hagen, Perkins (1983): Arefutation of the hypothesis of the superfidelity of caricatures
relative to photographs. Journal of Perception, Vol.: 12-1, pp. 55-61.

TS number – Session title (e.g. TS 1A – Standards )
Alexander Reiterer, Peter Rautek, Eduard Gröller
A Novel Method for the Visualization of Deformation Data
FIG Congress 2010
Facing the Challenges – Building the Capacity
Sydney, Australia, 11-16 April 2010
14/15
Joshi, Rheingans (2005): Illustration-inspired techniques for visualizing time-varying data. In
Proceedings of IEEE Visualization 2005, pp. 679-686.
Liu, Torralba, Freeman, Durand, Adelson (2005): Motion magnification. ACM Transactions
on Graphics, Vol. 24-3, pp. 519-526.
Pelzer (1985): Netze in der Landesvermessung und Ingenieurgeodäsie II, Konrad Wittwer.
Perkins, Hagen (1981): The Perception of Pictures II. Academic Press.
Reiterer, Lehmann, Miljanovic, Ali, Paar, Egly, Eiter, Kahmen (2009): A 3D optical
deformation measurement system supported by knowledge-based and learning techniques.
Journal of Applied Geodesy, Vol. 3, pp. 1-13.
Rhodes, Brennan, Carey (1987): Identification and ratings of caricatures: Implications
formental representations of faces.CognitivePsychology, Vol. 19-4, pp. 473-497.
Rhodes, Tremewan (1994): Understanding face recognition: caricature effects, inversion, and
the homogeneity problem. Visual Cognition, Vol. 1, pp. 275-311
Rhodes, Tremewan (1996): Averageness, exaggeration, and facial attractiveness.
Psychological Science, Vol. 7-2, pp. 105-110.
Ryan, Schwartz (1956): Speed of perception as a function of mode of presentation. American
Journal of Psychology, Vol. 69-1, pp. 60-69.
Scheikl, Poscher, Grafinger (2006): Application of the new automatic laser remote monitoring
system (ALARM) for the continuous observation of the mass movement at the Eiblschrofen
rockfall area – Tyrol. Workshop on Advances Techniques for the Assessment of Natural
Hazards in Mountain Areas, Igls.
Schultz, Zogg (2005): Terrestrisches Laserscanning in der Geomatik. Geomatik Schweiz, Vol.
8, pp. 420-424.
Stevenage (1995): Can caricatures really produce distinctiveness effects? British Journal of
Psychology, Vol. 86, pp. 127-146.
Svakhine, Ebert Stredney (2005): Illustration motifs for effective medical volume illustration.
IEEE Computer Graphics and Applications, Vol. 25-3, pp. 31-39.
Teskey (1985): Determining Deformation by Combining Measurement Data with Structural
Data. Precise Engineering and Deformation Surveys Workshop, Calgary Alberta.
Viola, Kanitsar, Gröller (2004): Importance-driven volume rendering. In Proceedings of IEEE
Visualization 2004, pp. 139-145.
Viola, Kanitsar, Gröller (2005): Importance-driven feature enhancement in volume
visualization. IEEE Transactions on Visualization and Computer Graphics, Vol. 11-4, pp.
408-418.
Weigle, Taylor (2005): Visualizing intersecting surfaces with nestedsurface techniques. In
Proceedings of IEEE Visualization 2005, pp. 503-510.

TS number – Session title (e.g. TS 1A – Standards )
Alexander Reiterer, Peter Rautek, Eduard Gröller
A Novel Method for the Visualization of Deformation Data
FIG Congress 2010
Facing the Challenges – Building the Capacity
Sydney, Australia, 11-16 April 2010
15/15
BIOGRAPHICAL NOTES
Dr. Alexander Reiterer
2001: UK Graduated Engineer, Vienna University of Technology, Austria.
2004: Doctor of Technical Science, Vienna University of Technology, Austria.
2006 and 2008: Guest Researcher at ETH Zurich and University of Calgary, Canada.
Dr. Peter Rautek
2005: Master of Computer Graphics & Digital Image Processing, Vienna University of
Technology, Austria
2009: Doctor of Technical Sciences, Vienna University of Technology, Austria
Since 2009: Assistant Professor, Vienna University of Technology, Austria
Dr. Eduard Gröller
1993: Doctor of Technical Sciences, Vienna University of Technology, Austria
1997: Associate Professor at Vienna University of Technology, Austria
2005: Adjunct Professor at University of Bergen, Norway
CONTACTS
Dr. Alexander Reiterer
Institute of Geodesy and Geophysics, Vienna University of Technology
Gusshausstrasse 27-29, 1040 Vienna, AUSTRIA
Tel. +49-1-58801-12845
Fax + 49-1-58801-12894
Email: [email protected]
Web site: http://info.tuwien.ac.at/ingeo
Dr. Peter Rautek
Institute of Computer Graphics and Algorithms, Vienna University of Technology
Favoritenstrasse 9-11, A-1040 Vienna, AUSTRIA
Tel. +49-1-58801-18644
Fax + 49-1-58801-12898
Email: [email protected]
Web site: http://www.cg.tuwien.ac.at
Dr. Eduard Gröller
Institute of Computer Graphics and Algorithms, Vienna University of Technology
Favoritenstrasse 9-11, A-1040 Vienna, AUSTRIA
Tel. +49-1-58801-18682
Fax + 49-1-58801-12898
Email: [email protected]
Web site: http://www.cg.tuwien.ac.at