a nutrition education program for promoting healthy
TRANSCRIPT

A NUTRITION EDUCATION PROGRAM FOR PROMOTING HEALTHY BEVERAGE CONSUMPTION IN HIGH SCHOOLS
A Thesis Submitted to the College of
Graduate Studies and Research
in Partial Fulfillment of the Requirements
for the Degree of Master’s of Science
in the College of Pharmacy and Nutrition
University of Saskatchewan
Saskatoon
ByElisabeth Lo
© Copyright Elisabeth Lo, September 2005. All rights reserved.
i
PERMISSION TO USE
In presenting this thesis in partial fulfillment of the requirements for a Postgraduate
degree from the University of Saskatchewan, I agree that the Libraries of this University
may make it freely available for inspection. I further agree that permission for copying
of this thesis in any manner, in whole or in part, for scholarly purposes may be granted
by the professor or professors who supervised my thesis work or, in their absence, by the
Head of the Department or the Dean of the College in which my thesis work was done.
It is understood that any copying or publication or use of this thesis or parts thereof for
financial gain shall not be allowed without my written permission. It is also understood
that due recognition shall be given to me and to the University of Saskatchewan in any
scholarly use which may be made of any material in my thesis.
Requests for permission to copy or to make other use of material in this thesis in
whole or part should be addressed to:
Dean of the College of Pharmacy and Nutrition
University of Saskatchewan
110 Science Place
Saskatoon, Saskatchewan
S7N 5C9

ii
ABSTRACT
The rise of unhealthy beverage consumption, such as soft drinks, in children and
youth for the last 25 years has increased the risk of low bone mass density by replacing
milk (a major source of calcium intake), compromised dental health, and possibly
contributed obesity. A school-based nutrition education intervention was developed to
promote a change in this behavior. This study examined the effectiveness of this
nutrition education program, called FUEL (Fluids Used Effectively in Living), in
promoting healthy beverage consumption among high school students.
The FUEL nutrition education manual consisted of six classroom sessions; it was
delivered in four classes of grade nine students using different approaches, either
multiple or single strategies. The nutrition intervention used multiple teaching methods
which included six lessons delivered as visual, group interaction, tactile, individual, and
auditory teaching styles. The multiple strategies approach was delivered through peer
educators (led by a dietitian) in one class and dietitian-only in another class. In the single
strategy approach, also called “self-taught”, two classes received only the handouts in
the FUEL manual. This latter approach was considered the control to the nutrition
intervention. The two classes that received either peer education or self-taught approach
were in two high schools in Saskatoon. The two classes with either dietitian-taught or
self-taught approaches were in a high school in Prince Albert. The beverage intake,
knowledge, and attitude of students were assessed by a self-administered questionnaire
before the intervention, a week after the intervention, and three months after the
intervention. In Saskatoon only, a one year follow-up beverage intake assessment was
performed.

iii
None of the schools in the FUEL study provided healthy beverage choices for the
students. Generally, students in our study consumed an adequate amount of milk, but
they drank sugary beverages daily. There was a tendency to replace milk and 100% fruit
juices with sugary drinks. After the intervention, students in multiple teaching strategies
decreased their sugary beverage intake significantly. The findings indicated that a
school-based nutrition education with multiple teaching strategies may lead to positive
knowledge, attitude and behavioural change which will have beneficial effect on long-
term health.

iv
ACKNOWLEDGEMENTS
I would like to express my gratitude to all those who gave me the possibility to
complete this thesis, especially to Dairy Farmers of Canada for the funding for the study.
My thanks also to Dr Stirling Foundations on Research in Teaching and Learning for
funds contributed. I am deeply indebted to my supervisors, Dr. Susan Whiting and Dr.
Carol Henry, who gave me the opportunity to do my program under their supervision. I
also want to thank them for their help, support, guidance, encouragement, and patience
in all the time of my program.
I also want to extend my gratitude to all of my committee members, Dr. Roy
Dobson, Dr. Louise Humbert, and Dr. Phyllis Patterson, whose questions and
suggestions stimulate me to understand deeper my research area. I would like to
acknowledge with much appreciation my external examiner, Dr. Debbie Pushor.
I am very grateful that during my study I came to know Hassanali Vatanparast,
Saman Abeysekara, and Mei Li, who have helped me a lot in adapting myself in a new
environment. Other thanks go to my fellow graduate students for their friendship,
support, and advice. Special thanks go to Tracy McLennan, Beryl McCullough, and
Sandy Knowles for their help, hospitality, and friendship.
v
TABLE of CONTENT
PERMISSION TO USE…………………………………………………………….……i
ABSTRACT………………………………………………………………………..……ii
ACKNOWLEDGEMENTS………………………………………………………..……iv
TABLE OF CONTENTS…………………………………………………………...……v
LIST OF TABLES………………………………………………………………….….viii
LIST OF FIGURES……………………………………………………………….….…..x
LIST OF APPENDICES………………………………………………………………...xi
1. INTRODUCTION……………………………………………………….….………..1
1.1. Rationale………………………………………………………………..………..1
1.2. Purpose of the Study…………………………...….…………………………….3
1.3. Objectives………………………………………………………..……….……...3
1.4. Hypothesis…………………………………………………..…….……………..3
1.5. The Significance of the Study…………………………………….………….….4
1.6. Definitions………………………………………………………...……………..5
1.7. Summary……………………………………………………..………………….6
2. LITERATURE REVIEW…………………………………………………...………..7
2.1. Introduction…………………………………………………………..………….7
2.2. Beverages……………………………………………………………..…………7
2.2.1. Need for Fluids………………………………………………...…………7
2.2.2. Types of Beverages………………………………………..……………..9
2.2.2.1.Milk……………………………………..…………………………..10
2.2.2.2.Soft Drinks……………………………………………...…………...12
2.2.2.3.Fruit Juice………………………………………..………………….13
2.2.2.4.Other Beverages………………………………..…………………...15
2.3. Beverage Intake Assessment…………………………………………...………17
2.3.1. Food Frequency Questionnaires (FFQs)……………………..…………18
2.3.2. Twenty-four Hour Recalls (24 hour recalls)……….……………….…..19
2.4. Beverage Intakes of Adolescents……………………………….……….……..19
2.5. Effects of Soft Drinks on Adolescent Health………………….………….....…24
2.5.1. Soft Drinks and Bone………………………………………………..….24
vi
2.5.1.1.Bone Metabolism………………...……………………..….….…….24
2.5.1.2.Effects of Soft Drink Intake on Bone Health……………..….…......27
2.5.2. Soft Drinks and Dental Health………………………………..….….….31
2.5.2.1.Teeth………………………….………….………………………….31
2.5.2.2.Effect of Soft Drink Intake on Dental Health………….……..….….33
2.5.3. Soft Drinks and Obesity………………………….…….….……….…...36
2.5.3.1.Obesity……………………….………………………….….…….....36
2.5.3.2.Contribution of Soft Drink Intake to Obesity………….…….……...38
2.6. Soft Drinks in High School………………………………………….…..……..41
2.6.1. Product Selling……………………………………...…….…….….…...41
2.6.2. Direct Advertisement…………………………………………....………43
2.6.3. Indirect Advertising……………………………………………...….…..43
2.7. School Based Intervention for Adolescents……………………………..….….45
2.7.1. Teacher- and Adult-led in School Based Intervention Studies…............46
2.7.2. Parental and Family Involvement…………………………………….…50
2.7.3. Peer Educator Intervention………………………………………….......51
2.8. Summary……………………………………………………………………….54
3. METHODS………………………………………………………………..………...57
3.1. Subjects…………………………………………………………..……..…..….57
3.2. Intervention………………………………………………..……………….......58
3.3. Intervention Delivery………………………………………..…………………60
3.4. Beverage Intake Assessments………………………….…………….……..….61
3.5. Statistical Analysis………………………………………..………………..…..62
3.6. Process Evaluations………………………………..……….……….………….63
4. RESULTS…………………………………..………………….……………………64
4.1. Introduction……………………..………………………….…………….…….64
4.2. School Environment………………..……………………….…………….……64
4.2.1. Saskatoon Peer Educator School (Class A)………….…..………….…..64
4.2.2. Saskatoon Self-taught School (Class B)…………….………..…………65
4.2.3. Prince Albert School (Class C and D)…………...……………………...65
4.3. Students’ Beverage Intake, Knowledge, and Attitude at the Baseline…….…...66

vii
4.4. Beverage Intake of Students in Classes A and B………………………………74
4.5. Beverage Intake of Students in Classes C and D…………..…………….….…84
4.6. The Summary of Findings……………………………………..……….………91
5. DISCUSSION………………………………..…………………………………..…...93
5.1. School Environment………………………..………………………………93
5.2. The Baseline Survey…………………………..…………………………....94
5.2.1. The beverage Intake of Students in Four Classes of Grade Nine in
Saskatchewan……..…………………………………………….94
5.2.2. Students’ Knowledge and Attitude at the Baseline…..…………..98
5.3. Students’ Beverage Intake after the Intervention…………..……………..100
5.3.1. Peer Educator and Self-taught Approaches (Classes A and B)....100
5.3.2. Dietitian-taught and Self-taught Approaches (Classes C and D).106
5.3.3. Multi and Single Strategy Teaching Methods…………………..107
5.4. Strength and Limitation…………………………………………....……...108
6. CONCLUSION…………………………………………………..………….……...110
6.1. Conclusion…………………………………………..….……………….…….110
6.2. Implication for Practice……………………………..………………………...111
6.3. Further Research……………………………………...…………………….…112
7. REFERENCES………………………………………………………...……………1138. APPENDICES………………………………………………………...………….…139

viii
LIST of TABLES
Table 2.1 Beverage intake of adolescents in selected studies………………….....21
Table 2.2 Studies of the effects of soft drink intake on bone…………..………….30
Table 2.3 Studies of the effects of soft drink intake on dental health…………..…35
Table 2.4 Studies of the relationship of soft drink intake and obesity…..………...39
Table 2.5 Energy content in beverages served at Canadian fast food restaurants....40
Table 2.6 Examples of contracts between soft drink companies and US schools districts……………………………………………………..…………...42
Table 2.7 Adult taught approach in school-based nutrition education interventions for adolescents from 1990-2004…………..…………………………….48
Table 2.8 School-Based nutrition education interventions for adolescents from 1990-2004 using parental involvement and peer-leader components…..53
Table 3.1 The gender composition of each class……………………..…………....58
Table 3.2 Lesson Plan Description for FUEL…………………………….…….…59
Table 3.3 Timing for beverage intake assessments……………………….…….…62
Table 4.1 Attitude of students in classes A, B, C, and D towards healthy beverages………………………………………………………….….…70
Table 4.2 Attitude of grade 9 students towards healthy beverages……………..…71
Table 4.3 Beverage intake of grade 9 students according to selected attitude
questions…...............................................................................................72
Table 4.4 Correlation among percent contribution of beverages consumed by grade 9 students in four classes in Saskatchewan…………………………..…73
Table 4.5 Percentage of students that drank soft drinks, fruit juice, milk, and water at schools……………………………………………....73
Table 4.6 Correlation among the beverage intake percentage of students in class A…………………………………………………………………….…..77
Table 4.7 Correlation among the beverage intake percentages of girls in class A..79
Table 4.8 Correlation among the beverage intake percentage of male students in class A……………………………………………………....80
Table 4.9 Correlation among the beverage intake percentage of students in class B……………………………………………………..………………….81
Table 4.10 Correlation among the beverage intake percentage of females class B...82
Table 4.11 Correlation among the beverage intake percentage of male
ix
students in self-taught class………………………………………….....83
Table 4.12 Satisfaction level and comments of students in class A and B………....83
Table 4.13 Correlation among the beverage intake percentage of students in class C………………………………………………………………………...87
Table 4.14 Correlation among the beverage intake percentage of female students in class C…………………………………………………………………....87
Table 4.15 Correlation among the beverage intake percentage of male students in class C……………………………………………………………..….88
Table 4.16 Correlation among the beverage intake percentage of students class D..89
Table 4.17 Correlation among the beverage intake percentage of female students in class D…………………………………………………………………..89
Table 4.18 Correlation among the beverage intake percentage of male students in class D………………………………………………………………..…90
Table 4.19 Satisfaction level and comments of students in class A and B………….91
Table 4.20 Summary of significant beverage intake relationships (immediate post-test)…………………………………………………………………..….92
Table 4.21 Summary of significant beverage intake relationships (3-month post-test)…………………………………………………………………….92

x
LIST of FIGURES
Figure 3.1. Timeline of the FUEL study………………………………………...62
Figure 4.1 Beverage intake of students in four classes of grade 9 in Saskatchewan high schools………………………………………….67
Figure 4.2 Percentage of beverage intake of students in four classes of grade 9 students in Saskatchewan………………………………..67
Figure 4.3 Beverage intake of girls in four classes of grade 9 in Saskatchewan high schools………………………………………….68
Figure 4.4 Percentage of beverage intake of boys in four classes of grade 9 students in Saskatchewan…………………………………...68
Figure 4.5 Knowledge score of students in four grade 9 classes in Saskatchewan high schools…………………………………….…….69
Figure 4.6 Attitude score of grade 9 students in four classes in Saskatchewan high schools……………………………………69
Figure 4.7 Beverage intake of students in class A……………………………...75
Figure 4.8 Beverage intake of students in class B………………………………75
Figure 4.9 Beverage intake of girls in class A………………………………….76
Figure 4.10 Beverage intake of boys in class A………………………………….76
Figure 4.11 Beverage intake of girls in class B…………………………………..78
Figure 4.12 Beverage intake of boys in class B………………………………….78
Figure 4.13 Beverage intake of students in class C………………………………85
Figure 4.14 Beverage intake of students in class D……………………………...85
Figure 4.15 Beverage intake of female students in class D………………………86
Figure 4.16 Beverage intake of male students in class D…………..…………….86

xi
LIST of APPENDICES
1. Ethic Approval………………………………………………………..….………...140
1.1 Ethic approval for the first phase study……………………...………...140
1.2 Ethic approval for the second phase study…………………………….141
2. Written Consent for Students……………………………………………………...142
2.1 Written Consent for Saskatoon Students………………………………142
2.2 Written Consent for Prince Albert Students…………………………...144
3. Beverage Frequency Questionnaire (Pre-test)……………………………………..147
4. Beverage Frequency Questionnaire (Post-test)…………………………………….149

1
1. INTRODUCTION
1.1. Rationale
Adolescents need greater amounts of nutrients than adults to support the growth
and development, and to prevent chronic disease that may occur during adulthood
(Spear, 2002; Story & Neumark-Sztainer, 1996). Unfortunately, adolescents often do not
have enough knowledge and experience to make appropriate decisions and tend to
develop unhealthy eating habits. These include skipping breakfast, replacing the lunch
meal with snack food, and increasing soft drink intake, all of which can lead to
inadequate nutrient intake (Spear, 2002). Furthermore, adolescents’ decision making
process was also influenced by the commercial activities, peers, and environment
(O’Dea, 2003; McKinley et al., 2005). This places adolescents in a nutritionally
vulnerable position. Healthy behaviors, including consuming nutritious beverages, are
important for adolescents to improve their school performance, growth, and
developmental tasks (e.g. developing identity) (Massey-Stokey, 2002). He, Kramer,
Houser, Chomitz, and Hacker (2004) also observed a positive relationship between
appropriate health behaviors and higher academic achievement. Healthy eating
behaviours are learned during childhood and adolescence and maintained through
adulthood (Lytle, 2002). Eating behaviours may have an impact on later nutritionally
related chronic diseases, such as cardiovascular disease, obesity, and osteoporosis.
Adolescents gain their nutrients not only from solid foods but also from beverage
intake. Drinking is not only for eliminating thirst and maintaining body fluid
requirement, but also for providing calories, protein, vitamins, and minerals.
Adolescents consume a high amount of milk, fruit juice, and soft drinks (Forshey &
Storey, 2003; Rampersaud et al., 2003), which are in the top ten contributing sources for
several nutrients, such as energy, protein, fat, calcium, iron, vitamin C, vitamin A, and
fiber. Milk contributes to energy, protein, fat, calcium, vitamin C, and vitamin A intake,
while fruit juice contributes energy, calcium, iron, vitamin C, vitamin A, and fibre

2
intake. Carbonated beverages supply energy, and fruit drinks contribute to vitamin C
intake (Philips, Starkey, and Gray-Donald, 2004).
Over the past 25 years, adolescents have changed their beverage intake patterns
by doubling their soft drink intake and decreasing their milk intake (Bowman, 2002;
Cavadini, Siega-Riz, & Popkin, 2000; French, Lin, & Guthrie, 2003). This shift has had
a negative impact on health by lowering nutritional quality and decreasing micronutrient
intake. High soft drink intake may increase the risk of bone fractures (Petridou et al.,
1997; Wyshak, 2000; Wyshak & Firsch, 1994), replace milk intake (McGartland et al.,
2003; Whiting, et al., 2001), contribute to obesity (Mrdjenovic & Levitsky, 2003; St-
Onge et al., 2003), and lead to dental caries and erosion (Heller, Burt, & Eklund, 2001;
Dinçer, Hazar, & Sen, 2002).
High-fructose corn syrup is the main ingredient in a sweetened soft drink
(American Academy of Pediatrics, 2004). When soft drinks are consumed once in a
while, it appears not to be a problem; however, each 12 oz (355 mL) serving of a
carbonated sweetened soft drink contains the equivalent of 10 teaspoons (40 g) of sugar
and 142 calories. Therefore, adolescents should change their beverage intake habits by
decreasing sugary beverage intake.
Several interventions using a school-based approach have successfully led to
significant or moderate changes in adolescents’ dietary habits (Himes et al., 2003;
James, Thomas, Cavan, & Kerr, 2004). My thesis emphasizes a school-based approach
to promotion of healthy beverage intake patterns for adolescents using multiple
strategies of teaching because beverage intake affects the composition and quality of the
adolescent’s and children’s daily dietary intake (Lee, Gerrior, & Smith, 1998; Stubbs &
Whybrow, 2004; Troiano, Briefel, Carroll, & Bialostosky, 2000; Frary, Johnson, &
Wang, 2004; Marshall, Gilmore, Broffitt, Stumbo, & Levy, 2005). The multiple
strategies used in the FUEL study were peer educator approach and dietitian-taught
approach, and the single strategy was self-taught approach.

3
1.2. Purpose of the Study
The purpose of this study was to examine the effectiveness of a nutrition
education program in promoting healthy beverage consumption among high school
students.
The study consisted of the evaluation component of a larger study which also
included the development and presentation of a nutrition education program FUEL
(Fluids Used Effectively for Living), to be described later, to grade nine high school
students in two high schools in Saskatoon (fall of 2003) and a high school in Prince
Albert (Fall 2004). To evaluate the nutrition education program, quantitative data on
beverage knowledge and behaviour pre and post intervention were collected.
1.3. Objectives
The specific objectives of the study before the intervention were to
1. Examine the beverage consumption habits of grade 9 high school students,
2. Contrast the beverage consumption habits of girls and boys,
3. Explore students’ knowledge and attitude towards healthy beverage consumption,
After the intervention, the specific objectives were to
1. Compare a self-taught model of program delivery with a peer educator model,
2. Compare a self-taught model of program with a dietitian-taught model,
3. Contrasting a peer educator model of program delivery with a dietitian-taught model,
4. Evaluate the effectiveness of each program delivery approach in altering beverage
consumption after the intervention.
1.4. Hypothesis
The hypothesis of the study is that the multiple strategies (peer educator and
dietitian-taught) approach will be more effective in positively changing the beverage
consumption behaviors of adolescents than a single strategy (self-taught) approach. The
alternative hypothesis is that all of the approaches are the same in positively changing
the beverage consumption behaviours of adolescents.

4
1.5. The Significance of the Study
Schools provide a variety of choices of beverages for students through vending
machines and cafeteria. The allocations of the vending machines in strategic high-traffic
areas, such as outside the school cafeteria, in the lobby, in main hallways provide
opportunities for children and adolescents to consume beverages at school (Consumer
Union, 1995). This situation can create confusion in students because schools are
supposed to convey a healthy message. The Alberta Public Health Association (APHA,
2003) and Public Health Nutritionists of Saskatchewan (2004) reported that food and
beverage vending machines, most of which offer high-fat, high-added sugar choices, are
widely available in high schools in Canada and are becoming more visible in junior high
schools. Most students will drink milk when they are offered milk (Pilant & Skinner,
2004), but studies show that they are more likely to choose soft drinks over milk
(Forshee & Storey, 2003).
Adolescents increase their independence in making decisions as they get older.
Adolescents also begin to buy and prepare food themselves either because they have to
or they want to (Spear, 2002; Hern & Gates, 1998). Unfortunately, adolescents lack
knowledge and skills to make healthy food choices. A nutrition education program can
make adolescents gain knowledge and skills from nutrition education and increase their
self-efficacy (Long & Stevens, 2004), so they are able and choose to make healthy
decisions. Furthermore, nutrition education interventions for youths are cost effective
because it can decrease the risk of chronic diseases in adulthood (Hoelscher, Evans,
Parcel, Kelder, 2002).
McManis and Sorensen (2000) acknowledged the importance of school health
education programs. Being healthy can optimize students’ learning ability, and adequate
nutrition and physical activity support students’ performance. The skills gained by
participants in a nutrition education study can help students maintain their health and
increase their academic performance. Moreover, an intervention focused on healthy
beverages is important because beverages contribute to the overall diet quality of the
adolescent’s dietary intake. To design effective strategies in improving children’s and
adolescents’ health, health educators need to understand the effect of beverage

5
consumption on nutrition, in particular the relationship between types of beverages
consumed and health (Park, Meier, Bianchi & Song, 2002).
Findings from the FUEL study would support development of any potential
comprehensive policies supporting the sales and consumption of healthy food and
beverages at school. The Saskatchewan School Trustee Association found that in 1993,
only 18% of school boards had a written policy regarding the sale of food in schools.
1.6. Definitions
Adolescence: a transition time from childhood to adulthood, which is started by puberty
at the age of 10 years and ended by the acceptance of adult lifestyle at the age of 19
years (Sturdevant & Spear, 2002; Sacks, 2003).
Nutrition education intervention: an instructional method of healthy eating promotion
aimed at facilitating the voluntary adoption of nutrition related behaviours beneficial to
health and well being (CDC, 1996; Boyle, 2003).
Multiple strategies: the combination of several teaching methods and styles, including
lecture, role-playing, discussion and interaction, visual (using illustration), and tactile
methods (using hands-on activities) (Soliven, 2003).
Single strategies: the usage of one teaching method, such as lecture method only or
visual method only (Soliven, 2003).
Peer: a person who is considered a member of a particular group, both by themselves
and by other group members (McDonald & Grove, 2001).
Same age peers: peers that have the same age as target population and usually come
from the same neighborhood or share the same class (Telch, Miller, Killen, 1990). Same
age peers were chosen among the target population themselves.
Cross age peers: peers who are slightly older (several years, 1-4 years) than the target
population (Van Keer, 2004). The FUEL study chose as the cross age peers those who
had recently left high school.
Older peers: peers, who were much older than the target population, but share the same
situation and place to live (Taylor, Serrano, & Anderson, 2001).

6
FUEL or Fluid Used Effectively for Living is an interactive nutrition education resource
package that focuses on promoting healthy beverage intake and increase physical
activity among high school students. The resource is described in detail in section 3.2.
Soft Drinks: non-alcoholic beverages mostly containing water, carbon dioxide, flavors,
colors, caffeine, acidulants, preservatives, potassium, sodium and sweeteners (Jorge,
2003).
Carbonated Soft Drinks (CSD): soft drinks with carbon dioxide that give an
effervescent taste to the beverages (Ashurst, 1998), which include cola and non-cola
beverages.
Non-Carbonated Soft Drinks (NCD): soft drinks without carbon dioxide and sparkling
taste (Taylor, 1998), which include fruit punch, fruit drinks, ice tea, coffee with sugar,
and sport drinks.
Sugary Beverages: the combination of carbonated soft drinks and non-carbonated soft
drinks.
1.7. Summary
The rise of unhealthy beverage consumption, such as soft drinks, for the last 25
years has increased the risk of low bone mass density, replaced milk and calcium intake,
compromised dental health, and contributed to obesity. A school-based nutrition
education intervention may change the behavior of adolescents. This study examined the
effectiveness of a nutrition education program in promoting healthy beverage
consumption among high school students.
7
2. LITERATURE REVIEW
2.1. Introduction
To support the study of adolescents and the effectiveness of a nutrition
intervention which focused on beverages, the literature review will discuss the need for
fluids in the body, types of beverages, beverage intake of adolescents, including current
and past beverage intake of adolescents. The increasing trend of beverage consumption
suggests a need to understand the impact of soft drink consumption on adolescent health,
especially bone health, dental health, and obesity.
The review will also describe the extent of availability of soft drinks in school,
approaches used to conduct school based interventions such as teacher-led interventions,
parental involvement interventions, and peer educator interventions.
Most of the research in Canada on the impact of soft drink consumption on
adolescent health has placed emphasis on bone health. Two of the most influential
studies were conducted on Saskatchewan children (Iiliano-Burns, Whiting, Faulkner, &
Bailey, 1999; Whiting, Healey, Psiak, Mirwald, Kowalski, & Bailey, 2001). Each has
provided insights on aspects of adolescent’s beverage intake ( Iuliano-Burns et al.,
1999), and the relationship between carbonated drinks and bone health (Whiting et al.,
2001). There is no paper with national on Canadian adolescents until 2005, so all papers
discussed here were done either in United States or European countries.
2.2. Beverages
2.2.1 Need for Fluids
Thirst drives humans and animals to drink fluid in order to preserve body fluid
homeostasis and survive (McKinley & Johnson, 2004). Water composes 75% of an
infant body, 60% of a young adult body and 50% of an elderly body (Sheng, 2000;
Institute of Medicine, 2004). The roles of water in the body include the following: as a
reactant; as a medium for dissolving nutrients, gases, and enzymes; and as a body heat
regulator (Whitmire, 2004). Water helps to remove toxins and waste products, and

8
develops macromolecule structures, such as protein and glycogen (Kleiner, 1999; Sheng,
2000; Altieri, Vecchia, & Negri, 2003). The body keeps water in a balanced state by
controlling intake and excretion. However, the body can suffer from either a negative or
a positive water balance.
Negative water balance, dehydration, is defined as a reduction of water and salt
in varying proportions compared with the normal state, which may be caused by failure
to replace obligatory water losses or failure of the regulatory mechanism (Lorenz &
Kleinman, 2003; Fiordalisi & Finberg, 2003). Dehydration leads to hypernatremia,
which can be caused by one or more of the following: water loss in excess of sodium
chloride, inadequate water intake, addition of sodium chloride (salt poisoning), osmotic
diuresis (with glucosuria), and diuretic therapy when free water intake is inadequate
(Fiordalisi & Finberg, 2003; Lorenz & Kleinman, 2003). When the body loses salt to a
greater extent than that of water, hyponatremic dehydration occurs (Fiordalisi &
Finberg, 2003). There is no universally accepted or defined measurement of
hyponatremia. For example, Senkfor, Berl, and Liu (2003) defined hyponatremia as a
serum sodium concentration <135 mEq/L, but hyponatremia is diagnosed when a serum
sodium concentration ≤ 130 mEq/L by Han and Cho (2002). Hyponatremia can occur in
different states: low total body sodium known as hypovolemia, normal total body
sodium known as euvolemia, or excess total body sodium known as hypervolemia.
The signs of dehydration include thirst, headache, fatigue, loss of appetite, heat
intolerance, dry mucous membranes, increased skin turgor, reduction in urine output,
elevated urine osmolarity (except when caused by failure of the kidney to conserve free
water), increased blood urea nitrogen, and increased hematocrit. The outcomes of
dehydration are weakness, lethargy, hypotension, and shock (Lorenz & Kleinman, 2003;
Kleiner, 1999). After being restricted from water intake to induce body mass deficits by
1-2%, 15 healthy adults felt tired and headachy, and suffered a decrease in self ratings of
alertness and ability to concentrate (Maughan, 2003). When excessive loss of water and
electrolytes in adults and elderly subjects was not compensated by adequate water
intake, water content of the stools was reduced, and constipation occurred (Arnaud,
2003). Hypernatremia also causes malaise, thirst, and fever as clinical symptoms;
generalized weakness, lethargy, confusion, irritably, and delirium as neurologic

9
symptoms; nausea and vomiting as gastrointestinal symptoms (Kruse, 2003).
Dehydration can reduce children’s ability to manage their body temperature, which can
lead to heat disorders during physical activity, such as heat cramps, heat exhaustion, and
heat stroke (Squire, 1990).
Humans maintain their water balance by consuming an equal amount of water to
that which is excreted. Water is excreted in four ways: the respiratory tract, skin (as
sweat), gastrointestinal tract, and kidneys. Insensible water loss from skin is affected by
ambient temperature, and activity, and inversely with ambient humidity (Lorenz &
Kleinman, 2003). Humans need to drink since the water in the food and the water
produced by oxidation of food (metabolic water) is inadequate to replace the loss and a
minimum 1.44 L of water is needed to cover the lost and to maintain the water balance
(Sheng, 2000). Valtin (2002) could not find any proof that at least 1.92 L of fluid a day
is needed. In the age range 14-18 years, boys’ AI (Adequate Intake) is 3.3 L/day and
girls’ AI is 2.3 L/day (Institute of Medicine, 2004).
A positive water balance will increase water volume and decrease osmolarity of
both the intracellular and extracellular fluids. This is followed by acute water
intoxication (Sheng, 2000). The elevation of total body water, when sodium level is
normal, has caused water intoxication (Lorenz & Kleinman, 2003). However, excessive
water consumption is rarely the reason for water intoxication, which more often results
when renal damage impairs free water excretion. Water intoxication causes a decrease in
serum sodium, and severe states causes nausea, vomiting, seizures, headache, muscle
twitching, convulsion, and coma can occur (Lorenz & Kleinman, 2003; Sheng, 2000).
The accumulation of the excess fluid in the body, edema, happens when an imbalance of
forces results the diffusion of the water across either the cell membrane or the capillary
endothelium (Sheng, 2000).
2.2.2. Types of Beverages
Drinking water may be obtained through several common beverages: plain water,
bottled water, fruit and vegetable juices, fruit drinks, soft drinks, syrup, stimulant
beverages, and milk. Plain water includes tap water or mineral water and bottled water.
All of them are tasteless and contain some minerals. Plain water is the primary source of

10
water intake (The Swiss Association for Nutrition, 2003). However, children aged 11-12
years drank beverages other than water as 68% of their fluid intake (Zohouri et al.,
2004). The 68% consisted of 26% carbonated soft drinks, 4% noncarbonated soft drink,
9% fruit juice, 17% milk, 9% tea, and 3% coffee and others. NHANES III (1988-1994)
showed that children aged 10 drank 15% milk, 13% juice, and 10% carbonated drinks
(Sohn, Heller, & Burt, 2001). Types of beverages consumed affect the composition of
modern diet (Stubbs & Whybrow, 2004). Troiano, Briefel, Caroll, and Bialostosky
(2000) found that 20-24% of energy intake came from beverages. Lee, Gerrior, and
Smith (1998) showed that energy intake in teenagers was affected by the types of milk
they consumed.
Milk, soft drinks, and fruit juice are important beverages for adolescents because
they consumed high amount of these beverages (Forshey & Storey, 2003; Rampersaud et
al., 2003). Furthermore, Philips, Starkey, and Gray-Donald (2004) reported these
beverages were in the top ten contributing foods for several nutrients, such as energy,
protein, fat, calcium, iron, vitamin C, vitamin A, and fibre. Milk contributes to energy,
protein, fat, calcium, vitamin C, and vitamin A intake, while fruit juice contributes
energy, calcium, iron, vitamin C, vitamin A, and fibre intake, and soft drinks contributes
in energy and vitamin C (in fortified fruit drinks) intake. The beverages to be discussed
are milk, soft drinks, and fruit juice, which are the main ones for adolescents.
2.2.2.1. Milk
According to Dairy Producers Regulations (1995), milk refers to “the natural
lacteal secretion obtained from one or more lactating females of the bovine species, and
includes cream, skim milk and any other portion of milk” (p.4). Canadian Food
Inspection System Implementation Group (2002) in the National Dairy Regulation and
Code defined milk as “a normal lacteal secretion obtained from a mammary gland of a
dairy animal.” However, whenever the consumers speak about milk, they think about
liquid cow’s milk products.
Raw milk consists of 87.1% water, 4.6% lactose, 4% fat, 3.25% protein, 0.7%
mineral substances, 0.17% organic acid, and 0.15% miscellaneous. Lactose is a reducing
sugar, composed by glucose and galactose. The fats of milk are mostly triglycerides and

11
also include phospholipids, cholesterol, free fatty acids, and diglycerides. The minerals
in milk are potassium, sodium calcium, magnesium, chloride, and phosphate. The
organic acids in milk can be found in the form of ions or salts (Walstra, Geurts,
Noomen, Jellema, & van Boekel, 1999).
The main proteins in milk are caseins, β-lactoglobulin, and α-lactalbumin.
Casein or caseinogens is the acid precipitated protein (Fox, 2003). The casein functions
as the amino acid, calcium, and phosphate provider upon digestion. Β-lactoglobulin and
α-lactalbumin are the major proteins in whey. Whey remains as liquid after isoelectric
precipitation of casein from skimmed or whole milk. Whey includes dissolve solution of
proteins, lactose, inorganic salts, vitamins and several components at trace level. This
protein can bind and improve retinol uptake in jejunum, which indicates possible tasks
in retinol transport and absorption. It also binds vitamin D2 stronger than retinol
(Sawyer, 2003). Unfortunately, there are not enough studies to explain the general
functions of β-lactoglobulin. α-lactalbumin serves as the regulatory protein of the
lactose synthase enzyme that catalyzes and regulates the synthesis of lactose in milk. α-
lactalbumin also binds calcium and zinc (Brew, 2003).
Milk contains 137 kcal energy, 0.4 mg riboflavin, 0.8 mg pantothenic acid, 0.9
µg vitamin B12 in a 250 mL (8 oz) volume. The vitamin D is added to milk (2.5 µg per
250 mL) (Department of Health, 1995), so the reasonable daily milk intake can provide
300-400 international units of the vitamin. Based on fat content, milks are categorized
into whole milk (3.4 % fat w/v), 1% milk (1.03 % fat w/v), 2% milk (2.06 % w/v), and
skim milk (<0.03 % fat w/v) (Department of Health, 1995).
For adults and adolescents, 500 mL of 1% milk supplies 9% and 12% of daily
recommended energy intake (respectively), but in the same amount it contains 50% or
more of the recommended phosphorus, calcium, vitamin D, riboflavin, and vitamin B12
(McBean, Miller, & Heaney, 2004; Institute of Medicine, 2002) . Milk intake is
positively related to a decline in risk of cardiovascular disease, hypertension,
osteoporosis, breast cancer, kidney stones, and overweight (McBean, Miller, & Heaney,
2004).

12
2.2.2.2 Soft Drinks
Soft drinks are defined as non-alcoholic beverages mostly containing water,
carbon dioxide, flavors, colors, caffeine, acidulants, preservatives, potassium, sodium
and sweeteners (Jorge, 2003). Based on their ingredients, soft drinks are divided into
carbonated and non-carbonated soft drinks. Carbonated soft drinks are further divided
into colas and non-colas, as well as diet and regular soft drinks. Other categories of soft
drinks are ready-to-drink soft drinks and dilute-to-taste soft drinks which are
concentrated or in powder form (Ashurst, 1998).
Carbon dioxide is used to carbonate soft drinks. It conveys an effervescent taste,
and the acid form of the carbon dioxide (carbonic acid) enhances the sharpness of taste.
Carbon dioxide is also beneficial in microbiological control of soft drink products
(Taylor, 1998). Non-carbonated soft drinks do not undergo carbonation process and do
not have any sparkling flavor.
The sugar used to sweeten the regular soft drinks is either sucrose or high
fructose corn syrup. Regular soft drinks have approximately the same amount of sugar
as a glass of pineapple or orange juice, 7-14 g/100 mL. Diet soft drinks use aspartame,
saccharine, acesulfam K, or sucralose as their sweeteners (National Soft Drink
Association, 2003). Aspartame sweetness intensity is very high (160-220 times sweeter
than sucrose), and it is often used in small amount per serving, so the calories provided
per serving is close to zero. Saccaharine, acesulfam K and sucralose do not contain any
calories at all (Nelson, 2000).
A soft drink is slightly acidic in order to give pleasant tartness to the product and
preserve it. The most common acidulants in soft drinks are citric acid and phosphoric
acid (National Soft Drink Association, 2003). Cola-flavored carbonated beverages use
phosphoric acid as acidulant because it can strengthen the acidity and cola flavor in very
low cost. Phosphoric acid has the same characteristics as the cola flavors, which are dry
and sometimes balsamic (Taylor, 1998; Jorge, 2003). Cola soft drinks use cola nut from
Cola nitida and Cola acuminata trees of Africa as their flavor agent (Grivetti & Wilson,
2004). Non-cola soft drinks usually use citric acid.

13
2.2.2.3. Fruit Juice
Fruit juice was adopted as important part of North American diet in 1950s
(Varnam & Sutherland, 1999). Fruit juice is defined as unfermented liquid obtained
from the crushing, comminuting, and pressing sound ripe fresh fruit, including in the
fresh, heat treated, and chilled preserved form (Department of Health, 1997; Bates,
Morris, & Crandall, 2001; Council of European Union, 2001). The appearance of juice
can be translucent, opalescent or pulpy.
Fruit juice may contain sweeteners, a preservative, amylase, cellulase, and
pectinase (Department of Health, 1997). Sugars can be added to fruit juice for several
purposes, including controlling the acidic taste and sweetening the taste. To control the
acidic taste, the sugar content may not be higher than 15 g each liter of juice. To sweeten
the juice, the sugar content should not be over 150 g each liter of juice. A maximum of
150 g sugar per liter juice can be used to sweeten and controlling the acidic taste
(Council of European Union, 2001).
Fruit juice production is based on several practical reasons. Fruits can be
preserved longer in juice form than in fresh form. Fruit juice is more convenient to
consume than whole fruits. Fruit juice has relatively the same nutrient content as fresh
fruits; the loss of the nutrient content in fruit juice can be replaced by fortification. The
processing, heating, chilling, freezing, standardizing, and transportation of fruit juice are
easier to be controlled and handled than those of the fresh fruit. The seasonal variability
of the fruit availability can be reduced by providing fruit juice which can be stored for a
quite long time (Bates et al., 2001).
Based on its consistency, juice can be classified as puree and pulp. A puree has
lower consistency than pulp (Bates, Morris, & Crandall, 2001). Fruit juice can also be
categorized as concentrated fruit juice, reconstituted fruit juice, fruit juice from
concentrate, and dehydrated or powdered fruit juice (Department of Health, 1997;
Council of European Union, 2001).
The water in concentrated juice is removed to at least 50% of its volume
(Department of Health, 1997; Council of European Union, 2001). Department of Health
(1997) allows concentrated fruit juice to contain vitamin C, food color, stannous

14
chloride, a sweetening ingredient, and a preservative. The manufacturers can add these
ingredients to fruit juice to reach good manufacturing practice.
Reconstituted fruit juice or juice from concentrate is fruit juice that is made by
adding water, natural pulp and cells, a sweetener, and flavors to the concentrated juice.
The ingredients added may be recovered from the process of producing concentrated
fruit juice, and the finished products should have the same characteristics with the
original fruit juice (Council of European Union, 2001). However, reconstituted lemon or
lime juice can be added dimethylpoplysiloxane not more than 10 ppm (Department of
Health, 1997). Dehydrated or powdered fruit juice is produced by removing all of the
water content of the juice. Fruit nectar is the unfermented but fermentable juice, puree,
or to another mixture of juice that has been added by water and sugars and/or honey. The
sugar and/or honey content may reach 20% maximum of the product total weight
(Department of Health, 1997).
The acidic taste in fruit juice is caused by tartaric, malic, citric, acetic, and
ascorbic acids at the amount of trace until above 3%. Sometimes a trace amount of
phenolic acid can be found in fruit juice; however, some fruit may contain abundant
phenolic compounds, such as anthocyanin, carotenoid, and tannin, which cause
astringency taste (Bates et al., 2001). Fruit juice contains less than 5% lipid except
avocado, olive, ackee, and oil palm juice. Protein, lipids, amino acids, mineral, and
vitamin construct fruit flavor and aroma.
Most of commercial fruit juices contain high potassium, especially orange,
pineapple, and prune juice that contain 1000-3000 mg/L (Densupsoontorn et al., 2002).
Several fruit juices, pears, lemons, oranges, wild berries, and some temperate climate
mountain fruits have more than a 1:1 calcium:phosphorus ratio (Dauthy, 1995).
However, according to Clydesdale, Kolasa, and Ikeda (1994), reconstituted 100%
orange and grapefruit, canned 100% prune, apricot nectar, and grape juice contain
calcium:phosphorus ratio lower than one. Denspsoontorn et al. (2002) also found that
orange, apple, litchi, and longan commercial fruit juice have calcium:phosphorus ratio
lower than one.
15
2.2.2.4. Others
According to Department of Health (1988) and World Heath Organization
(2001), bottled water (prepackaged water) is potable water from underground source or
'pristine' sources ('natural mineral water') or from processed waters but not obtained
from a public water supply. The water should not contain any coliform bacteria but its
condition is suitable for a specific growth of microbial flora. In the processing method,
the composition of water should not be modified by any chemical substances. However,
it can have added carbon dioxide, ozone, and fluoride. The fluoride content should not
exceed 1 ppm. The bottled water should be safe to be stored to elevated (room)
temperatures over a period of days to weeks before consumption.
The International Bottled Water Association (2004) categorized bottled water
into spring water, purified water, mineral water, sparkling bottled water, artesian water,
and well water. Spring water is the water that flows naturally to the surface of the water
from an underground source. Purified water is the water that has undergone distillation,
deionization, reverse osmosis or other suitable methods to meet the requirement set by
the United States Pharmacopeia. Mineral water naturally contains constant level and
relative proportions of mineral and trace elements. Total dissolve solids in mineral water
should not be less than 250 ppm. Sparkling bottled water has added carbon dioxide until
the carbon dioxide content reach the initial amount before processing. The commonly
sparkling prepackaged water which has added carbon dioxide is labeled differently, such
as sparkling spring water. Artesian water is obtained from a confined aquifer well (water
that is held by underground layer of rock or sand), and the water level is as high as or
above the top of the aquifer. Well water is obtained from a hole drilled in the ground that
taps the water aquifer.
Coffee and tea can be classified into stimulant beverages because they contain
stimulating substances such as caffeine, theobromine, and theophylline. Theobromine
and theophylline in dried tea leaves are approximately 0.15% and 0.05% respectively in
dried leaves, and dried coffee beans have only a trace amount of both substances.
Although dried tea leaves contain higher caffeine (3-4%) than dried coffee beans (1.5%),
caffeine in a cup of tea is lower than that in a cup of coffee. This could be caused by the

16
fact that the amount of tea leaves was lower than that of coffee in the cup (Wilson,
1999).
Coffee beans are derived from two kinds of coffee plants, which are Coffea
arabica and Coffea canephora (Robusta coffee). Robusta dried beans contain higher all
amino acids (alanine, glycine, valine, proline, leucine, isoleucine, aspartic acid,
methionine, phenylalanine, lysine, ornithine, tyrosine, and tryptophan) than arabica dried
beans, except L-glutamic acid. Robusta dried beans consists of higher D-amino acids
(46.6 mg/kg) than Arabica dried beans (30.7 mg/kg). However, the mean concentrations
of total amino acids between the two coffee beans are not significantly different (Casal,
Alves, Oliveira, & Ferreira, 2003). The total polysaccharide of Robusta beans are the
same with that of Arabica beans, but arabinogalactans in robusta beans may help the
polysaccharide of the Robusta easier to be extracted (Fischer, Reimann, Trovato, &
Redgwell, 2001). Robusta coffee provides bitter and full flavors when it is brewed, but
Arabica coffee gives an acidic taste (London International Coffee Organization, 2004).
Coffee contains not only caffeine, amino acids, and polysaccharides but also
acrylamide, a chemical substance in plastic manufacture that possibly contribute to
cancer and have neurotoxic properties (Andrzejewski, Roach, Gay, & Musser, 2004;
Health Canada-Food Program, 2003). Andrzejewski et al. (2004) found the ranges of
acrylamide levels were 172 to 539 ng/g in instant coffee crystals and 6 to 16 ng/mL in
brewed coffee.
Canada Food and Drugs Act (1990) defined green coffee or raw coffee or
unroasted coffee as the seed of Coffee arabica L., C. liberica Hiern, or C. robusta Chev,
which has been processed to its spermoderm (p. 79). This seed will undergo a roasting
mechanism until at least 10% fat content and 6% total ash. Canada Food and Drugs Act
also permits coffee to be decaffeinated until maximum 0.1% caffeine in decaffeinated
raw coffee and decaffeinated coffee, decaffeinated instant coffee is allowed to have
caffeine not more than 0.3%.
Tea is a beverage made from a mixture of the processed and dried leaves of the
tea plant, Camellia sinensis or Thea sinensis (Varnam & Sutherland, 1999). Food and
Drugs Act (1991) managed that tea “shall be the dried leaves and buds of Thea sinensis
(L.) Sims prepared by the usual trade processes” (p. 349). The processing methods of tea
17
determined the types of the tea that are green tea, oolong tea, and black and red tea.
When the processing of the fresh tea leaves stops until the drying and steaming, the
product will be green tea. When tea leaves are partially fermented before drying, oolong
tea will be produced. Black and red teas are fully fermented before drying and steaming,
but black tea is fermented by oxidation, and red tea uses microorganisms (Zuo, Chen, &
Deng, 2002).
Water soluble extractive on a dry basis is at least 30% in blended black tea
product and 25% in unblended black tea. At least 33% water soluble extractive should
be in green tea. Blended black tea, unblended black tea, and green tea contain total ash
ranged from 4 to 7% on the dry basis (Department of Health, 1991). Tea leaves consist
of high concentration of some minerals, such as iron, nickel, manganese, sodium,
potassium, magnesium, calcium, aluminium, and low concentration of zinc, copper, and
chromium (Ferrara, Montesano, & Senatore, 2001). The quantity of magnesium and
potassium in tea is higher than that of calcium and sodium, respectively. Tea can be a
potential provider of manganese; however, the lack information about the tea mineral
contents leads to the unclear understanding of the contribution of tea in mineral intake
(Cabrera, Gimeä Nez, & Loä Pez, 2003). The bioactive compound in tea is polyphenols,
particularly catechins including epigallocatechin, galic acid, and bioflavonoids (Ferrara
et al., 2001).
2.3. Beverage Intake Assessment
In assessing beverage intake of adolescents, several considerations are important
in choosing dietary intake measurement methods to achieve the purposes of the study.
These include the requirements for details and accuracy, population specification, the
time period of interest, the availability of the trained interviewer, and the cost (Subar,
2004; Johnson & Hankin, 2003). Other matters that characterized dietary methods are
their capability to capture usual intake, variability, and errors. Usual intake is the pattern
of someone’s intake, which is likely not the same everyday. Lack of precision happens
when a dietary method accounts for only a small number of days; precision can be
increased by increasing the number of days in recording the intake. Error in dietary

18
methods decreases the validity of the data. Data that are valid accurately describe the
intake of participants without any underreporting and overreporting (Black, 2001).
2.3.1. Food Frequency Questionnaires (FFQs)
Generally, in completing FFQs, the respondents were asked to indicate how often
they eat each food listed in the questionnaires. The advantages of using FFQs are that
they give moderate burden to subjects, can be self-administered in a relatively short
time, assess usual diet, and are low cost. FFQs also have several weaknesses: poor
precision, memory dependence, and complex cognitive skill requirement. Intake data
can be compromised when multiple foods are grouped within single listing (Black, 2001;
Lee & Nieman, 2003). The quality of FFQs is improved by using a detailed food list to
avoid food groupings and asking interviewers to administer the questionnaires
(Kumanyika, Tell, Shemanski, Martel, & Chincili, 1997).
In two studies, FFQs provided accuracy and reproducibility for adolescents and
6th grade students (Rockett & Colditz, 1997; Andersen, Bere, Kolbjornsen, & Klepp,
2004). Rockett, Wolf, and Colditz (1995) showed that FFQs have 0.57 Pearson
correlation for reproducibility of 0.57 for soda intake, and that girls presented a higher
reproducibility in questionnaires than boys.
However, Andersen, Bere, Kolbjornsen, and Klepp (2004) observed a high
number of students who misclassified in administering food frequency questionnaires.
This indicates that more detailed questionnaires are needed in working with children. A
longer list of foods in assessing fruit and vegetable intake provides higher validity with
24-hour recall in African-American adults (Resnicow et al., 2000). In assessing
women’s dietary pattern, FFQs showed a good agreement with 4 times 7-day weighted
dietary record (Khani, Ye, Terry, & Wolk, 2004).
Although FFQs cannot provide detailed information and depend on long-term
memory, a combination of a 24-hour recall and food frequency questionnaires can be
more effective to assess the intake of a person (Stang, 2002). Using this technique,
subjects make a list of food and beverages consumed in the previous 24 hours, so more
detailed information can be obtained. This recall only depends on short-term memory
and is easy to administer.

19
2.3.2. Twenty-four Hour Recalls (24 Hour Recalls)
The participants recall their intake in the past on specified days usually in the
immediate past 24 hours, called 24-h recall. While a 24-h recall is not able to describe a
usual intake of a person, repeated 24-h recalls can increase the precision in determine
individual usual intake (Black, 2001). The advantages of using 24-h recalls are that these
recalls require a short time to be administered, put a small burden on subjects, provide
more detailed information, depend on shorter term memory (Lee & Nieman, 2003), and
can be conducted through telephone (Messerer, Johansson, & Wolk, 2004).
In one study, the 24-h recalls gave a good reproducibility when they were used
for grade 6 students with mean age 11.6 years old. In the same participants, the recalls
gave higher estimates for the average intake of fruit and juice compared to the 7-day
food record (Andersen, Bere, & Klepp, 2004).
2.4. Beverage Intakes of Adolescents
Factors such as hunger or food cravings, taste enjoyment, time, and convenience
have been shown to influence food and beverage intake habits. Taste enjoyment was
considered an important factor in choosing beverages by girls aged 13-18 years
(Kassem, Lee, Modeste, & Johnston, 2003) and those aged 12-15 years (Lee & Reicks,
2003). Adolescents often neglect health consequences as factor in choosing beverage to
consume, and this shows that adolescents do not have enough knowledge and experience
in incorporated nutrition knowledge in making decision. Studies show that beverage
intake behaviour of adolescents changed over time. Table 2.1 shows the beverage
intakes of American adolescents for milk, juice, carbonated soft drink (CSD), and non-
carbonated soft drink (NSD). Non-carbonated soft drinks include fruit drinks, fruit ades,
and fruit punch. Three studies in Table 2.1 were consistent in showing that for the past
27 years, soft drink intake has increased (Cavadini, Siega-Riz, & Popkin, 2000;
Bowman, 2002; French, Lin, & Guthrie, 2003). Furthermore, Cavadini et al. (2000)
found that the increase of soft drink intake was followed by the increase of carbohydrate
as a proportion of total energy intake, replacing fat and protein intake.
Conversely, a study funded by the National Soft Drink Association and
conducted by Yi, Meier, Bianchi, and Won (2002) observed that there was a decline in

20
soft drink consumption from 1988 to 1998. However, across all age groups, carbonated
soft drinks were drunk at the highest amount among all beverages. It could also be seen
that the different between the amount of daily soft drink and milk consumptions was
approximately twice as high. The study has several limitations. There may have been a
misclassification between fruit juice and fruit drinks, and the use of a two-week food
diary has disadvantages when it is used for adolescents. The proportion of eating out in
adolescents was greater, so adolescents tend to forget to include their drinks when they
are away from home. Furthermore, the participants could have altered their diets to
please the researchers (Bandini, Cyr, Must, & Dietz, 1997). On several occasions,
participants may just more aware of what they eat during the study, which can lead to
alteration of usual diet.
Popkin and Nielsen (2003) pointed out an increase of calorie contribution from
soft drinks to energy intake in participants aged 2 years and older. Soft drinks
contributed 2.9% (52 cal) of total energy in 1977/78 and 5.3% (105 cal) in 1994/96. Soft
drinks were the highest source of sweeteners that provide calories in 1994/96. Calorie
input from fruit drinks doubled from 1977/78 (18 cal) to 1994/96 (31 cal). The absolute
numbers were low because they included 2 year old participants in the calculations.
The rise in soft drink intake was concurrent with the trend toward larger portion
sizes as observed by Popkin and Nielsen (2003) from 1977 until 1996. The increasing of
portion sizes occurred at home and outside. Soft drink servings underwent a change in
portion sizes as well. One serving used to be 72 mL in 1977 and rose to 96 mL in 1996,
in the home. Restaurants increased their serving size from 630 mL in 1977 to 900 mL in
1996, and fast food restaurants increased from 630 mL in 1977 to 990 mL in 1996.
Sweetened beverages, including soft drinks and fruit drinks, were consumed during
beverage breaks (50% of total sweetened beverage intake), lunch, and dinner. The access
to soft drink at home contributed 55% to the consumption of the beverages; 25% of soft
drink intake came from fast food and other restaurants, and 9% derived from school and
vending machines. Homes were still the largest source of soft drink access in 1994-
1998; however, soft drink access from fast food restaurants, vending machines, school
cafeterias has increased (French et al., 2003).

Table 2.1. Beverage Intake of Adolescents in Selected StudiesIntake (g/day)Study Age (y) N Data sources Type of Drinks Year
1965 1977 1989 1996
Boys Girls Boys Girls Boys Girls Boys Girls
Cavadini, et al(2000)
11-18 12,498 NFCS, CSFII.2 food diary and 24-hour recall
MilkJuiceCSDNSD
1181287379187
848286319160
1067294405200
738260391153
741320763207
594292518174
7463471102396
481308773264
1977/78 1987/88 1989/91 1994/96Bowman (2002) 12-19 837 girls NFCS, CSFII
MilkJuicesCSDNSD
6476518372
56477215109
5108726487
408102350134
1955 1995Lee and Nieman (2003)
> 2 US population Food disappearance
MilkCSD
474114
253550
1977/78 1994/98Boys Girls Boys Girls
French, et al(2003)
14-17 8,908 in NFCS (1977/78)3,177 in CFSII (1994/98)
NFCS, CSFII 2 food diary and 24-hour recall Soft Drink
199 198 624 397
1988 1993 1998Boys Girls Boys Girls Boys Girls
Yi, et al (2002) 15-19 87/88=414392/93=274897/98=2397
NFOR(2 wks food diary)
MilkJuiceCSDNSD
41712262482
27510556182
36012560768
25211349099
332122649108
30394456105
Note. y: yearData is presented in the mean intake NFCS: Nationwide Food Consumption Surveys. CSFII: Continuing Survey of Food Intake by Individuals. NFOR: National Family Opinion Research.
21

22
French et al. (2003) identified boys and girls aged 14-17 years as the greatest soft
drink consumers in the population of 6-17 year olds. Using the same data, Bowman
(2002), Storey, Forshee, and Anderson (2004), and Rampersaud, Bailey, and Kauwell
(2003) also confirmed these findings. However, Heller, Burt, and Eklund (2001)
analyzed the data from the Third National Health and Nutrition Examination Survey
(NHANES III, 1988-1994) and noted that the highest soft drink consumption was in the
participants aged 17-24 years.
Over time, low fat milk was consumed more than whole milk, and raw fruit
consumption was substituted by fruit juice (Cavadini et al., 2000; Yi et al., 2002). Lee
and Nieman (2003) observed a decline of milk intake in the last 40 years. These findings
were confirmed by Cavadini et al. (2000), French et al. (2003), and Bowman (2002).
The decrease in milk intake was followed by the decrease of calcium intake
(Cavadini et al., 2000; Frary, Johnson, & Min, 2004). On the other hand, Yi et al. (2002)
did not detect any differences in milk intake between 1988 and 1998. This may be
caused by the differences of the dietary method used to assess usual beverage intake.
Several behaviors that improve milk and calcium intakes of children are eating
breakfast (Bowman, 2002) and consuming flavored milk, flavored yogurt, ice cream,
and pudding (Frary et al., 2004). However, mean calcium intakes remained below the
Adequate Intake (AI) of 1300 mg/day (Cavadini et al., 2000; Frary et al., 2004). The
participants in the study by Frary et al. (2004) were 3038 children aged 6-17 year old,
and Bowman observed adolescents aged 12 to 19 year old.
There are many factors that could explain the differences in beverage intake
among the studies. These include differences in the calculation of the mean intake,
dietary assessment methods, and the age range of subjects. Three studies (Cavadini et
al., 2000; Bowman, 2002; French et al., 2003) used NFCS (Nationwide Food
Consumption Surveys) and CSFII (Continuing Survey of Food Intake by Individuals)
data. However, the amount of the soft drink intakes in 1990s in Cavadini et al.’s finding
was not the same as the others found. Cavadini et al. (2000) could have calculated the
mean of carbonated soft drink intake in the teenagers who consumed the drinks, but they
did not include all of the teenagers. The dietary methods in 1994-1996 CSFII were two
24-hour recalls on 2 nonconsecutive days (Lee & Nieman, 2003, p. 118), and NHANES

23
III used self-administered food frequency questionnaires (FFQ) and a 24-hour recall.
One or two recalls may fail to capture usual beverage intake due to the variation of
intake among days. Children and adolescents tend to make mistakes in completing FFQ
(Andersen, Bere, Kolbjornsen, & Klepp, 2004) especially for the categorized food and
drinks. Misclassification could happen in differentiating fruit drinks and fruit juice.
Age had inverse relationship with fluid milk intake, and positive relationship
with carbonated soft drink intake (Forshee & Storey, 2003; Bowman, 2002). Bowman
(2002) found that at the age of 13 years, female adolescents reduced their intakes of milk
and fruit drinks (including fruit ades and fruit punches) sharply and elevated their soft
drink and tea intakes. Consumptions of fruit juices, fruit drinks, and tea went down
rapidly when the participants were 18 year old; however, their soft drink intake
remained the same. At the age of 19 years, the participants increased all beverage
consumptions except water and milk. Participants aged 12 years consumed the highest
amount of milk while 19 year old subjects had the lowest milk consumption. Forshee
and Storey (2003) also noted that race influenced beverage intakes. African-Americans
drank less fluid milk and carbonated soft drinks but more fruit drinks than Caucasian-
Americans.
Lytle, Seifert, and Greenstein (2000) analyzed longitudinal cohort data as part of
the CATCH (Child and Adolescent Trial for Cardiovascular Health) intervention study.
The aims of CATCH were lowering students’ fat intake and making students more
active, in order for them to be heart healthy. The participants were followed from grade
3 to 8. They found that as the students grew, they decreased their consumptions of
breakfast, fruits, vegetables, and milk. On the other hand, their soft drink intake
increased three times in grade 8, compared to their soft drink intake in grade 3.
French et al. (2003) noted that soft drink consumption had a negative influence
on milk consumption and on many essential micronutrient intakes. Forshee and Storey
(2003) and Rampersaud, Bailey, and Kauwell (2003) analyzed the 1994-1996 and 1998
data from CSFII and described that the intake of soft drinks was higher than the intake
of milk in adolescents. Rampersaud et al. (2003) saw that 14-18 year adolescents
consumed a higher amount of carbonated soft drinks than the American Academic

24
Pediatrics (AAP) recommended amount of 100% fruit juice (340 g/day), while the intake
of 100% fruit juice itself did not reach AAP recommendation.
Most of the studies observed the trend that soft drink intake was increasing
sharply over the years while the milk intake was decreasing. On the other hand, Yi et al.
(2002) did not see the same tendency between 1988 and 1998, but they confirmed all the
other studies, which showed that the intake of sugary drinks, including carbonated soft
drink, fruit drinks, and ice tea, exceeded the intakes of milk and 100% fruit juice.
German adolescents also added their nutrient intakes by drinking fortified
beverages. Between 1986 and 2000, 398 males and 408 females aged 2 to 14 years
completed 3-day weighed dietary records. In 16 years, energy intake from fortified
beverages as percentage of total energy intake increased significantly (from 2 to 3%).
Fortified juice was the most important beverage with a maximum 24% vitamin C and B6
to total micronutrient intake, followed by soft drinks with a maximum 10% vitamin C,
and instant drinks maximum 10% vitamin B6 (Sichert-Hellert & Kersting, 2001).
2.5. Effects of Soft Drinks on Adolescent Health
2.5.1. Soft Drinks and Bone
2.5.1.1. Bone Metabolism
Bone is composed of two types of structural tissues, cortical (or compact) tissue
and trabecular (or cancellous) tissue. Dense cortical tissue (80% of skeleton) covers
trabercular tissue (20% of skeleton) (Lee and Nieman, 2003; Anderson, 2004). The
active metabolism of bone, which involves two types of cells: osteoblasts and
osteoclasts, is called bone modeling, bone turnover and bone remodeling. Osteoblasts
secrete a collagen protein matrix, which forms the support structure of the bone, and
bone mineral, which strengthens the bone. This mineral consists of calcium and
phosphorus, called hydroxyapatite (Ca10(PO4)6(OH)2). Osteoclasts continually break
down bone in areas where bone is not needed. This activity leads to bone turnover and
causing bone loss, while osteoblasts conduct bone remodeling (Wardlaw, Hampl, &
DiSilvestro, 2004).
Bone mineral density and bone quality are used to measure bone strength. Bone
quality relates to bone architecture, bone turnover, mineralization, and the accumulation

25
of bone damage. Bone mineral density (BMD) accounts for approximately 70% of bone
strength (Lee and Nieman, 2003). BMD, expressed as grams per centimeter squared
(g/cm2), shows the relative value of mineral content in bone for the measured area. Bone
mass (called bone mineral content, BMC) refers to the absolute amount of
hydroxyapatite measured in grams, and is also used to describe bone strength.
The three periods in skeletal development over the life span are rapid growth,
stabilization, and bone mass decline. The rapid growth period is the time during early
childhood and adolescence. The stabilization period is achieved in young adults, i.e. age
20 to 35 years, after which time bone mass will decline. Having a high BMD at age 50
lowers the risk of age-related bone fractures in women and men (Kanis et al., 2001).
Women lose their bone mass faster than men. The bone mass loss in women is
caused by the alteration of calcium absorption due to the change of hormones at
menopause when estrogen is no longer formed. Estrogen can possibly stimulate bone
loss by several possible mechanisms, such as changes in serum levels of parathyroid
hormone, calcitonin, and vitamin D metabolites (Kaptoge et al., 2003; Anderson, 2004).
Physical activity improves the peak bone mass, which is reached during the
growth. Evidence shows that physical activity is beneficial for BMD during childhood,
but excess exercise during puberty can result in lower BMD. Physical activity is
effective at high calcium intake, at least 1000 mg/day (Gilsanz, 1999). Region-specific
interaction between calcium intake and physical activity in pre-pubescent girls was
found by Iuliano-Burns, Naughton, Gibbons, Bass, and Saxon (2003).
Calcium makes up 39-40% of the entire mineral in the body. More than 99% of
calcium in the body is located in bones and teeth (Wardlaw et al., 2004; Matkovic,
Crncevic-Orlic, & Landoll, 2003). Calcium is critical to the structural integrity of both
trabecular and cortical bone. Another 1% of calcium is in the cellular and extracellular
fluid. The other roles of calcium are participating in blood clotting, transmission of
nerve impulses to target cells, muscle contraction, and regulating the activity of several
enzymes, including those that synthesize glycogen. The task of calcium in cellular and
extracellular fluid is very important. When dietary intake is low, calcium is withdrawn
from the skeleton to maintain normal calcium concentrations in blood. Adequate

26
calcium consumption throughout life optimizes peak bone mass and minimizes age-
related bone loss later in life (Wardlaw et al., 2004).
When blood calcium and vitamin D are low, the parathyroid gland releases
parathyroid hormone, which then stimulates the synthesis of 1,25 dihyroxyvitamin D
(calcitriol) in kidneys. Calcitriol then interacts with specific cells in the small intestine,
bone, and kidney. In the small intestines, calcitriol promotes calcium absorption. In
bone, calcitriol and parathyroid hormone stimulate osteoclasts to release calcium from
bone to the blood. In kidney cells, both of them also prevent calcium loss in urine
excretion (Wardlaw, 2004; Dawson-Hughes, 2003).
High blood levels of phosphate suppress the conversion of vitamin D to its active
form in the kidneys. Since phosphorus level maintenance is not as tight as calcium,
serum phosphate levels can rise slightly with a high phosphorous diet, especially after
meals. High blood phosphate levels reduce the formation of the active form of vitamin D
(calcitriol) in the kidneys, reduce blood calcium, and lead to increased PTH release.
However, high serum phosphorus levels also lead to decreased urinary calcium
excretion. If sustained, elevated PTH levels could have an adverse effect on bone
mineral content, but this effect has only been observed in humans in diets that were high
in phosphorus and low in calcium (Knochel, 2003).
Milk, which contains 300 mg calcium in a 250 mL serving, is a good source of
absorbable calcium. Dairy foods provide 75% calcium in the North American diet
generally (Weaver, 2003; Wardlaw et al., 2004) and more than 55% calcium in the
adolescents’ diet especially (Iuliano-Burns, Whiting, Faulkner, & Bailey, 1999). From
all milk products, fluid milk alone contributed at least 40% as calcium source in
teenagers’ diet. The calcium rich plants in the kale family (broccoli, bok choy, cabbage,
mustard, and turnip greens) contain calcium that is as bioavailable as that in milk
(Weaver, 2003; Wardlaw et al., 2004).
Some food components have been found to inhibit the absorption of calcium.
Oxalic acid (oxalate) is the most potent inhibitor of calcium absorption, and is found in
high concentrations in spinach and rhubarb and somewhat lower concentrations in sweet
potato and dried beans. Phytic acid is a less potent inhibitor of calcium absorption than
oxalate. Yeasts possess an enzyme (phytase) which breaks down phytic acid in grains

27
during fermentation, lowering the phytic acid content of breads and other fermented
foods. Only concentrated sources of phytate such as wheat bran or dried beans
substantially reduce calcium absorption (Weaver, 2003).
2.5.1.2. Effects of Soft Drink Intake on Bone Health
As shown in Table 2.2, cola soft drink intake increased the risk of getting bone
fractures (Wyshak et al., 1989; Wyshak & Fischer, 1994; Wyshak, 2000; Petridou et al.,
1997; Guerrero-Romero, Rodriguez-Moran, & Reyes, 1999; Mazariegos-Ramos et al.,
1995). The phosphorus content in cola type carbonated beverages could have reduced
levels of the active form of vitamin D (1,25-dihydroxyvitamin D) and led to a decline in
calcium absorption and to bone decalcification, increasing bone fracture risk. All cola
beverages contain 40 to 70 mg phosphorus per 12 oz serving (Massey & Strang, 1982).
The calcium: phosphorus ratio is a significant risk factor for bone fractures while a
higher calcium: phosphorus ratio is protective. Guerrero-Romero et al. (1999) detected
significantly higher serum PTH level, a higher urinary phosphate excretion, and a lower
calcium serum in women who drank significantly more cola soft drinks than other
women who did not drink cola soft beverages. Mazariegos-Ramos et al. (1995) found a
similar phenomenon in children and a significant negative correlation between the serum
calcium level and the number of soft drink consumed each week. After the 14-18 year
subjects stop drinking cola soft drinks, the serum calcium level increase, followed by the
decrease of serum phosphorus level. High blood levels of phosphate suppress the
conversion of vitamin D to its active form in the kidneys. Since phosphorus level
maintenance is not as tight as calcium, serum phosphate levels can rise slightly with a
high phosphorus diet, especially after meals. High blood phosphate levels reduce the
formation of the active form of vitamin D (calcitriol) in the kidneys, reduce blood
calcium, and lead to increased PTH release. However, high serum phosphorus levels
also lead to decreased urinary calcium excretion. If sustained, elevated PTH levels could
have an adverse effect on bone mineral content, but this effect has only been observed in
humans in diets that were high in phosphorus and low in calcium (Knochel, 2003).
Furthermore, cola beverage effects were more pronounced in more active girls and
children (Wyshak, 1989; Wyshak, 2000; Petridou et al., 1997). However, Whysak

28
(2000) showed more evidence that all kinds of soft drink intake enhanced the bone
fracture risk. The mechanism of the phenomenon is not known yet. Heaney and Rafferty
(2001) did not observe excess urinary calcium excretion after their participants drank
non-caffeinated cola soft drinks. They detected higher calcium in urine after the subjects
drank caffeinated cola beverages, indicating that the rise in calcium excretion was due to
the caffeine. The authors postulated that this excretion would be compensated by
reducing calcium excretion later. Their results proved that the mechanism of how
phosphorus in soft drinks may impact on calcium metabolism is not through urinary
calcium losses.
It seems that drinking fruit juice can lead to bone fracture due to an altered
calcium:phosphorus ratio (Petridou et al., 1997). It has been discussed before that
several kinds of fruit juice contain more phosphorus than calcium, which can lead to
unbalanced calcium:phosphorus in the bone. However, this result is not in accordance
with Whiting et al. (2001) and Marangella et al. (2004). High potassium citrate in fruit
juice lowers bone resorption in women age 58±8 years and girls 8-13 years (Tylavsky et
al., 2004; Marangella et al., 2004). Further study will be needed to conclude the effect of
fruit juice on bone.
All the studies in Table 2.2 agree that the intake of milk could play a protective
role in bone health. Milk is an important calcium source in the diet. According to
Fischer, Mitchell, Smiciklas-Wright, Mannino, and Birch (2004), the calcium intakes of
5-9 year old girls describes relative amount of their milk and soft drink intake. These
girls could meet their calcium recommendation intake by being served milk more often
than other girls who failed meeting the recommendation. Furthermore, Goulding et al.
(2004) demonstrated that children who had low milk intake suffered slighter trauma
bone fractures, which indicated that weakness of the skeleton or imbalance of body
weight to skeletal strength. The replacement of milk intake could weaken bone; several
studies that detected evidences of the occurrence of milk intake replacement by other
beverages would be described (Whiting et al., 2001; McGartland et al., 2003).
There was negative correlation between consumption of low nutrient dense beverages
and both total body bone mineral content as well as BMC accrual during the two years
surrounding age of peak bone mineral accrual in girls. There was no relationship

29
between consumption of cola or non cola beverages with bone (fracture or BMC) in
boys. The girls consumed less CSD than boys but they also had lower BMD in heel than
boys. However, at the same time, boys also drank more milk and participated in more
physical activity, behavior that can enhance bone mass, than did girls. The study
suggested a threshold effect for calcium and physical activity. The threshold of
protective calcium dose could have an important role since boys were above the
threshold in calcium intake and physical activity, yet the consumption of CSD did not
affect their bone health.
Milne and Nielsen (2000) and Nguyen, Dumoulin, Henriet, and Regnard (1998)
detected a negative impact of sugar on bone. Soft drinks contain a lot of sugar,
especially fructose in the products, but diet soft drinks use primarily aspartame Nguyen
et al. (1998) described the increase of calcium in the urine within 3 hours after a glucose
load or aspartame. Glucose intakes provoked a decrease in phosphatemia (high
concentration of inorganic phosphates in blood) since phosphate followed glucose
uptake into cells as required for glucose phosphorylation. The reduction of serum
phosphate could stimulate mineral bone release, causing a rise in calcemia (excess
calcium in blood). However, the decrease in phosphatemia was substantially smaller
after aspartame ingestion than after glucose and was unlikely to have been triggered by
the entry of glucose into cells. The hydrolysis of aspartame into phenylalanine and
aspartic acid in the gastrointestinal tract and the phosphate activation of these amino
acids in cells could cause a decrease in blood phosphate, which was likely to trigger
acute bone mineral release. Most regular soft drinks do not use sucrose or glucose
nowadays, but high fructose corn syrup. In the body, fructose can enter the metabolism
in two ways; either it will be changed into fructose-6-phosphate by enzyme hexokinase
and then follow the regular glycolysis pathway, or it will form fructose 1-phosphate and
become glyceraldehydes 3-phosphate before following the regular glycolysis pathway
(McGrane, 2000). However, both glucose and fructose are monosaccharides. The effect
of glucose to bone could be similar with the effect of fructose to bone.
Another potential mechanism of fructose is to affect phosphorus balance in the
body. It is found that a high fructose diet (20% of total calories) causes an increase in
urinary loss of phosphorus and a negative phosphorus balance (i.e., daily loss of

Table 2.2. Studies of the effects of soft drink intake on boneStudy Subjects Methods ResultsWyshak et al. (1989)
5,398 female 2,622 former athletes and 2,776 nonathletes (>50 y)
Mailed questionnaires CSD consumers who were former athletes were at high risk for the occurrence of bone fractures than non-consumers.
Wyshak and Fischer (1994)
12-16 y teens76 girls and 51 boys from a swimming club and physicians' offices
FFQ and medical history An association between cola beverage consumption and bone fractures in girls (the adjusted OR = 3.59). High intake of calcium was protective (adjusted OR = 0.284). No association between the non-cola drinks and fractures.
Wyshak (2000) Grade 9 and 10n=460
Self-administer questionnaires CSD consumption and bone fractures are associated: OR=3.14. Among physically active girls, the cola beverages are associated with bone fractures: OR=4.94, and all soft drinks and bone fractures with OR=7.00
Guerrero-Romero et al. (1999)
49-67 years 85 females
serum Ca, P, Albumin,estradiol, and FSH from blood. Questionnaires
Cola soft drink consumption had a strong and independent association with hypocalcemia (OR 1.28) for those women who drank one or more bottles per day (375 ml per bottle).
Mazariegos-Ramos et al. (1995)
18 months-14 yearsn=228 children
Blood sampling, interviews, and physical examination.
Negative correlation between the serum calcium level and the number of soft drink intake each week.
Petridou et al. (1997)
7-14 year old74 boys and 26 girls
Questionnaires Cola and NCD consumers increased the fracture risk by 1.7 and 1.6 (respectively). No relationship between non-cola and bone fractures.
Whiting et al. (2001)
Age= 14+ 0.96 year old59 boys and 53 girls
DXA and 24 hour recalls Boys and girls replaced their milk intake with NCD and LND. Negative correlations were seen between the consumptions of LND and total BMC in girls, cola drinks and BMC, and non-cola drinks and BMC.
McGartland (2003)
12 and15 year old N=1335
DXA and diet history Inverse relationship between diet drinks and heel BMD in girls. No relationship was observed in boys’ intake.
Abbreviations: CSD, carbonated soft drinks; NCD, non-carbonated soft drinks; DXA, dual-energy X-ray absorptiometry; LND, low nutrient dense drinks;FFQ, food frequency questionnaire; FSH, follicle stimulating hormone; OR, odd ratio; Ca, calcium; BMD, bone mineral density; BMC, bone mineral content
30

31
phosphorus was higher than daily intake). This effect was more pronounced if the diet
was also low in magnesium. A potential mechanism for this effect is the lack of
feedback inhibition of the conversion of fructose to fructose-1-phosphate in the liver. In
other words, increased accumulation of fructose-1-phosphate in the cell does not inhibit
the enzyme that phosphorylates fructose, using up large amounts of phosphate, which is
known as phosphate trapping (Knochel, 2003; Milne & Nielsen, 2000).
2.5.2. Soft Drinks and Dental Health
2.5.2.1. Teeth
Teeth are constructed by crown, root portions, dentin, and neurovascular pulp.
The crown is protected by enamel surrounding it, and the root is covered by cementum
(Matthews & Al-Bayaty, 2002). Mature enamel contains 96% inorganic material, which
is hydroxyapatite crystal same as for bone. Another crystal form in the teeth is
fluoroapatite [Ca10(PO4)F2] (Forcella, Mata, Mesquita, & Spoto, 2002). Carbonates and
trace elements, including fluoride, boron, barium, lithium, magnesium, molybdenum,
strontium, and vanadium also support the structure of teeth. During the period of tooth
development, the exposure to these trace elements is important. They will become
incorporated and remain in the mineralized substance of teeth since there is no enamel
turnover. Carbonate, cadmium, chloride, iron, lead, manganese, tin, zinc, and
magnesium make teeth more vulnerable to caries (Piesco, 2002). When carbonate
substitutes phosphates, it will disorganize the lattice construction and make it more
prone to acid dissolution. The mature enamel operates like a massive crystals mass in a
chemical balance with the surrounding media. The acid stomach, food, drinks, or
bacteria tend to alter the balance towards mineral loss (Forcella et al., 2002).
Dentin forms the body of teeth and contains metabolically active cells (Forcella
et al., 2002). Dentin is an essential tissue because it contains the cell processes of
odontoblasts and neurons. Odentoblasts carry out a structural role in the development of
the dentinal matrix, and neurons pass on sensory information. Dentin covers and protects
pulp and supports the overlying enamel. Mature dentin consists of 70% mineral, 20%
organic matrix, and 10% water on a weight basis and 50% mineral, 30% organic, and
20% water on volume basis. The main inorganic matrix in dentin is hydroxyapatite.

32
Dentin is harder than cementum or bone because of its high mineral content, but it is
softer than enamel. The bulk of the organic matrix of dentin consists of collagen. Unlike
bone, dentin does not undergo continuous remodeling, so it has limited repaired
capability (Piesco, 2002).
The general functions of pulp are as nutrition providers, defense actor, and
barrier. Pulp blood vessels bring nutrient to pulp and dentin, pulp nociceptive receptors
sense thermal, mechanical, and chemical stimuli, and pulp has the ability to assemble
immune defenses (Forcella et al., 2002). Pulp includes cells that supply mature pulp with
odontogenic, nutritive, sensory, and protective functions and allow for preservation of
vitality during normal homeostatic maintenance and during wound repair after injury.
The two sections in mature dental pulp are odontogenic zone and pulp proper.
Odentogenic zone includes odontoblasts, the cells in charge for the construction and
maintenance of dentin. Pulp proper includes the majority of the remaining areas of the
pulp and contains fibroblasts and extracellular matrix, blood vessels, and nerves
(Chiego, 2002). Root dentin is wrapped by acellular cementum, which is enclosed by
cellular cementum.
Tooth decay can be classified into two major categories, caries and tooth wear.
According to Ten-Cate, Larsen, Pearce, and Fejerskov (2003), caries is defined as
“chemical dissolution of the dental hard tissues by acidic bacterial product from
degradation of low molecular weight sugars.” There are three general theories about the
caries mechanism: the proteolysis theory, proteolytic-chelation theory, and
chemicoparasitic theory. The proteolysis theory suggests that proteolysis may occur in
caries process when teeth have lesions that develop on exposed root surfaces. The
proteolytic-chelation theory hypothesizes that oral microorganisms produce material
with chelating ability from decomposing the organic components of the enamel. These
products would then dissolve tooth minerals. The chemicoparasitic theory is widely
accepted nowadays. This theory postulates that the mechanism of the caries is through
decalcification, the loss of calcium from teeth. This theory believes that
microorganisms’ action on carbohydrate would create acid substance which leads to the
decalcification of the inorganic portion of teeth. The dissolution of tooth organic
compounds would take place thereafter (McDonald, Avery, & Stookey, 2000).

33
Caries can be prevented by individuals through practicing several habits, such as
plaque control, use of fluoride, and dietary modification. In order to control the plaque, a
person should brush his or her teeth at least once a day. In brushing teeth, one should use
fluoride toothpaste. The brushing will detain the growth of the biofilm, and fluoride
retards lesion progression. Fluoride has beneficial effects in preventing caries. The
useful dietary pattern in avoiding caries are confining sugar to main meals, replacing a
salty snack for a sweet one, changing the sugar to the artificial sweetener in tea and
coffee; water and milk would be safe and better to drink between meals (Kidd & Nyvad,
2003).
Tooth wear leads to the dissolved of dental hard tissue on the surface and is
caused by others except the developmental, dental caries and trauma (May &
Waterhouse, 2003). The tooth wear can be categorized into erosion, abrasion, and
attrition. According to Bratlett and Smith (2000), erosion is caused by acid, attrition
happens when tooth strikes against tooth, and abrasion is caused by physical means
other than teeth.
2.5.2.2. Effects of Soft Drink Intake on Dental Health
Soft drinks influence dental health by providing sugar and acid. The sugar
components of soft drinks lead to caries. It can be seen in Table 2.3, that Heller, Burt,
and Eklund (2001) revealed that no caries observed in the younger age group could be
due to the accumulative outcome from the younger age related to the continued regular
soft drink intake; however, cola consumption more than three times a week increased the
risk of the erosion to three times (Jensdottir et al., 2004).
Acid in soft drinks may contribute to the erosion of teeth. Two characteristics in
soft drinks that determine their erosive potential are the initial pH and the buffering
capacity (Larsen & Richards, 2002). The amount of mineral dissolved during the erosion
depends on the pH, the buffering effect, and the length of the exposure time. The
buffering effect is the concentration of acids in the beverages or the ability of an acidic
solution to keep its pH unaffected in dissolving enamel apatite and diluting with saliva.
The stronger the buffering effect, the more mineral will be dissolved before the
equilibrium pH can be reached and stop the dissolution. However, the presence of a

34
certain quantity of calcium, phosphate and fluoride in the drinks may have protective
effect against the dissolution (Larsen & Nyvad, 1999). As shown in Table 2.3, the
orange juice demonstrated a high buffering effect while the lemonade-like soft drinks
(SchweppesTM, Coca-colaTM, and PepsiTM) performed a considerable buffering effect,
but the pH of the soft drinks was lower than the orange juice pH (Larsen & Nyvad,
1999; Larsen & Richards, 2002). The protective characteristic of fluoride against erosion
was not detected when a person consumed soft drinks.
Saliva could protect and add mineral to enamel when it was not exposed to acidic
soft drinks; however, this effect was not detected in the group that consumed soft drinks
(Dinçer, Hazar, & Sen, 2002). The greatest pH decrease of saliva was detected after the
control group and case group drank Ades NTM, followed by SpriteTM, Coca ColaTM, and
chocolate milk (Sánchez & Preliasco, 2003). As the pH of saliva went lower, the more
mineral in teeth would dissolve. The ability of the regular CokeTM to cause erosion was
greater than the Diet CokeTM (Roos & Donly, 2002).
While some studies agreed that soft drink consumption may lead to tooth decay,
caries and erosion, others such as Heller, Burt & Elkund (2001) reported no correlation
between soft drink intake and dental caries in population under age 25. Forshee &
Storey (2001) supports this view in their findings that regular soft drink consumption
was not associated with dental cavities among people under the age of 25. The study
also showed that age and income are better predictors of cavities than food or beverage
consumption. Part of the discrepancy among results from the investigations could be
attributable to the grouping of sweetened beverages (e.g., as soft drinks or sweetened
beverages), methods used to assess beverage intake, inability to control for known
confounders, and the time period of beverage intake assessment relative to the disease
process. Furthermore, the manner in which beverages are consumed (snack vs. meal,
prolonged sipping vs. quick drinking, daytime vs. nocturnal feedings) likely influences
the disease process but is extremely difficult to assess in a community setting (Marshall
et al., 2003). Although dairy products may contain lactose and added sugar, they have
generally been considered protective against dental caries more likely because of theirs
mineral content. Acid in fruit juice can cause erosion, but the fortification with calcium,
phosphate, and fluoride may counteract the effect. Thus it seems logical to recommend
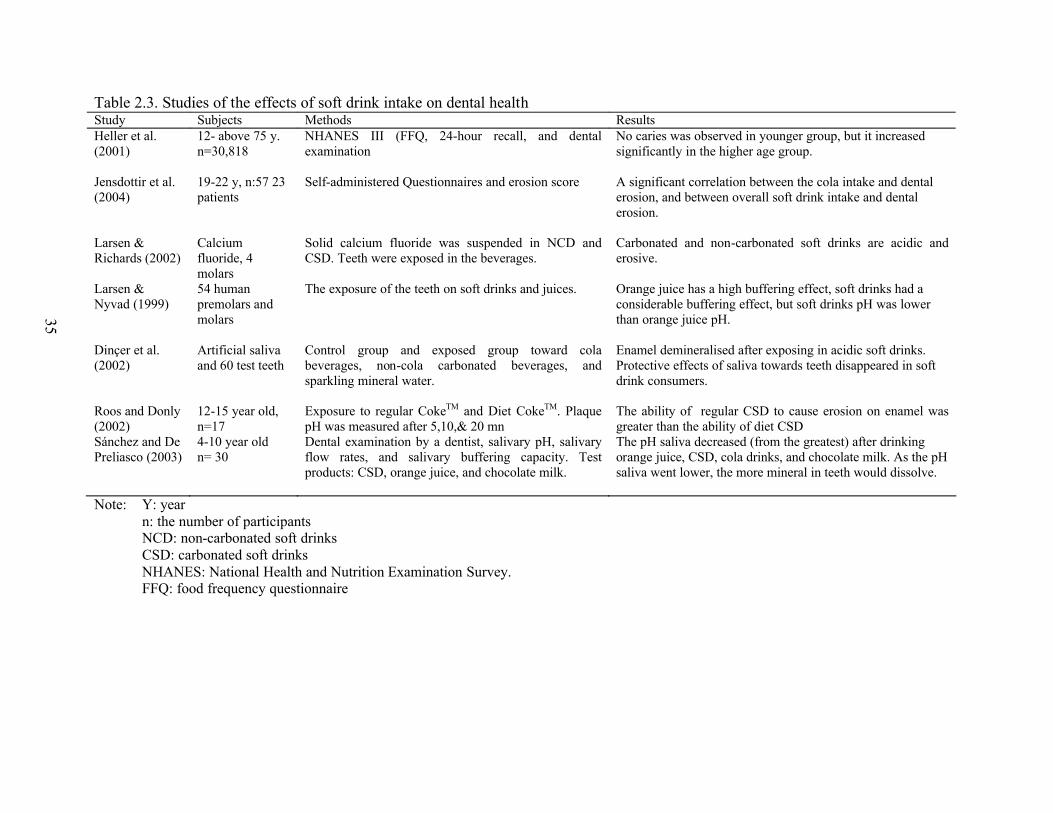
Table 2.3. Studies of the effects of soft drink intake on dental healthStudy Subjects Methods ResultsHeller et al. (2001)
12- above 75 y. n=30,818
NHANES III (FFQ, 24-hour recall, and dental examination
No caries was observed in younger group, but it increased significantly in the higher age group.
Jensdottir et al. (2004)
19-22 y, n:57 23 patients
Self-administered Questionnaires and erosion score A significant correlation between the cola intake and dental erosion, and between overall soft drink intake and dental erosion.
Larsen & Richards (2002)
Calcium fluoride, 4 molars
Solid calcium fluoride was suspended in NCD and CSD. Teeth were exposed in the beverages.
Carbonated and non-carbonated soft drinks are acidic and erosive.
Larsen & Nyvad (1999)
54 human premolars and molars
The exposure of the teeth on soft drinks and juices. Orange juice has a high buffering effect, soft drinks had a considerable buffering effect, but soft drinks pH was lower than orange juice pH.
Dinçer et al. (2002)
Artificial saliva and 60 test teeth
Control group and exposed group toward cola beverages, non-cola carbonated beverages, and sparkling mineral water.
Enamel demineralised after exposing in acidic soft drinks. Protective effects of saliva towards teeth disappeared in soft drink consumers.
Roos and Donly (2002)
12-15 year old, n=17
Exposure to regular CokeTM and Diet CokeTM. Plaque pH was measured after 5,10,& 20 mn
The ability of regular CSD to cause erosion on enamel was greater than the ability of diet CSD
Sánchez and De Preliasco (2003)
4-10 year oldn= 30
Dental examination by a dentist, salivary pH, salivary flow rates, and salivary buffering capacity. Test products: CSD, orange juice, and chocolate milk.
The pH saliva decreased (from the greatest) after drinking orange juice, CSD, cola drinks, and chocolate milk. As the pH saliva went lower, the more mineral in teeth would dissolve.
Note: Y: yearn: the number of participantsNCD: non-carbonated soft drinksCSD: carbonated soft drinksNHANES: National Health and Nutrition Examination Survey. FFQ: food frequency questionnaire
35

36
refraining from consuming soft drinks more than fruit juice because of the former’s
effect on teeth; further, soft drinks do not contain any important nutrients apart from
water and energy (sugar) for the body, while fruit juice is an important vitamin C
provider in North American diet.
2.5.3. Soft Drinks and Obesity
2.5.3.1. Obesity
Obesity is excess adiposity, and in order to measure it, there must be a suitable
noninvasive measure of body fat and a suitable cut-off with which to compare (Cole &
Rolland-Cachera, 2002). Adiposity is the amount of body fat expressed either as the
absolute fat mass (kg) or as the percentage of total body mass. The Center for Disease
Control and Prevention (CDC) incorporated the 2000 growth charts in determined Body
Mass Index (BMI, kg/m2) cutoffs to assess populations aged 2 to 20 years. Overweight
is defined as a BMI-for-age at or above the 95th percentile on the charts, and those who
are at risk of overweight have BMI-for-age between the 85th and the 95th percentile
(CDC, 2002).
Changes in the size of adipose tissue result from alterations in energy balance
(Wabitsch, 2002). Energy balance is the equivalent of energy intake and energy
expenditure. Positive energy balance, the excess of energy intake from energy
expenditure, results in weight gain (Wardlaw et al., 2004). Energy in the body is used for
basal metabolism, physical activity, and the thermic effect of the food. Basal
metabolism, 60% to 70% of total energy, is the minimum energy needed to keep a
resting and awake body alive. The amount of physical activity energy depends on the
types of activity; more active action requires more energy than sedentary movement.
Thermic effect of food is the energy needed to digest, absorb, and further process the
food nutrient (Laquatra, 2004; Wardlaw et al., 2004).
During the pubertal development, obese adolescents often have early sexual
maturity and eventually experience menarche at a younger age than non-obese girls. The
long term effects of obesity in adolescents include becoming obese adults, increasing
mortality risks, increasing risks for coronary heart disease, increasing hypertension risks
during pregnancy, and diabetes type 2 (Zwiauer, Caroli, Malecka-Tendera, & Poskitt.,
2002). Approximately 50% of severely obese youngsters suffered from metabolic
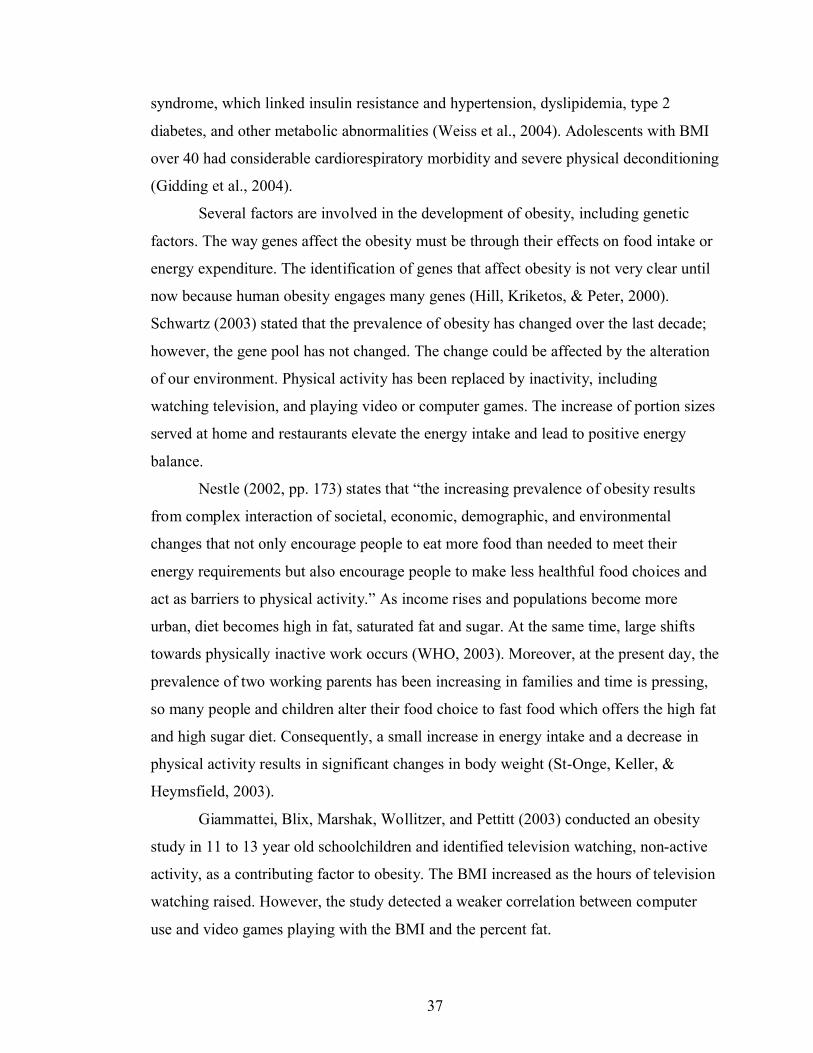
37
syndrome, which linked insulin resistance and hypertension, dyslipidemia, type 2
diabetes, and other metabolic abnormalities (Weiss et al., 2004). Adolescents with BMI
over 40 had considerable cardiorespiratory morbidity and severe physical deconditioning
(Gidding et al., 2004).
Several factors are involved in the development of obesity, including genetic
factors. The way genes affect the obesity must be through their effects on food intake or
energy expenditure. The identification of genes that affect obesity is not very clear until
now because human obesity engages many genes (Hill, Kriketos, & Peter, 2000).
Schwartz (2003) stated that the prevalence of obesity has changed over the last decade;
however, the gene pool has not changed. The change could be affected by the alteration
of our environment. Physical activity has been replaced by inactivity, including
watching television, and playing video or computer games. The increase of portion sizes
served at home and restaurants elevate the energy intake and lead to positive energy
balance.
Nestle (2002, pp. 173) states that “the increasing prevalence of obesity results
from complex interaction of societal, economic, demographic, and environmental
changes that not only encourage people to eat more food than needed to meet their
energy requirements but also encourage people to make less healthful food choices and
act as barriers to physical activity.” As income rises and populations become more
urban, diet becomes high in fat, saturated fat and sugar. At the same time, large shifts
towards physically inactive work occurs (WHO, 2003). Moreover, at the present day, the
prevalence of two working parents has been increasing in families and time is pressing,
so many people and children alter their food choice to fast food which offers the high fat
and high sugar diet. Consequently, a small increase in energy intake and a decrease in
physical activity results in significant changes in body weight (St-Onge, Keller, &
Heymsfield, 2003).
Giammattei, Blix, Marshak, Wollitzer, and Pettitt (2003) conducted an obesity
study in 11 to 13 year old schoolchildren and identified television watching, non-active
activity, as a contributing factor to obesity. The BMI increased as the hours of television
watching raised. However, the study detected a weaker correlation between computer
use and video games playing with the BMI and the percent fat.

38
It is estimated that around 17.6 million children under five are overweight
worldwide. Obesity incidence in adolescents aged 12-17 has elevated dramatically from
5% to 13% in boys and from 5% to 9% in girls between 1966-70 and 1988-91 in the
USA. In Canada, the prevalence of overweight in children aged 7 to 13 years old during
1981 to 1996 expanded from 11% to 33% in boys and 13% to 27% in girls. In the same
time, the prevalence of obesity in boys rose from 2% to 10% and in girls 2% to 9%
(Tremblay, Katzmarzyk, & Willms, 2002).
2.5.3.2. Contributions of Soft Drink Intake to Obesity
Table 2.4 shows studies that found a relationship between soft drink
consumptions and obesity or weight gain. Soft drink intake was identified as one of the
contributory factors to obesity. Boys aged 9-14 years who consumed sugar-added
beverages and diet soda significantly increased their weight. The increase of sugar-
added beverage intake over time was associated linearly with weight gain, and
increasing milk and diet soda intakes were weakly associated with weight gain. Girls
who consumed one daily (0.5 to 1.5) serving or more of sugar added beverages gained
significantly more BMI (Berkey, Rockett, Field, Gillman, & Colditz, 2004). The
findings from Ludwig, Peterson, and Gortmaker (2001) were against the findings of
Giammattei et al. (2003), who noted that the diet soft drink intake was an independent
predictor for obesity in the subjects. Ludwig et al. (2001) observed a negative
association between the diet soft drink intake and obesity. Obese children and
adolescents aged 4 to 16 years had significantly higher total energy intake, total fat and
saturated fatty acid intakes than non-obese subjects (Gillis, Kennedy, Gillis, & Bar-Or,
2002). A stronger relationship between total energy eaten and juvenile adiposity than
with fat or the type of fat consumed was detected in the study. Soft drinks contained
high fructose corn syrup and glucose that could enhance the energy overconsumption
(Bray, Nielsen, & Popkin, 2004). Table 2.2 shows the calorie amount in the beverages
served by Canada Fast Food Restaurants. The high fructose corn syrup (HFCS) intake
enhancement was related temporally to the obesity epidemic, and too much HFCS in
soft drinks might have a role in the obesity epidemic (Bray et al, 2004).

Table 2.4. Studies of the relationship of soft drink intake and obesityStudy Subjects Methods ResultsGiammattei et al. (2003)
Grade 6 and 7, 186 boys and 199 girls
Physical and fat measurement using bioelectrical impedance
Regular and diet soft drink consumption contributed to cause obesity in children aged 11 to 13 year old.
Mrdjenovic & Levistky (2003)
6-13 year old, n=30,Site: summer camp
4 to 8 week weighed food diaries Soft drink consumers increased their weight after the study. They also replaced milk with soft drinks.
Ludwig et al. (2001) 11-12 year old n:571
Anthropometric measurement and YFFQ
The risk of becoming obese rose 1.6 times for each additional can or glass of soft drink.
St-Onge et al. (2004) 32-37 year old12 men and 8 women
Beverage test (mix nutrients and sugar only), energy expenditure measurement, satiety questionnaire
Sugar only beverages were easier to digest due to their smaller thermic effect, subjects did not feel satisfied after drinking sugar only beverages.
Schulze et al. (2004) 24-44 year old, n: 91,249
Mailed questionnaire through, Nurses Health Study II,133 items semi quantitative FFQ
Women who increased their consumption of soft drinks increased significantly their weight and BMI. Women who increased consumption of fruit punch gained more weight (3.69 kg) compared with women who decreased consumption (2.43 kg; P<.001). Greater sugar-sweetened soft drink consumption was strongly associated with progressively higher risk of type 2 diabetes age-adjusted RR was 1.98
Berkey et al. (2003) 9-14 year oldn: 16,771
BMI measurement; FFQ; tanner stage, menarche, and age questionnaire
The increase of sugary beverage intake was associated linearly with weight gain. Sugar added beverage and diet soda male consumers increased their weight. Female soft drink consumers had higher BMI
Note: YFFQ: Youth Food Frequency QuestionnaireBMI: body mass indexFFQ: food frequency questionnairen: the number of participants
39
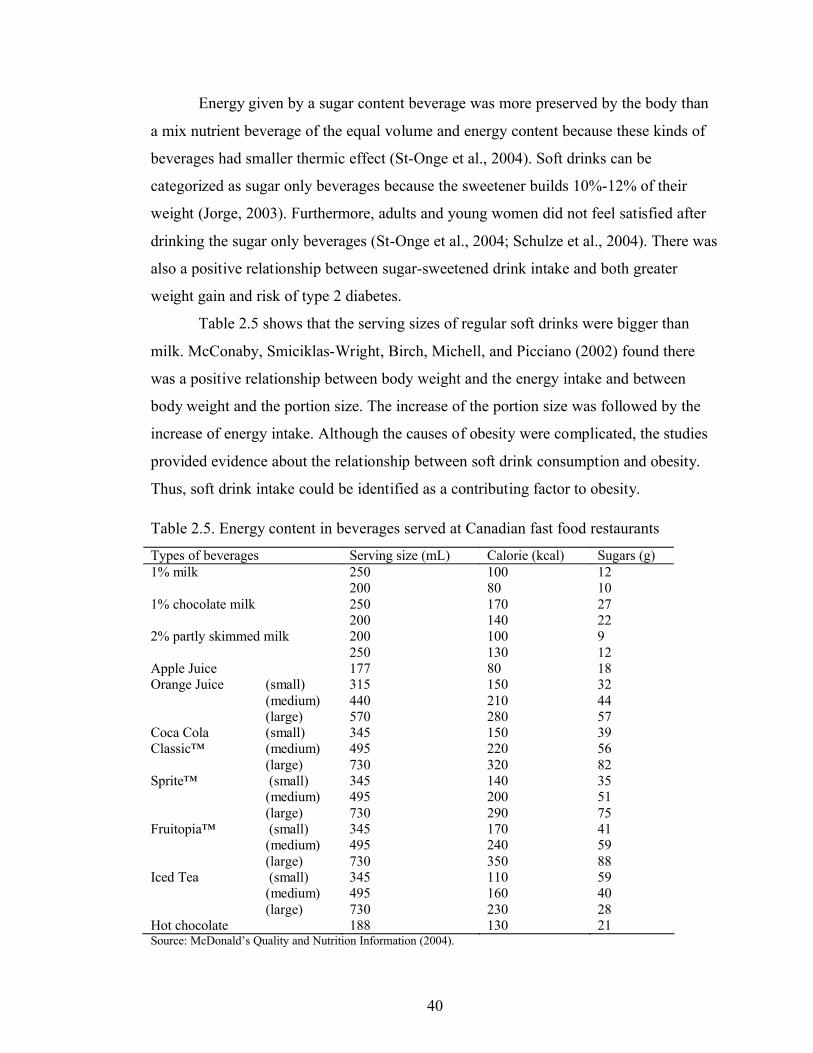
40
Energy given by a sugar content beverage was more preserved by the body than
a mix nutrient beverage of the equal volume and energy content because these kinds of
beverages had smaller thermic effect (St-Onge et al., 2004). Soft drinks can be
categorized as sugar only beverages because the sweetener builds 10%-12% of their
weight (Jorge, 2003). Furthermore, adults and young women did not feel satisfied after
drinking the sugar only beverages (St-Onge et al., 2004; Schulze et al., 2004). There was
also a positive relationship between sugar-sweetened drink intake and both greater
weight gain and risk of type 2 diabetes.
Table 2.5 shows that the serving sizes of regular soft drinks were bigger than
milk. McConaby, Smiciklas-Wright, Birch, Michell, and Picciano (2002) found there
was a positive relationship between body weight and the energy intake and between
body weight and the portion size. The increase of the portion size was followed by the
increase of energy intake. Although the causes of obesity were complicated, the studies
provided evidence about the relationship between soft drink consumption and obesity.
Thus, soft drink intake could be identified as a contributing factor to obesity.
Table 2.5. Energy content in beverages served at Canadian fast food restaurants
Types of beverages Serving size (mL) Calorie (kcal) Sugars (g)250 100 121% milk200 80 10250 170 271% chocolate milk200 140 22200 100 92% partly skimmed milk250 130 12
Apple Juice 177 80 18(small) 315 150 32(medium) 440 210 44
Orange Juice
(large) 570 280 57(small) 345 150 39(medium) 495 220 56
Coca ColaClassic™
(large) 730 320 82(small) 345 140 35(medium) 495 200 51
Sprite™
(large) 730 290 75(small) 345 170 41(medium) 495 240 59
Fruitopia™
(large) 730 350 88(small) 345 110 59(medium) 495 160 40
Iced Tea
(large) 730 230 28Hot chocolate 188 130 21Source: McDonald’s Quality and Nutrition Information (2004).

41
2.6. Soft Drinks in High School
Most of the surveys and surveillances conducted in North American have
determined that the dietary habits and beverage intake are moving towards an unhealthy
direction. One factor that affects food choice of children and adolescents is food
marketing. Children, especially adolescents, are attractive customers because the amount
of money they control has risen and parents have allowed them to choose their own
food. So in the recent years, the companies concentrate to market their products to
children. The advertising messages reach the youngest children and adolescents (Nestle,
2002). The US General Accounting Office (2000) of the US government observes that
the marketing activities are greater in high schools than those in middle or elementary
schools. It is hard to differentiate which activities are done solely for commercial
purpose from the non-commercial. For example, soft drink companies fund teachers in
making a teaching manual with their logos on it. This activity can be categorized as a
marketing venture. However, other companies may fund an activity solely to support the
school system.
Critics such as Nestle (2000) express concern since soft drink companies may be
focusing on schools because they knew that most of their potential customers go to
schools. The marketing activities include product selling, direct advertising, indirect
advertising, and market research.
2.6.1. Product Selling
Some schools have an “exclusive arrangement” that prohibits the sale or
advertising of products from competitive vendors, and generally provides an immediate
transfer of funds to individual school boards with subsequent revenues or inclines tied to
sale (Molnar & Reaves, 2001, Nestle, 2000). A second form of contract allows schools
to enter into an arrangement with the soft drink company where the schools to sell the
company’s products such as soft drinks. This arrangement may or may not be exclusive.
A soft drink company assured the school that it would get a minimum of $30 per
student, which was 0.4% of the amount of the district budget (General Accounting
Office/GAO, 2000). Nestle (2000) reported that by the year 2000, there were 130

42
schools in 33 states in United States of America involved with the soft drink companies’
contracts. The “Pouring Rights” contracts gave one particular brand exclusive rights to
set their vending machines in schools to build brand loyalty among students. The
allocations of the vending machines were in strategic places with high-traffic areas, such
as outside the school cafeteria, in the lobby, in a main hallway (Consumer Union, 1995).
Table 2.6 depicts several contracts between districts and the soft drink
companies, with information about the money involved and the benefits for the
companies. Hardy (1999) reported that Colorado Spring District 11 official sent letters to
administrators encouraging them to raise CokeTM sales in their schools because of the
contract between Coca ColaTM and the district. To fulfill the contract, the schools was
encourages to push or at least promote the students to drink CokeTM.
Table 2.6. Examples of contracts between soft drink companies and US schools districts
School Company Time Money expected from the contract
Benefit for the companies
Colorado Spring district 11
Coca-ColaTM
10 years
$8 million Increase Coke sales in schools
Viroqua District, Wisconsin
Pepsi TM 8 yrs $6,000 vending machines with milk, sandwiches, fruit.$64,900
Prolonged the right to sell in the schools,provided no-advertising scoreboard.
17 schools in Kent, Michigan
Coca-ColaTM
20 yrs
$10/year/student1% of sales, total $4-5 million/yr
Exclusive rights for schools to sell only their products
Charleston, South Carolina
PepsiTM 5 yrs $8.1 million, $1 million for signing contract, $50,000/yr, 40-43% revenues from vending, $1,000 scholarship/y
Exclusive rights for schools to sell only their products
County Charleston
PepsiTM 5 yrs $7.2 million NA
Norfolk, Virginia Coca-colaTM
5 yrs $3.2 million Exclusive rights for schools to sell only their products
Hillsborough, Florida
PepsiTM 12 yrs
$ 50 million Exclusive rights for schools to sell only their productsl
Sherwood District, Oregon
CokeTM 12 yrs
$ 400,000 Exclusive rights for schools to sell only their products
Source: Hardy (1999) and Molnar (2003)

43
2.6.2. Direct Advertisement
In schools, advertising soft drinks can be observed in the form of direct
advertisements on soft drink vending machines and scoreboards. Soft drink companies
may also put the advertisements on school buses, billboards, wallboards in corridors and
lavatories, as well as on telephone kiosks and book covers. Some schools ran the
commercials on radio programs piped into school corridors and lunchrooms. In other
schools, advertisements were distributed through the media, such as classroom
magazines and television programs. Channel One, the daily classroom news programs
aired two minutes of commercials aimed at school children every 12 minute news
program (Consumer Union, 1995). One of the soft drink companies’ contributions to
schools was providing computer equipment. Soft drink companies also sponsored school
sports, club and other activities, and provided schools with sports uniforms, sports
supplies and facilities. In compensation they could put their logo on sports uniforms,
sports supplies, and sports facilities. They gave free samples and coupons for fast food
to the students (Nestle, 2000). Consumer Union (1995) also reported that in 1992-1993,
the local Coca-Cola bottler donated $45,000 for several scoreboards, including a four-
sided electronic scoreboard suspended from the ceiling for Northridge High School,
Layton, Utah. The CokeTM logo was the only picture in the large scoreboard.
2.6.3. Indirect Advertising
The indirect advertisements were usually finite and subtle. One of the examples
of this advertising was corporate-sponsored educational materials or teacher training
(GAO, 2000). Sponsored educational materials were usually provided for free or
inexpensively; these materials were in the forms of multimedia teaching kits, videos,
software, books, posters, reproducible activity sheets, workbooks, or other teaching aids.
These enhanced teachers’ material supplies. However, these materials could have
outright plugs for a company or its product, or worse, biased information (Consumer
Union, 1995).
Analyzing the trends of commercialism in school, Molnar (2003) concluded that
in 2003, there was no US student that has not been sold out by the school in exclusive

44
contracts or other advertisement activities with soft drink, fast food, and other
companies. All of the commercial activities in schools gave advantages for schools and
companies. However, Alex Molnar in Hardy (1999) stated that the contracts made the
schools promote a brand of soft drinks even when more nutritious beverages were
offered. In the school advertisements, the soft drink companies delivered messages that
were against schools’ messages in health and nutrition classes.
All of these contracts were a temporary solution for funding problems in school
districts. However, the solution would lead to other problems, which are the health of the
students and the distortion of health messages carried by the school. The American
Academic of Pediatric Dentistry (AAPD) (Originating Council on Clinical Affairs,
2002) issued a policy statement that argued against the contracts. The statement said that
AAPD would encourage collaboration with other parties to attract public awareness of
the health impact of soft drinks on health, discourage any agreements that reduce the
access to healthy beverages, promote healthy beverages and health intervention,
especially in oral hygiene. Furthermore, cans would be preferred over bottles because
they cannot be closed and stored for convenient later consumption throughout the day.
They also suggested that bottled water should always be available at the same place that
soft drinks are offered.
The Pediatrics-Committee on School Health (2004) published recent
recommendations about soft drinks in schools. The policy recommended that school
districts invite public discussion before signing any contract with soft drink companies.
In those situations where contracts are already signed, the committee recommends that
the allocation of vending machines should be chosen by the schools not the soft drink
companies. In addition, soft drink vending machines should be turned off during lunch
time or school hours, incentives based on the amount of soft drinks sold per student from
the contracts should be eliminated, the amount of machines should be limited, and soft
drink consumption and advertisements in classrooms should be eliminated.
The Long Angeles Unified School District Board (LAUSD) voted to ban soft
drink in all LAUSD schools started January 2004. The action was stimulated by several
factors, including community, teacher, and parent input, coalition of healthy food and
community food advocates’ campaign, LAUSD board members’ advice, support from

45
LAUSD staff, and the awareness of the public of the bad impact of soft drinks on health
(Center for Food and Justice et al., 2002).
The Canadian Soft Drink Association has elected to voluntarily remove
carbonated soft drinks from elementary and middle school as of fall 2004. That remains
to be seen however, is the effects of such a move will have on school funding and
children’s intake of added sugar, given the likelihood of increased intake from fruit-
based drinks and sport drinks. The extent of the role soft drink companies will play in
elementary schools’ beverage environment will also be of impedance (Henry, 2004).
2.7. School Based Intervention for Adolescents
School is a good place to develop nutrition education interventions for
adolescents because it is the easiest place to reach a large amount of adolescents.
School-based intervention provides several advantages, including maintaining
continuous and concentrated contact with participants, conducting more cost-effective
intervention, and presenting the intervention within the context of the children’s natural
environment (Hoelscher et al., 2002). Adolescents spend most of their time at school the
10-month academic year and eat at least one of the three major meals in school;
therefore, the type of foods and beverages sold is important in supporting students’
nutritional intake. Hofer (1999) stated for most students formal school hours is often
arranged into a complex schedule of athletic events, social life, after-school activities,
studying, and part-time jobs. The most likely time adolescents spend time with their
families is the evening meals and weekend. However, spending time with family on
weekends is not first on the list in an adolescent’s schedule. Nutrition education in
school is a good opportunity to help adolescents practice healthy behaviours. Schools
also have an appropriate opportunity to address peer and social pressure that influence
health behaviours.
Table 2.7 and Table 2.8 show school-based nutrition education interventions that
are conducted from 1990 until 2004. The brief summary of the number of the
participants in each study, the participants’ ages, the evaluation methods, the
intervention components, and the outcomes of the intervention are described in the table.
According to the components used in the studies, this thesis classifies the studies into

46
three categories, which are teacher or adult educator, parental involvement, and peer
educator component.
2.7.1. Teacher- and adult-led in school based intervention studies
Table 2.7 describes studies using teacher or adult as educator. Teachers and other
deliverers in these studies have been trained prior to the intervention. Studies have
shown that teacher-led intervention may become more effective than family-based
intervention or interventions involving parents only, since teachers can guide and
support them during this intervention period. Teacher involvement can decrease the
conflict between adolescents and parents (Rhodes, Grossman, & Resch, 2000). The
effectiveness of teacher-led or adult-led intervention depends on how students perceive
teacher support. For example, when the students in grades 6 to 8 think the teacher
support is high, they may increase their self-esteem (Reddy, Rhodes, & Mulhall, 2003).
Students may become more confident in their ability to change.
Using a variety of teaching methods has also been shown to be effective. Soliven
(2003) categorized teaching methods into
1. Visual teaching method, the lessons were presented using pictures, sketches,
graphs, diagram, and other illustrations.
2. Auditory teaching method, oral presentation was the mean in delivering the
lessons.
3. Tactile teaching method, students were engaged in hands-on experiments.
4. Kinesthetic teaching method, teachers incorporate physical activity into the
lessons.
5. Group teaching style, the integration of group discussion during the lessons.
6. Individual teaching style, students were given activities or assignment to
work on individually.
Several studies used the combination of these methods, such as Killen et al.
(1993) who effectively used a slide presentation, modified by the story telling, and Little
et al. (2002) who successfully used general lecturing, group activity, and class
discussion to increase the nutrition knowledge. Long and Stevens (2004) integrated the
use of internet and behavioural-activity-based classroom components, while Anderson et
al. (2001) used only a behavioural and activity based classroom component.

47
The way students were recruited did not influence the results of the studies. In
the Long and Stevens (2004) study, students volunteered to join the study, while
students were assigned to follow the Anderson et al. (2001) program. Both interventions
were successful in increasing students’ nutrition knowledge; however, they did not
report the improvement of eating behaviour. Both studies were done in short duration
(less than a year). This might indicate that while adolescents may learn about nutrition
information; they may need a longer period to internalize practice for sustained
behavior. It is difficult to determine the duration of an intervention to effectively
influence students’ behaviour without taking so much school time. For example,
students in the “Exercise Your Options” study (Dairy Council, 2003) changed their
intake behaviour after 16 weeks of intervention, but Himes et al. (2003) observed the
changes in the participants after 1.5 years of implementation of soft drink intervention
on younger students.
The “FOR (Food On the Run)” intervention was incorporated not only into
classroom but also campus, and community related activities, such as working with
foodservice to add healthful food options, school-wide taste tests, and lunchtime
demonstration (Agron, et al., 2002). More learning and teaching activities beyond the
classroom in health and nutrition education would enable students and teachers to utilize
critical health literacy opportunities within the local communities (Leger, 2001) as was
done in the “FOR” intervention.
One study, “Nutrition For Life” (Devine, Olson, & Frongillo, Jr, 1992) made
modest but significant improvement in nutrition knowledge, attitudes, and behaviour
scores despite its short term duration. In another study, participants changed their food
choice into healthier foods after seven weeks with the “Exercise Your Options”
intervention (Dairy Council of California, 2003). Although the duration of the study
was considered short (16 weeks), the “New Moves” (Neumark-Sztainer, Story, Hannan,
Rex, 2003) used social cognitive theory and multicomponents to improve participants’
attitude towards physical activity; however, there was no significant different between
the students’ behaviour in the control schools and intervention schools. However, the
likeliness of attitude and behaviour change increases when a theory-based and multi-
component intervention is applied in a study.

Table 2.7. Adult taught approach in school-based nutrition education interventions for adolescents from 1990-2004Study Subjects Evaluation methods Duration Components Result
Nutrition For
Life (Devine et
al., 1992)
1863
students.
Grade 7-8
Questionnaire ranged: 1-50
hrs
Nutrition For Life manuals can be
integrated into the curricula of Health
and Home Economic class in New
York State schools.
Increased nutrition attitude,
behavior, and knowledge scores
when the manuals were used for 3
hours.
Killen et al.
(1993)
967 girls.
11-13 yrs
Anthropometric measures,
interview, self-report
assessment.
18 lessons Slides presentations, workbooks Increased students’ knowledge, not
their attitude and behavior.
Planet Health
(Gortmaker et
al., 1999)
1295
students.
Grade 6-7
Body Mass Index, Triceps
Skinfolds, Food and
Activity Survey
2 school
years
Classroom lessons, physical
education materials, wellness
sessions, and fitness funds.
Girls reduced the obesity
prevalence and energy intake, and
increased fruit and vegetable
intake. The amount of television
viewing decreased in all genders.
Anderson et al.
(2001)
118 teens.
14-18 yrs
Knowledge test and food
analysis chart.
4 wks Guide to Good Food Manual. Improved students’ nutrition
knowledge but not food choice
EYO (DCC,
2003)
3,300
students.
11-14 yrs
3 sets of Food record
(pre-test, post-test, and 3
months follow up)
7 days EYO manual focused on food choice Increased all food group food
consumption and decreased intake
of extras and sodas.
Food on the Run
(Agron, et al.,
2002)
220
students.
Grade 10,
16 y
Self-reported survey (42
close-ended questions)
9 months Training for students, classroom
sessions, and activities (working with
food service)
Increased knowledge and positive
attitude scores toward PA and
nutrition. Improved healthy eating
behavior.
48

Table 2.7. Adult taught approach in school-based nutrition education interventions for adolescents from 1990-2004Study Subjects Evaluation methods Duration Components Result
Little, Perry,
Volpe (2002).
39 high
school
students
Questionnaire 5 wks 5x 1 hour nutrition lesson: 20-35 min
lectures, 10-15 min activity, 5-10
min concluding the lesson.
Improved nutrition and sport
knowledge and increased
supplement taking.
New Moves
(Neumark-
Sztainer et al.,
2003)
201 girls.
Grade 9-10
Individual interviews,
mailed surveys to parents,
process evaluation by
subjects
16 wks
study, 8 wks
follow up
PA sessions, nutrition sessions, social
support sessions, a follow up
component (weekly lunch meeting at
school).
The intervention groups improved
PA behaviour and the skill in
choosing healthy food and self-
perceived.
Long and
Stevens (2004)
121
students.
12-16 y
Health Behaviour
Questionnaire.
1 month 5 hours of WWW-based nutrition
education and 10 hours classroom
curriculum
Increased the students’ self-
efficacy for healthy eating, but not
healthy food consumption.
PATH (Bayne-
Smith et al.,
2004)
442 girls.
14-19 y
Self-administered
anonymous questionnaire
30 mn x 5
days/wk,
12 wks
Manuals with vigorous exercise,
health and nutrition education, and
behavior modification.
Improves knowledge, healthy
eating habits, percentage of body
fat, and blood pressure
Note: EYO: Exercise Your OptionsPATH: Physical Activity and Teenage HealthPA: physical activity
49

50
Table 2.7 also shows that the longer the duration of the studies the more likely
they were to influence attitude and behaviour. The use of more than one component in a
study increases the exposure time of the intervention on students. Moreover, a multi-
component study appears to address a variety of factors that shape eating habits.
2.7.2. Parental and Family Involvement
Parents influence children’s eating habit by controlling the types of food
purchased, prepared and served at home (Tseng, 2004), being role models in shaping
health behaviours (Rosso & Rise, 1994), and shaping children’s food preferences and
eating habits (Birch & Fischer, 1998; Brown & Ogden, 2004). Several studies presented
in this section identified parental influence as important in the choice of food and
beverage consumed. For example, adolescents aged 16 years saw their parents as
models for healthy behaviors, especially in type and amounts of fat consumed, smoking
habit, and alcohol consumption. Rosso & Rise (1994) reported that parents still
influenced their adolescent children’s health behavior even as their age increased from
16 to 20 years. Neumark-Sztainer, Story, Perry, & Casey (1999) also found that
adolescents aged 12-19 years identified parental influence as one of secondary
importance in affecting their food choices. Taste enjoyment of food was shown to be
shaped by the culture, custom, and meal pattern in the family where parents usually hold
the highest control (Birch & Fischer, 1998; Brown & Ogden, 2004). Finally, Young and
Fors (2001) found that two working parents in a family reduced the possibility for
increasing parental supervision. Studies have shown that parents can improve the
healthy behaviors of their children by 11% by showing support for their children when
they engage in healthy behaviors (He, Kramer, Houser, Chomitz, & Hacker, 2004). The
frequency of family meals also increases the quality of healthy dietary intake. As
children grow and become teenagers, however, they gain more freedom to buy and
prepare their own meals (Neumark-Sztainer, Story, Hannan, & Rex, 2003).
There were also school-based interventions for adolescents that tried to involve
parents as seen in Table 2.8, such as the New Moves (Neumark-Sztainer et al., 2003),
Gimme 5 intervention (Nicklas et al., 1998), and TEENS intervention (Lytle et al.,
2004). In the Gimme 5, intervention parents were asked to help their children to eat five

51
servings of vegetable and fruit everyday. The New Moves intervention incorporated
minimal parent involvement in order to enhance parental support for students by sending
14 postcards containing information related to physical activity, social support, and
nutrition. In the TEENS intervention, parents received a nutrition package from school,
and some parents joined the nutrition advisory council at school (Birnbaum, 2002).
The New Moves intervention (Neumar-Sztainer et al., 2003) and TEENS
intervention (Lytle et al., 2004) did not change the eating behaviour of the students
while the Gimme 5 intervention (Nicklas et al., 1998) could not maintain the change for
a long time. These findings might indicate that parental involvement works only for
younger children (Reynolds et al., 2000; Nader et al., 1996; Himes et al., 2003) or early
adolescents because during early adolescence, adolescents tend to trust and respect
adults (Spear, 2004). The participants in the previously mentioned interventions were
high school students who are in their middle adolescence when they are often mistrustful
of adults and greatly influenced by peer group (Spear 2004). This could be the reason of
the ineffective adult involvement component. Another possibility is the available design
of parental involvement might not be sufficient in assuring the involvement.
Relationship with family members has been identified as one of the most
valuable items by 6th graders, but the importance of this relationship gradually
diminished as students grow up (Prokhorov, Perry, Kelder, & Klepp, 1993). In late
adolescence, generally teenagers have established a body image, are directed toward the
future, are independent, and are consistent in their values and beliefs (Spear, 2004). The
involvement of the nutritional expert might be useful during this time because teenagers
are open to the rationale behind the given information explained by the dietitian
2.7.3. Peer Educator Intervention
Peer educator intervention has been shown to effectively influence adolescents’
eating behaviours. During adolescence, teenagers form their identity through their
opinions and decisions. Often their opinions are against those of their parents and
teachers. During middle adolescence, peers become more dominant than parents when it
comes to social activities, such as dietary habits (Cullen et al., 1998; Spear, 2004), dress
styles, clubs, social events, and hobbies (Sigelman & Shaffer, 1991). In the study by

52
Herns and Gates (1998), adolescents showed a wide autonomy by buying their own food
at the grocery store. However, they depended more on their parents in choosing courses,
deciding to go to college, selecting a job, and spending money (Sigelman & Shaffer,
1991). Pugh and Hart (1999) noted that peer groups are important for identity
development in adolescence since identity is built within relationship. Pugh and Hart
followed (1999) 10th and 11th grade students for two years and observed that these
students explored who they are by being involved in activities with their peers. Sloane &
Zimmer (1993) explain that peer leaders are considered effective because adults and
teenagers, would rather consider and personalize a message that may alter their attitudes
and behaviors if they believe the messenger is comparable to them in lifestyle and faces
the same concern and pressure. Jago (1998) and Siegel, Aten, Roghmann, and Enaharo
(1998) stated that peer education is suitable for adolescents, especially grade 9, because
they prefer to please their peers than adults. They found that peer educators were more
effective than adult educators for students aged 13 to 18 years.
Role modeling, peer pressure, consistent support and educational resources make
schools an ideal spot for health promotion study. Peer education had been applied
widely and successfully in other health intervention studies. These include, reducing
steroid utilization for high school athletes (Goldberg & Elliot, 1993), improving sexual
knowledge and behavior in Turkish and Zambian adolescents (Özcebe & Akin, 2003;
Agha & Van Rossem, 2004), HIV prevention (Smith & DiClemente, 2000), and
nutrition education for adults and pregnant teenagers (Anliker et al., 1999). A peer
educator approach was also incorporated in school-based nutrition education for
adolescents as shown in Table 2.8. The Peterborough School Nutrition Project (Parker &
Fox, 2001), TACOS (Fulkerson et al., 2004), and TEENS (Lytle et al., 2004) used
different forms of peer educator involvement.
Botvin, Baker, Filazzola, and Botvin (1990) found that for grade 7 students,
older peer educator intervention could produce significant behavior changes. The
experimental schools were assigned to either prevention program implemented by older
peers, prevention program implemented by regular classroom teachers, prevention and
booster sessions by older peers, or prevention and booster sessions by classroom

Table 2.8. School-Based Nutrition Education Interventions for Adolescents from 1990-2004 using parental involvement and peer-leader components
Study Subjects Evaluation methods Duration Components Result
HHP
(Barthold et
al., 1993)
19,073
students.
Grade 6-12
- 5 yrs Assemblies (introductory presentation),
Classroom presentations, flyers for
parents.
There is no evaluation for the outcomes.
Gimme 5
(Nicklas et
al., 1998)
2213
students.
Grade 9-12
Class-administered
questionnaires
workshops
5x55 min.
For 4 y.
Media campaign, workshops,
supplementary activities, school meal
modification, and parental
involvement.
Increased knowledge scores, the intake of
fruit and vegetables 14%.
TACOS
(Fulkerson
et al., 2004)
812-3157
secondary
schools
students.
Activity list and
observation, and food
sale list and student
mailed survey.
2 yrs Media campaign, taste-testing, public
announcements, poster and T-shirt
contest, raffle event, recipe creations,
game, peer-leader promotion, and
coupon kick-off.
An increase of percentage lower fat food
sales. The duration of promotions and the
percentage lower-fat food sales were
unrelated in year l, but significantly related
in year 2.
TEENS
(Lytle et al.,
2004)
2883
students.
Grade 7-8
24-hour recalls,
survey, observation,
documentation.
2 yrs Peer leaders involvement, TEENS
curriculum, family component.
Increased food choice score, but did not
improve food intake
Note: HHP: Healthy Heart ProgramTACOS: Trying Alternative Cafeteria Options in SchoolsTEENS: Teens Eating for Energy and Nutrients at Schools
53

54
teachers. However, the roles of peer educators were common as additional educator,
which means that older peers assisted the classroom teacher in giving any sessions.
In the TEENS study, students chose the peer educators by writing the names of
three boys and three girls in class that they respected and admired. The peer educators
were involved in the delivery of the TEENS (Teens Eating for Energy and Nutrition at
School) curriculum, which contained 10 classroom sessions for 40-45 minutes, and
small group activities and discussion as the leaders. Students and teachers were satisfied
with the peer educator component (Birnbaum, Lytle, & Story, 2003). Compared to
students exposed to classroom and environmental component, students exposed to peer
educator and classroom components made the greatest improvement in dietary habit
(Birnbaum et al., 2002). The dietary behaviour improvement was not sustained until the
second year follow-up (Lytle et al., 2004). In the Tacos study, students volunteered
themselves to become peer promoters. They obtained incentives for the activities they
conducted (Fulkerson et al., 2004). Students in the Peterborough School Nutrition
Project worked with the drama teacher and presented a drama of healthy eating
behaviour in the cafeteria (Parker & Fox, 2001).
Anliker et al., (1999) reported that working with peer educators benefits a
program because peer educators can provide comments on program design, material, and
implementation. In most occasions, the peer educators change their eating habits and
become role models and supporters in overcoming barriers to dietary change. However,
several challenges in building a peer educator program are also encountered, such as
providing careful training, support, and monitoring for peer educators, and motivating
peer educators to be more active in the program.
2.8. Summary
Humans need to drink fluid since the water in the food and the water produced
by oxidation of food (metabolic water) are inadequate to replace the loss. The main
beverages consumed by adolescents (except plain water) are milk, fruit juice, and soft
drinks. Adolescents have shifted their beverage intake over the last 30 years into low
milk intake, higher fruit juice intake, and high soft drink intake. This phenomenon was
concurrent with the trend toward larger portion sizes, which occurred at home and

55
outside meals. Soft drink access from fast food restaurants, vending machines, school
cafeterias had increased. Age has an inverse relationship with fluid milk intake, and
positive relationship with carbonated soft drink intake. Teens aged 14-17 years are the
greatest soft drink consumers in the 6-17 year old population. Soft drinks are consumed
during breaks (50% of total sweetened beverage intake), lunch, and dinner.
Beverage intake in this study is assessed using a beverage frequency
questionnaire, which is developed based on food frequency questionnaires. The
advantages of using food frequency questionnaires are give moderate burden to subjects,
can be self-administered, assess usual diet, and require low cost and short time. Food
frequency questionnaires also have several weaknesses: poor precision, memory
dependence, complex cognitive skill requirement. Food frequency questionnaires
provide enough accuracy by presenting a good reproducibility in adolescents and 6th
grade students. Food frequency questionnaires have 0.57 Pearson correlation in
reproducibility for soda intake.
High soft drink intake compromises health, especially bone and dental health.
The intake of soft drinks replaces the milk consumption, which lead to the inadequate
calcium intake. Adequate calcium intake is important for bone mass density attainment
which reaches its peak during adolescents. By consuming soft drinks, adolescents
increase their phosphorus intake and make their calcium/phosphorus ratio imbalance,
which can increase the release of calcium from bone. Soft drinks contain acid that can
dilute the mineral from teeth while the protection effect of saliva on teeth cannot be
observed in the presence of soft drinks. Sugar content in soft drinks also can cause teeth
caries. This sugar may also add calorie intake in adolescents and increases their weight.
Soft drink intake may have a role in causing obesity.
Adolescents spend most of their time in schools for their lessons and extra
curriculum activities. The access to unhealthy beverages has become competitors for
milk and fruit juice consumptions. Most students, in a school that provided milk only,
consumed milk. Soft drinks companies conduct marketing activities in schools,
including product selling, direct advertising, indirect advertising, and market research. In
the product sale activities, the soft drink companies establish exclusive contracts with
school under the goal of short-term fundraising. The contracts give one particular brand

56
exclusive rights to set their vending machines in schools to build brand loyalty among
students. These promotion activities convey a mixed message to adolescents. The
message about healthy beverages seems not important to be practiced in the daily life
because of the fact that school provides and promotes unhealthy beverages to students.
Nutrition education in school is a good opportunity to practice healthy eating and
to address the peer and social pressure that influences health behaviours. School-based
intervention provides several advantages, including maintaining continuous and
concentrated contact with participants, conducting more cost-effective intervention, and
presenting the intervention within the context of the students’ natural environment. The
long duration studies had a higher likeliness in influencing attitude and behaviour, but
more than one component in a study increased the exposure time of the intervention on
students. Moreover, a multicomponent study may address more factors that shape eating
habits.
Parents and family influence children’s eating habit by controlling the food
availability at home, being role models, and shaping children’s food preferences and
eating habit. Having parents involved in nutrition education for adolescents can improve
both children’s and parents’ eating habits. Parents also can support children in
improving their eating habits. Adolescents have a wide autonomy by buying their own
food at the grocery store out of need or choice. In late adolescence, teenagers have
established a body image, are directed toward the future, are independent, and are
consistent in their values and beliefs. The involvement of the nutritional expert might be
useful during this time because teenagers are open to the rationale behind the given
information. During middle adolescence, peers are more dominant than parents when it
comes to social activities, such as dietary habit, dress styles, clubs, social events, and
hobbies. Working with peer educators provides benefits because they can provide
comments on program design, material, and implementation. Mostly, the peer educators
change their eating habits and become role models and supporters in overcoming
barriers to dietary change. Several challenges in building a peer educator program
include providing careful training, support, and monitoring for peer educators, and
motivating peer educators to be more active in the program.

57
3. METHODS
The study was done in two phases in two different cities, with the first phase
conducted in Saskatoon (fall 2003) and the second phase in Prince Albert (fall 2004).
This chapter describes the study participants, assessment methods, intervention and data
analysis used in both phases of the study.
Ethical approval was obtained from the University of Saskatchewan’s Ethics in
Behavioral Science Research. The ethical approval for this study was received in March
10, 2003 (Appendix 1). Permission was also obtained from the appropriate school
divisions.
3.1. Subjects
A total of 113 grade nine students from four high school classes (two from
Saskatoon and two from Prince Albert participated in the study). Students from the two
Saskatoon classes (57 students) were selected from Ethical Living classes and received
the intervention in fall 2003. In this phase (called Phase 1) classes were assigned as peer
educator class and self-taught class. Students (76 students) from two English classes in
Prince Albert high school received the intervention in the fall, 2004; classes were
assigned as dietitian taught and self-taught (Phase 2). The gender composition of the
class can be seen in Table 3.1. Schools were selected from the Directory of
Saskatchewan schools (Saskatchewan Learning, 2003) in consultation with the
appropriate School divisions. All participants were from middle class neighborhoods,
with close access to a variety of beverage outlets. For example, there were soft drink
vending machines on all premises along with cafeteria where soft drink, milk and other
beverages were served. Beverages were also available at malls within a five minute
walk.
All participants were informed of the intent of the study. Appropriate permission
was sought and obtained from the school divisions concerned before the letters to
principals and teachers were mailed. Written consent was obtained from principals,

58
teachers, parents and guardians of eligible participants (Appendix 2), and all student
participants. Principals, teachers, consenting parents and students were sent an
information package describing the study and protocols. The identity of the participants
was not recorded or used in any way, except to characterize participants by class A, B,
C, or D, and to allow sequential recalls and questionnaires to be tracked. The one student
who did not participate in the intervention was given alternate activities.
Table 3.1. The gender composition of each class
Models of delivery Females Males Total
Saskatoon (Phase 1)
Multiple strategies:
Peer Educator (Class A)
10 23 33
Single strategy:
Self Taught (Class B)
10 14 24
Prince Albert (Phase 2)
Multiple strategies:
Dietitian Taught (Class C)
12 8 20
Single strategy:
Self Taught (Class D)
16 8 24
3.2. Intervention Manual
A multifactorial and interactive nutrition education program FUEL (Fluids Used
Effectively for Living) was designed as the intervention for the study. The program
emphasizes the importance of nutritious food and beverage, healthy habits and active
living behaviors among students, parents, and teachers. The program is linked to the
Saskatchewan Learning’s Evergreen health education curriculum guide for grades 6-9
which embraces a Comprehensive School Health model developed to positively
influence knowledge, attitudes, and behaviour of students. The manual developed
consists of a binder with six core lesson plans described in Table 3.2. All six lesson
plans included a Student Material component (e.g. overheads, worksheets, and quiz).

59
Also included were fact sheets and recipes that students could take home and share with
their families.
The development of F.U.E.L for your future was conducted as a collaborative
effort between the research team, including a Registered Dietitian who was the research
assistant and another register dietitian who assisted in progam delivery, with input from
undergraduate and graduate nutrition students, recent nutrition graduates, and teachers
within the Saskatoon school system. Students in the first phase study provided valuable
input which was used to revise the manual. The revised FUEL manual was then used in
the second phase study. The project was funded by Dairy Farmers of Canada.
Table 3.2. Lesson Plan Description for FUEL
No Title Description1 The ABCs of Nutrition Focus on increasing students’ knowledge of human
nutrition, by helping them make nutritious food choices using accurate, current information that emphasizes a positive relationship between overall health and healthy eating.
2 Understanding the Nutritional Value of Beverages
Focus on helping students gain an understanding of the nutritional content of various beverages, reflect on their own beverage intake and recognize the health impact of their choices.
3 Healthy Bones Helping students develop an understanding of the calcium content of various foods/beverages, ways to incorporate calcium into their daily routine, the importance of calcium to their health, and the role of dairy products in meeting their calcium needs.
4 Making Fast Food Fit Helping students gain knowledge and skills on how to consume healthier meals incorporating the basic nutrition principles of variety and moderation after learning ways to cut the sugar, fat, and salt in their fast food.
5 Vitality! Helping students explore the importance of physical activity and incorporating nutritious food and beverage choices into their lifestyle to improve their overall health
6 Take a Peek… Helping students develop the skills to read and understand “Nutrition Facts” on a food label and examine various advertising techniques to become smarter consumers.

60
3.3 Intervention Delivery
The peer educator class (Class A), located in one Saskatoon high school, received full
presentations of the FUEL manual. Multiple strategies in teaching were incorporated,
including visual, lecture, tactile, group interaction and discussion, and role-play. Cross-
age peers (five nutrition students, College of Pharmacy and Nutrition, University of
Saskatchewan), and six same-age peers (grade nine students) assisted the two dietitians
who were recent nutrition graduates (older peers) in carrying out the intervention. The
cross-age peers worked closely with the same-age peers. Both cross-age first year
nutrition students and same-age high school peers received nutrition training prior to the
beginning of the intervention by the research associate who coordinated the overall
program delivery. There were approximately three training sessions about 30 minutes
long with follow-up sessions during the intervention. The peer educator training was
intended to build teamwork among them. In the training, the peer educators were
informed about their roles in the classroom sessions and outside the classroom. Peer
educators also received nutrition information that would be given in the classroom
sessions. In the training, the peer educators built their skill in performing the
experiments and demonstration.
The two classes in Prince Albert were located in the same high school. The size
of the high school allowed the treatment and comparison classes to be in the same high
school. Class C was taught by a local dietitian who presented all of the FUEL
presentations throughout the intervention. The application of multiple strategies was
similar; however, there was no recipe demonstration and beverage tasting in this class.
The self-taught classes (classes B and D) received the same handouts from the
same package. This approach was considered as a single strategy because students only
received illustration packages. Although these classes did not receive any presentations
from the manual, teachers may have responded to their questions regarding the
handouts. Teachers in these classes did not receive the FUEL manual until the study was
completed.

61
3.4. Beverage Intake Assessments
The questionnaire used to assess students’ beverage intake was a food frequency
questionnaire called Beverage Frequency Questionnaire (BFQ), which asked 19
questions about specific beverages, 4 questions about beverage intake habits at school, 6
questions about attitude towards beverages, and 11 questions about knowledge regarding
healthy foods and beverages. The BFQ questions regarding beverage intake were
answered in the expressions: more than once/day, once/day, once/week, and
seldom/never. A 24 hour recall was taken at each pre-, post-test, and three months
follow up, and results of this are reported elsewhere (Vatanparast, Lo, Henry, Whiting,
submitted). Knowledge, attitude and behavior/ dietary practices pertaining to the
selection and consumption of beverages were collected using the same questionnaire
(Appendix 3). The baseline and post-intervention questionnaires were identical. Sections
of the questionnaire included: 1) nutrition knowledge about sources of calcium in the
diet, 2) attitude pertaining to beverage consumption, and willingness to make changes
(self-efficacy), 3) behavior, dietary practices pertaining to beverage consumption, and 4)
demographic characteristics. The questionnaires were conducted as class exercises, and
supervision and assistance were provided. Draft questionnaires were pre-tested by high
school students not participating in the study and were revised accordingly.
Each participating student was asked to complete three sets of BFQ, one at the
beginning of the study, one week following the delivery of the nutrition program, and
three months after the intervention delivery. For classes A and B only, the final set of
questionnaire was administered one year later, in September 2004. The longer-term
assessment was conducted to determine the extent to which students were able to
integrate and sustain changes to their beverage consumption habits. The timing of
beverage intake assessment is described in Table 3.3.
Each administration of questionnaires was conducted as a class exercise within
the 45 minutes class period. Completion of the actual questionnaire took 10-15 minutes,
with the remaining time used for 2-hour recalls. To allow for consistent data collection,
the research team including trained research assistant carried data collection. Data
collection at both classes A and B, was carried out during the same time, at baseline-and
following program delivery. To maintain consistency throughout the study, several

62
nutrition graduate students and research team members were present during the
assessments.
Figure 3.1. The timeline of the FUEL study
Table 3.3. Timing for beverage intake assessments (day.month.year).
Assessments Peer educator (Class A)
Control-Self Taught(Class B)
Dietitian Taught(Class C)
Control-Self Taught
(Class D)Pre-test 01.10.2003 02.10.2003 15.10.2004 26.10.2004
Post-test 13.11.2003 14.11.2003 08.11.2004 25.11.2004
3 months follow up 12.01.2004 13.01.2004 10.01.2005 10.01.2005
1 year follow up 13.10.2004 14.10.2004 N/A N/A
3.5. Statistical Analysis
The 19 questions on beverages in the BFQ were classified into six categories: 1)
milk, 2) juice, 3) noncarbonated soft drinks, 4) carbonated soft drinks, 5) other drinks
and 6) noncarbonated and carbonated soft drinks were totaled as sugary drinks. To
obtain milk intake, the intakes of all types of fluid milk, milkshakes, and yogurt were
added. The intake of juice included vegetable juice, 100% orange, cranberry, and grape
juice, and orange-juice-calcium rich. The intake of noncarbonated soft drinks contained
the intake of tea and coffee whenever added with sugar, ice tea, sport drinks, fruit drinks,
and punch, such as Fruitopia™ and Sunny Delite™. Carbonated soft drink intake
covered the intake of Coke™, Pepsi™, Sprite™ and Seven-Up™, as well as their

63
generic equivalents. Total sugary drinks intake was the addition of noncarbonated soft
drink and carbonated soft drink intakes. The other drinks consisted of bottled water, hot
tea, and black coffee.
For coding purposes, the expression of seldom or never in the BFQ was
considered as zero serving/week, about once/week was one serving/week, once/day was
seven servings/week, and more than once/day was 14 servings/week.
Data were analyzed using SPSS (version 11.5, Chicago, Illinois). A normality
test, Shapiro-Wilk’s W test, to assess the data distribution was run first. The results
indicated that the data were not normally distributed; thus a non-parametric test was
used to analyze the data. Kruskal-Wallis ANOVA was used to compare all of the
beverage assessments in a class. To determine significant differences among the
beverage assessments, Friedman test was performed. Wilcoxon test was used as a
multiple comparison test with the alpha level corrected according to the number of
comparison done: 0.008 for Saskatoon high schools and 0.017 for Prince Albert high
school. The correlation between beverage intakes was assessed using Spearman
correlation.
3.6 Process Evaluations
The process of the intervention was evaluated after each presentation by asking
students to write down what they liked most from the FUEL presentation that day. These
data are not presented in this thesis. Another process evaluation was done, by asking the
students the rate of their satisfaction towards the FUEL study in the scale of 1 to 5 (1
being poor and 5 being excellent). The level of satisfaction is discussed further in
Chapter 4 (sections 4.3 and 4.4).

64
4. RESULTS
4.1. Introduction
This section begins with a description of each school’s beverage environment
followed by a summary of findings of beverage intake behaviour, nutrition knowledge
and attitude toward healthy beverages assessments conducted at baseline, and post-
intervention. Each school environment will be described under a separate heading
(Saskatoon peer educator school, Saskatoon self-taught school, and Prince Albert
school). Because the pre-test survey was used to describe the current beverage intake
habits of grade 9 students, the intake of students from the same city were combined.
4.2. School environment
Participants were from primarily middle class neighborhoods according to
Statistical Canada cut-off of income for family size more than 3 persons, which is ∼$
40,000/year, (Atlas of Canada, 2001). Participants had close access to a variety of
beverage outlets. For example, there were soft drink vending machines on all premises
along with cafeteria where soft drink, milk and other beverages were served. Beverages
were also available at near by malls within five minutes walk.
4.2.1. Saskatoon Peer Educator School (Class A)
The peer educator high school consisted of 1600-1800 students from an area with
income levels ranging from $33,000 to 130,000 per year (Muhajarine & Delanoy, 2003).
Seven vending machines were in the school: four were located close to the main
entrance and three to the cafeteria. Of the four machines that were located close to the
main entrance, one sold mainly snack items such as chips, candies and gum while the
remaining three sold an assortment of carbonated and non-carbonated beverages. Close
to the cafeteria, one machine sold snack foods and two sold beverages. Coke™ was the
main carbonated soft drink sold; non-carbonated soft drinks included sport drinks, fruit
drinks, and iced tea. Each machine also carried an assortment of 100% fruit juice, and

65
bottled water. Milk was provided in the school cafeteria only. Students could access
beverages from the fast food restaurant in the mall that is located within 5 minutes
walking distance.
At school, the price of milk and bottled water was relatively more expensive than
the price of other vending machine beverages. The price for 591 mL soft drinks and
100% fruit juice was $ 1.75 while the price for 250 mL of milk was $ 1.00 ($ 1.50 for
500 mL milk).
4.2.2. Saskatoon Self-taught School (Class B)
The control school consisted of 986 students from an area with income levels
ranging from $33,000 to 130,000 per year (Muhajarine & Delanoy, 2003). The control
school had four vending machines: one was placed after the main entrance, one at the
side entrance, and two at the cafeteria. The side entrance vending machine sold snack
foods, and the others sold beverages. The types of beverages sold were carbonated soft
drinks, non-carbonated soft drinks (iced tea and fruit drinks), 100% fruit juice, and
bottled water. Milk was provided in the cafeteria, as well as several types of coffee. The
price of carbonated and non-carbonated soft drinks was $ 2.00 for 591 mL, while the
price of 250 mL milk was $ 0.75 ($ 1.40 for 500 mL milk) and 355 mL 100% fruit juice
was $ 2.00. Across the street, there were two fast food restaurants and two convenience
stores.
4.2.3. Prince Albert School (Class C and D)
The high school in Prince Albert consisted of approximately 2000 students in grades
9 to 12, who came from an area with income levels ranging from $37,000 to 80,000 per
year (Saskatchewan River School Board, 2004). The vending machines were located in
cafeteria and student lounge. Cafeteria vending machines sold soft drinks, bottled water,
chips, and chocolate bars while the cafeteria also offered soft drinks, slushies, fruit
drinks, water, and milk. Other vending machines in the student lounge sold soft drinks,
bottled water, chips and chocolate bars. Each day the cafeteria offered a special of the
day, which was a combination of lunch entrées and soft drinks. There was a pizza place,

66
a bakery, a submarine sandwich, and a convenience store within a walking distance,
where students could access beverages.
4.3. Students’ beverage intake, knowledge, and attitude at the baseline
Figure 4.1 and 4.2 describe the beverage intake of grade 9 students before the
intervention. Overall, students in all three schools drank similar amounts of beverages
tested (milk, juice, carbonated soft drinks, non-carbonated soft drinks, and other
beverages). However, grade 9 participating students in the two Saskatoon schools (class
A and B) consumed a higher percentage of non-carbonated soft drinks (e.g. fruit drinks,
fruit punch, ice tea, coffee with sugar, and ice tea), which led to a higher consumption of
sugary beverages than participants in the Prince Albert school (class C and D). The
percent contribution of juice intake between the three schools was marginally
significantly different (p= 0.058) while the level of significant different was determined
at 0.05. The caloric beverage intake (milk, 100% fruit juice, and sugary beverages) of
participating students in all three schools was not significantly different.
Figure 4.3 shows that the intake of female participants in all classes before the
intervention was not significantly different. However, female participants in the class A
and B drank a higher percentage of non-carbonated drinks than those in class C and D.
Figure 4.4 shows that boys in the class A and B drank more other beverages (coffee, tea,
and bottled water) than those in class C and D. The percent contribution of caloric
beverages between boys’ intake in all three schools was not significantly different.
Furthermore, participants (male and female) in all classes did not drink caloric beverages
in significantly different amounts.
Baseline assessment showed no significant different between the knowledge of
participants in all three schools. However, female students in class C and D had a
significantly higher knowledge score than female students in class A and B. The attitude
score of participants in class A and B towards healthy beverages was significantly higher
than that of students in class C and D.
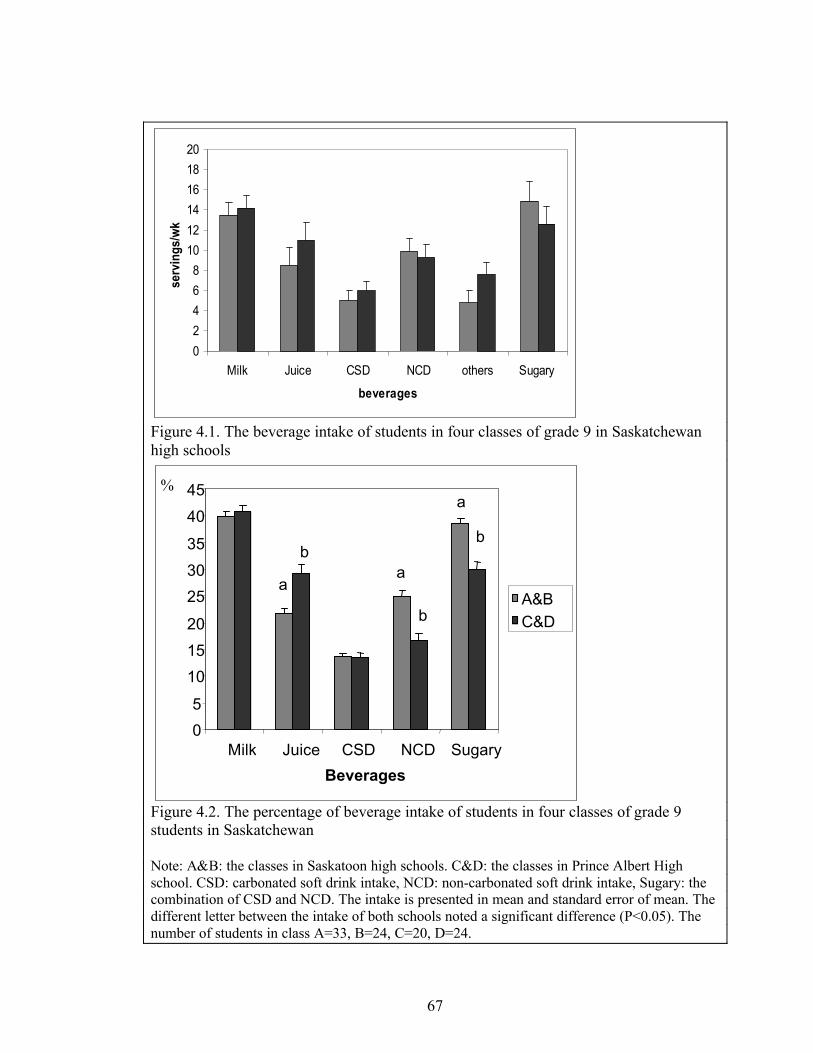
67
02468
101214161820
Milk Juice CSD NCD others Sugary
beverages
serv
ings
/wk
Figure 4.1. The beverage intake of students in four classes of grade 9 in Saskatchewan high schools
Figure 4.2. The percentage of beverage intake of students in four classes of grade 9 students in Saskatchewan
Note: A&B: the classes in Saskatoon high schools. C&D: the classes in Prince Albert High school. CSD: carbonated soft drink intake, NCD: non-carbonated soft drink intake, Sugary: the combination of CSD and NCD. The intake is presented in mean and standard error of mean. The different letter between the intake of both schools noted a significant difference (P<0.05). The number of students in class A=33, B=24, C=20, D=24.
05
101520
253035
4045
Milk Juice CSD NCD Sugary Beverages
A&BC&D
b
a
a
b
a
b
%

68
Figure 4.3. The beverage intake of girls in four classes of grade 9 in Saskatchewan high schools
Figure 4.4. The percentage of beverage intake of boys in four classes of grade 9 students in Saskatchewan
Note: A&B: the classes in Saskatoon high schools. C&D: the classes in Prince Albert High school. CSD: carbonated soft drink intake, NCD: non-carbonated soft drink intake, Sugary: the combination of CSD and NCD. The intake is presented in mean and standard error of mean. The different letter between the intake of both schools noted a significant difference (P<0.05). The number of students in class A=33, B=24, C=20, D=24.The number of girls in class A=9, B=10, C=12, D=8.The number of boys in class A=24, B=14, C=8, D=16.
Serv
ings
/wee
k
0
2
4
6
8
10
12
14
16
18
20
Milk Juice CSD NCD others Sugary beverages
A&BC&D
b
a
Serv
ings
/wee
k
0
2
4
6
8
10
12
14
16
18
20
Milk Juice CSD NCD others Sugary
beverages
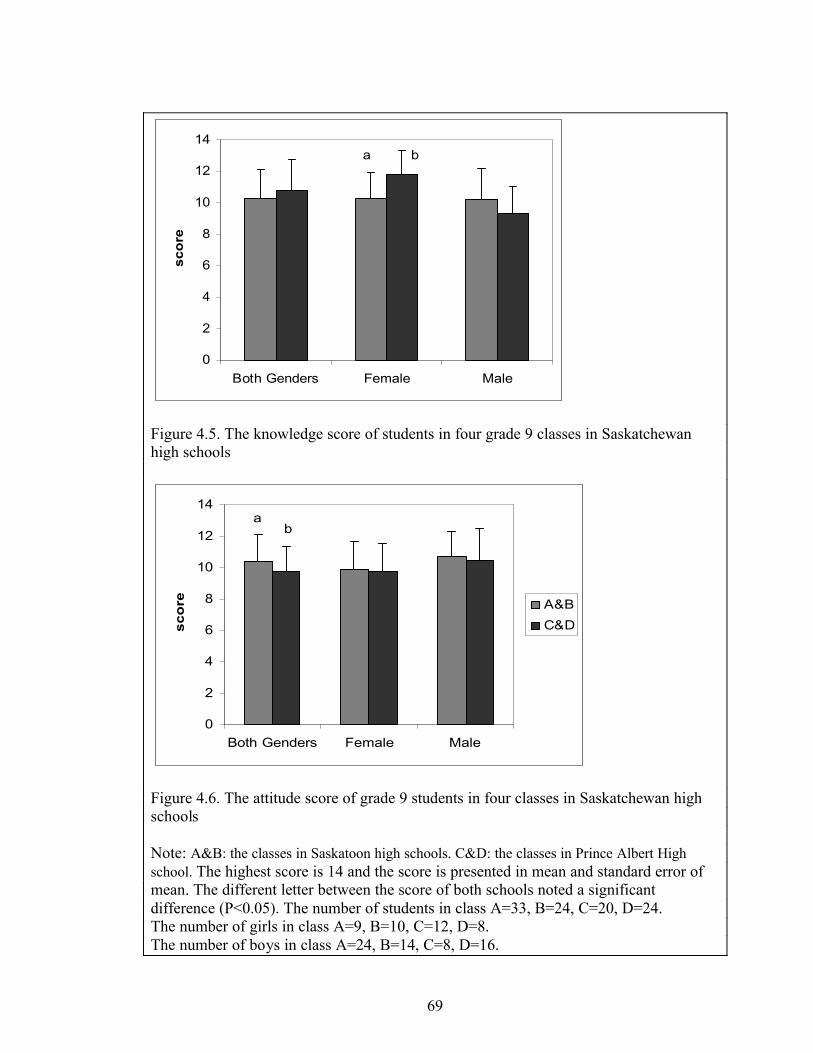
69
0
2
4
6
8
10
12
14
Both Genders Female Male
scor
e
a b
Figure 4.5. The knowledge score of students in four grade 9 classes in Saskatchewan high schools
0
2
4
6
8
10
12
14
Both Genders Female Male
sco
re A&BC&D
ab
Figure 4.6. The attitude score of grade 9 students in four classes in Saskatchewan high schools
Note: A&B: the classes in Saskatoon high schools. C&D: the classes in Prince Albert High school. The highest score is 14 and the score is presented in mean and standard error of mean. The different letter between the score of both schools noted a significant difference (P<0.05). The number of students in class A=33, B=24, C=20, D=24.The number of girls in class A=9, B=10, C=12, D=8.The number of boys in class A=24, B=14, C=8, D=16.

70
Table 4.1 elaborates the questions of students’ attitude towards healthy
beverages. In class A and B, 60% students stated that they would choose pop when they
were offered a choice of milk or pop, as well as 64% class C and D students. This
situation was not triggered by the preference of pop taste or milk taste because 74%
class A and B students and 62% class C and D students said that the taste of milk is
acceptable. Moreover, 91% students in class A and B and 89% in class C and D believed
that milk is not just for children. Most students also stated that they know easy ways to
include milk in the diet (84% class A and B and 77% class C and D).
Table 4.1. Attitude of students in classes A, B, C, and D towards healthy beveragesAgree (%) Somewhat
Agree (%)Disagree (%)Questions
A&B C&D A&B C&D A&B C&DIf you were offered a choice of milk or pop, you will usually chose pop
60 64 33 23 7 13
The taste of milk is acceptable to you
74 61 17 21 9 18
Milk is for everybody, not just for kids
91 89 7 7 2 4
There are easy ways to include milk in the diet
84 77 16 21 0 2
I like the way 100% fruit juice tastes
74 66 23 32 3 2
Drinking fruit juices will help you reduce the risk of cancer
22 18 60 64 18 18
If you improve the types of beverage you drink, you will be a healthier person
72 68 26 30 2 2
Note: A&B: the classes in Saskatoon high schools. C&D: the classes in Prince Albert High school. The number of students in class A=33, B=24, C=20, D=24.
Table 4.2 describes students’ knowledge about healthy beverages. Most students
knew that milk and 100% fruit juice are healthy beverages. Furthermore, they agreed
that consuming milk gives several advantages, especially toward bone health. Only half
of students recognized the differences of nutrient content between 100% fruit juices and
fruit drinks.

71
Table 4.2. Attitude of grade 9 students towards healthy beveragesAgree (%) Somewhat
Agree (%)Disagree (%)Questions
A&B C&D A&B C&D A&B C&DMilk is cheaper than pop 37 32 47 52 16 16Consuming one or more glasses of milk helps strengthen your bones and improve your overall health
93 86 7 14 0 0
Osteoporosis is a condition of weak bones that may break easily
70 66 30 30 0 4
Osteoporosis maybe prevented by getting enough calcium early in life
81 71 19 27 0 2
Dairy products are the richest sources of calcium
67 80 30 20 3 0
Fruit drink has the same nutrients as fruit juice
11 9 28 46 61 45
Note: A&B: the classes in Saskatoon high schools. C&D: the classes in Prince Albert High school. The number of students in class A=33, B=24, C=20, D=24.
Table 4.3 depicts students’ beverage intake according to their answers towards
several attitude and knowledge questions. The answers were categorized into three
categories, which are agree, somewhat agree, and disagree. Students indicated they
would consume a higher amount of milk if they like the taste. Students also are likely to
consume a higher amount of milk whenever they think that there are easy ways to
include milk in the diet (Kruskal-Wallis test resulted p<0.05); however, these are not
significantly different among the categories since the p-values were greater than 0.017.
There were no students disagreeing with the statement that consuming milk can improve
your health and bone strength, so the mean intakes of all beverages in the disagree
category were zero. Students who believed that consuming milk is healthy had a higher
non-carbonated and sugary beverage intake than students who doubted the statement.
Students who considered drinking fruit juices will help to reduce the risk of cancer had a
significantly lower milk intake than others who somewhat agreed with the statement. On
the other hand, there was no significant difference in milk intake between students who
agreed with the statement and students who disagreed with the statement.
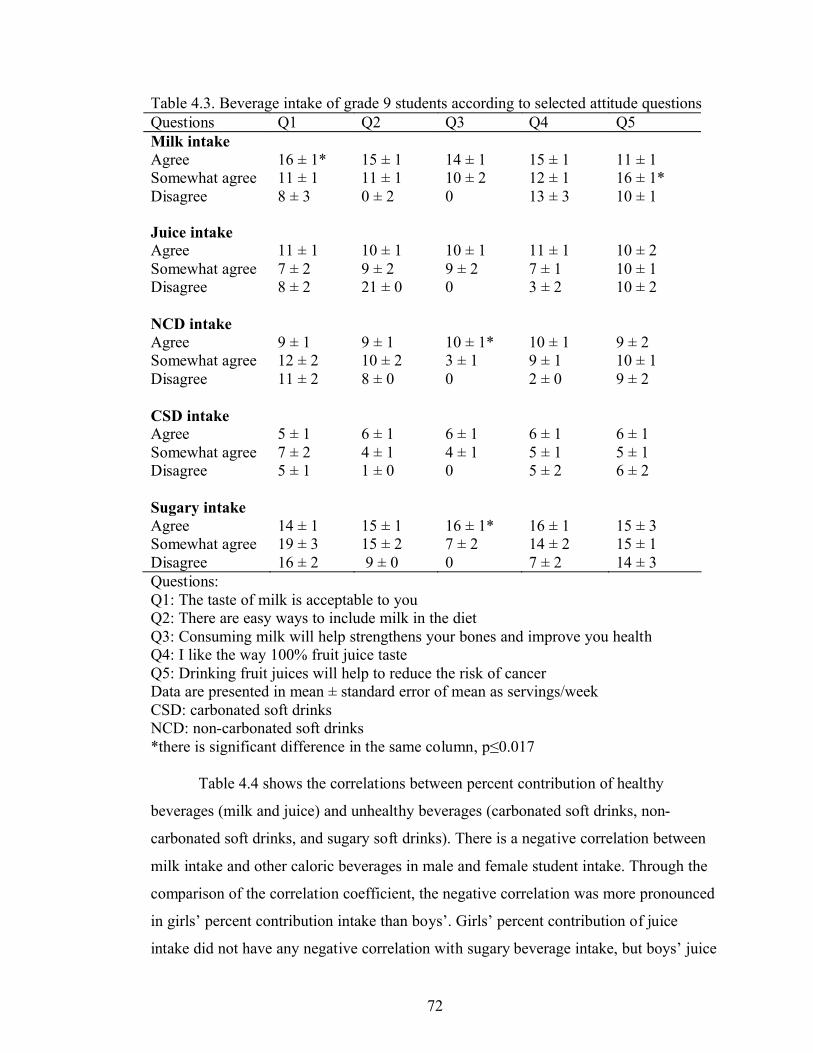
72
Table 4.3. Beverage intake of grade 9 students according to selected attitude questionsQuestions Q1 Q2 Q3 Q4 Q5Milk intake AgreeSomewhat agreeDisagree
16 ± 1*11 ± 18 ± 3
15 ± 111 ± 10 ± 2
14 ± 110 ± 20
15 ± 112 ± 113 ± 3
11 ± 116 ± 1*10 ± 1
Juice intake AgreeSomewhat agreeDisagree
11 ± 17 ± 28 ± 2
10 ± 19 ± 221 ± 0
10 ± 19 ± 20
11 ± 17 ± 13 ± 2
10 ± 210 ± 110 ± 2
NCD intake AgreeSomewhat agreeDisagree
9 ± 112 ± 211 ± 2
9 ± 110 ± 28 ± 0
10 ± 1*3 ± 10
10 ± 19 ± 12 ± 0
9 ± 210 ± 19 ± 2
CSD intake AgreeSomewhat agreeDisagree
5 ± 17 ± 25 ± 1
6 ± 14 ± 11 ± 0
6 ± 14 ± 10
6 ± 15 ± 15 ± 2
6 ± 15 ± 16 ± 2
Sugary intake AgreeSomewhat agreeDisagree
14 ± 119 ± 316 ± 2
15 ± 115 ± 29 ± 0
16 ± 1*7 ± 20
16 ± 114 ± 27 ± 2
15 ± 315 ± 114 ± 3
Questions:Q1: The taste of milk is acceptable to youQ2: There are easy ways to include milk in the dietQ3: Consuming milk will help strengthens your bones and improve you healthQ4: I like the way 100% fruit juice tasteQ5: Drinking fruit juices will help to reduce the risk of cancerData are presented in mean ± standard error of mean as servings/weekCSD: carbonated soft drinksNCD: non-carbonated soft drinks*there is significant difference in the same column, p≤0.017
Table 4.4 shows the correlations between percent contribution of healthy
beverages (milk and juice) and unhealthy beverages (carbonated soft drinks, non-
carbonated soft drinks, and sugary soft drinks). There is a negative correlation between
milk intake and other caloric beverages in male and female student intake. Through the
comparison of the correlation coefficient, the negative correlation was more pronounced
in girls’ percent contribution intake than boys’. Girls’ percent contribution of juice
intake did not have any negative correlation with sugary beverage intake, but boys’ juice

73
intake percentage shows negative correlation with sugary beverage percentage,
especially carbonated soft drinks beverages.
Table 4.4. Correlation among percent contribution of beverages consumed by grade 9 students in four classes in Saskatchewan
Males (n=62) Females (n=39) Total (n=101)BeveragesMilk Juice Milk Juice Milk Juice
r -0.371** -0.433** -0.451**JuiceP 0.003 0.006 0.000r -0.575** -0.409** -0.613** -0.300 -0.608** -0.293**Sugary
beverages P 0.000 0.001 0.000 0.064 0.000 0.003r -0.420** -0.270* -0.408** -0.255 -0.486** -0.168CSDP 0.001 0.034 0.010 0.117 0.000 0.093r -0.319** -0.193 -0.372* -0.171 -0.328** -0.259**NCDP 0.012 0.133 0.020 0.299 0.001 0.009
CSD: carbonated soft drinks NCD: non-carbonated soft drinksSugary Beverages: the sums of CSD and NCDr: Spearman Rho Correlation **Correlation is significant at the 0.01 level (2-tailed)*Correlation is significant at the 0.05 level (2-tailed)
Table 4.5 describes the beverages that were usually drunk by students at schools.
These results represented not only the preference of students but also the availability of
beverages at schools. The most favorite beverage at school was water, followed by soft
drinks. Students drank milk in the smallest amount than any other beverages.
Furthermore, 76% students in class A and B and 96% students in class C and D never
consumed milk at school.
Table 4.5. The percentage of students that drank soft drinks, fruit juice, milk, and water at schools
> once/day (%) Once/day (%) <once/week (%) Seldom/never (%)
A&B C&D A&B C&D A&B C&D A&B C&DSoft Drinks 0 6.8 29.8 18.2 49.1 34.1 21.1 40.9Fruit Juice 5.4 5.3 17.9 22.8 30.4 20.5 46.4 43.2Milk 0 0 7.3 2.3 16.4 2.3 76.4 95.5Water 42.9 27.3 35.7 43.2 17.9 20.5 3.6 9.1A&B: the classes in Saskatoon high schools. C&D: the classes in Prince Albert High school The number of students in class A=33, B=24, C=20, D=24.The number of girls in class A=9, B=10, C=12, D=8.The number of boys in class A=24, B=14, C=8, D=16

74
4.4. Beverage intake of students in classes A and B
As shown in Figure 4.7; students in class A (peer educator class) decreased
significantly their sugary beverage intake and sustained this though-out the study. Both
students’ CSD (carbonated soft drinks) and NCD (noncarbonated soft drinks) intakes in
class A decreased, but it was not significant. The students in class B (self-taught class in
Saskatoon) increased their juice intake at the end of the study (Figure 4.8). There is no
significant change in students’ milk intake in both classes after the intervention.
It can be seen in Figure 4.9 and 4.10 that the significant decrease of sugary
beverage intake after the intervention in class A was contributed mostly by boys.
However, girls also contributed to the significant decrease of peer educator class’ sugary
beverage intake by slightly decreasing their sugary beverage intake, but it was not
sustained beyond the three months follow-up period indicating that girls may need
greater reinforcement than boys. The carbonated soft drink intake in boys and girls was
not as high as expected; however, both girls and boys drank a high amount of non-
carbonated soft drinks.
Females in the self-taught class responded more positively to the intervention
than males as indicated in Figures 4.11 and 4.12. Female students in this class increased
their juice intake and decreased their sugary beverage intake. However, the decrease in
sugary beverage intake could not be observed at the one-year follow up.

75
02468
101214161820
milk juice NCD CSD other sugarybeverages
serv
ings
/wk b
a
bab
Figure 4.7. Beverage intake of students in class A
0
2
4
6
8
10
12
14
16
18
20
milk juice NCD CSD other sugaryBeverages
serv
ing/
wee
k
a
ab
ab b
Figure 4.8. Beverage intake of students in class B
Note: Class A: Peer educator class in Saskatoon high school, Class B: Self-taught class in Saskatoon high schoolCSD: carbonated soft drink intake, NCD: non-carbonated soft drink intake, Sugary: the combination of CSD and NCD. The intake is presented in mean and standard error of mean. The different letter noted a significant differences among beverage intake assessments (P<0.008). The number of students in class A during the pre-test=33, post-test=30, 3 months follow-up=32, and one year follow-up= 23The number of students in class B during the pre-test=24, post-test=24, 3 months follow-up=24, and one year follow-up=19

76
02468
101214161820
milk juice NCD CSD other sugarybeverages
serv
ings
/wee
k
Figure 4.9. Beverage intake of girls in class A
0
2
4
6
810
12
14
16
18
20
milk juice NCD CSD other sugarybeverages
serv
ings
/wee
k
a
bb b
a
bb
ab
Figure 4.10. Beverage intake of boys in class A
Note: Class A: peer educator class in Saskatoon high schoolCSD: carbonated soft drink intake, NCD: non-carbonated soft drink intake, Sugary: the combination of CSD and NCD.The intake is presented in mean and standard error of mean. The different letters noted a significant differences among beverage intake assessments (P<0.008).The number of girls during the pre-test=8, post-test=9, 3 months follow-up=9, and one year follow-up= 9The number of boys during the pre-test=24, post-test=21, 3 months follow-up=23, and one year follow-up=14

77
The correlation among percent contribution of students’ caloric beverage intake
is shown in Table 4.6. Negative correlations between percent contributions of milk and
sugary beverage intakes, and milk and NCD intakes appeared in all beverage intake
assessments (pre-test, post-test, 3 month follow-up, and 1 year follow up). The negative
correlation between juice and milk intakes disappeared at one year follow-up. However,
the small number of subjects at one year follow-up compromised the strength of the one
year correlation analysis.
Table 4.6. Correlation among the beverage intake percentage of students in class AMilk JuiceDrinks
Pre-testn=33
Post-testn=30
3 mn=32
1 yn=23
Pre-testn=33
Post-testn=30
3 mn=32
1 yn=23
r -0.521** -0.427* -0.558** -0.026JuiceP 0.002 0.019 0.001 0.905r -0.514** -0.697** -0.443* -0.816** -0.351* -0.232 -0.384* -0.446*Sugary
drinks P 0.002 0.000 0.011 0.000 0.045 0.217 0.030 0.033r -0.079 -0.387* -0.035 -0.613** -0.341 -0.361* -0.296 -0.445CSDP 0.663 0.034 0.851 0.002 0.052* 0.050 0.100 0.033r -0.521** -0.637** -0.487** -0.639** -0.179 -0.045 -0.170 -0.239NCDP 0.002 0.000 0.005 0.001 0.339 0.815 0.353 0.273r -0.030 0.073 -0.275 0.075 0.334* 0.158 0.284 0.249Attitud
e P 0.868 0.701 0.127 0.735 0.057 0.402 0.116 0.252r 0.179 0.131 0.420* 0.329 -0.108 0.188 -0.028 0.314Knowl
edge P 0.319 0.491 0.017 0.125 0.550 0.320 0.880 0.145Class A = Peer educator class in Saskatoon high schoolCSD: carbonated soft drinksNCD: non-carbonated soft drinksSugary Beverages: the sums of CSD and NCDr: Spearman Rho Correlation **Correlation is significant at the 0.01 level (2-tailed)*Correlation is significant at the 0.05 level (2-tailed)

78
02468
101214161820
milk juice ncd carb other sugarybeverages
serv
ing/
week
a a
b
a
Figure 4.11. Beverage intake of girls in class B
02468
101214161820
milk juice NCD CSD other sugaryBeverages
serv
ing/
wee
k
Figure 4.12. Beverage intake of boys in class B
Note: Class B: Self-taught class in Saskatoon high schoolCSD: carbonated soft drink intake, NCD: non-carbonated soft drink intake, Sugary: the combination of CSD and NCD.The intake is presented in mean and standard error of mean. The different letters noted a significant differences among beverage intake assessments (P<0.008).The number of girls during the pre-test=10, post-test=10, 3 months follow-up=10, and one year follow-up= 7The number of boys during the pre-test=14, post-test=14, 3 months follow-up=14, and one year follow-up=12

79
Table 4.7 depicts the correlation among female students’ beverage intake as a
percentage of total caloric beverages (milk, 100% fruit juice, and sugary beverages). A
negative correlation between percent contributions of juice intake and milk intake was
found, as well as a negative correlation between percent contributions of milk intake and
sugary beverage intake. As milk intake percentage increased, knowledge score
decreased. All of these negative correlations became nonsignificant a week after the
intervention; but they appeared again in one year follow up. After the intervention, there
was a negative correlation between the percent contributions of milk and juice intakes.
Table 4.7. Correlation among the beverage intake percentages of girls in class AMilk JuiceDrinks
Pre-testn= 9
Post-testn=: 9
3 mn= 9
1 yn= 9
Pre-testn= 9
Post-testn=: 9
3 mn= 9
1 yn= 9
r -0.367 -0.867** -0.661* -0.033Juice
P 0.332 0.002 0.053 0.932
r -0.733* -0.567 -0.226 -0.949** -0.250 0.172 -0.283 -0.203Sugary drinks P 0.025 0.112 0.559 0.000 0.516 0.460 0.460 0.600
r 0.066 -0.351 0.143 -0.881** -0.393 0.393 0.159 -0.305CSD
P 0.866 0.354 0.714 0.002 0.295 0.295 0.683 0.425
r -0.337* -0.617 0.444 -0.915** -0.233 0.433 -0.233 -0.170NCD
P 0.050 0.077 -0.293 0.001 0.546 0.244 0.546 0.663
r 0.122 0.308 0.191 0.274 0.514 0.434 -0.518 -0.120Attitude
P 0.755 0.420 0.623 0.476 0.157 -0.299 0.154 0.759
r -0.743* -0.392 0.562 -0.136 0.149 0.213 -0.303 0.383Knowledge P 0.022 0.297 0.155 0.727 0.703 0.582 0.428 0.309
Class A: Peer educator class in Saskatoon high schoolCSD: carbonated soft drinksNCD: non-carbonated soft drinksSugary Beverages: the sums of CSD and NCDr: Spearman Rho Correlation **Correlation is significant at the 0.01 level (2-tailed)*Correlation is significant at the 0.05 level (2-tailed)
Before the intervention, there was negative correlation between the percent
contributions of milk and juice intakes in boys, as well as between the percent

80
contributions of milk and sugary beverage intakes, especially non-carbonated soft drink
intake (Table 4.8). At the three months follow up, the negative correlations between
milk and sugary beverage, carbonated soft drink, and non-carbonated soft drink intake
percentages went weaker. At one year follow up, the negative correlation between
percent contribution of juice and sugary drink intake grew stronger.
Table 4.8. Correlation among the beverage intake percentage of male students in class AMilk JuiceDrinks
Pre-testn= 24
Post-testn= 21
3 mn= 23
1 yn= 14
Pre-testn= 24
Post-testn= 21
3 mn= 23
1 yn= 14
r -0.475* -0.218 -0.444* 0.075JuiceP 0.019 0.343 0.034 0.799r -0.464* -0.773** -0.574** -0.673** -0.432** -0.382 -0.402* -0.683**Sugary
drinks P 0.022 0.000 0.004 0.008 0.035 0.087 0.057 0.007r -0.043 -0.558** -0.236 -0.636* -0.458** -0.414 -0.341 -0.496CSDP 0.842 0.009 0.278 0.014 0.025 0.062 0.112 0.071r -0.611** -0.716** -0.426* -0.255 -0.124 -0.261 -0.240 -0.365NCDP 0.002 0.000 0.043 0.379 0.564 0.252 0.269 0.200r -0.021 -0.005 0.261 0.081 0.334 0.165 0.390 0.440AttitudeP 0.922 0.984 0.229 0.784 0.111 0.475 0.066 0.115r 0.431* 0.324 0.430* 0.793** -0.175 0.279 0.128 0.232Knowle
dge P 0.035 0.152 0.040 0.001 0.415 0.221 0.561 0.424
Class A: Peer educator class in Saskatoon high schoolCSD: carbonated soft drinksNCD: non-carbonated soft drinksSugary Beverages: the sums of CSD and NCDr: Spearman Rho Correlation **Correlation is significant at the 0.01 level (2-tailed)*Correlation is significant at the 0.05 level (2-tailed)
After the intervention, the negative correlation between the percentage of juice and
sugary beverage intakes (especially CSF) disappeared. However, this negative
correlation appeared at 3 months follow up and became stronger at one year follow up.
The knowledge score appeared to have positive correlation with the percentage of milk
intake. Except at the post-test and three month follow-up, the negative correlation
between the percent contributions of milk and sugary drink intakes was stronger in girls
than on boys before and at one year follow up.
Table 4.9 shows the correlation among the beverage intake percentage of
students in class B. A negative correlation between percent contribution of juice and

81
milk intakes was discovered only at one year follow-up. The negative correlations
between percent contribution of sugary beverage and milk intake disappeared at one
year follow-up. Before the intervention, the negative correlation between CSD
percentage and milk percentage was close to that between the percentage of NCD and
milk intakes. After the intervention, the negative correlation between CSD and milk
percentages became weaker and disappeared at 3 months follow up and one year follow-
up. A negative correlation between percent contribution of juice and sugary beverage
intakes was discovered only at three months follow-up, which is mainly caused by CSD
percentage.
Table 4.9. Correlation among the beverage intake percentage of students in class BMilk JuiceDrinks
Pre-testn= 24
Post-testn= 24
3 mn= 24
1 yn= 19
Pre-testn= 24
Post-testn= 24
3 mn= 24
1 yn= 19
r -0.311 -0.214 -0.328 -0.632**JuiceP 0.140 0.316 0.118 0.004r -0.873** -0.819** -0.483* -0.341 -0.031 -0.329 -0.540** -0.372Sugary
drinks P 0.000 0.000 0.017 0.153 0.884 0.116 0.006 0.117r -0.603** -0.453* -0.339 -0.117 -0.202 -0.476* -0.559** -0.474*CSDP 0.002 0.026 0.106 0.634 0.344 0.019 0.004 0.040r -0.750** -0.785** -0.487* -0.410 -0.059 -0.215 -0.367 -0.100NCDP 0.000 0.000 0.016 0.081 0.785 0.312 0.078 0.685r 0.582** 0.018 0.200 -0.043 -0.299 0.259 -0.033 -0.186AttitudeP 0.003 0.932 0.350 0.861 0.156 0.222 0.879 0.445r 0.130 0.232 0.214 0.232 -0.172 0.417* 0.079 -0.290Knowle
dge P 0.545 0.276 0.316 0.339 0.421 0.043 0.713 0.228
Class B: Self-taught class in Saskatoon high schoolCSD: carbonated soft drinks , NCD: non-carbonated soft drinksSugary Beverages: the sums of CSD and NCDr: Spearman Rho Correlation **Correlation is significant at the 0.01 level (2-tailed)*Correlation is significant at the 0.05 level (2-tailed)
In girls in class B, a negative correlation was found between the percent
contributions of milk intake and sugary drink intakes (Table 4.10). This negative
correlation changed over the year. A negative correlation between the percentages of
juice and carbonated soft drink intakes could be found only at one year follow up.
Table 4.11 shows relationships among percent contribution of beverage intakes
in boys in class B. The negative correlation between the percentage of milk and sugary

82
beverage intake decreased gradually, and it could not be observed at three month and
one year follow up. The negative correlation between the percentages of juice and
carbonated soft drink intakes could be found only at one year follow up. The same
phenomenon also happened for the percentage of girls’ intake (Table 4.10). After the
bonferroni correction, students’ knowledge and attitude in both classes did not change
significantly, so the graphs of students’ knowledge and attitude are not presented.
As shown in Table 4.12, students in class A expressed a higher level of
satisfaction (p<0.05) than class B. The satisfaction level started at 1 for poor, 2 for fair, 3
for good, 4 for very good, and 5 for excellent. Overall, 71% students said the program
was fun, informative, interesting, and helped them to learn. Furthermore, 77% of the
students would suggest this program to others. Students indicated that they appreciated
learning about nutrition and healthy eating, participating in the recipe demonstrations, or
trying the recipes at home.
Table 4.10. Correlation among the beverage intake percentage of females class BMilk JuiceDrinks
Pre-testn= 10
Post-testn= 10
3 mn=10
1 yn= 7
Pre-testn= 10
Post-testn= 10
3 mn= 10
1 yn= 7
r -0.055 0.164 -0.085 0.321Juice
P 0.881 0.650 0.815 0.482
r -1.00** -0.875** -0.612 -0.929** 0.055 -0.534 -0.547 -0.536Sugary drinks P 0.000 0.001 0.060 0.003 0.881 0.112 0.102 0.215
r -0.76** -0.675* -0.430 -0.429 -0.231 -0.527 -0.486 -0.929**CSD
P 0.011 0.032 0.214 0.337 0.521 0.117 0.154 0.003
r -0.93** -0.681* -0.320 -0.857** 0.055 -0.439 -0.317 -0.179NCD
P 0.000 0.030 0.056 0.014 0.881 0.204 0.372 0.702
r 0.644 0.505 0.155 0.154 -0.328 0.716* -0.047 0.617Attitude
P 0.044 0.137 0.669 0.741 0.354 0.020 0.898 0.140
r 0.068 0.391 0.178 0.019 -0.317 0.764** 0.502 -0.636Knowledge P 0.851 0.263 0.623 0.968 0.372 0.010 0.140 0.125
Class B: Self-taught class in Saskatoon high schoolCSD: carbonated soft drinksNCD: non-carbonated soft drinksSugary Beverages: the sums of CSD and NCDr: Spearman Rho Correlation **Correlation is significant at the 0.01 level (2-tailed)*Correlation is significant at the 0.05 level (2-tailed)

83
Table 4.11. Correlation among the beverage intake percentage of male students in self-taught class
Milk JuiceDrinksPre-testn= 14
Post-testn= 14
3 mn= 14
1 yn= 12
Pre-testn= 14
Post-testn= 14
3 mn= 14
1 yn= 12
r -0.596* -0.686** -0.73** -0.637*JuiceP 0.025 0.007 0.003 0.026r -0.73** -0.701** -0.295 -0.077 0.051 0.004 -0.341 -0.620*Sugary
drinks P 0.003 0.005 0.306 0.812 0.864 0.988 0.233 0.032r -0.348 -0.134 0.035 0.014 -0.132 -0.250 -0.511 -0.655*CSDP 0.223 0.647 0.905 0.966 0.652 0.389 0.062 0.021r -0.516* -0.719** -0.380 -0.063 -0.121 0.075 -0.176 -0.203NCDP 0.059 0.004 0.180 0.846 0.681 0.799 0.547 0.527r 0.383 -0.256 0.161 -0.620* -0.399 0.081 -0.176 -0.640*AttitudeP 0.176 0.377 0.582 0.032 0.157 0.757 0.548 0.024r 0.275 -0.062 0.190 -0.655* -0.174 0.221 -0.231 -0.065Knowle
dge P 0.340 0.832 0.515 0.021 0.551 0.448 0.428 0.840Class B: Self-taught class in Saskatoon high school 3 m: 3 month follow-upr: Spearman Rho Correlation Sugary Beverages: the sums of CSD and NCDCSD: carbonated soft drinks NCD: non-carbonated soft drinks**Correlation is significant at the 0.01 level (2-tailed)*Correlation is significant at the 0.05 level (2-tailed)
Table 4.12. Satisfaction level and comments of students in class A and BClass A Class B
Satisfaction level
3.6 3.0
What I liked most about the FUEL:
1. The FUEL provided opportunities to try different drink.
2. The FUEL increased the ability to make the drink.
3. There is no homeworkduring the FUEL study.
4. The FUEL provided information.
5. The FUEL contained interesting facts.
6. Thethe teachers or instructors in the FUELstudy were friendly.
7. The FUEL is interactive
1. The FUEL presented lot of information, gave a lot of facts about fast food
2. I learn something from the FUEL
3. The FUEL provided recipes that were liked by parents.
4. The FUEL provided interesting facts
5. The FUEL provided information about healthy eating
6. The FUEL showed healthy food choice.
Class A: Peer educator class in Saskatoon high schoolClass B: Self-taught class in Saskatoon high school

84
4.5. Beverage intake of student in classes C and D
Figures 4.11 and 4.12 show that nutrition education in both classes altered
students’ beverage intake, especially in decreasing sugary beverage intake. The change
of students’ beverage intake in class D (Prince Albert self-taught class) could not be
observed by three months follow up. Although the multiple comparisons did not reveal
any differences, it can be seen in Figure 4.11 that the sugary beverage intake was
decreasing at three months follow up. When the beverage intake of male and female
students in class C (dietitian-taught class) was analyzed separately, the change is not
significant and the figure was not shown.
Females in self-taught class altered their beverage intake slightly (Figure 4.13),
and males in the same class decreased their carbonated beverage intake after the
intervention (Figure 4.14). The girls increased their sugary beverage intake at three
months follow up. Although the decrease of carbonated beverage intake could not be
detected at three months follow up, a decrease in sugary beverages was observed at the
same time. This occurrence might be caused by a slight decrease in both carbonated
beverage and non-carbonated beverage intakes.
Table 4.13 shows negative correlations among percent contribution of students’
beverage intakes in class C. A negative correlation between the percent contribution of
milk and sugary beverage intakes appeared at all beverage intake assessments. This
negative correlation was mainly caused by the percentage of non-carbonated beverage
intake. The negative correlation between the percentage of milk and juice intake
disappeared at post-test only.
In class C, Table 4.14 shows that the negative correlation between the percent
contributions of milk and sugary beverage intake in girls grew stronger from the pre-test
to the three month follow up. The negative correlation between the percentage of milk
and CSD intakes was found at three month follow up only. The same phenomenon also
happened between the percentage of milk and CSD intake and the percentage of milk
and juice intakes.

85
02468
101214161820
milk juice CSD NCD other sugarybeverages
serv
ings
/wee
k
Figure 4.13. Beverage intake of students in class C
02468
101214161820
milk juice CSD NCD other sugarybeverages
serv
ings
/wee
k
a abb
Figure 4.14. Beverage intake of students in class D
Note: Class C: Dietitian-taught class in Prince Albert high school, Class D: self-taught class in Prince Albert high schoolCSD: carbonated soft drink intake, NCD: non-carbonated soft drink intake, Sugary: the combination of CSD and NCD. The intake is presented in mean and standard error of mean. The different letter between the beverage intake assessments noted a significant difference (P<0.05). The number of students in class C during the pre-test=20, post-test= 21, and 3 month follow-up=20The number of students in class D during the pre-test=24, post-test= 24, and 3 month follow-up=23

86
02468
101214161820
milk juice CSD NCD other sugarybeverages
serv
ings
/wee
k
Figure 4.15. Beverage intake of female students in class D
02468
101214161820
milk juice CSD NCD other sugarybeverages
Serv
ing/
week
a ab
b
aab b
Figure 4.16. Beverage intake of male students in class D
Note: Class D: Self-taught class in Prince Albert high schoolCSD: carbonated soft drink intake, NCD: non-carbonated soft drink intake, Sugary: the combination of CSD and NCD. The intake is presented in mean and standard error of mean. The different letter between the beverage intake assessments noted a significant difference (P<0.05). The number of girls in class D during the pre-test=8, post-test= 8, and 3 month follow-up=8The number of boys in class D during the pre-test=16, post-test= 16, and 3 month follow-up=15
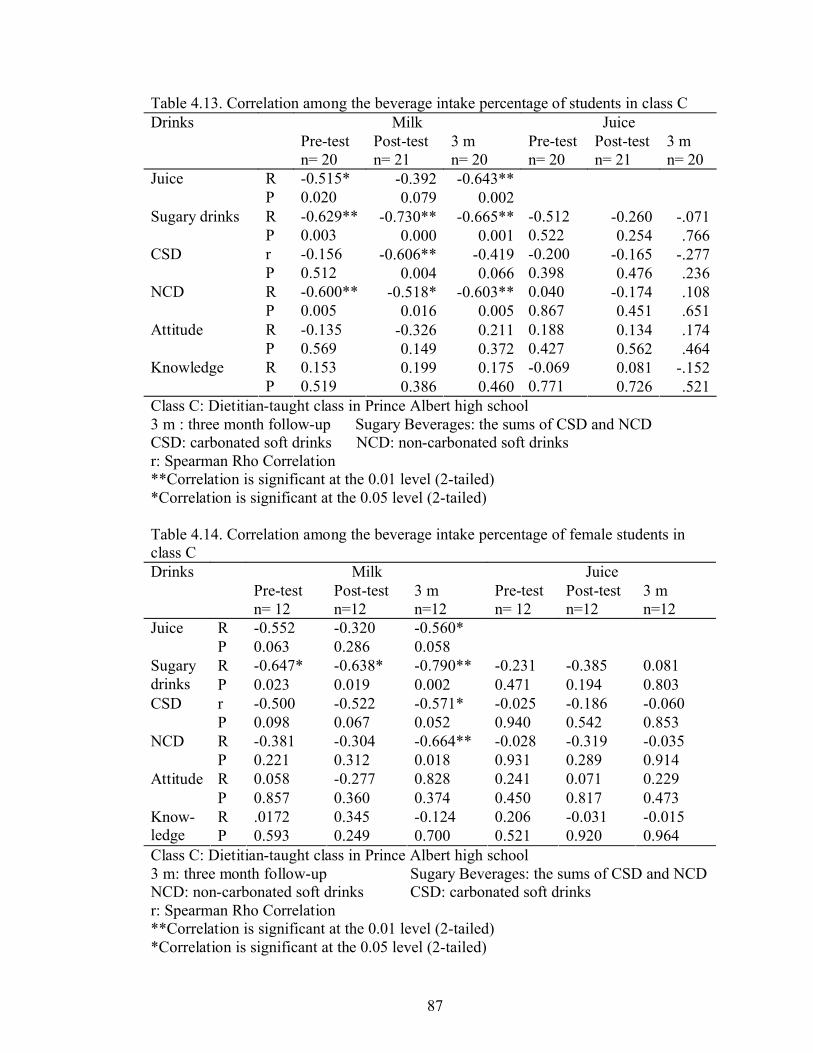
87
Table 4.13. Correlation among the beverage intake percentage of students in class CMilk JuiceDrinks
Pre-testn= 20
Post-testn= 21
3 m n= 20
Pre-testn= 20
Post-testn= 21
3 m n= 20
R -0.515* -0.392 -0.643**JuiceP 0.020 0.079 0.002R -0.629** -0.730** -0.665** -0.512 -0.260 -.071Sugary drinks P 0.003 0.000 0.001 0.522 0.254 .766r -0.156 -0.606** -0.419 -0.200 -0.165 -.277CSDP 0.512 0.004 0.066 0.398 0.476 .236R -0.600** -0.518* -0.603** 0.040 -0.174 .108NCDP 0.005 0.016 0.005 0.867 0.451 .651R -0.135 -0.326 0.211 0.188 0.134 .174AttitudeP 0.569 0.149 0.372 0.427 0.562 .464R 0.153 0.199 0.175 -0.069 0.081 -.152KnowledgeP 0.519 0.386 0.460 0.771 0.726 .521
Class C: Dietitian-taught class in Prince Albert high school3 m : three month follow-up Sugary Beverages: the sums of CSD and NCDCSD: carbonated soft drinks NCD: non-carbonated soft drinksr: Spearman Rho Correlation **Correlation is significant at the 0.01 level (2-tailed)*Correlation is significant at the 0.05 level (2-tailed)
Table 4.14. Correlation among the beverage intake percentage of female students in class C
Milk JuiceDrinksPre-testn= 12
Post-testn=12
3 mn=12
Pre-testn= 12
Post-testn=12
3 mn=12
R -0.552 -0.320 -0.560*JuiceP 0.063 0.286 0.058R -0.647* -0.638* -0.790** -0.231 -0.385 0.081Sugary
drinks P 0.023 0.019 0.002 0.471 0.194 0.803r -0.500 -0.522 -0.571* -0.025 -0.186 -0.060CSDP 0.098 0.067 0.052 0.940 0.542 0.853R -0.381 -0.304 -0.664** -0.028 -0.319 -0.035NCDP 0.221 0.312 0.018 0.931 0.289 0.914R 0.058 -0.277 0.828 0.241 0.071 0.229AttitudeP 0.857 0.360 0.374 0.450 0.817 0.473R .0172 0.345 -0.124 0.206 -0.031 -0.015Know-
ledge P 0.593 0.249 0.700 0.521 0.920 0.964Class C: Dietitian-taught class in Prince Albert high school3 m: three month follow-up Sugary Beverages: the sums of CSD and NCDNCD: non-carbonated soft drinks CSD: carbonated soft drinksr: Spearman Rho Correlation **Correlation is significant at the 0.01 level (2-tailed)*Correlation is significant at the 0.05 level (2-tailed)

88
For male students who were taught by a dietitian, the negative correlation
between the percentage of milk and CSD intakes became weaker (Table 4.15). The
weakest negative correlation was observed at three months follow up. The negative
correlation between the percent contribution of milk and sugary drinks intake was not
observed at three month follow up.
Table 4.15. Correlation among the beverage intake percentage of male students in class C
Milk JuiceDrinksPre-testn= 8
Post-testn= 8
3 mn= 8
Pre-testn= 8
Post-testn= 8
3 mn= 8
R -0.467 -0.571 -0.548JuiceP 0.243 0.139 0.160R -0.714* -0.762* -0.667 -0.120 0.048 -0.190Sugary
drinks P 0.047 0.028 0.071 0.778 0.911 0.651r -0.810* -0.786* -0.714* 0.144 0.167 -0.071CSDP 0.015 0.021 0.047 0.734 0.693 0.867R -0.381 -0.690* -0.262 -0.287 0.167 -0.500NCDP 0.352 0.058 0.531 0.490 0.693 0.207R -0.171 -0.494 0.051 0.098 0.346 0.217AttitudeP 0.686 0.213 0.904 0.817 0.401 0.606R 0.230 0.036 0.554 -0.251 0.467 0.060Knowle
dge P 0.584 0.933 0.154 0.550 0.243 0.887Class C: Dietitian-taught class in Prince Albert high school3 m: 3 month follow-upCSD: carbonated soft drinks NCD: non-carbonated soft drinksSugary Beverages: the sums of CSD and NCD r: Spearman Rho Correlation *Correlation is significant at the 0.05 level (2-tailed)
The correlation among the percentage of students’ beverage intake in class D is
presented in Table 4.16. A negative correlation between percent contribution of milk and
juice intakes appeared only at post-test. Another negative correlation between the
percentage of milk and sugary beverages was detected at three month follow-up. A
negative correlation between the percentage of juice and sugary beverages intake was
mainly caused by non-carbonated beverage intake.

89
Table 4.16. Correlation among the beverage intake percentage of students class DMilk JuiceDrinks
Pre-testn= 24
Post-testn= 24
3 mn= 23
Pre-testn= 24
Post-testn= 24
3 mn= 23
R -0.300 -0.677** -0.239JuiceP 0.154 0.000 0.272R -0.191 -0.280 -0.432* -0.796** -0.392* 0.061Sugary
drinks P 0.370 0.186 0.040 0.000 0.058 0.781r -0.138 0.081 -0.143 -0.314 -0.437* -0.223CSDP 0.522 0.706 0.515 0.135 0.033 0.307R 0.091 -0.323 -0.071 -0.527** -0.148 -0.327NCDP 0.672 0.124 0.749 0.008 0.489 0.128R 0.459* 0.065 0.025 -0.321 0.340 0.080AttitudeP 0.024 0.764 0.909 0.126 0.104 0.715R -0.205 -0.200 0.061 0.016 0.269 0.447*Knowled
ge P 0.337 0.349 0.783 0.941 0.204 0.032Class D: self-taught class in Prince Albert high school3 m: 3 month follow-up Sugary Beverages: the sums of CSD and NCDCSD: carbonated soft drinks NCD: non-carbonated soft drinksr: Spearman Rho Correlation *Correlation is significant at the 0.05 level (2-tailed)**Correlation is significant at the 0.01 level (2-tailed)
Although the negative correlation between the percentage of juice intake and
milk intake enhanced at the post-test of female intake in self-taught class, it grew weaker
at three months follow up (Table 4.17). The negative correlation between percentage of
juice and sugary beverage intake became insignificant after the intervention.
Table 4.17. Correlation among the beverage intake percentage of female students in class DMilk JuiceDrinks
Pre-testn= 8
Post-testn= 8
3 mn=8
Pre-testn= 8
Post-testn= 8
3 mn= 8
R -0.714* -0.810* -0.548JuiceP 0.047 0.015 0.160R 0.190 0.119 -0.238 -0.714* -0.619 -0.167Sugary
drinks P 0.651 0.779 0.570 0.047 0.102 0.693r 0.095 0.192 -0.122 0.095 -0.623 -0.073CSDP 0.823 0.649 0.774 0.823 0.099 0.863R 0.167 0.108 -0.619 0.167 -0.407 -0.071NCDP 0.693 0.799 0.102 0.693 0.317 0.867R 0.466 0.000 0.358 -0.037 0.436 -0.140AttitudeP 0.244 1.000 0.385 0.931 0.280 0.740R 0.473 -0.327 0.025 0.303 0.570 0.405Knowled
ge P 0.237 0.429 0.954 0.466 0.140 0.319Class D: Self-taught class in Prince Albert high school3 m: 3 month follow-up Sugary Beverages: the sums of CSD and NCDCSD: carbonated soft drinks NCD: non-carbonated soft drinksr: Spearman Rho Correlation *Correlation is significant at the 0.05 level (2-tailed)

90
Table 4.18 describes the correlation among males’ beverage intakes. Negative
correlations can be seen between the percentage of milk and juice intake, milk and
sugary drink intake, and juice and sugary drink intake.
Table 4.18. Correlation among the beverage intake percentage of male students in class DMilk JuiceDrinks
Pre-testn= 16
Post-testn= 16
3 mn= 15
Pre-testn= 16
Post-testn= 16
3 mn= 15
R -0.088 -0.735** -0.114JuiceP 0.744 0.001 0.685R -0.394 -0.491* -556* -0.796** -0.126 0.127Sugary
drinks P 0.131 0.053 0.031 0.000 0.641 0.652r -0.311 0.080 -0.310 -0.294 -0.493* -0.463CSDP 0.241 0.769 0.261 0.269 0.053 0.082R 0.153 -0.546* -0.104 -0.513* 0.174 0.018NCDP 0.572 0.029 0.713 0.042 0.520 0.950R 0.507* 0.124 -0.051 0.074 -0.486* -0.102AttitudeP 0.045 0.648 0.857 0.785 0.056 0.719R -0.139 -0.110 0.295 0.051 0.027 0.005Knowled
ge P 0.606 0.684 0.286 0.852 0.921 0.985Class D: Self-taught class in Prince Albert high school3 m: 3 month follow-upCSD: carbonated soft drinksNCD: non-carbonated soft drinksSugary Beverages: the sums of CSD and NCDr: Spearman Rho Correlation **Correlation is significant at the 0.01 level (2-tailed)*Correlation is significant at the 0.05 level (2-tailed)
Students, especially girls, in self taught class increased their knowledge score
significantly. This improvement was detected at three month follow up. Students in both
classes did not show any significant difference in the level of satisfaction towards FUEL
study. The average of the level of satisfaction was between good and very good.
The level of satisfaction of students in class C and D is not significantly
different. Overall, 73% students from class C and D would suggest the FUEL to others.
Furthermore, 57% class C and 33% class D students stated that the intervention was fun,
informative, and helped them to eat and drink healthier. Table 4.19 describes students’
satisfaction level and the average comments given by students.

91
Table 4.19. Satisfaction level and comments of students in class C and DClass C Class D
Satisfaction level
3.8 3.4
What I liked most about the FUEL:
1. The FUEL provided nutritional facts.
2. The FUEL provided information about other healthier food choices instead of junk food.
3. The FUEL consisted of games and activities.
4. The FUEL had information on food portions.
5. The FUEL provided information about fast food nutrient content (sugar, fat, salt).
1. The FUEL provided recipes.2. The FUEL had information
about sugar content in foods.3. The FUEL teaches to start eating
healthier.4. The FUEL had food guide and
physical activity guide.5. The FUEL did a draw for the
sweater.6. The FUEL provided information
about the “nutritional facts.”7. The FUEL had information
about the amount of money saved by stop buying soft drinks
8. The FUEL was easy to read9. The FUEL study provided the
food guide slide
Class C: Dietitian-taught class in Prince Albert high schoolClass D: Self-taught class in Prince Albert high school
4.6. Summary of Findings
To simplify the comparison among all classes, a summary of findings was
provided in Table 4.20 and Table 4.21. Table 4.21 describes the summary of primary
findings at the post test in all classes. The summary of findings at three month follow-up
was shown in Table 4.21.

92
Table 4.20. Summary of significant beverage intake relationships (immediate post-test)Multiple strategies Single strategyClass A1
(n= 30)Class C2
(n= 21)Class B1
(n= 24)Class D2
(n= 24)Milk and juice -0.427* -0.677**Milk and sugary beverages -0.697** -0.730** -0.819**Milk and NCD -0.637** -0.518* -0.785**Milk and CSD -0.387* -0.606** -0.453*Juice and sugary beverages -0.392*Juice and CSD -0.361* -0.476* -0.437*Intakes from baseline for milkIntakes from baseline for juice (↓)Intakes from baseline for NCDIntakes from baseline for CSDIntakes from baseline for sugary drinks ↓ (↓) ↓1 Saskatoon 2 Prince Albert **Correlation is significant at the 0.01 level (2-tailed)*Correlation is significant at the 0.05 level (2-tailed)() Significantly different after Friedman test, but not significantly different after bonferoni adjustment.
Table 4.21. Summary of significant beverage intake relationships (3-month post-test)Multiple strategies Single strategyClass A1
(n= 32)Class C2
(n= 20)Class B1
(n= 24)Class D2
(n= 23)Milk and juice -0.558** -0.643**Milk and sugary beverages -0.443* -0.665** -0.483* -0.432*Milk and NCD -0.487** -0.603** -0.487*Milk and CSD -0.476*Juice and sugary beverages -0.384*Juice and NCDJuice and CSDIntakes from baseline for milkIntakes from baseline for juice (↓)Intakes from baseline for NCDIntakes from baseline for CSDIntakes from baseline for sugary drinks ↓ (↓)1 Saskatoon 2 Prince Albert **Correlation is significant at the 0.01 level (2-tailed)*Correlation is significant at the 0.05 level (2-tailed)() Significantly different after Friedman test, but not significantly different after bonferoni adjustment.

93
5. DISCUSSION
The FUEL nutrition education intervention study targeted Grade 9 students because
during this period in their life students may have more disposable income from their
part-time or even full-time job. According to Saskatchewan Labour (2005), one in every
three full-time high school students has an occupation. The study did not solicit
information about family income or family size in the FUEL questionnaires. The income
level stated in the results was derived from Saskatoon and Prince Albert mapping of
family income, and fell into the cluster called middle class.
5.1. School Environment
School food environment reflects the nutrition integrity of the school, which has
become one of the more complex and challenging school issues of recent time (Kubik,
Lytle, Story, 2005). The school food environment includes the foods and beverages
offered in school vending machines and school cafeteria, foods used as rewards and
incentives in the classroom or sold as part of school fundraising. Parental and peer
support of healthy food choice at school, the role modeling behaviour of staff and
students, and school food policies and practices that support healthy food choice are also
considered components of the school food environment (CDC, 1996). The results found
that high schools in the FUEL study offered students a variety of beverages that includes
carbonated soft drink, fruit drinks, and sport drinks, milk and 100% fruits juices.
Students purchase these beverages from vending machines and school cafeterias. In
high schools in Canada, access to soft drink vending machines appears to be more
available in large urban center schools (Henry, 2004). Schools participating in the FUEL
study had fewer soft drink vending machines than those reported in the literature (CSPI,
2004; French et al, 2000; Harnack et al., 2000; Wechsler et al, 2001). In both the US
and Canada there are calls to reduce the number of soft drink vending machines in
schools (French et al., 2002; Henry, 2004; Kubik et al., 2005). In addition, Refreshment

94
Canada (consortium of Canadian soft drink manufacturers) voluntarily removed
carbonated soft drinks from elementary schools, however, non-carbonated sugar
sweetened soft drinks are still available in vending machines (Henry, 2004). This is a
promising first step, which hopefully can be followed by high schools.
In the FUEL study, soft drink vending machines were located mainly at the
school’s entrance and the cafeteria; high traffic areas. Most machines had “eye
catching” displays from the soft drink companies such as Coco Cola™ or Pepsi™. The
promotion of carbonated and other sugar-sweetened beverages such as found in soft
drink vending machines may be sending inconsistent messages about nutrition as
students might look at the nutrition education and healthy eating messages as academic
exercises that are not important to be carried out in daily life (Watkins, 2001).
Inconsistent nutrition messages, policies, and practices compromise the effectiveness of
school-based nutrition education intervention (Gross & Cinelli, 2004). The availability
of beverages influences students’ consumption (Hanson et al., 2005; Vereecken,
Bobelijn, & Maes, 2005; Lee & Reicks, 2003; Gimm, Harnack, & Stry, 2004). The
increase of beverage availability means the increase of offers, and children and
adolescents will drink milk when the milk is offered and served (Pilant & Skinner, 2004;
Fischer, Mitchell, Smiciklas-Wright, Mannino, & Birch, 2004).
Kramer et al. (2002) suggested several key actions to provide healthy food and
beverages in schools. These include creating a pleasant eating environment, selling
foods with appropriate nutrition standards, and integrating behaviour-focused nutrition
education into curriculum.
5.2. The Baseline Survey
5.2.1. The beverage intake of grade nine students in two Saskatoon schools
The results show that the mean daily intake of milk by students was two servings
and of sugary beverages, also two servings. These results are similar with the findings of
the Whiting et al. (2001) study of adolescents in Saskatoon assessed in mid 1990s, and
of a recent study of adolescents in Ontario (Greene-Finestone, Campbell, Gutmanis, &
Evers, 2004) where more than half of the participants in Ontario stated that they
consumed soft drinks daily. This situation suggests a need for intervention in promoting

95
milk intake since the average of milk intake barely met the recommendation of Canada’s
Food Guide to Healthy Eating for adolescents (2-4 servings per day). However, the
FUEL study underestimated students’ milk product intake because we only measured the
fluid milk intake. At the same time, on average adolescents drank two servings of sugary
beverages everyday that each provided 18-35 g added sugar. Although the added sugar
intake by grade 9 students in the FUEL study was below 25% energy intake as
recommended by Institute of Medicine (2002), added sugar intake still may play an
important role in obesity. Bray, Nielsen, and Popkin (2004) found that 6.9% energy from
added sugar provided by soft drinks contributed to the increase of body weight that led
to obesity.
Females’ milk and sugary beverage intakes were lower than males’ in the FUEL
study, which is similar with the Whiting et al. (2001) study. The gender difference in
milk consumption was also found in US adolescents (Grunbaum et al., 2002). The
likelihood of milk consumption of more than 3 servings per day was significantly higher
in boys than in girls. Girls aged 16-17 years have a tendency to link milk with fat and
weight gain, which may be a reason why girls may limit their milk intake (Auld et al.,
2002). Watt and Sheiham (1996) observed that sometimes girls might think that they are
overweight when they are not. Dieting occasions, which are more likely to be found in
girls (Lien, Jacobs, & Klepp, 2002), increase with age and can lead to inadequate intake
of milk products (Neumark-Sztainer et al., 1997; Yannakoulia, Krayiannis, Terzidou,
Kokkevi, & Sidossis, 2004). In contrast in Greek adolescents, the likelihood of drinking
milk daily, especially low fat milk, was higher in students who were on a diet
(Yannakoulia et al., 2004) while students who were not on a diet consumed more soft
drinks. On the other hands, boys’ beliefs of the importance of milk increase their milk
intake (Auld et al., 2002).
Starting from grade 7, more girls skip breakfast with various reasons, such as
saving time to sleep in and feeling not hungry in the morning (or have started dieting)
(Evers, Taylor, Manske, Midgett, 2001). Skipping breakfast can lead to lower milk and
calcium intakes since milk is usually consumed during breakfast (Bowman, 2002; Evers,
Taylor, Manske, Midgett, 2001; Lee & Reicks, 2003). Adolescents who skip meals tend
to eat more snacks and drink more soft drinks.

96
Students in the FUEL study reported drinking more non-carbonated beverages
than carbonated beverages. The non-carbonated beverages included ice tea, coffee with
sugar, sport drinks, and fruit drinks. Some of these non-carbonated beverages are
fortified with vitamins and minerals. In recent years fruit-flavoured drinks, often made
up of 5 to 19 percent real juice, have emerged as a growing component of children and
adolescent diets. Hampl, Taylor, & Johnson (1999) reported that despite their higher
sugar content, compared to 100 % fruit juices, fruit-flavoured (fruit drinks) drinks
provide about 16 percent vitamin C in the diet of adolescents. Parks and colleagues
(2002) note that although these juices may improve vitamin intakes, their effect on
nutrition is not fully understood. In addition, adolescents with low vitamin C intakes (8-
18 mg) have been shown to consume significantly more soft drinks and less high-
vitamin C fruit juice than adolescents with high intake of vitamin C. Adolescents who
consume desirable amounts of vitamin C intake (>50 mg) reported consuming higher
amounts of fruit juice (Hampl et al., 1999). The consumption of high intake of
sweetened beverage may also compromise overall nutrient intake (Alexy, Sichert-
Hellert, and Kersting 2002)
The study also found that participants consumed a significant amount of fruit
juices. The proportion of adolescents’ intake of fruit and vegetable juice relative to
energy-containing beverages has been increasing overtime (Vatanparast, Lo, Henry,
Whiting, submitted). The trend towards increased fruit and vegetable appears
favourable; however, the debate continues with some researchers arguing that at least in
the early years high intakes of fruit juices may be unfavourable to children’s health
(Dennison, Rockwell, & Baker, 1997; Tanasescu, Ferris, Himmelgreen, Rodriques, &
Perez-Escamilla, 2000). Nonetheless, studies of adolescents have reported intakes lower
than the recommended number of servings of fruits and vegetables per day (the
recommendation is five to 10 servings daily); with fifty percent of their intake coming
from juice (Field, Gillman, Rosner, Rockett, & Colditz, 2003). Phillips et al (2004)
reported that 100% fruit juice is an excellent source of many essential vitamins (e.g.
Vitamin C). Along with vitamin C, studies in Germany and the US have found that fruit
juice also contributes other micronutrients, such as B6, for adolescents (Sichert-Heller &
Kersting, 2001; Hampl et al., 1999).

97
Adolescents in Spain consumed 90 mL/day (boys) and 76 mL/day (girls) 100%
fruit juice. Teenagers who did not eat fruit drank more fruit drinks than those who
consumed fruit (Serra-Majem et al., 2001). Compared to FUEL study, students in Spain
drank lower amount of fruit juice, but higher amount of fruit drinks. Consumption of
sugary foods, fruit, vegetable, and 100% fruit and vegetable juices established at the age
15 was preserved until age 21 in Norwegian adolescents (Lien, Jacobs, & Klepp, 2002).
The other beverage category consisted of black coffee, hot tea, and bottled water.
Black coffee and hot tea contain caffeine (Trugo, 2003; Owuor, 2003) as do cola
beverages (Jorge, 2003). The number of adolescents who consume caffeine has
increased overtime. Soft drinks is the highest contributor of caffeine in adolescents’
beverage intake (more than 60%), tea (more than 20%), and coffee (more than 5%)
(Frary, Johnson, Wang, 2005). Studies such as Hering-Hanith & Gadoth (2003) have
found that caffeine compromises children health, by causing headache in children age 9
years after consuming caffeine 1414 mg daily.
By correlating the percent contribution of each beverage providing energy
(referred to as “caloric beverages”), negative relationships were found among them as
shown in Table 4.4. These negative relations between percent contribution of milk and
sugary beverages, milk and juice, and juice and sugary beverages in girls and boys may
suggest that students replaced their milk intake with these other beverages. However,
there are limitations to this analysis. A positive correlation among the beverage intakes
can mean that a student with a high energy requirement drank a lot of milk and a lot of
soft drinks. On the other hand, a negative correlation was expected in analyzing the
percent contribution because as the percent contribution of one beverage intake
increased, those of others would decrease. Hence, one must be cautious in interpretation;
in the FUEL study, only the significant negative correlations will be interpreted.
In agreement with our findings, other studies showed that the replacement of
milk by soft drink intake occurred as early as grade 3 (Blum, Jacobsen, & Donnelly,
2005; Lytle, Seifert, Greenstein, & McGovern, 2000), where the strongest inverse
correlation was shown between milk intake and carbonated soft drink intake. These
results are different from our 24-hour data (Vatanparast, Lo, Henry, and Whiting,
submitted) and from that of Whiting et al. (2001) who detected a significant inverse

98
relationship between non-carbonated soft drink intake and milk intake. This difference
could be caused by the differences in data collecting and analysis. In the FUEL study, a
beverage frequency questionnaire was used to assess students’ beverages intake, and the
correlations between beverage intakes were calculated in the form of percent
contribution of each beverage intake in caloric beverages (milk, juice, and sugary
beverages). However, all studies found the same phenomenon that adolescents tended to
replace their milk intake with sugary beverages.
The results showed that the most popular beverage consumed everyday at school
was plain water, followed by soft drink, fruit juice, and milk. The attitude of school staff
towards healthy beverage environment (Henry, 2004), availability of beverage choices
(Neumark-Sztainer, Wall, Perry, & Story, 2003), and promotion of beverages at school
(Neumark-Stainer, Story, Perry, & Casey, 1999) help to shape adolescents’ beverage
intake. Schools therefore play a critical part of the social environment that shapes young
persons' eating and beverage consumption behaviors and can therefore play a large role
in helping improve their diet.
5.2.2. Students’ knowledge and attitude at the baseline
The results indicated that students in grade 9 had some nutrition knowledge
before the intervention. Students in Saskatchewan high schools (Grade 7-12) may
receive a unit of healthy eating lessons (Grade 7) and promoting a healthy school food
policy unit (Grade 9) which are optional topics in Health Education curriculum
(Saskatchewan Education, 1998). Food Study class may be another nutrition information
source for students in Grade 10-12 (Saskatchewan Learning, 2005).
Females’ nutrition score in Prince Albert classes (classes C and D) was
significantly higher than those in Saskatoon classes (classes A and B), but this
phenomenon was not found in male students’ nutrition score (Table 4.5). There was no
difference of nutrition score between genders in two Saskatoon classes, but girls’
nutrition score in two Prince Albert classes were higher than boys’. Beech, Rice, Myers,
Johnson, and Nicklas (1999) found that in New Orleans grade 9 students, females’
nutrition scores were higher than boys’. Although students in classes C and D had
slightly higher nutrition scores, they had significantly lower attitude scores.
99
Although, more than 70% of students declared that the taste of milk is acceptable
for them, 60% of them would choose soft drinks over milk. It is very likely that this
choice was made because of the convenience and ubiquity of the products or peer
pressure (O’Dea, 2003; Messina, Saba, Vollono, Leclercq, & Piccinelli, 2004). Students
might also consider that soft drinks were more appealing than milk (Croll, Neumark-
Sztainer, & Story, 2001). Furthermore, adolescents’ social environment might indicate
that typical adolescents always drink soft drinks, and students would follow it as a new
pattern (Monge-Rojas, Nuñez, Garita, & Chen-Mok, 2002). Hawaiian adolescents
(Novotny, 2003) said that milk should be consumed with certain foods, such as cereal.
Most adolescents associated their friends with unhealthy food and soft drink
consumption (Auld et al., 2002; Cullen et al., 1998), but their milk intake would be
higher whenever their friends offered support for them to drink milk (Lee & Reicks,
2003). On the other hand, family, relatives, and older people are related with healthy
eating (Croll et al., 2001).
Furthermore, Lien, Jacobs Jr., and Klepp (2002) suggested that soft drinks may
have a symbolic function for adolescents. Most participants in the FUEL study reported
that they were aware of ways to include milk in daily diet. Conversely, healthy eating is
time consuming and difficult to be incorporated into daily eating for adolescents in
Minnesota, Northern Ireland, and England (Croll et al., 2001; McKinley et al., 2005).
Overall, students in the FUEL study had a positive attitude and knowledge toward
healthy beverages, although they indicated a preference for soft drinks. Similar findings
were reported in studies of New Zealand and Minnesota adolescents (Wham & Worsley,
2003; Neumark-Stainer et al., 1999); and in United Kingdom’s adolescents (Seaman,
Bower, & Fleming, 1997).
O’Dea (2003); Kassem, Lee, Modeste, and Johnston (2003) note that although
students reported having knowledge about the healthy beverages, they may continue to
consume unhealthy because of the thought that beverages are fun, interesting, able to
improve mood and strength because of their associated sugar rush, and ability to quench
thirst. Adolescents also expressed the need of more food and nutrition education to
improve their healthy eating (O’Dea, 2003). Observers such as Croll et al. ( 2001);
Wham & Worsley (2003); Neumark-Stainer et al. (1999); and Hsieh ( 2004) notes also

100
that adolescents may think that the impact to health of an unhealthy beverage intake
does not affect them immediately and can be reversed later on. More emphasize on
health effects of unhealthy beverages for adolescents is needed in nutrition education
materials.
The FUEL questionnaire did not contain specific questions about calcium intake.
Students were hesitant about the calcium content in milk and whether one glass of milk
would provide enough calcium in daily intake. This indicated that students did not
possess sufficient knowledge in making healthy beverage choices. The same condition
can be observed in Minnesota adolescents who came from low-income family (Lee &
Reicks, 2003) and Rhode Island/ Massachusetts teenagers (Harel, Riggs, Vaz, White,
Menzies, 1998).
5.3. Students’ beverage intake after the intervention
All classes made nutritionally favourable changes after the intervention
concluded. This phenomenon could be caused by the constructivist approach to teaching
which guided the development of the FUEL Resource package and the implementation
of the study. The FUEL packages contained recipe, games, experiments and handout
information. Students in the self taught groups showed much enthusiasm in trying out
the recipes. The material included in the packages allowed students to participate more
fully in the learning process, which is more likely to be successful (Lord et al., 2002).
The next section will compare and discuss the findings in class A (peer educator
class) and C (dietitian class) together because both classes applied multistrategy teaching
method. The discussion of classes B (Saskatoon self-taught class) and D (Prince Albert
self-taught class) will be combined. Following, the findings from multi and single
strategy teaching methods will be compared.
5.3.1. Peer educator and Dietitian-taught Approaches (Classes A and C)
The peer educator approach showed the most pronounced results in reducing
sugary beverages intake. These results supported the results from the TEENS (Lytle et
al., 2004) and TACOS study (Trying Alternative Cafeteria Options in Schools) study
(Hamdan, Story, French, Fulkerson, & Nelson, 2005). The incorporation of a peer
educator in classroom, parental components resulted in behavioural changes in the

101
TEENS study. The number of media campaign activities done by peers increased the
likelihood in affecting students’ eating behaviours in the TACOS study. Peer likeability
was identified as the strongest predictor in children’s eating behaviours by Oliver and
Thelen (1996) because they want to have as many friends as possible (Prokhorov et al,
1993). A negative influence of peers on one’s eating habits has also been identified by
Cullen et al, (2000); Monge-Rojas et al. (2002), and Oliver and Thelen (1996).
The significant improvement of beverage intake in class A (Peer educator class),
which was the decrease of sugary beverage intake, was mainly contributed by boys. The
behaviour changes reported by boys were also reported in the ATLAS (Adolescents
Training and Learning to Avoid Steroid) study (Goldberg et al., 1996). Students in the
ATLAS study maintained the nutrition knowledge and attitude until the long term
assessment. However the added parental component included in the ATLAS study may
have contributed to the sustained changes reported. The intervention was also carried out
on groups of athletes, who may have been more motivated to eat healthily.
The extent of contact among peer educators and other students determined the
strength of peer educators’ influence in changing students’ behaviours (Fulkerson et al.,
2004; Parker & Fox, 2001). In an adult study with a peer educator approach, the greater
duration and frequency of peer educator and subject gathering produced the greater
increase in fruit and vegetable intake (Buller et al., 2000). As the students were exposed
in more duration of the promotions, they consumed healthier foods more from the
cafeteria. The change was influenced by the duration of their involvement in the TACOS
(Trying Alternative Cafeteria Options in Schools) study (Hamdan, Story, French,
Fulkerson, & Nelson, 2005).
Although girls in class A did not make a strong contribution in the improvement
of beverage intake, their intake of sugary beverages went down slightly. The
insignificant change in girls’ intake could be caused by the lack of family’s support, as
Kassem et al. (2003) reported that girls identified the importance of family support in
changing their beverage intake. Conversely, girls in the study by Watt and Sheiham
(1996) were more often than their male peers to mention that friends’ encouragement
was important in changing their behaviours.

102
Girls’ reaction toward the FUEL study was not identical with boys’; however,
further study with a higher subject number is needed to confirm these findings.
Nonetheless, the same phenomenon was also noted by other studies that indicated
healthy beverage consumption meant differently for boys and girls. For boys, healthy
beverage consumption meant more energy, important for performance during sport
(Croll et al., 2001). On the other hand, female students consider that body image or
appearance is very important (Croll et al., 2001; Watt & Sheiham, 1996). The FUEL
manual stressed more on the calorie content of the beverages. This topic might influence
female students to decrease their sugary beverage intake. However, the manual did not
put a lot of attention on obesity. The manual uses a more positive approach to change
students’ beverage intake behaviour because nutrition education may unintentionally
create harmful effects whenever negative beliefs and attitudes are transferred to students
including poor body image, prejudices about body weight, and bias toward students, as
in prejudice toward overweight students (O’Dea & Maloney, 2000). A strong curriculum
is also needed to build self-efficacy of peer educators in delivering it (Lee & Murdock,
2001).
Larkey et al. (1999) noticed that the methods chosen by adult peer educators in
approaching their colleagues were differentiated by gender. In the FUEL study the same
approach of asking students to indicate their willingness to participate as peers was used.
Students, however, were selected in the early fall term as they were entering their new
grade nine class. However, cross-age peers and older peers provided support and
mentorship to the same age peers. The existence of older peers and their supports among
peer educators are important (Lee & Murdock, 2001). The presence of older peers in
nutrition education can produce a greater change than using a teacher taught approach
alone (Cohen, Felix, & Brownell, 1989). Although Cohen et al. (1989) suggested that
older peers can deliver the intervention alone and still produce changes, the presence of
cross-age peers and same-age peers in the FUEL study can prolong the exposure time of
the intervention on students. The cross-age peers were first year nutrition students and
the same-age peers were grade 9 students who volunteered. The cross-age peers might
represent the future of the students, and students could easily find their role models
among the cross-age peers (Lee & Murdock, 2001). Students also needed informal

103
support and role models from their own friends who could be the same-age peers
(Turner, 1999; Anliker et al., 1999).
In this FUEL study, peer educators functioned in supportive roles assisting the
dietitians or adult teacher during classroom sessions. This technique was also used in
other studies of adolescents (Fulkerson, French, Story, Nelson, and Hannan, 2004; Lytle
et al., 2004). In studies of longer duration (e.g. 9 months) peer educators are usually
given more responsibility such as assisting with the recruitment of subjects,
communicating the nutrition knowledge to their subjects, and administering pre- and
post-intervention surveys (Anliker et al., 1999; Buller et al., 1999).
Students in the FUEL study returned to their baseline behaviours at one year
follow-up. This phenomenon, also encountered in the TEENS study (Lytle et al., 2004),
could be caused by lack of environment support for students. Students need support
from parents and school to sustain their new healthier behaviour (Monge-Rojas et al.,
2002). Parents have an active role in children’s discovery of new foods which help their
children to be aware of dietary balance and diversity (Ottley, 2003). Support from
parents was identified as a positive influence towards healthy eating, and parents with a
higher education level were more likely to support their children by increasing the
availability of healthy foods at home, serving them during meals, and taking children’s
wishes of foods and beverages into account (Roos, Hirvonen, Mikkilä, Karvonen, &
Rimpelä, 2001; Ottley, 2003).
The TEENS study incorporated environmental and minimal parental components
besides peer educator component in their study, but students returned to their basic
condition at the follow-up assessment. The same challenge was also encountered by the
Peterborough Schools Nutrition project with environmental and peer educator
components (Parker & Fox, 2001). This occurrence indicated that adolescence is not a
stable age. Although teenagers may establish their eating behaviour during this time, the
behaviour is susceptible to be changed. The efforts to change adolescents’ behaviour
have to be done consistently until the alterations are accepted as one of their behaviours.
Hence, maintenance sessions are needed to remind students to keep their new behaviours
(Goldberg et al., 1996; Prokhorov, Perry, Kelder, & Klepp, 1993).
104
The negative correlations that were observed between the percentage of juice and
milk intakes at the pre-test were mainly caused by boys’ intake; however, at the post-test
and three-month follow up it was the girls’ intake which influenced this. The negative
correlation between the percentage of juice and milk intakes (measured only in class A)
disappeared at one year follow-up. The sample size was small so the effect could have
been due to insufficient power; however, the change could have been caused by the
FUEL study because the FUEL study classified fruit juice as a healthy drink and at the
same time, the emphasis was primarily on milk.
There was a negative correlation between percent contribution of milk and
sugary beverage intakes. The proportion of non-carbonated soft drink intake seemed to
be the major contributor in this. There appeared to be a gender effect with boys’ intake
being the major determinant. Nonetheless, in class A – the multiple strategies group
having peer involvement- the negative correlations between percentage of milk and
sugary beverage intakes, milk and juice intakes, and juice and sugary beverage intakes
appeared at all time points.
In class C (dietitian-taught class in Prince Albert high school), students
decreased their juice and sugary beverage intake after the intervention. However, the
Bonferroni correction on the alpha made the differences non-significant after the
multiple comparisons. The decrease of juice intake after the study was unexpected. The
same phenomenon happened in the New Moves intervention when 19% of the girls
regressed after the study (Neumark-Sztainer, Story, Hannan, Stat, & Rex, 2003). After
the FUEL intervention, students might be aware and more attentive to the food label of
the beverages they drank. At the pre-test they might not be able to differentiate whether
they drank 100% fruit juices or fruit drinks because one particular brand of beverages
may produce both fruit drinks and 100% fruit juices. Students usually can remember the
brand of drinks that they consumed (Acuff & Reiher, 1997).
The correlations among the percentages of girls’ intakes showed that the negative
correlation between sugary beverage and milk intakes decreased after the study.
However, the condition was back to the baseline at three months follow up. Although
the negative correlation between the percentage of CSD and milk intakes became
weaker in boys’ intake, the negative correlation between the percentage of NCD and
105
milk intakes appeared which can explain the unchanged negative correlation between
sugary beverage and milk intakes.
The students who were taught by a dietitian might have absorbed the nutrition
knowledge in class because the lessons were done in both didactic and interactive
teaching, as preferred by high school students (Lee et al., 2004). However, these
methods were not useful in changing students’ food choice in Anderson, Stanberry,
Blackwell, and Davidson’s study (2001). Moreover, Brazilian high school students did
not respond very well when they were taught by a nutritional expert, but their progress
was good whenever they were taught by someone whom they perceived to be similar to
them (Doyle & Feldman, 1994). Students in class C could have perceived the local
dietitian as being similar to them because they share one town and the age of the local
dietitian was relatively close to them.
The findings from the FUEL indicate a promising change in students’ beverage
intake. After six classroom sessions was taught by a local dietitian, students decreased
their sugary beverage intake. Several studies noted that the integration of a nutrition
education manual into school curriculum and trained teachers to deliver it could improve
students’ healthy behaviours after the teaching of the manual (Gortmaker et al., 1999;
Devine, Olson, & Frongillo, 1992).
The decrease of students’ sugary beverage intake in class C was not as
pronounced as the decrease of students’ sugary beverage in peer-educator class (class
A). In class C, the significant decrease disappeared after the bonferroni correction.
Furthermore, as shown in Table 4.20, the percentage of sugary beverages decreased after
the intervention in class A. These results indicated that the peer educator approach was
at least the same or more effective in changing students’ behaviour than seen in adult-led
approaches of other studies. After reviewing 13 studies using peer-led and adult-led
approach, Mellanby, Rees, and Tripp (2000) deduced the same conclusion. The results
from the FUEL study were not enough to prove the effectiveness of peer-led over adult-
led because students in both classes changed their beverage consumption significantly
after the intervention. The older-peers in class A held the same role as dietitian in class
B. The application of peer educators in class A might prolong the exposure time of
FUEL intervention on students. As discussed in Chapter 2, as the exposure time of a

106
nutrition education program increases, the likelihood of behaviour changes was also
increased. Furthermore, peer educators might give students more freedom in setting their
own goals in changing beverage consumption, whiled adult-led approach might be
perceived as giving them a high degree of activity control in the classroom like teachers
(Walin, Bremberg, Haglund, & Holm, 1993). Freedom in setting goals in healthy
beverage consumption is important for students because eating behaviours may be
considered as a rebellion tool (Story, 1999; McKinley et al., 2005).
5.3.2. Self-Taught Approach (Classes B and D)
The self-taught approach may be effective in adults who are not in a perfect
health condition, for example for obese adults (Miller, Eggert, Wallace, Lindeman, &
Jastremski, 1993). Nonetheless, students in class B increased their juice intake
significantly after one year study. Taken separately, girls and boys in this class did not
increase significantly their juice intake, but both genders increased their juice intake
over time. No change could be detected at the post-test and 3 month follow up. This may
indicate that students need to be more encouraged to change their behaviour positively,
and our one year follow up could be the third reminder for them (after the post-test and
three month follow up). In class D (self-taught class in Prince Albert high school),
students decreased their carbonated beverage intake significantly after the study, but
they went back to the baseline condition at three months follow-up. Mainly boys
contributed the significant decrease of carbonated beverage intake; however, girls also
decreased (not significantly) their carbonated beverage intake after the study.
It is not possible to state that a self-taught approach is more effective for a certain
gender (boys or girls) because different reactions from classes B and D were noted even
though both classes received the same approach. In class B, girls made a significant
decrease in sugary beverage intake, but in class D, boys significantly decreased their
sugary beverage intake. However, McKinley et al. (2005) reported that girls often obtain
nutrition information from magazines. Girls in this class decreased their sugary beverage
intake significantly. There is a possibility in the FUEL study that girls in classes B and D
read their hand-outs because in class B girls decreased their sugary beverage intake and
in class D girls increased their nutrition knowledge significantly. Unfortunately, girls in
both classes could not maintain these positive changes for a long time. The handouts can

107
be considered as magazine because they contained interesting nutrition facts with a lot of
pictures without long narrative. An additional study is needed to conclude the findings.
Boys in class B also made some positive changes (not significant) that
contributed to the significant change in juice intake while class B boys decreased
significantly their carbonated beverage intake. However, all changes in boys’ intake did
not reach the significance in class B and could not be maintained until three months
follow-up. The findings from the FUEL could not support the pattern that is shown by
other studies that stated girls have healthier eating behaviours than boys (Greene-
Finestone et al., 2005; Beech et al, 1999).
Nonetheless, the results show that both peer educator and dietitian-taught
approaches are more effective in changing grade 9 students’ beverage consumption than
the self-taught approach. The self-taught approach gave students more freedom in
setting their own goals in changing behaviours; however, students’ response toward this
approach was not definite. Students, in their adolescence, do not have the same
responsibility as adults. In a self-taught approach, responsibility is needed in reading the
handouts and applying the information in daily behaviours. Callaghan (2005) found that
healthy behaviours are positively related to initiative and responsibility. In class A and
C, students’ awareness might be triggered by the classroom sessions while in class B and
D, students had to take the initiative to read the handouts to become aware. Motives can
encourage the significant changes that happened in class C and D, such as responsibility,
fear of health consequences, respect towards teachers and researchers, and recognition of
themselves as unhealthy persons (Sigman-Grant, 2002).
5.3.3. Multi and Single Strategy Teaching Methods
Students in the multiple strategies classes (A and C) made more pronounced and
prolonged changes in their behaviour because they may have obtained more
concentrated encouragement from the deliverers. The delivery method in these classes
combined the use of visual, auditory, tactile, group, and individual teaching styles. These
results confirm the results of the Sovyanhadi and Cort (2004) study. Sovyanhadi and
Cort (2004) combined role-playing, video presentation, and visual display teaching
styles which were effective in the food pyramid session.

108
Each student may have a different style of learning that is influenced by several
dimensions such as 1) the type of information (sensory or intuitive), 2) through which
modality is sensory information most effectively perceived (visual or verbal), 3) the way
students process the information (actively or reflectively), and 4) the order in which they
receive it (sequentially or globally) (Felder, 1993). Kolb (1984) classified the basic
learning styles as diverging, assimilating, converging, and accommodating. The use of
multi-strategy teaching methods can increase the likelihood in reaching students with
diverse learning styles (Tanner & Allen, 2004). Teaching methods are more effective
whenever they match students’ learning styles (Ford & Chen, 2001). However, there is a
possibility that a teaching method that gratifies the need of both learners and teachers is
more important than the concordance of learning and teaching styles (McDonough &
Osterbrink, 2005).
Felder and Brent (2005) stated that students have not only different learning
styles but also different approaches to their study and their attitude about the knowledge.
A balanced teaching style is more important than the matching of teaching-learning
styles. A multi-approach teaching method may put a certain student in a discomfort
whenever a certain unmatched teaching approach is applied; nonetheless, this method
may also apply the students’ preference teaching styles, so the level of discomfort is not
too great to create an ineffective learning activity. On the other hand, the situation may
force students to grow in adaptation ability. Most of college students stated that the
implementation of a multi strategy teaching method, especially discussion, team work,
and the use of internet, helped them in learning (Smith et al., 2005). The single strategy
teaching method will probably work better for adults because adult learners are more
adaptable to different teaching styles (McDonough & Osterbrink, 2005).
5.5. Strength and Limitation
Having two phases to study (classes A and B, then C and D) was a strong point
for the FUEL study. The second phase study confirmed the results of the first phase of
the study. The participants came from the same socio-economy society and received the
FUEL manual in a multiple strategies teaching style. However, it should be noted that in
the second phased, comments from the students and peers were used to revise the
contents of the manual. Therefore the manual in the second phase of the study was

109
relatively different from the first phase of the study. Nonetheless, both classes showed
the same tendency after the intervention, which was a reduction of sugary beverage
intake.
The arrangement of the FUEL manual in a user-friendly mode was another
advantage in the intervention. The user-friendly FUEL manual provided all the handouts
needed to be distributed to students; furthermore, it also contained other trustworthy
reading resources. Students, especially in classes B and D, were attracted to reading the
handouts from the FUEL manual.
A limitation of the study was the use of the beverage frequency questionnaire as
the beverage intake assessment tool. Although the beverage frequency questionnaire was
developed to ask about most kinds of beverages usually consumed by adolescents, a
misclassification might have happened. For example, several fruit juice companies also
produce fruit drinks. Although the companies labeled the drinks, students might be
inattentive to their beverages and classified them as fruit juice when the beverages were
fruit drinks. Furthermore, the beverage frequency questionnaire was a self-administered
questionnaire which could lead students to under- or over-estimate their intake. The
presence of nutrition graduate students at the time when the incidence was administered
could be found intimidating to students, so they might fill the questionnaire as they were
expected.
The number of subjects in the FUEL study was also a limitation which lowers
the statistical power. The FUEL study has a small number of subjects because it was a
pilot project. Therefore, after conducting the study in class A and B, another
confirmation study was done in class C and D. The intervention in class C was slightly
different than in class A. Thus, more confirmation studies with more subjects and the
same intervention delivery as classes A and D are needed to reach a stronger conclusion
of the effectiveness of a peer educator approach and a dietitian-taught approach for
adolescents.

110
6. CONCLUSION
6.1. Conclusion
Schools are supposed to encourage students to practice healthy eating behaviour,
including healthy beverage intake. However, triggered by the need of fund raising, most
schools tend to sell students’ favourite beverages but low in nutrient content. The same
tendency was found in all schools in the FUEL study, which did not provide healthy
beverage choice for their students. On the other hand, vending machines that sold mostly
soft drinks were ubiquitous. The presence of unhealthy choices drove students to
consume unhealthy beverages, which was shown by the results of the baseline survey.
Students mainly consumed soft drinks and fruit juices at schools. Students in the FUEL
study still consumed a high amount of milk, but they also drank sugary beverages on a
daily basis. Therefore, they also demonstrated a tendency to replace healthy beverages,
such as milk and 100% fruit juices, with unhealthy beverages, soft drinks.
The baseline survey revealed that all students in the FUEL study possessed basic
nutrition knowledge about healthy beverages. Students also had positive attitudes toward
healthy beverages. Nevertheless, knowledge and positive attitudes toward healthy
beverages did not help students to develop healthy beverage consumption behaviours.
Students needed skills to apply their knowledge and attitudes into daily live.
Furthermore, encouragement and supports from school administration (through a healthy
eating environment), friends, and family are important to produce a change in
behaviours.
The FUEL study successfully implemented multiple and single teaching methods
in four classes of grade nine. The comparison of the effectiveness of these methods was
observed through the behaviour outcomes of the students, which was beverage
consumption behaviours. The findings indicated that the use of multiple teaching
strategies was more effective in changing students’ beverage consumption behaviours.
111
Furthermore, students in multiple teaching strategy classes were more likely to sustain
their new beverage intake behaviours longer than students in single teaching strategy
classes.
The multiple strategies used in the FUEL study were peer education and dietitian
taught. Students in both peer education and dietitian-taught classes improved their
beverage intakes. However, there is not enough evidence to conclude a peer education
approach was more effective than a dietitian-taught approach. There was also not
enough proof to deduce boys’ and girls’ reaction toward different methods. The single
teaching strategy in the FUEL study was a self-taught approach. Although students in
the classes with a self-taught approach altered their beverage intake positively, this
improvement was not sustainable until three months.
Overall, a school-based nutrition education program can be used effectively in
changing students’ beverage intake behaviours. The FUEL manual was effective in
improving students’ beverage consumption. Students also expressed their satisfaction
toward the FUEL program.
6.2. Implication for practice
A nutrition education program can successfully influence adolescents’ eating and
beverage consumption behaviours. This kind of program should be conducted in a
continuously time. All students’ in the FUEL schools had not received any nutrition
education for at least six months prior to the study. Students are most likely to improve
their behaviour after accepting a multiple teaching strategy. The incorporation of other
components, such as environment, peer, multimedia campaign, and family components,
will increase the likelihood of behaviour changing. A nutrition policy in a school is
needed to encourage these changes.
The FUEL manual provides a user-friendly six lesson manual that can be used by
educators with a minimal training. The manual also offers several books and dependable
website for additional reading. Educators can use the manual independently by any
multiple approaches (peer education and dietitian assistant).
The FUEL study established cooperation between high school and a local
dietitian. This cooperation can be useful whenever there is not enough time to train

112
teachers in nutrition lessons. Furthermore, the relationship with a local dietitian provided
an easier way for teachers to obtain trustworthy nutrition information. This kind of
collaboration can benefit everybody involved and should be nurtured by schools and
public health. Dietitians may also provided support to teachers at school to encourage
the integration of nutrition education into the class room curriculum.
Parents’ involvement in nutrition education effort at schools is important in order
to leverage the intervention to homes. However, parents often do not have time to be
occupied in a complicated intervention design. Perhaps a minimal but continuous
involvement of parents should be sufficient to increase parents’ awareness in their
children beverage intakes.
The results form the FUEL study indicated that students had unhealthy beverage
consumption, especially sugary beverages. These results can be a foundation to establish
a policy that would regulate schools’ nutrition environment and a compulsory nutrition
education in schools’ curriculum.
6.3. Further Research
Further research with a larger number of participants is needed to confirm the
FUEL study. A more scrutinized investigation of the effect of each approach on each
gender is essential. The FUEL program was studied in Caucasian middle class students.
A test of the FUEL for students who come from different socioeconomic and ethnicity
status is also required.
The roles of family and parents have been acknowledged in several papers.
Further research should also involve parents and family in the approach. The inclusion
of family into a nutrition education intervention can prolong the intervention to homes.
A more intense collaboration with schools to investigate the incorporation of
environmental component can be an opportunity for a further study.

113
7. REFERENCES
Acuff, D.F. and Reiher, R.H. (1997). What kids buy and why: the psychology of marketing to kids. New York: Free Press.
Agha, S. and Van Rossem, R. (2004) Impact of a School-based Peer Sexual Health Intervention on Normative Beliefs, Risk Perceptions, and Sexual Behavior of Zambian Adolescents. Journal of Adolescent Health, 34(5), 441-452.
Agron, P., Takada, E., and Purcell, A. (2002). California project LEAN’s Food On the Run program: an evaluation of a high school-based student advocacy nutrition and physical activity program. Supplement to Journal of American Dietetics Association, 103(3), S103-S105.
Alexy, U., Sichert-Hellert, W., and Kersting, M. (2002). Fortification masks nutrient dilution due to added sugars in the diet of children and adolescents. Journal of Nutrition, 132, 2785-2791.
Altieri, A., Vecchia, C.L., and Negri, E. (2003). Fluid intake and risk of bladder and other cancers. European Journal of Clinical Nutrition, 57(Suppl 2), S59–S68.
American Academic of Pediatric Committee on School Health. (2004). Soft Drinks in Schools. Pediatrics, 113(1), 1152-154.
Andersen, L.F., Bere, E., Kolbjornsen, and Klepp, K-I. (2004). Validity and reproducibility of self-reported intake of fruit and vegetable among 6th graders. European Journal of Clinical Nutrition, 58, 771-777.
Anderson, J.J.B. (2004). Nutrition and Bone Health in in L.K.Mahan and S. Escott-Stump (Eds), Krause’s food, nutrition, & diet therapy (pp.165-179). Philadelphia: Elsevier.
Anderson, T.P., Stanberry, A.M., Blackwell, A.P., and Davidson, C.W. (2001). The effectiveness of nutrition instruction on student nutrition knowledge and food choices. Journal of Family and Consumer Sciences Education, 19 (1), 31-37.
Anderzewski, D., Roach, J.A.G., Gay, M.L., and Musser, S.M. (2004). Analysis of coffee fort the presence of acrylamide by LC-MS/MS. Journal of Agriculture and Food Chemistry, 52, 1996-2002.

114
Anliker, J., Damron, D., Ballesteros, M., Feldman, R., Langenber, P., and Havas, S. (1999). Using peer educators in nutrition intervention research: Lesson learned from the Maryland WIC 5 A Day promotion program. Journal of Nutrition Education, 31, 347-354.
Anonymous. (1995). The Dairy Producers Regulations, 1995. Retrieved June 5, 2004 from http://www.dairyinfo.gc.ca/pdf_files/saskdairyproducersregulations.pdf.
Arnaud, M.J. (2003). Mild hydration, a risk factor for constipation? European Journal of Clinical Nutrition, 57(Suppl 2), S88–S95.
Ashurst, P.R. (1998). Introduction in P.R. Ashurst (Ed), Chemistry and Technology of Soft Drinks and Fruit Juices (pp.1-15). England: Sheffield Academic Press.
Atlas of Canada. (2001). Income measures: Methodological notes. Retrieved at April 29, 2005 from http://atlas.gc.ca/maptexts/map_texts/english/inc_meth_e.html.
Auld, G., Boushey, C.J., Bock, M.A., Bruhn, C., Gabel, K., Gustafon, D., Holmes, B., Misner, S., Novotny, R., Peck, L., Pelican, S., Pond-Smith, D., Read, M. (2002). Perspectives on intake of calcium-rich foods among Asian, Hispanic, and White preadolescent and adolescent female. Journal of Nutrition Education and Behaviour, 34, 242-251.
Bandini, L.G., Cyr, h., Must, A., and Dietz, W.H. (1997). Validity of reported energy intake in preadolescent girls. American Journal of Clinical Nutrition, 65 (Supply), 1138S-1141S.
Barthold, J., Pearson, J., Elisworth, A., Mason, C., Hohensee, T., McLaud, B., and Lewis, C. (1993). A cardiovascular health education program for rural schools. Journal of School Health, 63 (7), 298-301.
Bates, R.P., Morris, J.R., and Crandall, P.G. (2001). Principles and practices of small -and medium - scale fruit juice processing. Rome: Food and Agriculture Organization.
Bayne-Smith, M., Fardy, P.S., Azzollini, A., Magel, J., Schmitz, K.H., and Agin, D. (2004). Improvements in heart health behaviours and reduction in coronary artery disease risk factors in urban teenaged girls through a school-based intervention: The PATH program. American Journal of Public Health, 94(9), 1538-1543.
Beech, B.M., Rice, R., Myers, L., Johnson, C., Nicklas, T.A. (1999). Knowledge, attitudes, and practices related to fruit and vegetable consumption of high school students. Journal of Adolescent Health, 24, 244-250.
Berkey, C.S., Rockett, H.R., Field, A.E., Gillman, M.W., Colditz, G.A. (2004). Sugar-added beverages and adolescent weight change. Obesity Research, 12(5), 778-88.

115
Birch, L.L. and Fisher, J.O. (1998). Development of eating behaviors among children and adolescents. Pediatrics, 101(3 Pt 2), 539-49.
Birnbaum, A.S., Lytle, L.A., and Story, M. Peer leaders and adolescents participating in a multicomponent school based nutrition intervention had dietary improvement (treatment). (2003). Evidence-Based Nursing, 6(2), 44.
Birnbaum, A.S., Lytle, L.A., Story, M., Perry, C.L., and Murray, D.M. (2002). Are differences in exposure to a multicomponent school-based intervention associated with varying dietary outcomes in adolescents? Health Education and Behaviour, 29 (4), 427-443.
Black, A.E. (2001). Dietary assessment for sport dietetics. Nutrition Bulletin, 26, 29-42.
Blum, J.W., Jacobsen, D.J., and Donnelly, J.E. (2005). Beverage consumption patterns in elementary school aged children across a two year period. Journal of the American College of Nutrition, 24 (2), 93-98.
Botvin, G.J., Baker, E., Filazzola, A.D., and Botvin E. (1990). A cognitive behavioral approach to substance abuse prevention: One year follow-up. Addictive Behaviors, 15, 47-63.
Bowman, S.A. (2002). Beverage choice of young females: Changes and impact on nutrient intake. Journal of American Dietetics Association, 102, 1234-1239.
Boyle, M.A. (2003). Community Nutrition in Action: An Entrepreneurial Approach. U.S.A.: Wadsworth Pub Co.
Bratlett, D. and Smith, B.G.N. (2000). Definition, classification and clinical assessment of attrition, erosion and abrasion of enamel and dentine. In M. Addy, G. Embery, W.M. Edgar, and R. Orchardson (Eds), Tooth Wear and Sensitivity (pp.87-92). United Kingdom: Martin Dunitz, Ltd.
Bray, G.A., Nielsen, S.J., and Popkin, B.M. (2004). Consumption of high-fructose corn syrup in beverages may play a role in the epidemic of obesity. American Journal of Clinical Nutrition, 79, 537-43.
Brew, K. (2003). α-Lactalbumin. In P.F. Fox and P.L.H. McSweeney (Eds), Advanced dairy chemistry volume 1: Protein (pp. 319-363). New York: Plenum Publishers.
Brown, R. and Ogden, J. (2004). Children’s eating attitudes and behaviour: a study of the modeling and control theories of parental influence. Health Education Research, 19 (3), 261-271.

116
Buller, D.B., Buller, M.K., Larkey, L., Sennott-Miller, L., Taren, D., Aickin, M., Wentzel, T.M., and Morrill, C. (2000). Implementing a 5-a-day peer health educator program for public sector labor and trades employees. Health Education and Behaviour, 27, 232-240.
Buller, D.B., Morrill, C., Taren, D., Aickin, M., Sennott-Miller, L., Buller, M.K., Larkey, L., Alatorre, C., and Wentzel, T.M. (1999). Randomized trial testing the effect ofpeer education at increasing fruit and vegetable intake. Journal of the National Cancer Institute, 91 (17), 1491-1500.
Cabrera, C., Gimeä Nez, R., and Loä Pez, M. C. (2003). Determination of Tea Components with Antioxidant Activity. Journal of Agricultural and Food Chemistry, 51, 4427-4435.
Callaghan, D.M. (2005). The influence of spiritual growth on adolescents’ initiative and responsibility for self-care. Pediatric Nursing, 31 (2), 91-95, 115.
Canadian Food Inspection System implementation Group. (2002). National Dairy Regulation and Code (Production Sector Interpretive Guidelines). Retrieved June 5, 2004 from http://www.cfis.agr.ca/english/regcode/ndrc/int_gide_e.shtml.
Casal, S., Alves, M. R., Mendes, E., Oliveira, B. P. P., and Ferreira, M. A. (2003). Discrimination between Arabica and Robusta coffee species on the basis of their amino acid enantiomers. J. Agric. Food Chem. 2003, 51, 6495-6501.
Cavadini, C., Siega-Riz, A.M., and Popkin, B.M. (2000). US. Adolescents food intake trends from 1965 to 1996. Archives of Disease in Childhood, 83, 18-24.
Center for Disease Control and Prevention. (1996). Guidelines for school health programs to promote lifelong healthy eating. Morbidity and Mortality Weekly Report, 45 (RR-9): 1-33.
Center for Disease Control and Prevention. (2005). BMI - Body Mass Index: BMI for Children and Teens. Retrieved at July 19, 2005 from http://www.cdc.gov/nccdphp/dnpa/bmi/bmi-for-age.htm.
Center for Food and Justice, Urban and Environmental Policy Institute, Occidental College. (2002). Challenging the Soda Companies: The Los Angeles Unified School District Soda Ban.
Center for Science in the Public interest. (2004). Dispensing junk: How school vending undermines efforts to feed children well. Retrieved at May 30th, 2005 from http://cspinet.org/new/pdf/dispensing_junk.pdf.
Chiego, Jr., D.J. (2002) Histology of the Pulp in J.K. Avery (Ed), Oral Development and Histology (pp. 190-224). New York: Thieme Medical Publishers.

117
Clydesdale, F.M., Kolasa, K.M. and Ikeda, J.P. (1994). All you want to know about fruit juice. Nutrition Today, 29(2), 14-28.
Cohen, R.Y., Felix, M.R.J., Brownell, K.D. (1989). The role of parents and older peers in school-based cardiovascular prevention programs: Implications for program development. Health Education Quarterly, 16 (2), 245-253.
Cole, T.J. and Rolland-Cachera, M.F. (2002). Measurement and Definition. In W. Burniat, T.J. Cole, I. Lissau, and E.M.E. Poskitt (Ed), Child and Adolescent Obesity: Causes and Consequences, Prevention and Management (pp.1-2). USA: Cambridge University Press.
Consumer Union. (1995). Captive Kids: A report on commercial pressures on kids at school retrieved in June 2nd, 2004 from http://www.consumersunion.org/other/captivekids/pressures.htm.
Croll, J.K., Neumark, Sztainer, D., and Story, M. (2001). Healthy eating: What does it mean to adolescents? Journal of Nutrition Education, 33, 193-198.
Cullen, K.W., Baranowski, T., Baranowski, J., Warnecke, C., De Moor, C., Nwachokor, A., Hajek, R.A., and Jones, L.A. (1998). “5 A Day” achievement badge for urban boy scouts: Formative evaluation results. Journal of Cancer Education, 13, 162-168.
Cullen, K.W., Baranowski, T., Rittenberry, L., and Olvera, N. (2000). Social-environmental influences on children’s diet: Results from focus groups with African-, Euro-, and Mexican-American children and their parents. Health Education Research, 15 (5), 581- 590.
Dairy Council of California. (2003). Nutrition intervention establishes healthier food choices: A summary of food consumption among California’s adolescents. Retrieved October 4th, 2004 from www.dairycouncilofca.org/edu/edu_eyo_nie.htm.
Dauthy, M.E. (1995). Fruit and Vegetable Processing. Rome: Food and Agriculture Organization of the United Nations.
Dawson-Hughes, B. (2003). Role of calcium in reducing postmenopausal Bone Loss and in fracture prevention in S.A. New and J-P. Bounjour, Nutritional Aspects of Bone Health (pp.145-156). United Kingdom: The Royal Society of Chemistry.
Dennison, B.A., Rockwell, H.L., and Baker, S.L. (1997). Excess fruit juice consumption by preschool-aged children is associated with short stature and obesity. Pediatrics, 99(1):15-22.
Densupsoontorn, N., Jirapinyo, P., Tamonsiri, N., Wongarn, R., Phosuya, P., Tritiprat, A., Patraarat, S., Pidatcha, P., Suwannthol, L. (2002). Comparison of the nutrient content of fresh fruit juices vs commercial fruit juices. Journal of Medical Association of Thailand, 85(Supply 2), S732-S738.

118
Department of Health. (1988). The Food and Drugs Act (Division 12, Prepackaged Water and Ice). Retrieved June 5, 2004 from http://www.hc-sc.gc.ca/food-aliment/friia-raaii/food_drugs-aliments_drogues/act-loi/e_index.html.
Department of Health. (1990). The Food and Drugs Act (Division 5, Coffee). Retrieved June 5, 2004 from http://www.hc-sc.gc.ca/food-aliment/friia-raaii/food_drugs-aliments_drogues/act-loi/e_index.html.
Department of Health. (1991). The Food and Drugs Act (Division 20, Tea). Retrieved June 5, 2004 from http://www.hc-sc.gc.ca/food-aliment/friia-raaii/food_drugs-aliments_drogues/act-loi/pdf/e_d-text-2.pdf.
Department of Health. (1993). The Food and Drugs Act (Division 2, Alcoholic Beverages). Retrieved June 5, 2004 from http://www.hc-sc.gc.ca/food-aliment/friia-raaii/food_drugs-aliments_drogues/act-loi/e_index.html.
Department of Health. (1995). The Food and Drugs Act (Division 8, Dairy Products). Retrieved June 5, 2004 from http://www.hc-sc.gc.ca/food-aliment/friia-raaii/food_drugs-aliments_drogues/act-loi/e_index.html.
Department of Health. (1997). The Food and Drugs Act (Division 11, Fruits, Vegetables, their Products and Substitutes). Retrieved June 5, 2004 from http://www.hc-sc.gc.ca/food-aliment/friia-raaii/food_drugs-aliments_drogues/act-loi/e_index.html.
Devine, C.M., Olson, C.M., and Frongillo, Jr., E.A. (1992). Impact of the Nutrition For Life program in junior high students in New York State. Journal of School Health, 62(8), 381-385).
Dinçer, B., Hazar, S., and Sen, B.H. (2002). Scanning electron microscope study of the effects of soft drinks on etched and sealed enamel. American Journal of Orthod Dentofacial Orthop, 122, 135-141.
Doyle, E.I. and Feldman, R.H.L. (1994). Are local teachers or nutrition expert perceived as more effective among Brazilian high school students? Journal of School Health, 64 (3), 115-118.
Evers, S., Taylor, J., Manske, S., and Midgett, C. Eating and smoking behaviours of school children in Southwestern Ontario and Charlottetown, PEI. Canadian Journal of Public Health, 92 (6), 433-436.
Felder, R. (1993). Reaching the second tier: Learning and teaching styles in College Science Education. J. College Science Teaching, 23(5), 286-290.
Felder, R.M. and Brent, R. (2005). Understanding Student Differences. J. Engr. Education, 94(1), 57-72.

119
Ferrara, L., Montesano, D., Senatore, A. (2001). The distribution of minerals and flavonoids in the tea plant (Camellia sinensis). Farmaco, 56, 397-401.
Field, A.E., Gillman, M.W., Rosner, B., Rockett, H.R., and Colditz, G.A. (2003). Association between fruit and vegetable intake and change in body mass index among a large sample of children and adolescents in the United States. International Journal of Obesity, 27, 821-826.
Fiordalisi, I. and Finberg, L. (2003). Diarrhea and Dehydration. In R.M. Perkin, J.D. Swift, and D.A. Newton (Eds), Pediatric Hospital Medicine (pp.191-198). Philadelphia: Lippincott Williams & Wilkins.
Fischer, J.O., Mitchell, D.C., Smiciklas-Wright, H., Mannino, M.L., and Birch, L.L. (2004). Meeting calcium recommendations during middle childhood reflects mother-daughter beverage choices and predicts bone mineral status. American journal of Clinical Nutrition, 79, 698-706.
Fischer, M., Reimann, S., Trovato, V., and Redgwell, R. J. (2001). Polysaccharides of green Arabica and Robusta coffee beans. Carbohydrate Research, 330, 93–101.
Fisher, J.O. and Birch, L.L. (1999). Restricting access to palatable foods affects children’s behavioural response food selection, ad intake. American Journal of Clinical Nutrition, 69, 1264-1272.
Forcella, S., Mata, A., Mesquita, M.F., and Spoto, G. (2002). Teeth in C. Scully, Oxford Handbook of Applied Dental Sciences (pp.341-348). New York: Oxford University Press.
Ford, N. and Chen, S. (2001). Matching/mismatching revisited: an empirical study of learning and teaching styles. British Journal of Education Technology, 32, 5-22
Forshee, R.A., Storey M.L.. (2001). The Association of Demographics and Beverage Consumption with Dental Caries. Presented to the American College of Nutrition 42nd Annual Meeting, October 3-7, Orlando, Florida.
Forshee, R.A. and Storey, M. L. (2003). Total beverage consumption and beverage choices among children and adolescents. International Journal of Food Science and Nutrition, 54 (4), 297-307.
Fox, P.F. (2003). Milk proteins: general and historical aspects in P.F. Fox and P.L.H. McSweeney (Ed), Advanced Dairy Chemistry-1: Proteins. New York: Kluwer Academic.
Frary, C.D., Johnson, R.K., and Min, Q.W. (2004). Children and Adolescents Choices of Foods and Beverages high in Added Sugars are associated with intakes of key nutrients and food groups. Journal of Adolescent Health, 34, 56-63.

120
Frary, C.D., Johnson, R.K., and Wang, M.Q. (2005). Food sources and intakes of caffeine in the diets of persons in the United States. Journal of the American Dietetic Association, 105, 110-113.
French, S.A., Lin, B-H., and Guthrie, J.F. (2003). National trends in soft drink consumption among children and adolescents age 6 to 17 years: prevalence, amounts, and sources, 1977/1978 to 1994/1998. Journal of American Dietetics Association, 102, 1326-1331.
French, S.A., Fulkerson, J.A., and Gerlach, A.F. (2003). Food environment in secondary schools: À la carte, vending machines, and food policies and practices. American journal of Public Health, 92, 1161-1167.
French, S.A., Story, M., Fulkerson, J.A. (2002). School food policies and practices: A state-wide survey of secondary school principals. Journal of the American Dietetic Association, 102, 1785-1789.
Fulkerson, J.A., French, S., Story, M., Nelson, H., and Hannan, P.J. (2004). Promotions to increase lower-fat food choices among students in secondary schools: Description and outcomes of TACOS (Trying Alternative Cafeteria Options in Schools). Public Health Nutrition, 7 (5), 665-674.
Giammattei, J., Blix, G., Marshak, H.H., Wollitzer, A.O., and Pettitt, D.J. (2003). Television watching and soft drink consumption. Archives of Pediatrics and Adolescents Medicine, 157, 882-886.
Gidding, S. S., Nehgme, R., Heise, C., Muscar, C., Linton, A., and Hassink, S. (2004). Severe obesity associated with cardiovascular deconditioning, high prevalence of cardiovascular risk factors, diabetes mellitus/hyperinsulinemia, and respiratory compromise. Journal of Pediatrics, 144, 766-769.
Gillis, L.J., Kennedy, L.C., Gillis, A.M. and Bar-Or, O. (2002), Relationship between juvenile obesity, dietary energy and fat intake and physical activity. International Journal of Obesity, 26, 548-463.
Gilsanz, V. (1999). Accumulation of Bone mass during childhood and adolescence. InE.S. Orwoll, Osteoporosis in Men, The effects of gender on skeletal health (pp.65-80). San Diego, California: Academic Press.
Goldberg, L. and Elliot, D. (1993). ATLAS (Athletes Training and learning to Avoid Steroids) retrieved at June 29, 2004 from www.samha.gov.
Goldberg, L., Elliott, D., Clarke, G., MacKinnon, D., Moe, E., Xoref, L., Green, C., Wolf, S.L., Greffrath, E., Miller, D.J., and Lapin A. (1996). Effects of a multidimensional anabolic steroid prevention intervention: The Adolescents Training and Learning to Avoid Steroids (ATLAS) Program. Journal of the American Medical Association, 276 (19): 1555-1562.
121
Gortmaker, S.L., Peterson, K., Wiecha, J., Sobol, A.M., Dixit, S., Fox, M.K., Laird, N. (1999). Reducing obesity via a school-based interdisciplinary intervention among youth, Planet Health. Archives of Pediatrics and Adolescent Medicines, 153, 409-418.
Goulding, A., Rockell, J.E.P, Black, R.E., Grant, A.M., Jones, I.E., Williams, S.W. (2004). Children who avoid drinking cow’s milk is increased risk for Prepubertal Bone Fracture. Journal of American Dietetics Association, 104, 250-253.
Greene-Finestone, L.S., Campbell, M.K., Gutmanis, I.A., and Evers, S.E. (2005). Dietary intake among young adolescents in Ontario: Associatoins with vegetarian status and attitude toward health. Preventive Medicine, 40, 105-111.
Grimm, G.C., Harnack, L., Story, M. (2004). Factors associated with soft drink consumption in school-aged children. J Am Diet Assoc., 104(8):1244-1249.
Grivetti, L.E. and Wilson, T. (2004). A brief history of human beverage consumption, Prehistory to the present in T. Wilson and N.J. Temple (Eds), Beverages in Nutrition and Health (pp.3-18). New Jersey: Humana Press, Inc.
Gross, S.M and Cinelli, B. (2004) Coordinated school health program and dietetics professionals: partners in promoting healthful eating. J Am Diet Assoc, 104(5):793-8.
Grunbaum, J.A., Kann, L., Kinchen, S.A., Williams, B., Ross, J.G., Lowry, R., and Kolbe, L. (2002). Youth risk behaviour surveillance-United States, 2001. The Journal of School Health, 72 (8), 313-328.
Guerrero-Romero, F., Rodriguez-Moran, M., and Reyes, E. (1999). Consumption of soft drinks with phosphoric acid as a risk factor for the development of hypocalcemia on postmenopausal women. Journal of Clinical Epidemiolog, 52(10), 1007-1010.
Hamdan, S., Story, M., French, S., Fulkerson, J.A., Nelson, H. (2005). Perceptions of adolescents involved in promoting lower-fat foods in schools: Associations with level of involvement. Journal of the American Dietetic Association, 105: 247-251.
Hampl, J.S., Taylor, C.A., and Johnston, C.S. (1999). Intakes of vitamin C, vegetables and fruits: Which schoolchildren are at risk? Journal of the American College of Nutrition, 18 (6), 582-590.
Han, D.S. and Cho, B.S. (2002) Therapeutic approach to hyponatremia. Nephron, 92 (suppl 1), 9-13.
Hanson, N.I., Neumark-Sztainer, D., Eisenberg, M.E., Story, M., and Wall, M. (2005). Associations between parental report of the home food environment and adolescent intakes of fruits, vegetables, and dairy foods. Public health Nutrition, 8 (1), 77-85.

122
Hardy, L. (1999). The Lure of School Marketing. American School Board Journal October 1999 retrieved in June 2nd, 2004 from http://www.asbj.com/199910/1099coverstory.html.
Harel, Z., Riggs, S., Vaz, R., White, L., Menzies, G. (1998). Adolescents and calcium: What do they do and do not know and how much they consume. Journal of Adolescent Health, 22, 225-228.
Harnack, L., Snyder, P., Story, M., Holliday, R., Lytle, L., Neumark-Sztainer, D. (2000). Availability of a la carte food items in junior and senior high schools: A need assessment. Journal of the American Dietetic Association, 100 (6), 701-703.
He, K., Kramer, E., Houser, R. F., Chomitz, V. R., and Hacker, K.A. (2004). Defining and understanding healthy lifestyles choices for adolescents. Journal of Adolescent Health, 35, 26-33.
Heaney, R. P., and Rafferty, K. (2001). Carbonated beverages and urinary calcium excretion. American Journal Clinical Nutrition, 74, 343-347.
Heller, K.E., Burt, B.A., and Eklund, S.A. (2001). Sugared soda consumption and dental caries in the United States. Journal of Dental Research, 80(10),1949-1953.
Henry, C. (2004). Beverage provision and consumption in elementary schools: Exploring the policies and practices of beverage consumption in elementary schools. Broch Journal of Education. Accepted.
Hering-Hanit, R. and Gadoth, N. (2003). Caffeine-induced headache in children and adolescents. Chepalalgia, 23 (5), 332-335.
Hern, M.J. and Gates, D. (1998). Linking learning with health behaviors of high school adolescents. Pediatrics Nursing, 24(2): 127-132.
Hill, J.O., Kriketos, A.D., and Peters, J.C. (2000). Disturbance of Energy Balance in M.H. Stipanuk, Biochemical and Physiological Aspects of Human Nutrition.Pennsylvania: W.B. Saunders Company.
Himes, J.H., Kim, R., Gittelsohn, J., Cunningham-Sabo, L., Weber, J., Thompson, J., Harnack, L., and Suchindran, C. (2003). Impact of the Pathways intervention on dietary intakes of American Indian schoolchildren. Preventive Medicine, 37, S55-S61.
Hoelscher, D.M., Evans, A., Parcel, G.S., Kelder, S.H. (2002). Designing effective nutrition interventions for adolescents. Supplement to the Journal of American Dietetic Association, 102(3): S52-S63.
Hofer, B.K. (1999). The role of school in United States adolescents’ lives. The Educational Systems in United States: The Case Study Findings, available at http://www.ed.gov/pubs/USCaseStudy/chapter4a.html.

123
Hsieh, P-L. (2004). Factors influencing students’ decision to choose healthy or unhealthy snacks at the University of Newcastle, Australia. Journal of Nursing Research, 12 (2), 83-90.
Institute of Medicine. (2002). Dietary Reference Intakes for energy, carbohydrate, fiber, fat, fatty acids, cholesterol, protein, and amino acids. Washington, D.C.: The National Academic Press.
Institute of Medicine. (2004). Dietary References Intakes for Water, Potassium, Sodium, Chloride, and Sulfate. USA, The National Academy of Sciences, available in http://www.nap.cdu/openbook/0309091691./html/67.html.
The International Bottled Water Association. (2004). Regulation of bottled water: An Overview. Retrieved at May 20, 2004 from http://www.bottledwater.org/public/publicsearch_main.htm.
Iuliano-Burns, S, Naughton, G., Gibbons, K., Bass, S.L., and Saxon, L. (2003). Regional Specificity of exercise and calcium during skeletal growth in girls: a randomized control trial. Journal of Bone and Mineral Research; 18:156-162.
Iuliano-Burns, S., Whiting, S.J., Faulkner, R.A., and Bailey, D.A. (1999). Levels, sources, and seasonality of dietary calcium intake in children and adolescents enrolled in the University of Saskatchewan Pediatric Bone Mineral Accrual Study. Nutrition Research, 19 (10), 1471-1483.
Jago, C. (1998). Teens will listen to peers before parents. Education: A teacher finds that kids will heed the rules they themselves set. Los Angeles Times. Retrieved at June 20, 2004 from http://home.att.net/~xchar/tna/.
James, J., Thomas, P., Cavan, D., and Kerr, D. (2004). Preventing childhood obesity by reducing consumption of carbonated drinks: cluster randomized controlled trial. British Medical Journal, 328 (7450), 1237-1241.
Jensdottir, T., Arnadottir, I.B., Thorsdottir, I., Bardow, A., Gudmundsson, K., Theodors, A., and Holbrook, W.P. (2004). Relationship between dental erosion, soft drink consumption, and gastroesophageal reflux among Icelanders. Clinical Oral Investigation, 8(2), 91-96.
Johnson, R.K., and Hankin, J.H. (2003). Dietary assessment and validation. In E.R. Monsen (Ed), Research: Successful Approaches. USA: American Dietetic Association (pp. 227-242).
Jorge, K. (2003). Soft Drinks in B. Caballero, L.Trugo, P. Finglas (Eds), Encyclopedia of Food Sciences and Nutrition (pp.5346-5352). United States: Academic Press.

124
Kanis, J.A., Johnell, O., Oden, A., Dawson, A., De Laet, C., and Jonsson, B. (2001). Ten year probabilities of osteoporotic fractures according to BMD and diagnostic thresholds. Osteoporosis International, 12(12), 989-995.
Kaptoge, S., Dalzell, N., Loveridge, N., Beck, T.J., Khaw, K.T., Reeve, J. (2003) Effects of gender, anthropometric variables, and aging on the evolution of hip strength in men and women aged over 65. Bone, 32(5):561-70.
Kassem, N.O., Lee, J.W., Modeste, N.N., and Johnston, P.K. (2003). Understanding soft drink consumption among female adolescents using the Theory of Planned Behaviour. Health Education Research, 18 (3), 278-291.
Khani, R.K., Ye, W, Terry, P., and Wolk, A. (2004). Reproducibility and validity of major dietary patterns among Swedish women assessed with a Food-Frequency Questionnaire. Journal of Nutrition, 134, 1541-1545.
Kidd, E. A. M. and Nyvad, B. (2003). Caries control for the individual patient. In O. Fejerskov and E.A.M. Kidd, Dental caries: the disease and its clinical management. Malden, MA: Blackwell.
Killen, J.D., Taylor, C.B., Hammer, L.D., Litt, I., Wilson, D.M., Rich, T., Hayward, C., Simmonds, B., Kraemer, H., Varady, A. (1993). An attempt to modify unhealthful eating attitudes and weight regulation practices of young adolescent girls. International Journal of Eating Disorders, 13(4), 369-384.
Kleiner, S.M. (1999). Water, an essential but overlooked nutrient. Journal of the American Dietetic Association, 99(2), 200-206.
Knochel, J.P. (2003). Phosphorus Retrieved in Dec 7th, 2003 from http://lpi.oregonstate.edu/infocenter/minerals/phosphorus/
Kolb, D.A. (1984). Experiential learning : experience as the source of learning and development. Englewood Cliffs, N.J. : Prentice-Hall
Kramer-Atwood, J.L., Dwyer, J., Hoelscher, D.M., Nicklas, T.A., Johnson, R.K., and Schulz, G. (2002). Fostering healthy food consumption in schools: Focusing on the challenges of competitive foods. Journal of the American Dietetic Association, 102 (9), 1228-1232.
Kruse, J.A. (2003). Hyponatremia. In J.A. Kruse, M.P. Fink, and R.W.Carlson (Eds), Saunders Manual of Critical Care (pp.119-123). United States of America: Elsevier.
Kubik, M.Y., Lytle, L.A., Story, M. (2005). Soft drinks, candy, and fast food: What parents and teachers think about the middle food environment. Journal of the American Dietetic Association, 105, 233-239.

125
Kumanyika, S.K., Tell, G.S., Shemanski, L. Martel, J., and Chincili, V. (1997). Dietary assessment using a picture-sort approach. American Journal of Clinical Nutrition, 65 (Supply), 11123S-1129S.
Laquatra, I. (2004). Nutrition for weight management in L.K.Mahan and S. Escott-Stump (Eds), Krause’s food, nutrition, & diet therapy (pp.558-593). Philadelphia: Elsevier.
Larkey, L.K., Alatorre, C., Buller, D.B., Morril, C., Buller, M.K., Taren, D., and Sennott-Miller, L. (1999). Communication strategies for dietary change in a worksite peer educator intervention. Health Education Research, 14 (6), 777-790.
Larsen, M.J. and Nyvad, B. (1999). Enamel erosion by some soft drinks and orange juice relative to their pH, buffering effect and contents of calcium phosphate. Caries Research, 33, 81-87.
Larsen, M.J. and Richards, A. (2002). Fluoride is unable to reduce dental erosion from soft drinks. Caries Research, 36, 75-80.
Lee, A., Siu, D.C.H, Au, S.K.L., Chen, R.C.I., Cheng, K.W., Yau, F.T., Tong, L.C.T., Chan, S.Y., Tsang, W.W., Ho, M. (2004). What are the needs of students? An experience from a district based health promoting schools project in Hong Kong. Asia-Pacific Journal of Public Health, 16 (Supply), S17-S21.
Lee, F.C.H. and Murdock, S. (2001). Teenagers as teachers programs: Ten essential elements. Journal of Extension, 39 (1). Retrieved at October 22, 2004 from http://joe.org/joe/2001february/rb1.html.
Lee, H.H.C., Gerrior, S. A., and Smith, J. A. (1998). Energy, macronutrient, and food intakes in relation to energy compensation in consumers who drink different types of milk. American Journal of Clinical Nutrition, 67, 616-623.
Lee, R.D. and Nieman, D.C. (2003). Nutritional Assessment. New York: The McGraw-Hill Companies, Inc.
Lee, S. and Reicks, M. (2003). Environmental and behavioral factors are associated with the calcium intake of low-income adolescent girls. Journal of the American Dietetic Association, 103, 1526-1529.
Leger, L.St. (2001). Schools, health literacy and public health: Possibilities and challenges. Health Promotion International, 16 (2), 197-205.
Lien, N., Jcobs Jr., D.R., and Klepp, K-I. (2002). Exploring predictors of eating behaviour among adolescents by gender and socio-economic status. Public Health Nutrition, 5 (5), 671-681.

126
Little, J.C., Perry, D.R., Volpe, S.L. (2002). Effect of nutrition supplement education on nutrition supplement knowledge among high school students from a low-income community. Journal of Community Health, 27(6), 433-450.
London International Coffee Organization. (2004). About Coffee. Retreived August 7, 2004 from http://www.ico.org/frameset/coffset.htm.
Long, J.A. and Stevens, K.R. (2004). Using technology to promote self-efficacy for healthy eating in adolescents. Journal of Nursing Scholarship, 36 (2), 134-139.
Lord, T., Travs, H., Magill, B., and King, L. (2002). Comparing Student-centered and teacher-centered instruction in College Biology Labs. Proceedings: Pathways to change: An international conference on transforming Math and Science education in the K16 continuum. Arlington, VA.
Lorenz, J.M and Kleinman, L.I. (2003). Physiology and Pathophysiology of Body Water and Electrolytes. In L.A. Kaplan, A.J. Pesce, and S.C. Kazmierczak (Eds), Clinical chemistry : theory, analysis, correlation (pp.452-453). Missouri: Mosby, Inc.
Ludwig, D.S., Peterson, K.E. and Gortmaker, S.L. (2001). Relation between consumption of sugar-sweetened drinks and childhood obesity: a prospective, observational analysis. Lancet, 357, 505-508.
Lytle, J.C., Perry, D.R., and Volpe, S.L. (2002). Effect of nutrition supplement education on nutrition supplement knowledge among high school students from a low-income community. Journal of Community Health, 27 (6), 433-451.
Lytle, L.A. (2002). Nutritional issues for adolescents. Journal of the American Dietetics Association, 102(3), S8-S12.
Lytle, L.A., Murray, D.M., Perry, C.L., Story, M., Birnbaum, A.S., Kubik, M.Y., Varnell, S. (2004). School-based approaches to affect adolescents’ diet: Results from the TEENS study. Health Education and Behaviour, 31 (2), 270-287.
Lytle, L.A., Seifert, S., Greenstein, J., and McGovern, P. (2000). How do children’s eating pattern and food choices change over time? Results from a cohort study. American journal of Health Promotion, 14(4), 222-228.
Marangella, M., Di Stefano, M., Casalis, S., Berutti, S., D’Amelio, P., Isaia, G. C. (2004). Effects of potassium citrate supplementation on bone metabolism. Calcif Tissue Int, 74, 330–335.
Marshall, T.A., Levy, S.M., Broffitt, B., Warren, J.J., Eichenberger-Gilmore, J.M., Burns, T.D., and Stumbo, P.J. (2003). Dental caries and beverage consumption in young children. Pediatrics, 112 (3 Pt 1), e184-e191.

127
Marshall, T.A., Gilmore, J.M.E., Broffitt, B., Stumbo, P.J., and Levy, S.M. (2005). Diet quality in young children is influenced by beverage consumption. Journal of the American College of Nutrition, 24 (1), 65–75.
Massey, L.K. and Strang, M.M. (1982). Soft drink consumption, phosphorus intake, and osteoporosis. Journal of American Dietetic Association, 80, 581-583.
Massey-Stokey, M. (2002). Adolescent nutrition: Needs and recommendation for practice. The Clearing House, 75(6), 286-291.
Matkovic, V., Crncevic-Orlic, Z., and Landoll, J.D. (2003). Role of calcium in Maximizing peak bone mass development in S.A. New and J.P. Bounjour, Nutritional Aspects of Bone Health (pp.129-144). United Kingdom: The Royal Society of Chemistry.
Matthews, R. and Al-Bayaty, H. (2002). Teeth. In C. Scully (Ed), Oxford Handbook of Applied Dental Sciences (pp.85-108). New York: Oxford University Press.
Maughan, R.J. (2003). Impact of mild dehydration on wellness and on exercise performance. European Journal of Clinical Nutrition, 57(Suppl 2), S19-S23.
May, J. and Waterhouse, P.J. (2003). Dental erosion and soft drinks: A qualitative assessment of knowledge, attitude and behavior using focus groups of schoolchildren. A preliminary study. International Journal of Pediatric Dentistry, 13(6), 425-433.
Mazariegos-Ramos, E., Guerrero-Romero, F., Rodríguez-Morán, M., Lazcano-Burciaga,, G., Paniagua, R., and Amato, D. (1995). Consumption of soft drinks with phosphoric acid as a risk factor for the development of hypocalcemia in children: A case-control study. Journal of Pediatric, 126, 940-942.
McBean, L.D., Miller, G.D., and Heaney, R.P. (2004). Effect of cow’s milk on human health in T. Wilson and N.J. Temple (Eds), Beverages in Nutrition and Health (pp.3-18). New Jersey: Humana Press, Inc.
McDonald, J., and Grove, J. (2001). Youth for yout: Piercing together the peer education jigsaw. Second International Conference on Drugs and Young People: Exploring the Bigger Picture Proceedings. Available at http://www.peer.ca/mcdonald.pdf.
McDonald, R. E., Avery, D. R., and Stookey, G. K. (2000). Dental Caries in the Child and Adolescent. In R.E. McDonald and D. R. Avery (Eds), Dentistry for the Childe and Adolescent (pp. 209-246). St. Louis: Mosby.
McDonald’s Quality and Nutrition Information. (2004). McDonald’s USA Nutrition Facts for Popular Menu Items. Retrieved May 30, 2004 from: www.mcdonalds.com/app_controller.nutriiton.categories.nutrition.indexhtml.

128
McDonough, J.P. and Osterbrink, J. (2005). Learning styles: An issue in clinical education? AANA Journal, 73 (2), 89-93
McGartland, C., Robson, P.J., Cran, G., Savage, M.J., Watkins, D., Rooney, M., and Boreham, C. (2003). Carbonated soft drink consumption and bone mineral density in adolescence: The Northern Ireland Young Hearts Project. Journal of Bone and Mineral Research, 18(9), 1563-1569.
McGrane, M.M. (2000). Carbohydrate Metabolism-Synthesis and Oxidation. In M.H. Stipanuk (Ed), Biochemical and Physiological Aspects of Human Nutrition (pp. 158-205). Pennsylvania: W.B. Saunders Company.
McKinley, M.C., Lowis, C., Robson, P.J., Wallace, J.M.W., Morrissey, M., Moran, A., and Livingstone, M.B.E. (2005). It’s good to talk: Children views on food and nutrition. European Journal of Clinical Nutrition, 59 542-551.
McKinley, M.J. and Johnson, A.K. (2004). The physiological regulation of thirst and fluid intake. News in Physiological Science, 19, 1-6.
McManis, D. and Sorensen, D. (2000). The role of comprehensive school health education programs in the link between health and academic performance: A literature review. Massachusetts: Massachusetts Department of Education: Learning Support Services.
Mellanby, A.R., Rees, J.B., Tripp, J.H. (2000). Peer-led and adult-led school health education: a critical review of available comparative research. Health Educ Res., 15 (5), 533-545.
Messerer, M., Johansson, S-E, and Wolk, A. (2004). The validity of questionnaire-based micronutrient intake estimates is increased by including dietary supplement use in Swedish men. Journal of Nutrition, 134, 1800-1805.
Messina, F., Saba, A., Vollono, C., Leclercq, C., Piccinelli, R. (2004). Beliefs and attitudes towards the consumption of sugar-free products in a sample of Italian adolescents. Eur J Clin Nutr., 58(3):420-8.
Miller, W.C., Eggert, K.E., Wallace, J.P., Lindeman, A.K., and Jastrenski, C. (1993). Successful weight loss in a self-taught, self-administered program. International Journal of Sports and Medicine, 14 (7), 401-405.
Milne, D.B. and Nielsen. (2000). The interaction between dietary fructose and magnesium adversely affects macromineral homeostasis in men. Journal of American College of Nutrition,19(1), 31-37.

129
Molnar, A. (2003). No Student Left Unsold: 6th Annual Report on Schoolhouse Commercialism Trends. Education Policy Studies Laboratory: Commercialism in Education Research Unit. Retreived in June 12th, 2004 from http://www.asu.edu/educ/epsl/CERU/CERU_2003_Annual_Report.htm.
Monge-Rojas, R., Nuñez, H.P., Garita, C., Chen-Mok, M. (2002). Psychosocial aspects of Costa Rican adoelscents’ eating and physical activity patterns. Journal of Adoelscents Health, 31, 212-219.
Mrdjenovic, G. and Levitsky, D.A. (2003). Nutritional and energetic consequences of sweetened drink consumption. Journal of Pediatrics, 142, 604-610.
Muhajarine, N., Delanoy, S., Hartsook, L., and Hartsook, B. (2003). Community mapping for children in Saskatoon. Retrieved at April 1, 2005 from http://www.spheru.ca/PDF%20Files/Understanding%20the%20Early%20Years,%20Saskatoon,%20Community%20Mapping.pdf.
Nader, P.R., Sellers, D.E., Johnson, C.C., Perry, C.L., Stone, E.J., Cook, K.C., Bebchuk, J., and Luepker, R.V. (1996). The effect of adult participation in a school-based family intervention to improve Children's diet and physical activity: the Child and Adolescent Trial for Cardiovascular Health. Preventive Medicine, 25(4), 455-64.
National Soft Drink Association. (2003). What’s in Soft Drink? Retrieved June 5, 2004, from http,//www.nsda.org/softdrinks/History/whatsin.html.
Nelson, A.L. (2000). Sweeteners: Alternative. St. Paul, Minnesota: Eagan Press.
Nestle, M. (2000). Soft drink “pouring rights”: marketing empty calories to children. Public Health Report; 115: 308-309.
Nestle, M. (2002). Food politics: how the food industry influences nutrition and health. Berkeley: University of California Press.
Neumark-Sztainer, D., Story, M., Dixon, L.B., Resnick, M.D., and Blum, R.W. (1997). Correlates of inadequate consumption of dairy products among adolescents. Journal of Nutrition Education, 29, 12-20.
Neumark-Sztainer, D., Story, M., Hannan, P.J., Rex, J. (2003). New Moves: a school-based obesity prevention program for adolescent girls. Preventive Medicine, 37(1), 41-51.
Neumark-Sztainer, D., Story, M., Perry, C., and Casey, M.A. (1999). Factors influencing food choices of adolescents: Findings from focus-group discussions with adolescents. Journal of the American Dietetic Association, 99, 929-934.

130
Neumark-Sztainer, D., Wall, M., Perry, C., and Story, M. (2003). Correlates of fruit and vegetable intake among adolescents: Findings from Project EAT. Preventive Medicine, 37, 18-208.
Nguyen, U.N., Dumoulin, G., Henriet, M.T., and Regnard, J. (1998). Aspartame ingestion increases urinary calcium, but not oxalate excretion, in healthy subject. The Journal of Clinical Endocrinology and Metabolism 83(1):165-168.
Nicklas, T.A., Johnson, C.C., Myers, L., Farris, R.P., Cunningham, A. (1998). Outcome of a high school program to increase fruit and vegetable consumption: Gimme 5- A fresh nutrition concept for students. Journal of School Health, 68 (6), 248-253.
Novotny, R., Han, J-S, and Biernacke, I. (1999). Motivators and barriers to consuming calcium-rich foods among Asian adolescents in Hawaii. Journal of Nutrition Education, 31, 99-104.
O’Dea, J. and Maloney, D. (2000). Preventing eating and body image problems in children and adolescents using the health promoting schools framework. Journal of School Health, 70 (1), 18-21.
O’Dea, J.A. (2003). Why do kids eat healthful food? Perceived benefits of and barriers to healthful eating and physical activity among childrens and adolescents. Journal of the American Dietetics Association, 103(4), 497-507.
Oliver, K.K. and Thelen, M.H. (1996). Chidlren’s perception of peer influence on eating concerns. Behaviour Therapy, 27, 35-39.
Ottley, C. (2003). Health and Fitness series-4: Getting children to develop a healthy relationship with food. Journal of Family Health Care, 13 (4), 95-97.
Owuor, P.O. (2003). Chemistry: Tea. . In B. Caballero, L. Trugo, and P. Finglas (Eds), Encyclopedia of Food Sciences and Nutrition (pp. 5743-5752). USA: Academic Press.
Özcebe, H. and Akin, L. (2003). Effects of Peer Education on Reproductive Health Knowledge for Adolescents Living in Rural Areas of Turkey. Journal of Adolescent Health; 33: 217-218.
Park, Y., Meier, E., Bianchi, P., Song, W.O. (2002). Trends in Children’s Consumption of Beverages: 1987 to 1998. Family Economics and Nutrition Review, 14(2), 69-79.
Parker, L. and Fox, A. (2001). The Peterborough Schools Nutrition Project: A multiple intervention programme to improve school-based eating in secondary schools. Public Health Nutrition, 4 (6), 1221-1228.
Petridou, E., Karpathios, T., Dessypris, N., Simou, E., and Trichopoulos, D. (1997). The role of dairy products and non alcoholic beverages in bone fractures among achoolage children. Scandivanian Journal of Social Medicine, 25(2), 119-125.

131
Phillips, S., Starkey, L.J., and Gray-Donald. (2004). Food habits of Canadians: Food sources of nutrients for the adolescent sample. Canadian Journal of Dietetic Practice and Research, 65(2), 80-84.
Piesco, N.P. (2002). Histology of Dentin. In J.K. Avery (Ed), Oral Development and Histology (pp. 172-189). New York: Thieme Medical Publishers.
Pilant, B.B. and Skinner, J.D. (2004). Availability of competitive foods and beverages during lunch in middle schools. Topics in Clinical Nutrition, 19 (1), 20-27.
Popkin, B.M. and Nielsen, S.J. (2003). The sweetening of the world’s diet. Obesity Research, 11(11), 1325-1332.
Prokhorov, A.V., Perry, C.L., Kelder, S.H., and Klepp, K-I. (1993). Lifestyle values of adolescents: Results from Minnesota Heart Health Youth Program. Adolescence, 28 (111), 637-647.
Public Health Nutritionists of Saskatchewan. (2004). Nutrition Guidelines for Schools. Research Centre Report #04-01: 28 pages, $11. http://www.ssta.sk.ca/research/students/04-01.htm.
Pugh, M.J.V. and Hart, D. (1999). Identity development and peer group participation in J.A. McLellan and M.J.V. Pugh, The role of peer groups in adolescent social identity: exploring the importance of stability and change. United States of America: Jossey-Bass, Inc.
Rampersaud, G.C., Bailey, L.B., and Kauwell, G.P. (2003). National Survey beverage consumption data for children and adolescents indicate the need to encourage a shift toward more nutritive beverages. Journal of American Dietetics Association, 103, 97-100.
Reddy, R., Rhodes, J.E., Mulhall, P. (2003). The influence of teacher support on student adjustment in the middle school years: a latent growth curve study. Dev Psychopathol,15(1):119-38.
Resnicow, K., Odom, E., Wang, T., Dudley, W.N., Mitchell, D., Vaughan, R., Jackson, A., and Baranowski, T. (2000). Validation of three food frequency questionnaires and 24-hour recalls with serum carotenoid levels in a sample of African-American adults. American Journal of Epidemiology, 152, 1072-1080.
Reynolds, K. D., Franklin, F. A., Binkley, D., Raczynski, J. M., Harrington, K. F., Kirk, K. A., and Person, S. (2000). Increasing the Fruit and Vegetable Consumption of Fourth-Graders: Results from the High 5 Project. Preventive Medicine, 30, 309-319.
Rhodes, J.E., Grossman, J.B., and Resch, N.L. (2000). Agents of change: Pathways through which mentoring relationships influence adolescents’ academic adjustment. Child Development, 71(6), 1662-1671.
132
Rockett, H.R.H., and Colditz, G.A. (1997). Assessing diet of children and adolescents. American Journal of Clinical Nutrition, 65 (supply): 1116S-1122S.
Rockett, H.R.H., Wolf, A.M., and Colditz, G.A. (1995). Development and reproducibility of a food frequency questionnaire to assess diet of older children and adolescents. Journal of the American Dietetic Association, 93(3), 336-340.
Roos, E.B., Hirvonen, T., Mikkilä, V., Karvonen, S., and Rimpelä, M. (2001). Household educational level as a determinant of consumption of raw vegetables among male and female adolescents. Preventive Medicine, 33, 282-291.
Roos, E.H. and Donly, K.J. (2002) In vivo dental plaque pH variation with regular and diet soft drinks. Pediatrics Denstistry, 24, 350-353.
Rosso, I. and Rise, J. (1994). Concordance of parental and adolescent health behaviors. Social Science and Medicine; 38(9): 1299-1305.
Sacks, D. (2003). Age limits and adolescents. Pediatric Children and Health, 8 (9), 577.
Sánchez, G.A. and De Preliasco, M.V.F. (2003). Salivary pH changes during soft drinks consumption in children. International Journal of Paediatric Dentistry, 13(4), 251-237.
Saskatchewan Education. (1998). Health Education: A Curriculum Guide for the Middle Level (Grades 6-9). Regina, SK: Saskatchewan Education.
Saskatchewan Labour. (2005). Who are the young workers anyway? Retrieved at May 26, 2005 from http://www.readyforwork.sk.ca/students-workers/focus-report/who-are.htm.
Saskatchewan Learning. (2005). Evergreen Curriculum Guides & Resources. Retrieved at May 3, 2005 from http://www.sasked.gov.sk.ca/branches/curr/evergreen/sub_grade.shtml.
Saskatchewan River School Board. (2004). Beliefs. Retrieved at March 31, 2004 from http://www.carlton.paschools.pa.sk.ca/
Saskatchewan School Trustees Association. (1993). Nutrition Gudelines for Schools. SSTA Research Centre Report: #93-05.
Sawyer, L.. (2003). β-Lactoglobulin. In P.F. Fox and P.L.H. McSweeney (Eds), Advanced dairy chemistry volume 1: Protein (pp. 319-363). New York: Plenum Publishers.
Schulze, M.B., Manson, J.E., Ludwig, D.S., Colditz, G.A., Stampfer, M.J., Willett, W.C., Hu, F.B. (2004). Sugar-sweetened beverages, weight gain, and incidence of type 2 diabetes in young and middle-aged women. Journal of American Medal Association, 292 (8), 927-934.

133
Schwartz, R.P. (2003). Soft drinks taste good, but the calories count. Journal of Pediatric, 142, 599-601.
Seaman, C.E.A., Bower, J., and Fleming, M. (1997). Nutrition knowledge and lunchtime eating habits of secondary school children in Lothian. Journal of Consumer Studies and Home Economics, 21, 259-269.
Senkfor, S., Berl, T., and Liu, K.D. (2003). Hyponatremia and Hypernatremia. In P.E. Parsons and J.P. Wiener-Kronish (Eds), Critical Care Secrets (pp.247-250). Philadelphia: Hanley and Belfus, Inc.
Serra-Majem, L., Ribas, L., Ngo, J., Aranceta, J., Garaulet, M., Carazo, E., Mataix, J., Pérez-Rodrigo, Quemada, M., Tojo, R., and Vázquez, C. (2001). Risk of inadequate intakes of vitamins A, B1, B6, C., E, folate, iron, and calcium in Spanish population aged 4 to 18. International Journal of Vitamin and Nutrition Research, 71 (6), 325-331.
Sheng, H-P. (2000). Body Fluids and Water Balance. In M.H. Stipanuk (Ed), Biochemical and Physiological Aspects of Human Nutrition. Pennsylvania: W.B. Saunders Company.
Sichert-Hellert, W. and Kersting, M. (2001). Significance of fortified beverages in the long-term diet of German children and adolescents: 15-year results of the DONALD study. International Journal of Vitamin and Nutrition Research, 71 (6), 356-363.
Siegel, D.M., Aten, M.J., Roghmann, K.J., Enaharo, M. (1998). Early effects of a school-based human immunodeficiency virus infection and sexual risk prevention intervention. Archives of Pediatrics and Adolescent Medicine, 152(10),961-70.
Sigelman, C.K. and Shaffer, D.R. (1991). Life-Span Human Development. Belmont, California: Wadsworth.
Sigmant-Grant, M. (2002). Strategies for counseling adolescents. Journal of the American Dietetic Association, 102 (Supplement 3), S32-S39.
Sloane, B.C. and Zimmer, C.G. (1993). The power of peer health education. The Journal of American College Health, 41(6), :241-245.
Smith, M. U. and DiClemente, R. J. (2000). STAND: A Peer Educator Training Curriculum for Sexual Risk Reduction in the Rural South. Preventive Medicine, 30, 441–449
Smith, A. C., Stewart, R., Shields, P., Hayes-Klosteridis,_J., Robinson, P., and Yuan, R. (2005). Introductory biology courses: A framework to support active learning in large enrollment introductory science courses. Cell Biology Education, 4, 143–156,
Sohn, W-S., Heller, K.E., Burt, B.A. (2001). Fluid consumption related to climate among children in the United States. Journal of Public Health Dentistry, 61(2), 99-106.
134
Soliven, S.R. (2003). Teaching styles of high school Physics teachers. Hawaii International Conference of Education Proceedings. Retrieved at June 27, 2005 from http://www.hiceducation.org/Edu_Proceedings/Samuel%20R.%20Soliven.pdf.
Sovyanhadi, M. and Cort, M.A. (2004). Effectiveness of Various Nutrition Education Teaching Methods for High School Students: a Case Study in Alabama, United States. Mal J Nutr., 10 (1), 31-37
Spear, B.A. (2002). Adolescent growth and development. Journal of the American Dietetics Association, 102(3), S23-S29.
Spear, B.A. (2004). Nutrition in Adolescence in L.K.Mahan and S. Escott-Stump (Eds), Krause’s food, nutrition, & diet therapy (pp.284-301). Philadelphia: Elsevier.
Squire, D.L. (1990). Heat Illness: Fluid and electrolyte issues for pediatric and adolescent athletes. Pediatric Clinics of North American, 37(5), 1085-1109.
Stang, J. (2002). Assessment of nutritional status and motivation to make behaviour changes among adolescents. Journal of the American Dietetic Association, 102 (3 Supply 1): S13-S22.
St-Onge, M.P. Keller, K.L., and Heymsfield, S.B. (2003). Changes in childhood food consumption patterns: a cause for concern in light of increasing body weights. American Journal of Clinical Nutrition, 78, 1068-1073.
St-Onge, M.P., Rubiano, F., Denino, W.F., Jones Jr, A., Greenfield, D., Ferguson, P.W., Akrabawi, S., and Heymsfield, S.B. (2004). Added thermogenic and satiety effects of a mixed nutrition vs a sugar-only beverage. International Journal of Obesity, 28, 248-253.
Storey, M.L, Forshee, R.A, Anderson, P.A. (2004). Association of adequate intake of calcium with diet, beverage consumption, and demographic characteristics among children and adolescents. Journal of American College of Nutrition, 23(1), 18-33.
Story, M. (1999). School-based approaches for preventing and treating obesity. Int J Obes Relat Metab Disord., 23 (Suppl 2), S43-51.
Story M, and Neumark-Sztainer D. (1996). School-Based Nutrition Education Programs and Services for Adolescents. Adolescent Medicine, 7(2), 287-302.
Stubbs RJ, and Whybrow S. (2004). Energy density, diet composition and palatability: influences on overall food energy intake in humans. Physiology and Behaviours, 81(5), 755-64.
Sturdevant, M.S. and Spear, B.A. (2002). Adolescent psychosocial development. J Am Diet Assoc., 102 (3 Suppl), S30-S31.

135
Subar, A.F. (2004). Developing Dietary Assessment Tools. Journal of the American Dietetic Association, 105(5), 769-770.
Tanner, K and Allen, D. (2004). Approaches to Biology teaching and learning: Learning styles and the problem of instructional selection-Engaging all students in Science courses. Cell Biology Education, 3, 197- 201.
Tanasescu, M., Ferris, A.M., Himmelgreen, D.A., Rodriguez, N., and Perez-Escamilla, R. (2000). Biobehavioral factors are associated with obesity in Puerto Rican children. J Nutr., 130 (7), 1734-42.
Taylor, T, Serrano, E., and Anderson, J. (2001). Management issues related to effectively implementing a nutrition education program using peer educators. Journal of Nutrition Education, 33(5), 284-92.
Taylor, R.B. (1998). Ingredients. In P.R. Ashurst (Ed), Chemistry and Technology of Soft Drinks and Fruit Juices (pp.16-54). England: Sheffield Academic Press.
Telch, M.J., Miller, L.M., Killen, J.D., Cooke, S., and Maccoby, N. (1990). Social influences approach to smoking prevention: the effects of videotape delivery with and without same-age peer leader participation. Addicted Behaviours,15(1), 21-8.
Ten-Cate, J.M., Larsen, M.J., Pearce, E.I.F., and Fejerskov, O. (2003). Chemical interactions between the tooth and oral fluids in O. Fejerskov and A.M. Kidd (Ed), Dental Caries: The disease and its clinical management (pp. 49-70). Denmark: Blackwell Munksgaard.
The Alberta Public Health Association. (2003). Resolution 6: The elimination of soft drink promotion in schools. Retrieved at January 5, 2005 from http://www.apha.ab.ca/Resolutions/SoftDrinks.pdf.
The Council of the European Union. (2001). Council Directive 2001/112/EC. Official Journal of the European Communities, L10/58-L10/66. http://www.fsai.ie/legislation/food/eu_docs/food_products/FruitJuices_etc/Dir%202001.112%20EC.pdf
The Swiss Association for Nutrition. Water and Non-Alcoholic Drinks. Retrieved in January 28, 2004 from http://www.healthandage.com/Home/!gm=2!gc=1!gid2=2379
Tremblay. M.S., Katzmarzyk, P.T., and Willms, J.D. (2002). Temporal trends inoverweight and obesity in Canada, 1981-1996. International Journal of Obesity, 26, 538-543.
Troiano, R. P., Briefel, R. R., Carroll, M. D., and Bialostosky, K. (2000). Energy and fat intakes of children and adolescents in the United States: data from the National Health and Nutrition Examination Surveys. American Journal of Clinical Nutrition, 72(supply), 1343S-1353S.
136
Trugo, L.C. (2003). Analysis of coffee products. In B. Caballero, L. Trugo, and P. Finglas (Eds), Encyclopedia of Food Sciences and Nutrition (pp. 1498-1506). USA: Academic Press.
Tseng, M. (2004). The influence of the parent on childhood dietary intake. Public Health Nutrition, 7(2), 251-252.
Turner, G. (1999). Peer support and young people’s health. Journal of Adolescence, 22, 567-572.
Tylavsky, F.A., Holliday, K., Danish, R., Womack, C., Norwood, J., and Carbone, L. (2004). Fruit and vegetable intakes are an independent predictor of bone size in early pubertal children. American Journal of Clinical Nutrition, 79, 311-317.
US General Accounting Office. (2000). Public Education: Commercial activities in schools. GAO: HEHS-00-156. Retrieved June 1, 2004 from http://frwebgate.access.gpo.gov/cgi-bin/useftp.cgi?IPaddress=162.140.64.21&filename=he00156.pdf&directory=/diskb/wais/data/gao.
Valtin, H. (2002). "Drink at least eight glasses of water a day." Really? Is there scientific evidence for "8 x 8"? American Journal of Physiology, Regulatory, Integrative, and Comparative Physiology, 283(5),R993-1004.
Van Keer H. (2004). Fostering reading comprehension in fifth grade by explicit instruction in reading strategies and peer tutoring. British Journal of Educational Psychology, 74(Pt 1), 37-70.
Varnam, A.H. and Sutherland, J.P. (1999). Beverages: Technology, chemistry, and microbiology. New York: Chapman & Hall.
Vatanparast, H., Lo, E., Henry, C.J., Whiting, S.J. (submitted). Trends of beverage intake from 1991-2004 in grade 9 students living in Saskatoon show substitution of milk by non-carbonated soft drinks. Canadian Journal of Public Health.
Vereecken, C.A., Bobelijn, K., and Maes, L. (2005). School food policy at primary and secondary schools in Belgium-Flanders: Does it influence young people’s food Habits? European Journal of Clinical nutrition, 59, 271-277.
Wabitsch, M. (2002). Molecular and biological factors with emphasis on adipose tissue development. In W. Burniat, T.J. Cole, I. Lissau, and E.M.E. Poskitt (Ed), Child and Adolescent Obesity: Causes and Consequences, Prevention and Management (pp.50-68). USA: Cambridge University Press.
Wallin, E., Bremberg, S., Haglund, B., Holm, L.E. (1993). Cancer prevention in schools: design and pilot testing of a nutritional curriculum for mid-adolescents. J Cancer Educ., 8 (2), 145-150.

137
Walstra, P., Geurts, T.J., Noomen, A., Jellema, A., van Boekel, M.A.J.S. (1999). Dairy Technology, principles of milk properties and processes (pp.1-27). New York: Marcell Dekker.
Wardlaw, G.M., Hampl, J.S., DiSilvestro, R.A. (2004). Perspectives in Nutrition. USA: McGraw-Hill Inc.
Waterhouse, A.L. (2002). Wine Phenolics. In D.K. Das and F. Ursini (Eds), Alcohol and wine in health and disease. New York: New York Academy of Science.
Watkins, S.R. (2001). Foods sold in competition with USDA school meal programs. Retrieved November 19, 2004 from http://www.fns.usda.gov/cnd/Lunch/CompetitiveFoods/report_ congress.htm.
Watt, R.G. and Sheiham, A. (1996). Dietary patterns and changes in inner city adolescents. Journal of Human Nutrition and Dietetics; 9, 451-461.
Weaver, C.M. (2003). Calcium. Retrieved Dec 7, 2003, from http://lpi.oregonstate.edu/infocenter/minerals/calcium/index.html.
Wechsler, H., Brener, N.D., Kuester, S., and Miller, C. (2001). Food service and foods and beverages available at school: Results from the school health policies and programs study 2000. The journal of School Health, 71 (7), 313-324.
Weiss, R., Dziura, J., Burgert, T. S., Tamborlane, W.V., Taksali, S. E., Yeckel, C. W., Allen, K., Lopes, M., Savoye, M., Morrison, J., Sherwin, R. S., and Caprio, S. (2004) Obesity and the metabolic syndrome in children and adolescents. New England Journal of Medicine, 350, 2362-2374.
Wham, C.A. and Worsley, A. (2003). New Zealanders’ attitudes to milk: Implicationsfor public health. Public Health Nutrition 6 (1), 73-78.
Whiting, S.J., Healey, A., Psiuk, S., Mirwald, R., Kowalski, K., Bailey, D.A. (2001). Relationship between carbonated and other low nutrient dense beverages and bone mineral content of adolescents, Nutrition Research, 21, 1107-1115.
Whitmire, S.J. (2004). Water, electrolytes, and acid-base balance in L.K.Mahan and S. Escott-Stump (Eds), Krause’s food, nutrition, & diet therapy (pp.165-179). Philadelphia: Elsevier.
Wilson, K. (1999). Coffee, Cocoa, and Tea. United Kingdom: CABI Publishing.
World Health Organization. (2003). Obesity and Overweight. Retrieved May 29, 2004, from http://www.who.int/dietphysicalactivity/media/en/gsfs_obesity.pdf.
World Heath Organization. (2002). Bottled drinking water. Retrieved at May 25, 2004 from http://www.who.int/mediacentre/factsheets/fs256/en/index.html.

138
Wyshak, G. (2000). Teenaged girls, carbonated beverage consumption, and bone fractures. Archives of Pediatric and Adolescent Medicine, 154, 610-613.
Wyshak, G. and Firsch, R.E. (1994). Carbonated beverages, dietary calcium, the dietary calcium/phosphorus ratio, and bone fractures in girls and boys. Journal of Adolescent Health, 15, 210-215.
Wyshak, G. Frisch, R.E., Albright, T.E., Albright, N. L., Schiff, I., and Witschi, J. (1989). Nonalcoholic Carbonated Beverage Consumption and Bone Fractures Among Women Former College Athletes. Journal of Orthopaedic Research, 7, 91-99.
Yannakoulia, M., Karayiannis, D., Terzidou, M., Kokkevi, A., Sidossis, L.S. (2004). Nutrition-related habits of Greek adolescents. European Journal of Clinical Nutrition, 58, 580-586.
Yi, K.P., Meier, E.R., Bianchi, P., and Won, O.S. (2002). Trends in children consumption of beverages: 1987 to 1998. Family Economics and Nutrition Review, 14(2), 69-79.
Young, E.M., and Fors, S.W. (2001). Factors related to the eating habits of students in grades 9-12. Journal of School Health, 71(10), 483-8.
Zohouri, F.V., Rugg-Gunn, A.J., Fletcher, E.S., Hackett, A.F., Moynihan, P.J., Mathers, J.C., and Adamson, A.J. (2004). Changes in water intake of Northumbian adolescents 1980 to 2000. British Dental Journal, 196(9), 547-552.
Zuo, Y., Chen, H., and Deng, Y. (2002). Simultaneous determination of catechins, caffeine, and gallic acids in green, oolong, and pu-erh tea using HPLC with photodiode array detector. Talanta, 57, 307-316.
Zwiauer, K.F.M., Caroli, M., Malecka-Tendera, E., and Poskitt E.M.E. (2002). Clinical features, adverse effects and outcome in W. BUrniat, T.J. Cole, I. Lissau, and E.M.E. Poskitt (Ed), Child and Adolescent Obesity: Causes and Consequences, Prevention and Management (pp.131-153). USA: Cambridge University Press.

139
APPENDIX

140
Appendix 1. Ethic Approval
Appendix 1.1. Ethic Approval for the first phase study
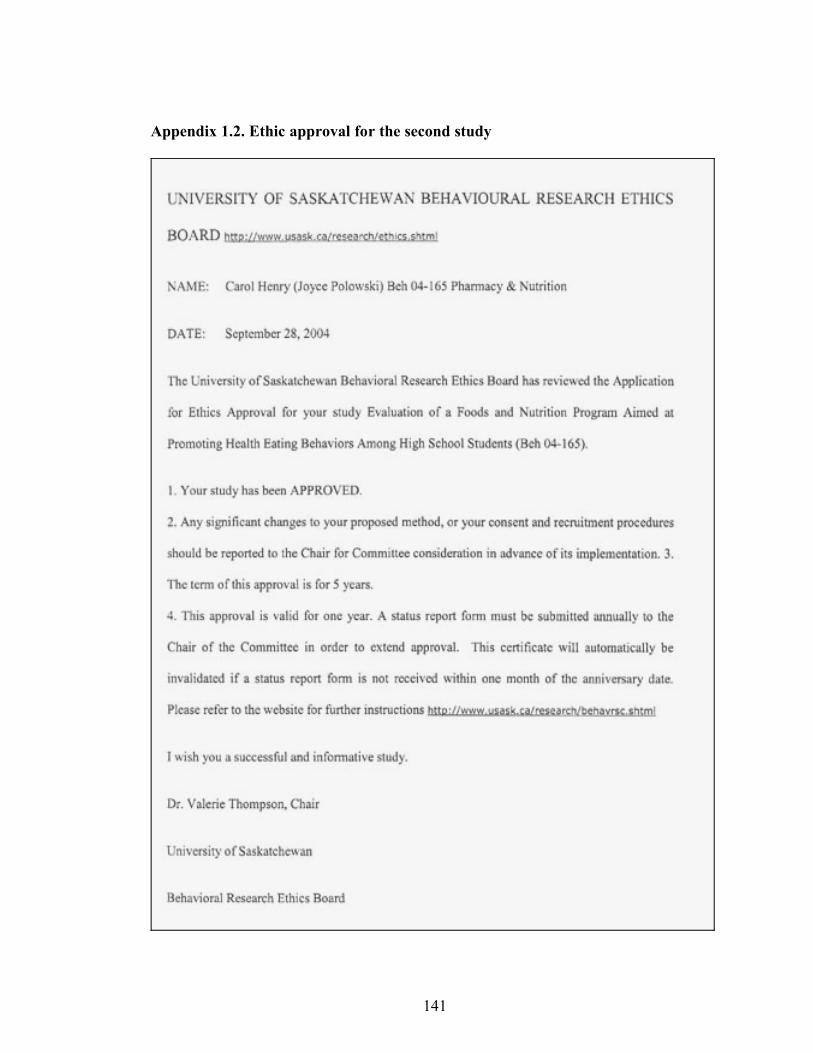
141
Appendix 1.2. Ethic approval for the second study

142
Appendix 2. Written Consent for students
Appendix 2.1. Written Consent for Saskatoon Students
Student/Parent Consent Form
Evaluation of a Nutrition Program aimed at promoting the Consumption of Healthy Beverages in high Schools
We would like your child’s assistance in a study that is being carried out at the College of Pharmacy and Nutrition, University of Saskatchewan. The goals of the study are to evaluate the knowledge, attitude and practices of high school students towards healthy beverage consumption in school, and to determine the effectiveness of a nutrition education program in helping students make healthy beverage choices. Findings from this study will provide valuable information to assist health educators, and education program planners develop future programs for encouraging healthy beverage consumption among high school aged children.
If your child decides to volunteer, his/her role as a participants will be to complete four questionnaires, each totaling approximately 45 minutes I length. The questionnaires will be completed during school hours in your child’s Ethical Living class. Students from your child’s Ethical Living class will also receive a nutrition education program that is integrated into the grade 9 Ethical Living curriculum. The students will be provided with the opportunity to volunteer to assist the Dietitian and university students as peer mentors. If your child decides to volunteer as a peer mentor they will attend 3 weekly meetings/sessions and assist the dietitian in peer-led activities.
It is not anticipated that this study will present any medical or social risk to your child. The decision to participated or not participated will not affect the grade of your child receives in any of his/her classes. Results are completely anonymous and only group results will published. All information provided to me throughout the study will be kept confidential and in a locked office when not in use. Both you and your child will be given a copy of the questionnaire to pursue upon request. If your child wishes he/she may opt not to complete the questionnaires without any undo consequence. Students who choose not to complete the questionnaires will be given an alternate assignment chosen in consultation with the teachers during this period.
Once the study is completed, the analyzed findings will be made available at your school. A copy of the report will also be sent to the funding body, Dairy Farmers of Canada.
If your child decides that he/she would like to participate in the study, please complete the attached form. Also, please ask your child to read this letter and indicate consent as well. Please address any questions or concerns about the research study to professor Carol Henry, researcher, or Renee Coles, research associate, at College of pharmacy and Nutrition, 966-5833.

143
PARENTS/GUARDIAN PLEASE READ and SIGN YOUR CONSENT
I have read and understand the goals of the study and my child’s involvement I this
study. I am aware that my child participation in this study is strictly voluntary and that
he/she may discontinue participation at any time without prejudice. I also understand
that the strictest confidentiality will be maintained throughout this study and that only
the researchers will have access to the confidential information. I acknowledge that I
have received a copy of the consent letter for my records. If I have any questions or
concerns I can contact Professor Carol Henry (306-966-5833) or Renee Coles (Dietitian,
Research Assistant). If I wish to clarify the rights of my daughter/son as a research
participant, I may contact the Office of Research Services (306-966-2804).
I, _______________________________ give permission to allow _________________
to participate in the study conducted by Professor Carol Henry.
Signature ___________________________ date _______________________________
STUDENTS PLEASE READ and SIGN YOUR CONSENT
I have discussed this study and consent with Professor Carol Henry, and my parents/guardians. I understand the purpose of the study and my involvement. I understand that I have the right to withdraw at any time from the project, or ask to have any information that I have given eliminated from the final document.
Signature ____________________________________ date______________________

144
Appendix 2.2. Written Consent for Prince Albert students
PARENT/GUARDIAN CONSENT FORM
Title: Evaluation of a Nutrition Education Program aimed at Promoting Healthy
Food and Nutrition Behaviours among High School Students
• We would like your child’s assistance in a study that is being carried out at the College of Education and the College of Pharmacy and Nutrition, University of Saskatchewan.
Purpose of the Study• The goals of the study are to evaluate the knowledge, attitude and practices of
high school students towards healthy food and nutrition behaviours, and to determine the effectiveness of a food and nutrition program in helping students make healthy choices.
Relevance:• Findings from this study will provide valuable information to assist health
educators, and education program planners develop future programs for encouraging healthy food and beverage practices among school aged children.
Method:• The program of study is called Foods Used for Effective Living (FUEL). Your
child’s school will be designated to be taught the nutrition education program or to receive the nutrition education material only. In each case the classroom teacher will help coordinate the delivery of the program.
• All students in the class will participate in the unit, as it is part of the regular Wellness 9 curriculum. Only students agreeing to the study will write three food frequency questionnaires, one prior to the beginning of the nutrition education program to assess prior knowledge, and two at the end (1 week and 3 months following) to assess learning. A member of the research team will conduct the nutrition education, and will administer the questionnaires. The regular classroom teacher will be responsible for program delivery and classroom management.
• The questionnaires will not contribute to the final grade in the class.
• We would like students to also discuss together, with research assistant (registered dietitian), what they know, what they are learning, and how they might change their life practices to consume healthy food and beverages. These small groups will be audio-recorded.

145
• There will be three such small group interview sessions, one at the beginning of the unit, one at the end, and one three months later. The questions addressed will be very different than the questions on the written questionnaires, and will be about changes to eating habits and becoming leaders in healthy eating.
• Each small group interview will take place in class, and will take approximately 30 minutes for a total of 1 ½ hours. Students in the small groups will be advised that they should not tell anyone else about what was said. However, they will also be advised that, due to the nature of small group discussions, confidentiality cannot be guaranteed.
• The small group interview will be transcribed. Small group participants will be shown the transcriptions of the interviews at a date and time agreed upon by the classroom teacher, and will be invited to change anything they believe misrepresents them. All changes will be made as the students’ request. Then students will sign off on the transcripts.
• The researcher will undertake to safeguard the confidentiality of the discussion, but cannot guarantee that other members of the group will do so. Students will be asked to respect the confidentiality of the other members of the group by not disclosing the contents of this discussion outside the group. They will also be made aware that others within the group may not respect their confidentiality. Participants will be reminded of this at the time of the focus group.
Right to Withdraw• Students may choose to withdraw from the stud at any time, and if they
withdraw, their questionnaire results will not be used, and they need not participate in any further focus group interviews. They may withdraw just by letting Mrs. Polowski (principal investigator) or a member of the research team know that they wish to withdraw. If the student choose to withdraw it will not affect their grade for the course. Teachers will provide alternate assignments for those students wishing not to participate in any aspect of the study.
Risk/Confidentiality • The study will be of no harm to the student it involves no risk or discomfort. All
information provided by the students will be kept confidential.
• Once the study is completed, a summary report will be made available at school and will be available to students and parents. The results of this research will be shared with teachers from other schools at the Dr. Stirling McDowell Learning from Practice Conference. Also, it is possible that the results will be published in academic journals. In all publications and presentations, students and school will be anonymous.

146
Ethics• The University of Saskatchewan Research Ethics Boards has approved the research.
Contact • Please address any questions or concerns about the research study to Dr. Carol Henry, College of Pharmacy and Nutrition, (306) 966-5833, or Mrs. Polowski of Carlton High School, 922-3115, ext. 303. You may also contact the University of Saskatchewan Research Ethics Boards at (306) 966-2084.
PARENTS/GUARDIAN PLEASE READ and SIGN YOUR CONSENT
I have read and understand the goals of the study and my child’s involvement I this study. I am aware that my child participation in this study is strictly voluntary and that he/she may discontinue participation at any time without prejudice. My child will be anonymous; no one will know how well my child did on this questionnaire, but all the class results will be averaged so students can learn how ell they retain this important information about their health. I acknowledge that I have received a copy of the consent letter for my records. If I have any questions or concerns I can contact Professor Carol Henry (306-966-5833) or Joyce Polowski, principal investigator (306-922-3115 x 303). If I wish to clarify the rights of my daughter/son as a research participant, I may contact the Office of Research Services (306-966-2804).
I, _______________________________ give permission to allow _________________ to participate in the final questionnaire aspect of the study conducted by the College of Pharmacy and Nutrition, University of Saskatchewan
Signature ___________________________ date _______________________________
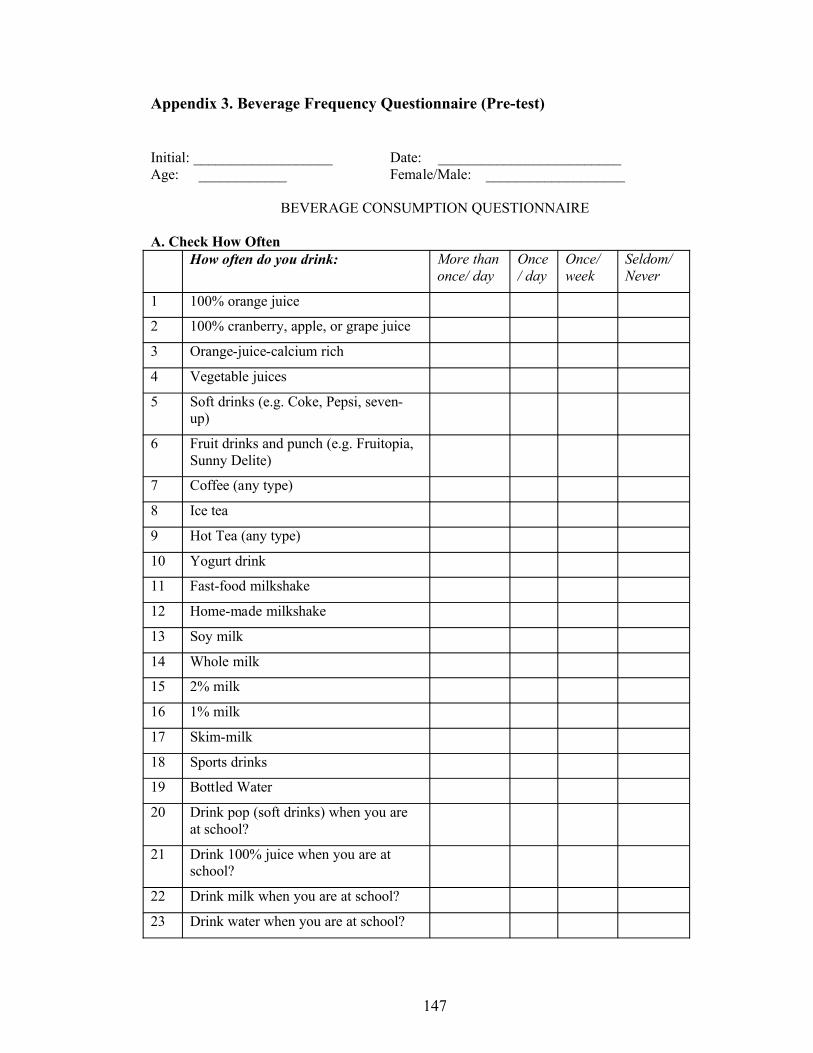
147
Appendix 3. Beverage Frequency Questionnaire (Pre-test)
Initial: ___________________ Date: _________________________Age: ____________ Female/Male: ___________________
BEVERAGE CONSUMPTION QUESTIONNAIRE
A. Check How Often How often do you drink: More than
once/ dayOnce/ day
Once/ week
Seldom/Never
1 100% orange juice
2 100% cranberry, apple, or grape juice
3 Orange-juice-calcium rich
4 Vegetable juices
5 Soft drinks (e.g. Coke, Pepsi, seven-up)
6 Fruit drinks and punch (e.g. Fruitopia, Sunny Delite)
7 Coffee (any type)
8 Ice tea
9 Hot Tea (any type)
10 Yogurt drink
11 Fast-food milkshake
12 Home-made milkshake
13 Soy milk
14 Whole milk
15 2% milk
16 1% milk
17 Skim-milk
18 Sports drinks
19 Bottled Water
20 Drink pop (soft drinks) when you are at school?
21 Drink 100% juice when you are at school?
22 Drink milk when you are at school?
23 Drink water when you are at school?

148
B. Do you agree or disagree?Statements Agree Some what
agreeDisagree
24 If you were offered a choice of milk or pop, you will usually choose pop
25 The taste of milk is acceptable to you
26 Milk is for everybody, not just for kids
27 There are easy ways to include milk in the diet
28 I like the way 100% fruit juice tastes
29 Milk is cheaper than pop
30 Consuming one or more glasses of milk will help strengthen your bones and improve your overall health
31 Do you think that drinking fruit juices will help you reduce the risk of cancer?
32 Do you think that if you improve the types of beverage you drink that you would be a healthier person?
33 Drinking one glass of milk each day will give young adults all the calcium they needs
34 Osteoporosis is a condition of weak bones that may break easily
35 Osteoporosis maybe prevented by getting enough calcium early in life
36 Milk, cheese, and other dairy products are the richest source s of calcium
37 Fruit drink has the same nutrients as fruit juice
C. How Many…38 How many fruits and vegetables (including juices) should a person eat and/or drink
each day?
Circle one: 2 4 6 8 10
39 How many glasses of water (or equivalent) should a person drink each day?
Circle one: 2 4 6 8 10
40 How many servings of milk and milk products should a person have each day?
Circle one: 2 4 6 8 10

149
Appendix 4. Beverage Frequency Questionnaire (Post-test)
Name Initial: _________________ Date: ___________________Date of birth: ___________ Female/Male: _____________
BEVERAGE CONSUMPTION QUESTIONNAIREA. Check How Often
How often do you drink: More than once/ day
Once/ day About once/ week
Seldom/Never
1 100% orange juice
2 100% cranberry, apple, or grape juice
3 Orange-juice-calcium rich
4 Vegetable juices
5 Soft drinks (e.g. Coke, Pepsi, seven-up)
6 Fruit drinks and punch (e.g. Fruitopia, Sunny Delite)
7 Coffee (any type)
8 Ice tea
9 Hot Tea (any type)
10 Yogurt drink
11 Fast-food milkshake
12 Home-made milkshake
13 Soy milk
14 Whole milk
15 2% milk
16 1% milk
17 Skim-milk
18 Sports drinks
19 Bottled Water
20 Drink pop (soft drinks) when you are at school?
21 Drink 100% juice when you are at school?
22 Drink milk when you are at school?
23 Drink water when you are at school?

150
B. Do you agree or disagree?Statements Agree Some what
agreeDisagree
24 Do you think that drinking fruit juices will help you reduce the risk of cancer?
25 Do you think that if you improve the types of beverage you drink that you would be a healthier person?
26 Drinking one glass of milk each day will give young adults all the calcium they needs
27 Osteoporosis is a condition of weak bones that may break easily
28 Osteoporosis maybe prevented by getting enough calcium early in life
29 Milk, cheese, and other dairy products are the richest source s of calcium
30 Fruit drink has the same nutrients as fruit juice
C. How Many…31 How many fruits and vegetables (including juices) should a person eat and/or
drink each day?
Circle one: 2 4 6 8 10
32 How many glasses of water (or equivalent) should a person drink each day?
Circle one: 2 4 6 8 10
33 How many servings of milk and milk products should a person have each day?
Circle one: 2 4 6 8 10

151
D. Check yes or noNo Questions Yes No
34 Have you increased your overall intake of fruit juices ?
35 Have you increased your overall intake of vegetables and juices?
36 Can you think of some disease conditions that may be decreased by a diet high in fruits and vegetables [juices]?
37 Have you increased your overall intake of milk?
38 Have you decreased your overall intake of soft drinks?
39 Can your think of some disease conditions that may be decreased by a diet high in milk and low in pop intake?
40 Do you drink more 100% fruit juice or fruit and vegetables because you think that they are good for you?
41 Do you feel more strongly than before that drinking more fruit/vegetable juice will reduce the risks of diseases?
42 Do you feel more strongly than before that consuming one or more glass of milk will help you strengthen your bones and improve your overall health?
43 Have you tried a beverage [e.g. milk, juice] that you have never drunk before?
44 Have you tried to follow a healthier diet?
45 Have you made a recipe from one of the handouts?
46 Would you consider reducing the amount of pop in your diet for the next 30 days or so?
47 Would you consider including more nutritious (juice-100%, milk) beverages in your diet in the next 30 days?

152
E. Be honest please……46 What was you overall level of satisfaction with the F.U.E.L. For Your Body program/
[materials- non-treatment group]?
Circle one: 1= Poor, 2-Fair, 3-Good, 4-Very Good, 5-Excellent
47 How many sessions of the nutrition education program [treatment only] did you attend?
48 What would you say you liked the most about the F.U.E.L For Your Body program?
49 What would you say you liked the least about the F.U.E.L For Your Body program?
50 What changes have you made as a result of the information you received from the F.U.E.L. For Your Body program?
51 Would you recommend this program to your friends? Yes No Explain :
52 What changes would you like us to make to the program to make it better for others like your self?
THANK YOU VERY MUCH FOR YOUR TIME AND EFFORT!If you have any questions, please call me, Renee Cole at 306-966-5833
You may also reach Professor Carol Henry, principal investigator for this study, at the same number, 306-966-5833