a. · or tundra). in a recent study, prigent et al. (2005) results suggest that any correlation...
TRANSCRIPT

Source of Acquisition NASA Goddard Space Flight Cente~
Skin Temperature Analysis and Bias Correction in a Coupled Land-Atmosphere Data Assimilation System
Authors: M. G. Bosilovich [email protected] J. D. Radakovich NIA A. da Silva [email protected] R. Todling [email protected] F. Verter [email protected]
Abstract
In an initial investigation, remotely sensed surface temperature is assimilated into a coupled atmospherelland global data assimilation system, with explicit accounting for biases in the model state. In this scheme, an incremental bias correction term is introduced in the model's surface energy budget. In its simplest form, the algorithm estimates and corrects a constant time mean bias for- each gridpoint; additional benefits are attained with a refined version of the algorithm which allows for a correction of the mean diurnal cycle. The method is validated against the assimilated observations, as well as independent near-surface air temperature observations. In many regions, not accounting for the diurnal cycle of bias caused degradation of the diurnal amplitude of background model air temperature. Energy fluxes collected through the Coordinated Enhanced Observing Period (CEOP) are used to more closely inspect the surface energy budget. In general, sensible heat flux is improved with the surface temperature assimilation, and two stations show a reduction of bias by as much as 30 ~ m - ~ . At the Rondonia station in Amazonia, the Bowen ratio changes direction in an improvement related to the temperature assimilation. However, at many stations the monthly latent heat flux bias is slightly increased. These results show the impact of univariate assimilation of surface temperature observations on the surface energy budget, and suggest the need for multivariate land data assimilation. The results also show the need for independent validation data, especially flux stations in varied climate regimes.
Popular Sunzmary
Surface temperature is a critical component of Earth system. It is the lower boundary of the atmosphere, and estimates how much the surface is heating the atmosphere fiom below. Remote sensing of atmospheric data from space also uses surface temperature as an important condition. In this paper, we use remotely sensed surface temperature over land in a coupled landlatmosphere data assimilation system. Data assimilation is the process of merging observations and model simulations to combine the consistency of model simulations with the accuracy of the observations into one data product. The resulting assimilated surface temperature should be a better data set than without the data assimilation, but also, the processes that relate to surface temperature (such as warming of the atmosphere) should be better represented.
https://ntrs.nasa.gov/search.jsp?R=20070019357 2019-12-26T03:32:33+00:00Z

The method implemented here, allows for the assimilated surface temperatuse observations to directly affect the heat fluxes that occur at the land surface. Previous methods do this indirectly through the near surface air temperature or moisture in the soil. We have performed several experiments to evaluate the assimilation of land surface temperature. The first corrects the mean bias of the assimilation system and the second corrects biases in the diurnal (or daily) cycle of temperature. We show that by correcting only the mean bias, additional errors can be introduced in the daytime high temperatures and nighttime low temperatures. The diurnal assimilation improves both the mean air temperature as well as the high and low temperatures.
In further validation of the method, we use enhanced observations of the surface heating from several in-situ stations. Indeed, the assimilation of remotely sensed surface temperature did improve the surface heating of the atmosphere. However, the heating of the atmosphere due to the phase change of water from liquid to gas (evaporation) was slightly degraded when including the surface temperature assimilation. This is partly because the surface soil water is not constrained by observations and may have its own bias. We expect that remotely sensed soil moisture observations would greatly improve this component of the atmospheric heating.
Skin Temperature Analysis and Bias Correction in a Coupled
Land-Atmosphere Data Assimilation System
Michael G. Bosilovich, Jon D. Radakovich, Arlindo da Silva, Ricardo Todling and Frances Verter
NASNGlobal Modeling and Assimilation Office Code 610.1 Goddard Space Flight Center
Greenbelt MD
Final form was received on 8 August 2006, has been accepted for publication in the February 2007 issue of Journal of the Meteorological Society of Japan as the Special Edition on the
Coordinated Enhanced Observing Period (CEOP)
Permission has been provided by MSJ to place a copy of the articles on this sever. MSJ will not guarantee that the copy provided here is an accurate one published in the Journal.
O Copyright 2007, Meteorological Society of Japan (MSJ)

Skin Temperature Analysis and Bias Correction in a Coupled
Land-Atmosphere Data Assimilation System
ABSTRACT
In an initial investigation, remotely sensed surface temperature is assimilated into a
coupled atmospherelland global data assimilation system, with explicit accounting for biases
in the model state. In this scheme, a incremental bias correction term is introduced in the
model's surface energy budget. In its simplest form, the algorithm estimates and corrects a
constant time mean bias for each gridpoint; additional benefits are attained with a refined
version of the algorithm which allows for a correction of the mean diurnal cycle. The method
is validated against the assimilated observations, as well as independent near-surface air
temperature observations. In many regions, not accounting for the diurnal cycle of bias
caused degradation of the diurnal amplitude of background model air temperature. Energy
fluxes collected through the Coordinated Enhanced Observing Period (CEOP) are used to
more closely inspect the surface energy budget. In general, sensible heat flux is improved
with the surface temperature assimilation, and two stations show a reduction of bias by as
much as 30 ~ m - ~ . At the Rondonia station in Amazonia, the Bowen ratio changes direction
in an improvement related to the temperature assimilation. However, at many stations the
monthly latent heat flux bias is slightly increased. These results show the impact of univariate
assimilation of surface temperature observations on the surface energy budget, and suggest
the need for multivariate land data assimilation. The results also show the need for
independent validation data, especially flux stations in varied climate regimes.
1. Introduction
Land surface skin temperature, Ts, is an important boundary condition for climate
models and parameter for climate process studies (Jin and Dickinson, 2002; Kalnay and Cai,
2003; Simmons et al., 2004). The skin temperature is a central component of surface radiative
processes, it is crucial to the solution of the surface turbulent heat fluxes, the planetary
boundary layer, and convection. In addition, a reliable skin temperature product is a key
requirement for operational users of a global data assimilation system (e.g. satellite
instrument teams and their retrieval algorithms). The accuracy of simulated skin temperature
in data analysis products is sensitive to errors in the model physical processes of clouds,
radiation, soil moisture, and precipitation. Moreover, it is particularly difficult to assimilate
skin temperature measurements, because the instruments sense the radiative brightness of a
heterogeneous surface, and the model surface has a small heat capacity. The problem is
complicated by the diurnal cycle of temperature over land, because day and night errors can
be very different.
The motivation of this study is to improve the skin temperature field of the GMAO
(Global Modeling and Assimilation Office) analysis products. Incorporating land surface
temperature into the assimilation system confronts simulated land processes with
observations. The resulting surface temperature data should provide a better estimate than
that of the model, and the analysis increments will identi@ the biases in the model forecasts.
In this study, we have integrated the NCAR Community Land Model (CLM) version 2.0
land-surface model (Dai et al. 2002; Zeng et al. 2002) into the assimilation system, and
assimilate remotely sensed land surface skin temperature directly into the surface temperature
prognostic equation of CLM. This scheme differs from the GMAO's operational Goddard
Earth Observing System (GEOS) Data Assimilation System Version 4, where an uncoupled
analysis is performed and the bias correction term is not fed back to the CLM (Bloom et al.

2005). Additionally, we employ a variant of the Dee and da Silva (1998) bias correction
scheme, where a bias correction term is applied at every time step of the land surface
prognostic energy budget, and applied across the diurnal cycle. It is thus important to
validate the surface energy balance to assess the impact that the assimilation methodology
has on heat exchanges with the atmosphere.
The next section reviews previous efforts to incorporate surface temperature in data
assimilation systems. Section 3 describes the data being assimilated in this investigation, as
well as the independent data sets used for validation. Section 4 provides an overview of the
model and data assimilation system, and the methodology used for assimilating land surface
skin temperature. Section 5 describes the different experiments and validation of the method.
2. Background
In an analysis system, an unconstrained land surface can drift toward states that are
not representative of observations and disconnected with the overlying analyzed atmosphere.
Mahfouf (1991) used near-surface air temperatures to constrain the boundary conditions of a
coupled land and atmosphere assimilation system. The goal was to properly initialize the
energy budget at the planetary boundary layer, by using screen-level air temperature
combined with relative humidity to parameterize the top layer soil moisture. Subsequently,
numerous land surface studies confirmed that variations in the surface soil moisture content
are crucial to the partitioning of net radiation among latent, sensible and ground heat fluxes.
While the soil moisture strongly influences the surface energy budget and weather prediction
(Beljaars et al., 1996), the requisite measurements of soil wetness for assimilation remains an
area of active research (Walker et al. 2002, Reichle et al., 2004, Walker and Houser, 2004).
Douville et al. (2000) intercompare a soil water nudging scheme with the optimal
interpolation method of Mahfouf (1991). The experiments were offline point simulations for
the First ISLSCP Field Experiment (FIFE). While the nudging was sensitive to model biases,

the optimal interpolation method produced more robust results, and improved evaporation for
the 4 month period of FIFE. This method, which uses screen level air temperature and
moisture, was eventually adopted in the operational forecast system and the ECMWF 40 year
reanalysis (ERA40). Betts et al. (2003) and Seneviratne et al. (2004) have studied basin-
averaged meteorology, water and energy budgets in ERA40, with the general conclusion that
ERA40 accurately reproduced the observed budget. In general, ERA40 has improved over
the previous reanalysis where land surface increments significantly affected the budget
analysis (Betts et al. 1998 a, b and 1999).
McNider et al. (1994) presented a technique for assimilating satellite-observed
surface temperature into a mesoscale model in a manner that avoids having to specify surface
parameters that are not well known. Unlike earlier assimilations that attempted to gradually
change, or "nudge" the surface temperature, this method recognizes that adjustments to the
surface temperature must be consistent with components of the surface energy budget. They
adjusted the surface specific humidity so that the model's average time rate of change in
surface temperature agrees with the observed average rate of change of infrared skin
temperature. With their method, the latent energy can be inferred as the residual of the
energy balance equation, and may not work properly if there is little or no soil water (deserts
or tundra). In a recent study, Prigent et al. (2005) results suggest that any correlation between
remotely sensed surface temperature and soil moisture is related to the vegetation cover, and
only indirectly related to soil moisture. McNider et al. (1994) assimilated surface temperature
tendencies. While this reduces the bias of the observations going into the system, the method
is constrained to using only datasets that adequately resolve the diurnal cycle.
Many studies have used near-surface air temperature and/or moisture to adjust soil
moisture (e.g. Mahfouf 1991). The quality of remotely sensed skin and brightness
temperature is improving, and has the potential to contribute to land data assimilations.
Castelli et a1 (1999) used FIFE radiometric surface temperature in an adjoint assimilation
method to derive soil wetness and surface heat fluxes. Alapaty et al. (2001) used near-surface
meteorology assimilated into a 1-D planetary boundary layer model, to adjust the turbulent
profile of the atmosphere, and provide better surface fluxes. Likewise, Margulis and
Entekhabi (2003) used FIFE near-surface air temperature moisture and radiometric surface
temperature in a variational assimilation approach for atmospheric boundary layer flux
assimilation. This has been recently extended beyond the point scale to multi-scale remotely
sensed brightness temperature over the Great Plains of the United States. Crow and Kustas
(2005) have also applied variational techniques to derive evaporative fraction and heat
transfer coefficients from surface temperature under a variety of background conditions and
at several observing stations. Seuffert et a1 (2004) incorporated brightness temperature into
the Mahfouf (1991) method, and further improved the increments of soil water. Likewise,
Lakshmi (2000) used surface temperature to make adjustments to soil moisture. Van den
Hurk et al. (2002) use surface temperature assimilation to adjust the root zone soil moisture
and the roughness length for heat. Here, we will assimilate surface temperature and use the
increments to compute the bias of the system to provide forcing to the solution of the surface
energy budget and skin temperature prognostic equation. This surface temperature is the
lower boundary condition of a global atmospheric data assimilation system. The method
adjusts the model background temperature, turbulent fluxes and terrestrial long wave
radiation based on the surface temperature bias.
3. Data
In this study, we assimilate skin temperature from the International Satellite Cloud
Climatology Project (ISCCP). Surface air temperature from in-situ stations is used as
independent validation of the approach. Independent in-situ station observations from the

Coordinated Enhanced Observing Period (CEOP, Bosilovich and Lawford, 2002; Lawford et
a1 2005) are used to validate the impact on the surface fluxes.
The International Satellite Cloud Climatology Project (ISCCP) has produced a global
clear-sky surface skin temperature product merged from the infrared radiances of an
international network of geostationary and polar-orbiting meteorological satellites (Rossow et
al. 1996). ISCCP includes processed visible and infrared data, producing 3-hourly datasets of
global cloud cover and radiative properties, including surface temperature (Rossow et al.
1996). The ISCCP data product we assimilate is the 30 Km global clear-sky surface skin
temperature from the Pixel Level Cloud Product (DX). The algorithm for this product is
described by Rossow and Schiffer (1991 and 1999). The ISCCP DX data set is based on
infrared radiances from several series of satellites: Geostationary Meteorological Satellite
(GMS - Japan), Geostationary Operational Environmental Satellite (GOES - US),
Meteorological Satellite (Meteosat - EU), and National Oceanic and Atmospheric
Administration (NOAA - US).
The inherent accuracy of remotely sensed skin temperature is a concern. Jin (2004)
summarizes the difficulties in surface temperature retrieval and efforts to improve the
satellite era record. Even among geostationary satellites, different views of the same scene
may disagree on the land surface temperature by up to 6K, particularly as a result of varying
the viewing angle (Minnis and Khaiyer 2000). Despite this, a global review of the skin
temperature uncertainty from GOES retrievals found errors of only 0.5-1.0 K over ocean and
0.9-2.4 K over land (Garand 2003). The methodology of merging and processing the
remotely sensed data is improving, and the quality and quantity of skin temperature
observations will increase (Aries et al. 2001 and Prigent et al. 2003). Looking forward to both
improved historical records and advanced fine resolution data (e.g. from MODIS, Wan et al.
2004), the method of assimilating observed skin temperature requires more investigation.

The National Centers for Environmental Prediction (NCEP) provides surface
meteorological observations from the Global Telecommunications System (GTS). We
processed this surface meteorological data to match the analysis grid used in this study, so
that the meteorological data could be used as a benchmark for testing the analysis method. In
the gridding process, we did not make adjustments to the data to account for differences
between model topography and the altitude at the station location. While this may affect the
station data at high altitudes, the global grid appears to provide a reasonable data set for
model intercomparison.
While we can validate the assimilation against available meteorological station data,
the availability of surface energy budget and flux data is quite limited. One set of validation
data for this study comes from the Coordinated Enhanced Observing Period (CEOP).' CEOP
was designed as a pilot program to test the scientific community's ability to bring together a
variety of global observations in order to better document and simulate water and energy
fluxes over land. We will use in-situ point observations from CEOP reference sites and
Continental Scale Experiments (CSEs) as independent validations (Bosilovich and Lawford
2002; Koike 2004). In order to compare hourly point observations with our gridded model,
we use Model Output Location Time Series (MOLTS), which generate model output from a
given point at hourly frequency, matching the station temporal frequency. Spatial
interpolation to site locations is not performed, and we simply use the nearest model grid
point data (e.g. Betts et a1 1998 a and b, 1999).
4. Model and Methodology
4.1 GEOS4 Data Assimilation System
The experiments are based on the finite-volume General Circulation Model (fvGCM;
Lin 2004), developed at NASA in collaboration with the National Center for Atmospheric
Research (NCAR). Data assimilation is performed with the Physical-space Statistical

Analysis system (PSAS; Cohn et al. 1998). Collectively, the combination of fvGCM and
PSAS are referred to as the GEOS4 Data Assimilation System (Bloom et al. 2005). This
configuration of GEOS4 provided operational analyses for the GMAO from June 2003
through September 2005. The finite-volume dynamical core is capable of resolving
atmospheric motions from meso- to planetary-scale with a terrain-following Lagrangian
control-volume vertical coordinate system (Lin 1997; Lin and Rood 1999). The fvGCM
dynamical core formulation includes a genuinely conservative Flux-Form Semi-Lagrangian
(FFSL) transport algorithm (Lin and Rood 1996) with Gibbs oscillation-free monotonicity
constraint on sub-grid distribution. There is a consistent and conservative transport of air
mass and absolute vorticity, and subsequent superior transport of potential vorticity by the
FFSL algorithm (Lin and Rood 1997). In turn, the mass, momentum, and total energy are
conserved when mapping from the Lagrangian control-volume to the Eulerian fixed reference
coordinate.
The physical parameterizations of the fvGCM are based on NCAR Community
Climate Model version 3.0 (CCM3) physics, with the exception of gravity wave drag which
is implemented based on more recent NCAR parameterization (Bloom at a1 2005). The
NCAR CCM3 parameterizations are a well-balanced set of processes with a long history of
development and documentation (Kiehl et al. 1998). The moist physics package includes the
Zhang and McFarlane (1995) deep convective scheme, which handles updrafts and
downdrafts and operates in conjunction with the Hack (1994) mid-level and shallow
convection scheme. For the radiation package, the longwave radiative transfer is based on an
absorptivity-emissivity formulation (Ramanathan and Downey 1986) and the shortwave
radiative parameterization uses the 6-Eddington method (Briegleb 1992). The boundary-
layer mixing/turbulence parameterization utilizes the "nonlocal" formulation from Holtslag
and Boville (1993).

All observations that are assimilated into the system must first pass through a
Statistical Quality Control (SQC) system (Dee et al. 2001). The goal of the SQC is to
remove observations that are probably contaminated by gross errors. The SQC performs a
local statistical analysis for outlier data that differ significantly from the short-term forecast
produced by the GCM. The main decision algorithm of the SQC is an adaptive buddy check
in which the rejection limits for flagged observations are adjusted on the fly depending on the
local variability of surrounding observations.
The GEOS4 (and PSAS) data assimilation algorithms seek to create an optimal
description of the state of the system by combining the current observations with a model
forecast initialized by the previous analysis. PSAS implements a standard 3D-Var algorithm,
with covariance operators formulated in observation space (Cohn et al. 1998, Guo et al. 1998,
Larson et al. 1998). The analysis of mass and wind is multivariate, followed by univariate
analysis of moisture and skin temperature for operational mode (Bloom et al. 2005). The
skin temperature background and observation errors are homogeneous and isotropic, with
constant background/observation error standard deviations ( o ~ loo ) defined so that the scalar
weight (K)
is taken as 0.7 for latitudes equatorward of 60 degrees, and K - 0.5 for latitudes poleward of
60 degrees. While we expect errors to be spatially and temporally varying, it is difficult to
more precisely define the error distribution without a large ground truth data set. The early
testing of surface temerpature assimilation showed that the analysis was unstable at high
latitudes, owing to the proximity of observations. This instability was controlled by assuming
more observation error (smaller K) at higher latitudes.
4.2 The Common Land Model (CLM)
The state-of-the-art NCAR Community Land Model version 2 (CLM2) land-surface
model (Dai et al. 2002; Zeng et al. 2002, Oleson et al. 2004) is part of the standard
configuration of the GEOS-4 GCM (Bloom et a1 2005). The CLM2 provides a
comprehensive physical representation of soillsnow hydrology, thermal dynamics and
biogeophysics. The CLM2 was developed collaboratively by an open interagencyluniversity
group of scientists, and based on well-proven physical parameterizations and numerical
schemes that combine the best features of three previous land surface models: Biosphere-
Atmosphere Transfer Scheme (BATS; Dickinson et al. 1993), the NCAR Land-surface
Model (LSM; Bonan 1996), and the IAP94 snow model (Dai and Zeng 1996).
The CLM2 is a column model that uses sub-grid scale tiles. There is one vegetation
layer with a photosynthesis-conductance model to realistically depict evapotranspiration
(Bonan 1996). There are 10-uneven vertical soil layers with the bottom layer at 3.43-m and
water, ice, and temperature states in each layer. The CLM2 can have up to five snow layers
depending on the snow depth with water flow, refreezing, compaction and aging allowed. In
addition, the CLM2 utilizes two-stream canopy radiative transfer, the Bonan (1996) lake
model, topographic enhanced streamflow based on TOPMODEL (Beven and Kirkby 1979),
and turbulence is considered above, within, and below the canopy. The vegetation
parameterization has been updated to improve the representation of leaf interception and
surface runoff (Dickinson et al., 2003). The vegetation surface temperature equations has also
been modified to include a heat capacity so that surface temperature can be assimilated to that
budget as well. The connection between the data assimilation and the model surface energy
budget is discussed later in this section.

4.3 Assimilation and Bias Correction Algorithms
Complete details and rigorous derivation of the assimilation and bias correction
methods are discussed by Cohn et a1 (1998) and Dee and da Silva (1998), respectively. The
assimilated skin temperature observations can be used to reduce the long-term skin
temperature bias of the model through bias correction. We implemented a simplified variant
of the Dee and da Silva (1998) bias correction scheme based on equations (2) through (4).
In these experiments, wf is the forecast blackbody surface temperature derived from the CLM
and the wO is the ISCCP observed blackbody temperature. wn is the resulting analysis field of
blackbody temperature. In this notation, 6wU is the analysis increment at analysis time k, b{is
the updated time mean forecast bias estimate, and bk-f is the bias estimate based on the
previous analysis increment 6 ~ k - ~ " ; K is a notational short hand for an iterative conjugate
gradient solver used to solve the analysis equation and H is the interpolation operator (Cohn
et a1 1998). The parameter y controls the rate of convergence of the bias estimate as a
function of time; here we take y = 0.2. An incremental bias correction scheme was
introduced, where a bias correction term is added to the surface energy balance at every time
step, assuming that the bias in physical surface skin temperature is not much different than
the bias in radiative temperature. To implement this incremental bias correction, the updated
bias estimate bdis converted to an energy flux (B) which is included in the surface energy
budget
This equation is generally representative of soil, vegetation and snow surface balances, where
Rs represents the upward and downward shortwave radiation; RL represents the upward and
downward longwave radiation; Hs is the sensible heat flux, LE is the latent heat flux; G is the
heating into the ground; C is the effective heat capacity and B is the heating due to the bias of
the model compared to the analyzed observations (henceforth referred to as the bias flux),
where B = C bkf/ T, and time scale T = 3 hours is the analysis interval (the time step of the
model is ?4 hour). The ISSCP observations were binned to the models 1 degree grid for
analysis. The terms in the equation that are functions of surface temperature (evaporation,
sensible heat, and upward long wave radiation) are linearized with respect to T, in the land
parameterization.
The surface temperature is computed by iteration of the energy balance. Since the
skin temperature bias correction term is included in the iteration, all budget terms that are a
function of the surface temperature adjust to the presence and magnitude of the bias
correction at every time step. For the ISCCP data and its assimilation, the period between
analysis updates is 3 hours. The incremental bias correction is applied uniformly in the
diurnal cycle, so that biases from all times of day contribute to the bias estimate. This is
analogous to the application of bias correction in atmospheric data assimilation.
Given the diurnal cycle of the land surface temperature, there is no guarantee that all
temperatures throughout the day will have the same bias in sign or magnitude. Therefore, we
parameterize the bias estimate (bkf) as a function of time of day (x), by considering the
Fourier expansion:

2n- where u , = - . m.
24hr
For the purpose of this study, we would like to capture the time mean bias and the mean
diurnal cycle. Therefore, we truncate the series above at m = 1.
bkf(~) =a: +a: c o s u , z + ~ ~ s i n u , z . (8)
The Fourier coefficients a l k andplk are estimated from the analysis increments, e.g.,
1 I ak = ak-, - y&; COS u1 z (9)
Pi = Pi-, - y&i sin w, z (10)
Note that when we retain only the first term (m=O) in the Fourier expansion the method
reverts back to the time mean bias correction.
The appropriate value for each 3 hour segment of the diurnal cycle is then included
into the surface energy balance (B in equation 5). The energy budget equation is iterated to
solution where the turbulent fluxes are solved by similarity approximations. For a given
model time step, the bias flux is considered to be constant, so that it can be viewed as
additional forcing on the surface energy budget. So, unlike some previous efforts of surface
temperature assimilation (e.g. McNider et a1 1994), all surface energy terms that are a
function of temperature are permitted to adjust to the bias correction term. Further, the
solution of surface layer turbulence (through similarity theory) is still maintained, only
considering the bias flux in addition to the other forcing energy terms. Therefore, it is
important that the resulting turbulent energy fluxes be well validated. In the next section, we
test the assimilation and the bias correction methods, as well as independently validate the
resulting model background fields.
5. Results
We have performed three experiments: a control (CTL) where there is no feedback of
ISCCP analysis into GEOS4, an incremental bias correction experiment (EXPI) where a time

mean bias (updated every 3 hours at the analysis time step) is computed and used as forcing
on the surface energy budget, and a diurnal bias correction experiment (EXP2) where
diurnally varying biases are computed and used as forcing on the GEOS4 surface energy
budget.
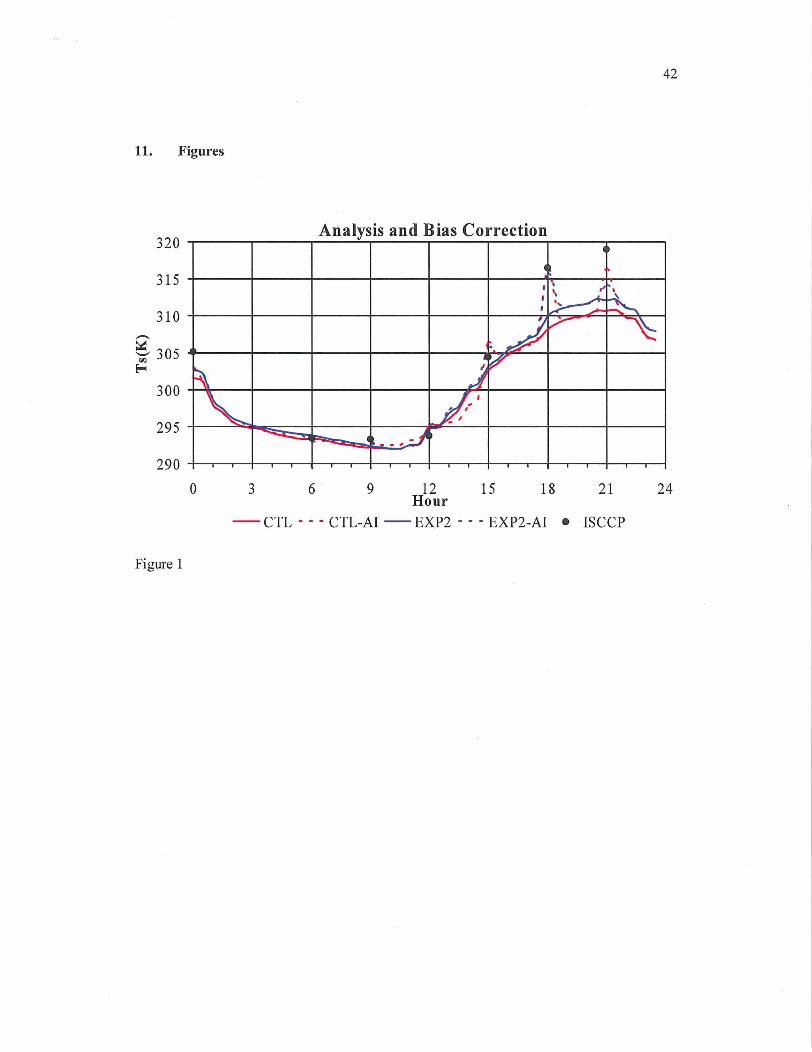
Figure 1 compares analyses with no Ts analysis increment coupled (CTL and EXP2)
and their counterparts that include both Ts bias correction and analysis increment coupled
into the surface energy budget (CTL-A1 and EXP2-AI). The curves in Figure 1 are generated
with data at every model time step at an arbitrary grid point. The analysis increment is
applied instantaneously when an observation is available, while the bias correction is applied
at all time steps. The small heat capacity of the thin surface of the model cannot retain such
large instantaneous temperature changes, and the temperature spins down to the background
state very rapidly. The bias correction is a small adjustment toward the observations each
model time step. The heat that enters or leaves the system in this way is also propagated to
the atmosphere and the subsurface through the iteration of the surface energy budget. Given
the unrealistic disruption on the time series of surface temperature (and flux terms of the
surface energy budget) from coupling the analysis increment, we will focus on the evaluation
of coupling the bias correction without the analysis increment (EXP1 and EXP2).
We present results for a one month period of July 1 - 3 1,2001. It is also important to
note that in each experiment, an uncoupled surface temperature analysis field is produced,
even in the control. The upper atmospheric assimilation is kept unchanged in all experiments,
except perhaps, for the quality control decisions which are state dependent and change from
experiment to experiment.
5.1 Analysis and Background Surface Temperature
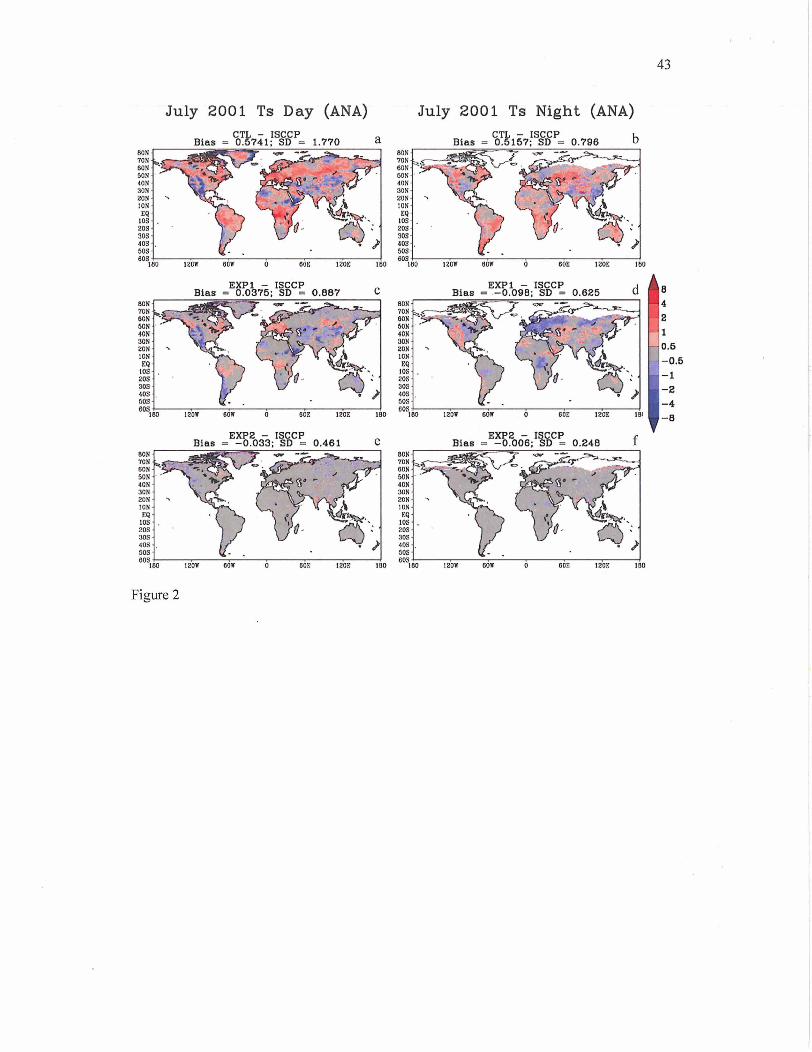
Figure 2 shows the comparison of day and night analyzed ISCCP surface
temperatures with the original ISCCP temperatures averaged for the month and only when an
15
observation is available. For the CTL experiment, this field is an analysis of the ISCCP Ts,
but it does not include a bias correction or any feedback to the physical system. For EXPI,
including coupled time mean bias correction, there is an improvement of the day and night
biases, but some residual diurnal bias is still apparent (Figure 2 c and d). These tend to be of
opposite sign. For example, in the western United States there is a cold daytime bias and a
warm nighttime bias. However, Europe shows a warm daytime bias and cold nighttime bias.
The global impact of the diurnal bias correction (EXP2) over that of the incremental bias
correction (EXP1) is not tremendous. Regionally, the diurnal residuals noted in EXPl (e.g.
Europe) have been ameliorated in EXP2, bringing the analysis temperatures in line with the
observations. The diurnal bias correction brings the analysis surface temperature regional
biases closer to the observations, accounting for biases that have opposite signs between the
day and night.
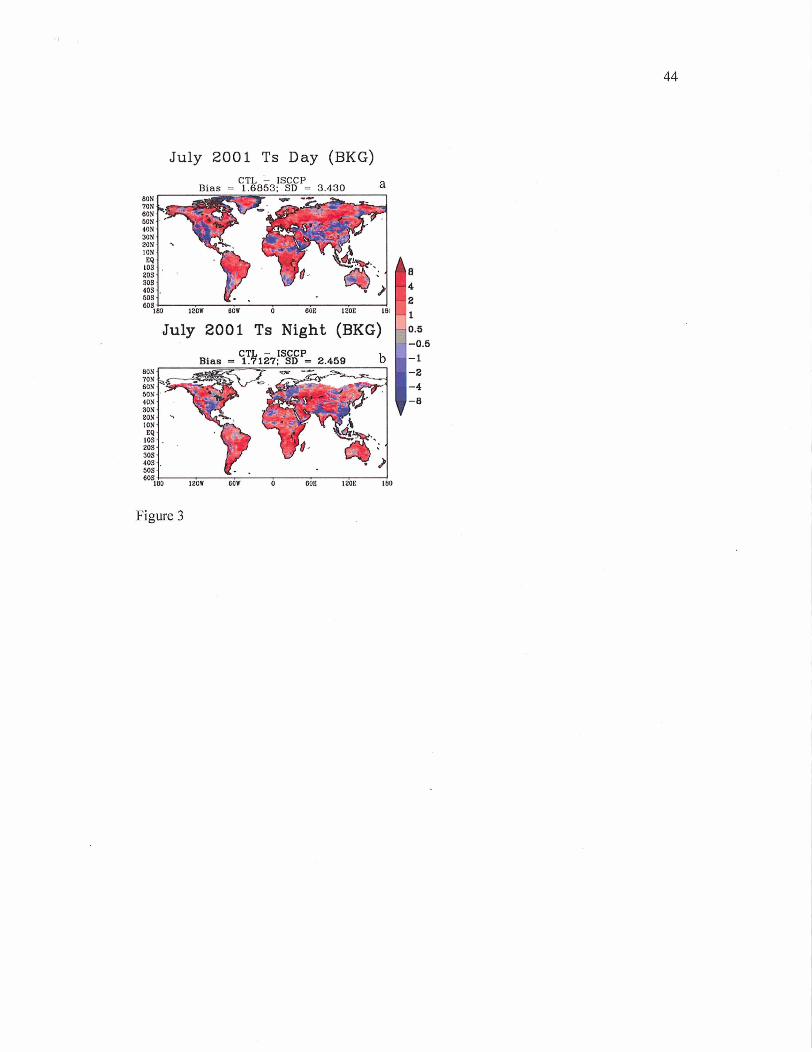
The model background fields are the forecast data that are used to calculate the
analysis increments. By coupling the bias correction to the model forecasts, we hope to
propagate the information of the observations into the physical system, which should lead to
a better background field. Figure 3 shows the day and night background Ts differences from
the ISCCP data. In the CTL experiment, there is no influence, by design, of the Ts analysis
on the background Ts, so that Figure 3 a and b show the model differences from the ISCCP
observations. The surface bias is generally warm, with some local biases reaching +8 K
warmer than the ISCCP estimates in some regions. In EXP1, the global land biases are
reduced by one third or more (Table 1). The standard deviation of the global differences is
also generally reduced. Some of the largest regional biases have improved. For example, the
Amazon River basin has a reduced warm bias (figure not shown). The warm regions are still
warm, compared to ISCCP, but the intensity of the bias is reduced. In the diurnal bias
correction experiment (EXPZ), the incremental improvement over EXPl is not apparent

compared to the remaining systematic biases (Table 1). In the next section, we will evaluate
the effect of the Ts coupled bias correction compared to independent observations.
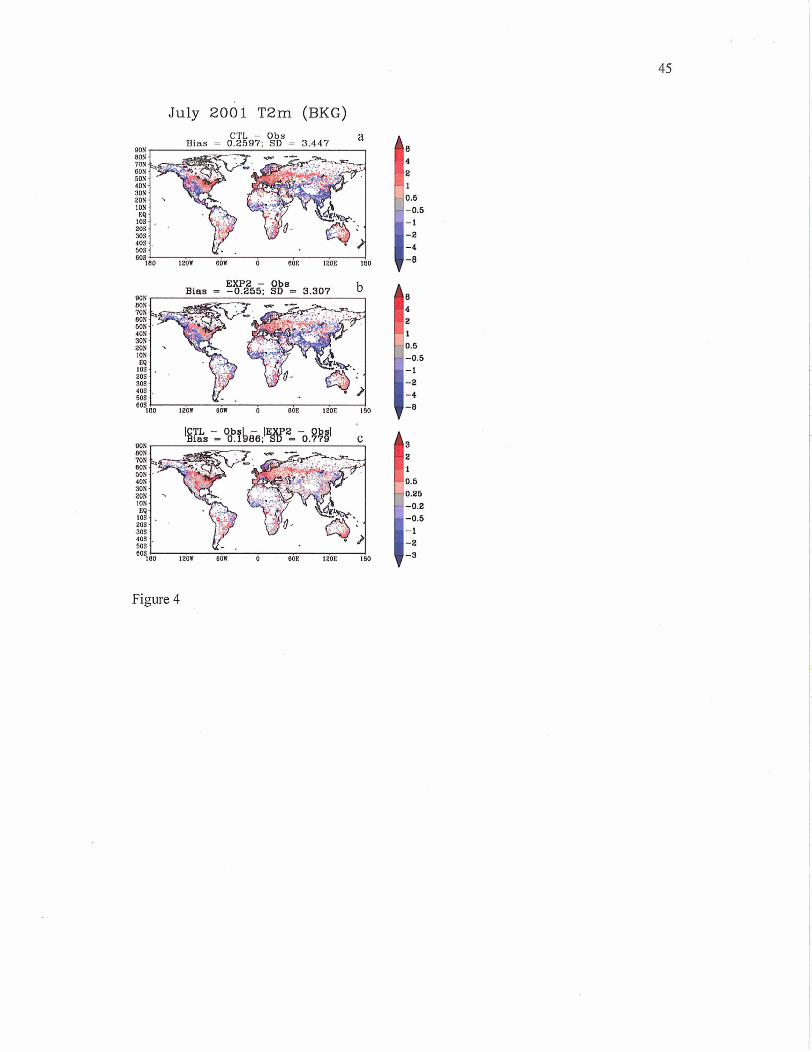
5.2 Near-Surface Air Temperature
The global network of surface meteorological observations provides an independent
data set for validation of the methodology. Figure 4 compares 2m air temperature (T2m) from
the CTL and EXP2 cases with the observed air temperature. In EXP2, regional biases are still
apparent, though their intensities are less, for example over the east coast of the United
States, Europe and western Australia. Figure 4c shows the difference of the magnitude of bias
between the experiments. Where the shading is red, the EXP2 has a smaller absolute T2m
bias than in CTL. There are many regions where the bias is improved by assimilating the
ISCCP data into the system. We can look more closely at Europe and the United States
(Figure 5) where the surface station density is typically higher than other regions. In Europe,
strong warm biases are improved (by about lK, Figure 5c) especially in the central region
with smaller improvements across the rest of the region. There are very few ISCCP
observations in and around Scandinavia (figure not shown), so that there is little impact from
the Ts assimilation. In the United States, the skin temperature bias correction leads to
simultaneous improvement of cold temperatures in the southern Great Plains states and warm
biases from the northern Great Plains through the East Coast states (Figure 4 d and f).
Intercomparing EXPl and the day and night time air temperatures only leads to the same
conclusion as discussed for the background skin temperature comparison with ISCCP (as in
Figure 3 and the previous section).
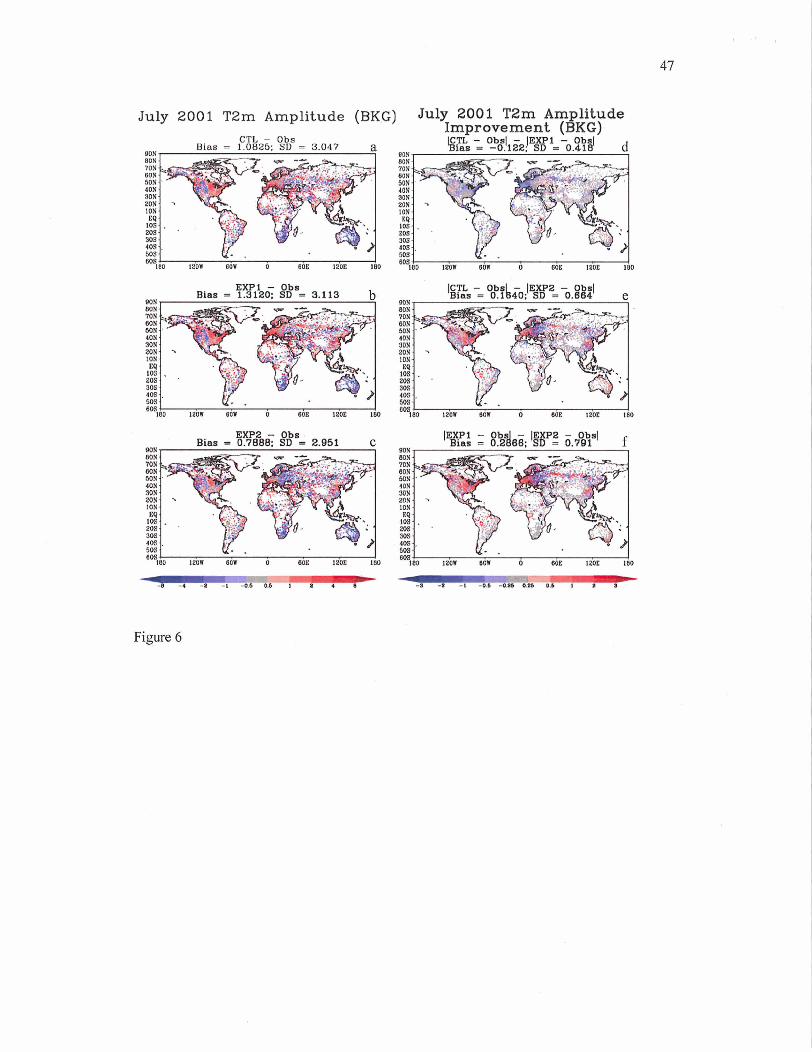
To further examine the diurnal cycle, we calculated the diurnal amplitude from the
monthly mean diurnal cycle of the background 2m air temperature and the meteorological
station air temperature. The minimum of the diurnal cycle is subtracted from the maximum to
get the amplitude over the globe. Figure 6 shows the difference of each experiment's diurnal

amplitude from the meteorological observations, as well as the improvement of the mean
amplitude biases. The CTL experiment has an amplitude that is too large compared to the
station observations (Figure 6a) including the central and eastern United States, South
America and western Europe. Small amplitudes are apparent in the southern hemisphere
(austral winter) in South Africa and Australia. In general, these same patterns hold in the
global fields of the EXPl and EXP2 differences (Figure 6 b and c). However, in comparing
the differences of each experiment, we see that EXPl makes few reductions in the bias of the
amplitude (Figure 6d) while EXP2 has smaller biases than both the CTL and EXPl cases
(Figure 6 e and f).
Figure 7 shows the comparison of the diurnal amplitude for each experiment over the
United States. For many points, the time mean bias correction (EXP1) is either ineffectual or
adversely affects the amplitude of the diurnal cycle (Figure 7 a, b and d). This is especially
noticeable in along the east coast. In contrast, the diurnal bias correction applied in EXP2
generally improves the amplitude across the continent. This is exemplified along the east
coast (Figure 7c) where the systematic high bias in the CTL experiment is effectively
removed. The high bias in the northern Great Plains is a feature that persists in all
experiments, though the diurnal bias correction (EXP2) seems to be working to reduce the
bias.
Over Europe, the amplitude of the 2m air temperature demonstrates some interesting
features (Figure 8). In western Europe, the amplitude is overestimated in CTL, while to the
east, the amplitude is slightly underestimated (Figure 8a). The diurnal bias correction
provides substantial reduction to the amplitude across the region, which is an improvement in
the west, but a degradation to the east (Figure 8c and e). On the other hand, the time mean
bias correction worsens the high bias of amplitude in west Europe, while improving the low

bias of amplitude in east Europe (Figure 8d). It is counterintuitive to expect the time mean
bias correction to improve the diurnal amplitude.
We explore this further by area averaging the temperatures and amplitudes for east
and west Europe (defined by the boxes in Figure 8f). Firstly, a disparity exists in the number
of observations during the month, i.e. there are more daytime observations than night (Table
2). Also, the CTL daytime skin temperatures are warmer than ISCCP in both regions, but the
east has a cold nighttime bias while the west is warm at night. In both regions, the EXPl time
mean bias correction acts to cool the nighttime surface, driven by the daytime warm bias.
This is not appropriate for the east Europe nighttime temperature, which is already cold and
getting colder with the time mean bias correction. However, the nighttime cooling contributes
to an increase in the eastern air temperature amplitude. In several points, this appears as an
improvement in the amplitude bias (Figure 8d), though this does not improve the area
average (Table 2b). On the other hand, EXP2 applies the bias proportionately across the
diurnal cycle, so that the daytime bias correction does not influence the nighttime
temperatures. This leads to a reduction in the daytime temperature, with only small effects on
the nighttime temperature (because the night biases are small and there are less input
observations available for assimilation). In the west, this helps the comparison of air
temperature amplitude. To the east, the EXPl time mean bias correction is more effective
because the day and night biases happen to be of the same sign. However, in a general sense,
the EXP2 with diurnal bias correction of Ts offers both an improvement in mean air
temperature bias and improvement in the diurnal amplitude of the air temperature. The global
implementation and independent validation of the method allow for the identification and
analysis of many different features.

5.3 Energy Budgets
Because the bias correction of surface temperature is integrated into the surface
energy budget and provides forcing on the budget, the terms of the surface energy budget
change by including the surface temperature observations. Figure 9 shows the mean
difference of sensible heat flux, latent heat flux and soil water between EXP2 and CTL
experiments. The sensible heat flux differences (Figure 9a, computed from every available
time interval in the analysis) generally correlate to the surface temperature differences
between the CTL experiment and ISCCP observations (Figure 3a). For example, including
the surface temperature bias correction increases sensible heat flux in the southern Great
Plains states where the CTL experiment is cold. Likewise, sensible heat flux decreases in
EXP2 across the Amazon River Basin, where CTL surface temperatures are warmer than
ISCCP. The impact on latent heat flux and soil wetness is complicated by the availability of
water for evaporation and variations in surface layer turbulence, precipitation and clouds that
occur in the system. For example, there are decreases and some increases of latent heat
between EXP2 and CTL in the Amazon, but soil moisture is generally increased. Overall, the
impact on the physical quantities appears reasonable given the CTL Ts differences from the
assimilated observations and the subsequent bias correction.
It is difficult to develop global observations of the surface energy budget terms.
Turbulent flux measurements are atypical in meteorological stations. However, the Global
Energy and Water Experiment (GEWEX) has supported several Continental-scale
Experiments (CSE's) over periods of years. These include several reference sites which have
enhanced observing capabilities, such as turbulent fluxes and radiative fluxes. The
Coordinated Enhanced Observing Period (CEOP) has compiled, processed and provided
further quality control on these observations (Bosilovich and Lawford, 2002 and Lawford et
a1 2005). The surface stations and data integration efforts are described in Koike (2004).
Figure 10 intercompares the monthly mean diurnal surface energy budget (net
radiation, Rn; Sensible heat flux, Hs; Latent heat flux, LE; Ground heat flux, Hg; and the
Bias Flux that results for the analysis of Ts, B; see also equation 5) for station observations,
CTL and EXP2. Table 3 shows the names and locations of the in-situ stations evaluated here.
The LBA Rondonia site shows some impressive improvement of the energy budget. The
Bowen ratio of sensible and latent heat fluxes is completely reversed in the CTL experiment
compared to the station data, but is much improved when including the ISSCP Ts bias
correction (Figure 10 a and b). The latent heat flux is very close to observations, and the
sensible heat is improved but still an overestimate. However, the mean peak of the net
radiation has increased to be larger than the station observations. The impact of coupling the
observations does not affect the surface energy budget greatly everywhere. The LBA Manaus
station shows a small improvement to net radiation, but the peak of latent heat flux becomes
less than observed. Also note that the Bias Flux term is smaller at Manaus than Rondonia.
At the ARM SGP site, there is little bias flux and only a small impact on the physical
terms of the surface energy budget (Figure 10 e and f). However, farther north at the BERMS
site, the bias correction leads to improved sensible heat flux, while there is little influence on
the latent heat. The CTL experiment at the BALTEX Lindberg site shows a significant
overestimation of the net radiation, which may be more related to a problem in the model
system's clouds. EXP2 shows a reduced bias in sensible heat, but it is difficult to overcome
the large bias in net radiation. At the BALTEX Cabauw site, there is a similar overestimate of
sensible heat flux in CTL, and some improvement in EXP2. However, the net radiation
overestimate in CTL is not improved with the assimilation of the observations.
Table 4 summarizes the changes in mean bias of the fluxes and meteorology due to
the diurnal bias correction at several of the CEOP reference sites. This table is intended to
broadly evaluate the impact of the temperature bias correction, as opposed to the more
detailed discussion above, against many independent observations not routinely or globally
available. It shows the mean biases for the month, as well as an indicator of the experiment's
(EXP2) change in magnitude of the bias (larger or smaller).
In general, the CTL sensible heat fluxes were overestimated, but improved in EXP2.
At many sites, the CTL 2m air temperature is too warm. On the other hand, latent heat is
generally underestimated, but the reduction of temperatures does not lend to increased
evaporation. The near-surface air is dry at many of the stations, so that the soil water maybe
concurrently too low. It is interesting to note that despite the degraded latent heat flux biases,
near-surface specific humidity shows improvement. There are mixed results from the
radiation component fluxes. There may be some feedback with the clouds and precipitation
that eventually affect these comparisons, so that all the changes noted, are not solely from the
assimilation of surface temperature. In this analysis we can also put the temperature bias (or
in this case, the bias flux, B) in context of the other errors of the surface energy budget. The
air temperature and skin temperature (or upward longwave radiation, as a proxy) are
generally improved with some cases of no effect or negative effect. It should also be
considered that these stations are representative of their nearby environment, while the global
model grid box data represents a one degree square area. In that respect, the most systematic
impact on the surface seems to be the improvement to surface temperature and sensible heat
flux, and the degradation of the latent heat flux biases.
It is worthwhile to reiterate that the corrections here are being applied to temperature
only, and no corrections are being applied directly to the moisture fields. While it may be
beneficial to use near-surface specific humidity in conjunction with the skin temperature
analysis (analogous to previous studies), assimilation of surface soil water with global
coverage concurrently with the remotely sensed surface temperature would provide a more

consistent approach. The present study was designed to test the univariate assimilation of
surface temperature into the land model's prognostic surface energy budget.
There are several sources of uncertainty that affect the surface temperature in a global
analysis system. Improved simulation of precipitation, or also the assimilation of
precipitation into the system should provide more accurate forcing for the land states (Hou et
al. 2001 and 2004; Rodell et al. 2004 a and b). In addition, downward radiation changes
between the two cases, because clouds are not constrained in the system. The assimilation of
remotely sensed cloud cover shows promise for improving the radiative forcing for the land
surface (da Silva and Norris, 2004). A multivariate assimilation and impact study would be
useful to better quantify the impact of the different parameters on the surface energy budget.
While some patterns of systematic changes in the surface energy budget due to the surface
temperature assimilation are apparent in both Table 4 and Figure 10, more stations would
refine the analysis.
6. Summary and Conclusions
Remotely sensed surface temperature is analyzed and the bias correction is
assimilated into the background model's surface energy budget. The method is validated
against the assimilated observations, as well as independent near-surface air temperature
observations. In general, the largest biases are improved by a time mean value of bias
correction. Accounting for the diurnal cycle of surface temperature bias provides further
improvement in mean near-surface air temperature, but also improved amplitude of the air
temperature. In many regions, not accounting for the diurnal cycle caused degradation of the
diurnal amplitude of background model air temperature. The diurnal bias correction was
particularly useful in improving the amplitude of the near-surface air temperature.
These results suggest that the direct assimilation of skin temperature into the surface
energy budget can improve the background model. Even with the noted improvement to the
background model, substantial bias persists for the relatively short analysis presented here. A
longer analysis, over a period of several years, could also help identify any interannual
sensitivity and feedback with the atmosphere. However, improvements to the forcing of the
surface should also provide a positive impact on the surface energy budget, such as
precipitation and radiation through cloud assimilation (e.g. Norris and Da Silva, 2006). This
should also contribute to the direct assimilation of soil water, providing some information of
the temperature bias that exists for the identified soil moisture bias (Houser et al., 1998;
Walker et al. 2004; Reichle et al. 2004; Reichle and Koster, 2005; Zhan et al. 2006).
Independent validation of land data assimilation techniques is critical to
understanding the impact of the data on the surface energy budget. Many enhanced surface
flux stations exist, but their data is provided in a unique format, and may or may not have
undergone extensive quality control measures, thereby limiting their usefulness in a global
validation. Presently, several international efforts to organize global Earth observations (such
as the World Meteorological Organizations data standards and the Global Earth Observing
System of Systems, GEOSS) are advocating international coordination of global data. CEOP
has provided a pilot study for the integration of international global observation data sets
(Koike, 2004). This paper provides a simple demonstration on how integration efforts, such
as CEOP, might improve scientific investigations. With only a few stations, some impact on
the global assimilation system is apparent. This analysis suggests that the coordination of
these enhanced observing stations can be used to evaluate global coupled land data
assimilation systems and ultimately help provide the data for further investigation of the
Earth system. The CEOP effort should continue and expand to include many more stations, in
order to support the science needed to understand the land atmosphere interactions and the
impact of land data assimilation.
Acknowledgments
This work was partially supported by NASA's Earth System Science Research using
Data and Products from TERRA, AQUA and ACRIM Satellites program. Discussions with
Paul Houser, Rolf Reichle, William Rossow, Christa Peters-Lidard and Yogesh Sud, greatly
improved the final form of this paper. System support from Jiun-dar Chern, Gi-Kong Kim
and Rob Luchessi was invaluable. Interactions with all of the CEOP contributors has greatly
improved the validation in this project, and the authors would especially like to acknowledge
the leadership of Toshio Koike, Sam Benedict, John Roads, Ken Mitchell, Hans-Joerg Isemer
and Steve Williams, without which, CEOP would not have been mature enough to support
this effort. Contributions of data and evaluation of the observations from data set providers
was invaluable to the successful completions of this study. Information on CEOP data is
available at: http://www.j oss.ucar.edu/ghp/ceopdm/.

7. References
Aires, F., C. Prigent, W.B. Rossow and M. Rothstein, 2001: A new neural network approach
including first-guess for retrieval of atmospheric water vapor, cloud liquid water path,
surface temperature and emissivities over land from satellite microwave
observations. J. Geophys. Res., 106, 14887- 14907.
Alapaty, K., N. L. Seaman, D. S. Niyogi and A. F. Hanna, 2001: Assimilating Surface Data
to Improve the Accuracy of Atmospheric Boundary Layer Simulations. J. Appl. Met.,
40,2068-2082.
Beljaars, A. C. M., P. Viterbo, M. J. Miller and A. K. Betts, 1996: The Anomalous Rainfall
over the United States during July 1993: Sensitivity to Land Surface Parameterization
and Soil Moisture Anomalies. Mon. Wea. Rev., 124, 362-383.
Betts, A. K., J. H. Ball, M. Bosilovich, P. Viterbo, Y.-C. Zhang and W. Rossow, 2003:
Intercomparison of water and energy budgets for five Mississippi subbasins between
ECMWF reanalysis (ERA-40) and NASA Data Assimilation Office fiGCM for 1990-
1999. J. Geophys. Res., 108, 861 8-doi: 10.1029/2002JD00.
Betts, A. K., J. H. Ball and P. Viterbo, 1999: Basin scale surface water and energy budgets
for the Mississippi from the ECMWF reanalysis. J. Geophys. Res., 104, 19293-19306.
Betts, A. K., P. Viterbo, A. Beljaars, H. Pan, S. Hong, M. Goulden and S. Wofsy, 1998a:
Evaluation of land-surface interaction in ECMWF and NCEP/NCAR reanalysis
models over grassland (FIFE) and boreal forest (BOREAS). J. Geophys. Res., 103,
23079-23086.
Betts, A. K., P. Viterbo and A.C.M. Beljaars, 1998b: Comparison of the Land-Surface
Interaction in the ECMWF Reanalysis Model with the 1987 FIFE Data. Mon. Wea.
Rev., 126, 186-198.
Beven, K. J. and M. J. Kirkby, 1979: A physically based variable contribution area model of
basin hydrology. Hydrol. Sci. Bull., 24,43-69.
Bloom, S. C., A. da Silva and D. Dee, 2005: Documentation and Validation of the Goddard
Earth Observing System (GEOS) Data Assimilation System Version 4. Vol. 26, NASA
Technical Memorandum 104606, NASA Goddard Space Flight Center, 165 pp.
Bonan, G. B., 1996: A land surface model (LSM version 1.0) for ecological, hydrological,
and atmospheric studies. Vol. NCARJTN-387+STR, NCAR Tech. Note, National
Center for Atmospheric Research, 150 pp.
Bosilovich, M. G. and R. Lawford, 2002: Coordinated Enhanced Observing Period (CEOP)
International Workshop. Bull. Amer. Meteor. Soc., 83, 1495-1499.
Briegleb, B. P., 1992: Delta-Eddington approximation for solar radiation in the NCAR
Community Climate Model. J. Geophys. Res., 97, 7603-76 12.
Castelli, F., D. Entekhabi and E. Caporali, 1999: Estimation of surface heat flux and an index
of soil moisture using adjoint-state surface energy balance. Water Resour. Res., 35,
31 15-3125.
Cohn, S. E., A. da Silva, J. Guo, M. Sienkiewicz and D. Lamich, 1998: Assessing the effects
of data selection with the DAO Physical-space Statistical Analysis System. Mon.
Wea. Rev., 126,2913-2926.
Crow, W. T. and W. P. Kustas, 2005: Utility of assimilating surface radiometric temperature
observations for evaporative fraction and heat transfer coefficient retrieval. Bound.-
Layer Met., 115, 105-130.
da Silva, A. and P. Norris, 2004: Assimilation of satellite cloud data into the GMAO finite
volume Data Assimilation System using variational parameter estimation. Symposium
on the 50th Anniversary of Operational Numerical Weather Prediction, College Park,
MD.

Dai, Y., X. Zeng, R. E. Dickinson, I. Baker, G. Bonan, M. Bosilovich, S. Denning, P.
Dirmeyer, P. Houser, G. Niu, K. Oleson, A. Schlosser and Z.-L. Yang, 2002: The
Common Land Model (CLM). Bull. Amer. Meteor. Soc., 84, 101 3-1 023.
Dai, Y. and Zeng, Q. C., 1996: A land surface model (IAP94) for climate studies, Part I:
Formulation and validation in off-line experiments. Adv. Atmos. Sci., 14,433-460.
Dee, D. P. and A. da Silva, 1998: Data assimilation in the presence of forecast bias. Q. J. R.
Meteorol. Soc., 124,269-295.
Dee, D. P., L. Rukhovets, R. Todling, A. M. da Silva and J. Larson, 2001: An adaptive buddy
check for observational quality control. Q. J. R. Meteorol. Soc., 127,2451-2471.
Dickinson, R. E., A. Henderson-Sellers and P. J. Kennedy, 1993: Biosphere-Atmosphere
Transfer Scheme (BATS) version l e as coupled to the NCAR Community Climate
Model. Vol. NCAR/TN-387+STR, NCAR Tech. Note, National Center for
Atmospheric Research, 72 pp.
Dickinson, R. E., G. L. Wang, X. B. Zeng and Q. R. Zeng, 2003: How does the partitioning
of evapotranspiration and runoff between different processes affect the variability and
predictability of soil moisture and precipitation. Adv. Atmos. Sci., 20,475-478.
Douville, H., P. Viterbo, J. F. Mahfouf and A. C. M. Beljaars, 2000: Evaluation of the
Optimum Interpolation and Nudging Techniques for Soil Moisture Analysis Using
FIFE Data. Mon. Wea. Rev., 128, 1733-1756.
Garand, L., 2003: Toward an integrated land-ocean surface skin temperature analysis from
the variational assimilation of infrared radiances. J. Applied Met., 42, 570-583.
Guo, J., J. W. Larson, G. Gaspari, A. da Silva and P. M. Lyster, 1998: Documentation of the
Physical-space Statistical Analysis System (PSAS) Part 11: The factored-operator
error covariance model formulation. DAO OfJice Note, 1998-2002.
Hack, J. J., 1994: Parameterization of moist convection in the National Center for
Atmospheric Research Community Climate Model (CCM2). J. Geophys. Res., 99,
5551-5568.
Holtslag, A. A. M. and B. A. Boville, 1993: Local versus nonlocal boundary-layer diffusion
in a global climate model. J. Climate, 6, 1825-1842.
Hou, A. Y., S. Q. Zhang, A. M. da Silva, W. S. Olson, C. D. Kummerow and J. Simpson,
2001: Improving Global Analysis and Short-Range Forecast Using Rainfall and
Moisture Observations Derived from TRMM and SSML Passive Microwave Sensors.
Bull. Amer. Met. Soc., 82,659-679.
Hou, A. Y., S. Q. Zhang and 0 . Reale, 2004: Variational Continuous Assimilation of TMI
and SSML Rain Rates: Impact on GEOS-3 Hurricane Analyses and Forecasts. Mon.
Wea. Rev., 132,2094-2 109.
Houser, P. R. W. J. Shuttleworth, J. S. Famiglietti, H. V. Gupta, K. H. Syed, D. C. Goodrich,
1998: Integration of soil moisture remote sensing and hydrologic modeling using data
assimilation. Water Resour. Res., 34, 3405-3420.
Jin, M., 2004: Analysis of land skin temperature using AVHRR observations, 85, Bull. Amer.
Met. Soc., 587-600.
Jin, M. L. and R. E. Dickinson, 2002: New observational evidence for global warming from
satellite, 29 (lo), Article No. 1400.
Kalnay, E. and M. Cai, 2003: Impact of urbanization and land-use change on climate. Nature,
423, 528-53 1.
Kiehl, J. T., J. J. Hack, G. B. Bonan, B. A. Boville, D. L. Williamson and P. J. Rasch, 1998:
The National Center for Atmospheric Research Community Climate Model: CCM. J.
Climate, 11, 1131-1149.

Koike, T., 2004: The Coordinated Enhanced Observing Period: an initial step for integrated
global water cycle observation. WMO Bull., 53, 1 15-12 1.
Lakshmi, V., 2000: A simple surface temperature assimilation scheme for use in land surface
models. Water Resour. Res., 36, 3687-3700.
Larson, J. W., J. Guo, G. Gaspari, A. da Silva and P. M. Lyster, 1998: Documentation of the
Physical-space Statistical Analysis System (PSAS) Part 111: The software
implementation of PSAS. DAO O&e Note, 1998-2003.
Lawford, R., 2006: The U.S. Contributions to the Coordinated Enhanced Observing Period
(CEOP). Submitted to BAMS.
Lin, S. J., 2004: A "vertically Lagrangian" finite-volume dynamical core for global models.
Mon. Wea. Rev., 132,2293-2307.
Lin, S. J. and R. B. Rood, 1996: Multidimensional Flux Form Semi-Lagrangian Transport
schemes. Mon. Wea. Rev., 124,2046-2070.
Lin, S. J. and R. B. Rood, 1997: A finite-volume integration method for computing pressure
gradient forces in general vertical coordinates. Q. J. R. Meteor. Soc., 123, 1749-1 762.
Lin, S. J. and R. B. Rood, 1997: An explicit flux-form semi-Lagrangian shallow water model
on the sphere. Q. J. R. Meteorol. Soc., 123,2531-2533.
Lin, S. J. and R. B. Rood, 1999: Development of the joint NASAINCAR General Circulation
Model. 13th Con$ on Numerical Weather Prediction, Denver, CO, American
Meteorological Society.
Mahfouf, J. F., 1991 : Analysis of soil moisture from near-surface parameters: A feasibility
study. J. Applied Met., 30, 1534-1547.
Margulis, S. A. and D. Entekhabi, 2003: Variational assimilation of radiometric surface
temperature and reference-level micrometeorology into a model of the atmospheric
boundary layer and land surface. Mon. Wea. Rev., 131, 1272-1288.
McNider, R. T., A. J. Song, D. M. Casey, P. J. Wetzel, W. L. Crosson and R. M. Rabin,
1994: Toward a Dynamic-Thermodynamic Assimilation of Satellite Surface
Temperature in Numerical Atmospheric Models. Mon. Wea. Rev., 122, 2784-2803.
Minnis, P. and M. M. Khaiyer, 2000: Anisotropy of land surface skin temperature derived
from satellite data. J. Applied Met., 39, 11 17-1 129.
Nonis, P. and A. da Silva, 2006: Assimilation of satellite cloud data into the GMAO Finite
Volume Data Assimilation System using a parameter estimation method. Part I:
Motivation and Algorithm Description , submitted to the Journal of the Atmospheric
Sciences, January 2006.
Oleson K. W., Y. Dai, and co-authors, 2004: Technical Description of the Community Land
Model (CLM). NCAR/TN-46 1 +STR.
Prigent, C., F. Aires, W. B. Rossow and A. Robock, 2005: Sensitivity of satellite microwave
and infrared observations to soil moisture at a global scale: Relationship of satellite
observations to in situ soil moisture measurements. J. Geophys. Res., 110, 4310-doi
10.1029/2002JD00.
Prigent, C., F. Aires and W.B. Rossow, 2003: Land surface skin temperatures from a
combined analysis of microwave and infrared satellite observations for an all-weather
evaluation of the differences between air and skin temperatures. J. Geophys. Res.,
108,43 10-doi 10.1029/2002JD00.
Ramanathan, V. and P. Downey, 1986: A nonisothermal emissivity and absorptivity
formulation for water vapor. J. Geophys. Res., 91, 8649-8666.
Reichle, R., R. D. Koster, J. Dong and A. A. Berg, 2004: Global soil moisture from satellite
observations, land surface models and ground data: Implications for data assimilation.
J. Hydromet., 5,430-442.
Reichle, R. H. and R. D. Koster, 2005: Global assimilation of satellite surface soil moisture
retrievals into the NASA Catchment land surface model. Geophys. Res. Lett., 32, Art
No. L02404.
Rodell, M. and co-authors, 2004: The Global Land Data Assimilation System. Bull. Amer.
Meteor. Soc., 85, 381 -394.
Rodell, M., J. S. Famiglietti, J. Chen, S. I. Seneviratne, P. Viterbo, S. Holl and C. R. Wilson,
2004: Basin scale estimates of evapotranspiration using GRACE and other
observations. Geophys. Res. Lett., 31, L20504-doi: 10.1029/2004GL02.
Rossow, W. B., A. W. Walker, D. E. Beuschel and M. D. Roiter, 1996: International Satellite
Cloud Climatology Project (ISCCP) Documentation of New Cloud Datasets.
WMO/TD-No. 73 7, World Meteorological Organization, 1 15 pp.
Rossow, W. B. and R. A. Schiffer, 1999: Advances in Understanding Clouds from ISCCP.
Bull. Amer.. Meteor. Soc., 80, 1-27.
Rossow, W. B. and R. A. Schiffer, 1991: ISCCP Cloud Data Products. Bull. Amer. Meteor.
SOC., 72,2-20.
Seneviratne, S. I., P. Viterbo, D. Luthi and C. Schar, 2004: Inferring Changes in Terrestrial
Water Storage Using ERA-40 Reanalysis: The Mississippi River Basin. J. Clim., 17,
2039-2057.
Seuffert, G., H. Wilker, P. Viterbo, M. Drusch and J. F. Mahfouf, 2004: The usage of screen-
level parameters and microwave brightness temperature for soil moisture analysis. J.
Hydromet., 5, 5 16-53 1.
Simmons, A. J. and co-authors, 2004: Comparison of trends and low-frequency variability in
CRU, ERA-40, and NCEP/NCAR analyses of surface air temperature. J. Geophys.
Res., 109, D24115-doi: 10.1 02912004JD00.
Van den Hurk, B. J. J. M, L. Jia, C. J., M. Menenti and Z. L. Li, 2002: Assimilation of land
surface temperature data from ATSR in an NWP environment - a case study. Int. J.
Remote Sensing, 23, 5193-5209.
Walker, J. P. and P. R. Houser, 2004: Requirements of a Global Near-Surface Soil Moisture
Satellite Mission: Accuracy, Repeat Time, and Spatial Resolution. Adv. Water
Resour., 27,785-801.
Walker, J. P., G. R. Willgoose and Kalma, J. D., 2002: Three-Dimensional Soil Moisture
Profile Retrieval by Assimilation of Near-Surface Measurements: Simplified Kalman
Filter Covariance Forecasting and Field Application. Wat. Resour. Res., 38, 12,
Article No. 130 1.
Wan, Z., Y. Zhang, Q. Zhang and Z-L. Li, 2004: Quality assessment and validation of the
MODIS global surface temperature. Int. J. Remote Sens., 25,261-274.
Zeng, X., M. Shaikh, Y. Dai, R. E. Dickinson and R. Myneni, 2002: Coupling of the
Common Land Model to the NCAR Community Land Model. J. Climate, 15, 1832-
1854.
Zhan, X. W. P. R. Houser, J. P. Walker, W. T. Crow, 2006: A method for retrieving high-
resolution surface soil moisture from hydros L-band radiometer and radar
observations. IEEE Trans. on Geoscience and remote Sensing, 44, 1534-1544.
Zhang, G. J. and N. A. McFarlane, 1995: Sensitivity of climate simulation to the
parameterization of cumulus convection in the Canadian Climate Centre general
circulation model. Atmos. Ocean, 33,407-446.
8. List of Tables
Table 1 Global average (land area) statistics of the comparison of monthly mean (day or
night) ISCCP surface temperature to each experiment. Bias indicates the monthly
mean difference of the global land data and SD indicates the standard deviation of the
monthly mean difference map. Units in Kelvin.
Table 2 Area averaged background temperatures for observations and each experiment in the
east (a) and west (b) Europe regions defined in Figure Sf. The columns are skin
temperature (Ts) day and night, the difference between day and night (ATs(d-n)) and
2m air temperature diurnal amplitude (monthly maximum minus monthly minimum
temperature). Units are Kelvin, except for the data counts, which are the percentage of
ISCCP data available for assimilation across the region.
Table 3 CEOP reference site locations (latitude and longitude) used in this study. The
acronyms are: Continental-scale Experiments (CSEs), Baltic Sea Experiment
(BALTEX), CEOP Asian Monsoon Project (CAMP), GEWEX Americas Prediction
Project (GAPP), Atmospheric Radiation Measurement Program (ARM) Southern
Great Plains site (SGP) and North Slope of Alaska sites (NSA), Large-Scale
Biosphere-Atmosphere Experiment in Arnazonia (LBA), Mackenzie GEWEX Study
(MAGS), and Boreal Ecosystem Research and Monitoring Sites (BERMS).
Table 4 Mean differences between (a) the experiment with ISCCP skin temperature diurnal
bias correction (EXP2), (b) the control experiment (CTL), and reference station data
from CEOP for July 2001. The variables (units) are Q2m, 2m specific humidity (g kg-
1 ); T2m, 2m air temperature (K); Ts, skin temperature (K); Rn, Net Radiation (W m-
2 ); Hs, Sensible Heat Flux (W m-2); LE, Latent Heat Flux (W m-2); Hg, Ground Heat

Flux (W mm2); Rsd, Short wave Radiation down (W mm2); Rsu, Short wave radiation up
(W m-2); Rld, Longwave Radiation Down (W m-2); Rlu, longwave radiation down (W
m-2) and B, the bias correction converted to energy flux (W m-2). In (a), if EXP2 has a
reduction in mean bias of a quantity, it is written in Bold, if the bias is worsened, it is
underlined, and if the value is written with plain text, the change considered small
(criteria are 0.1 K and g kg-', and 3 W m-2).

9. Tables
Table 1 Global average (land area) statistics of the comparison of monthly mean (day or
night) ISCCP surface temperature to each experiment. Bias indicates the monthly
mean difference of the global land data and SD indicates the standard deviation of the
monthly mean difference map. Units in Kelvin.
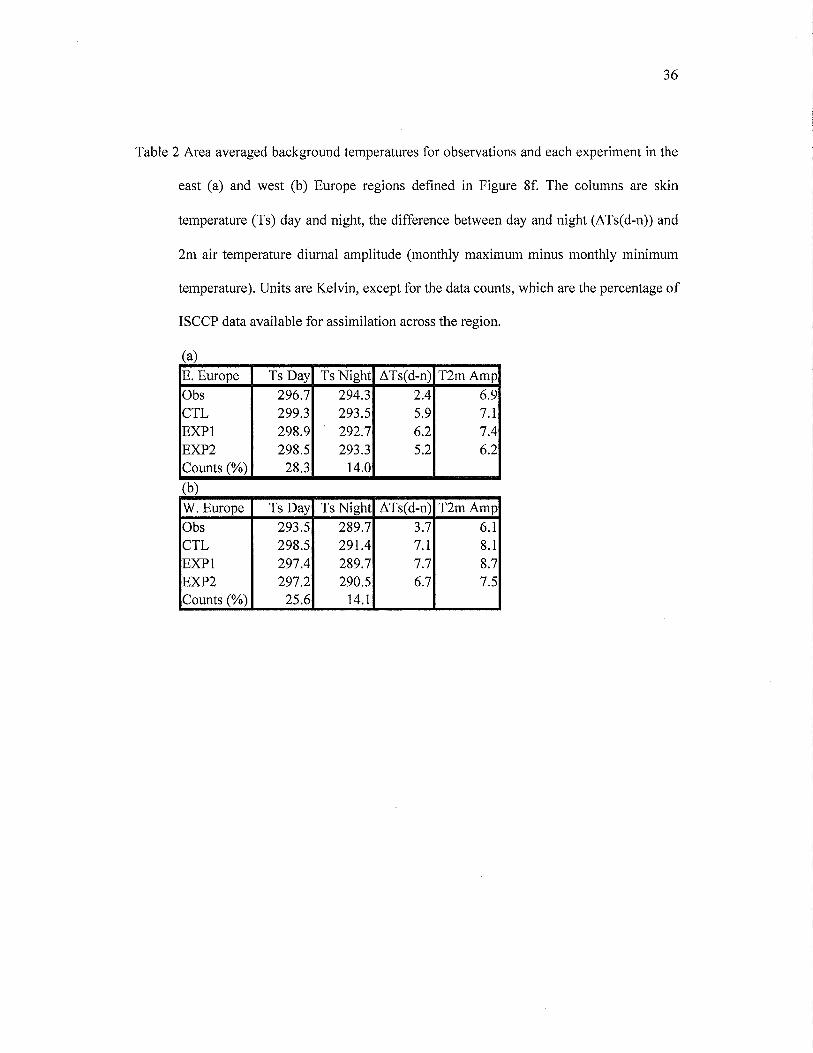
Table 2 Area averaged background temperatures for observations and each experiment in the
east (a) and west (b) Europe regions defined in Figure 8f. The columns are skin
temperature (Ts) day and night, the difference between day and night (ATs(d-n)) and
2m air temperature diurnal amplitude (monthly maximum minus monthly minimum
temperature). Units are Kelvin, except for the data counts, which are the percentage of
ISCCP data available for assimilation across the region.
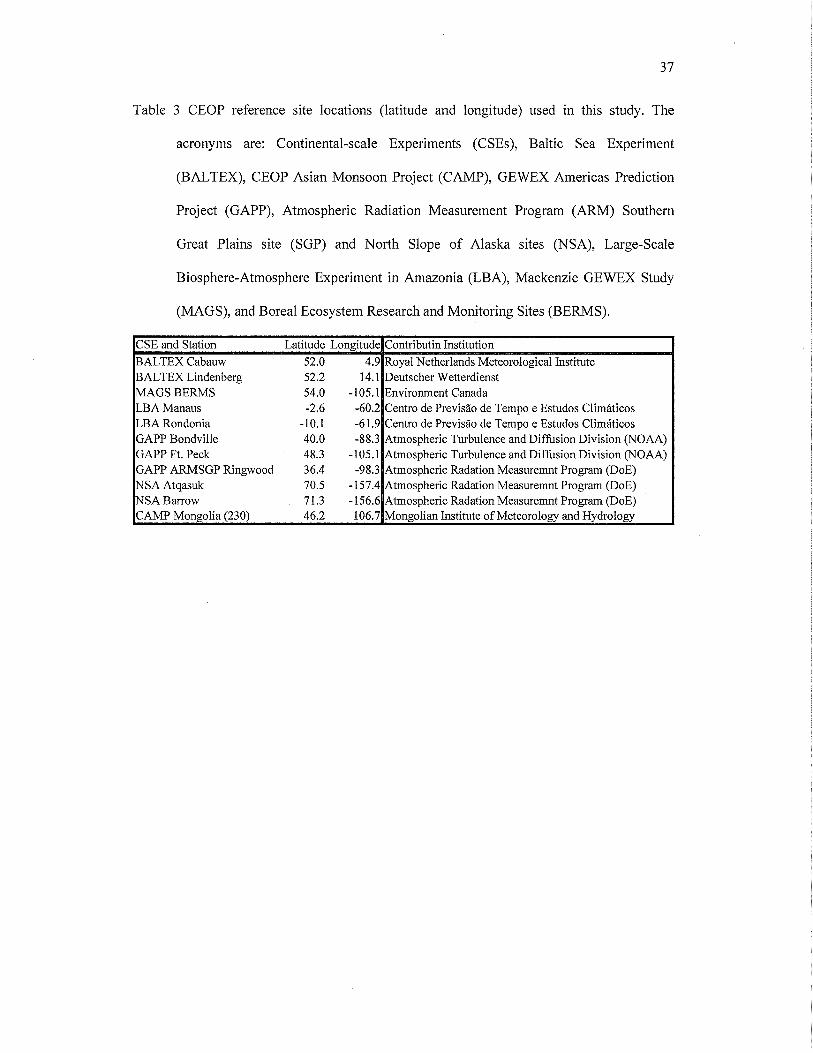
Table 3 CEOP reference site locations (latitude and longitude) used in this study. The
acronyms are: Continental-scale Experiments (CSEs), Baltic Sea Experiment
(BALTEX), CEOP Asian Monsoon Project (CAMP), GEWEX Americas Prediction
Project (GAPP), Atmospheric Radiation Measurement Program (ARM) Southern
Great Plains site (SGP) and North Slope of Alaska sites (NSA), Large-Scale
Biosphere-Atmosphere Experiment in Amazonia (LBA), Mackenzie GEWEX Study
(MAGS), and Boreal Ecosystem Research and Monitoring Sites (BERMS).
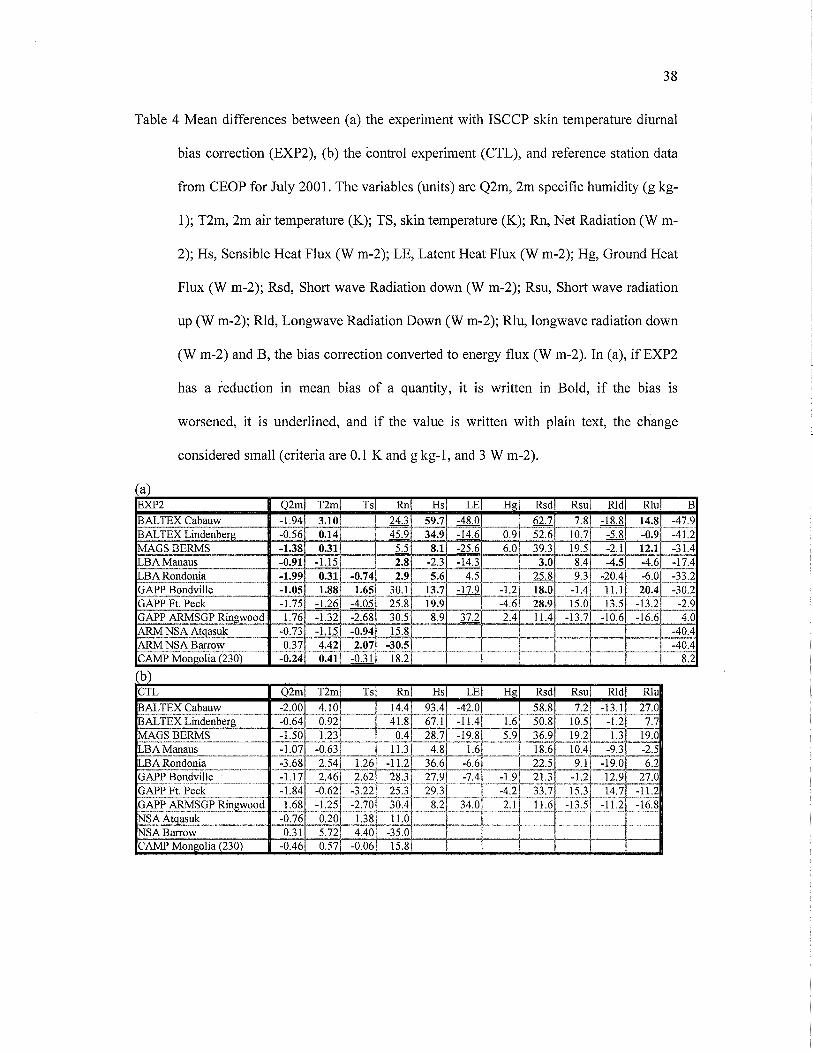
Table 4 Mean differences between (a) the experiment with ISCCP skin temperature diurnal
bias correction (EXP2), (b) the control experiment (CTL), and reference station data
from CEOP for July 2001. The variables (units) are Q2m, 2m specific humidity (g kg-
1); T2m, 2m air temperature (K); TS, skin temperature (K); Rn, Net Radiation (W m-
2); Hs, Sensible Heat Flux (W m-2); LE, Latent Heat Flux (W m-2); Hg, Ground Heat
Flux (W m-2); Rsd, Short wave Radiation down (W m-2); Rsu, Short wave radiation
up (W m-2); Rld, Longwave Radiation Down (W m-2); Rlu, longwave radiation down
(W m-2) and B, the bias correction converted to energy flux (W m-2). In (a), if EXP2
has a reduction in mean bias of a quantity, it is written in Bold, if the bias is
worsened, it is underlined, and if the value is written with plain text, the change
considered small (criteria are 0.1 K and g kg-1 , and 3 W m-2).
10. List of Figures
Figure 1 One-day cycle of surface skin temperature from a point for ISCCP observations
(black dots) and four model experiments. The CTL (red line) and EXP2 (blue line) are
the control and Diurnal Bias Correction experiments. A1 denotes experiments that
include analysis increment forcing on the surface energy. The analysis is only applied
when observations are available, while the diurnal bias correction in EXP2 is applied
at every time step. The CTL-A1 (dashed red line) adds the analysis increment into the
energy budget of the control experiment, while EXP2-A1 (dashed blue line) adds the
analysis increment into the bias corrected EXP2.
Figure 2 July 2001 monthly-mean instantaneous surface skin temperature differences (in
Kelvin) for the analysis (ANA) in day (a,c and e) and night (by d and f) of the control
(CTL) and experiments (EXP1 and EXP2) with the ISCCP observations (screened for
times when observations are available). Day and Night averages are defined by the
systems 3-hourly top of the atmosphere incoming solar radiation, for example, when
the radiation is near zero the data is averaged as night. The labels Bias and SD
indicate the area average of the mean difference and standard deviation of the mean
difference, respectively for the available data plotted in each map.
Figure 3 As in Figure 2, except for the CTL experiment background (BKG) model simulation
of surface temperature being forced by the bias correction.
Figure 4 July 2001 2m air temperature station observations compared with the CTL (a) and
EXP2 (b) experiments diagnostic output. The improvement of biases is indicated by
red shades in (c), while blue shades indicate that the bias has been exacerbated. Units
are Kelvin. White is used to identify areas that have no meteorological air temperature

in this data set, and also the ocean areas. Bias indicates the global land area difference
in the map, and SD indicates the standard deviation of the difference map.
Figure 5 As in Figure 4, except for enlarged regions of Europe (a, c and e) and the United
States (b, d, and f ) where observing stations are most dense.
Figure 6 Differences of monthly mean amplitude of the diurnal cycle of station 2m air
temperature with the experiments CTL (a), EXPl (b) and EXP2 (c). In addition, (d)
shows the improvement of mean bias of the EXPl over CTL, (e) shows the
improvement of mean bias of the EXP2 over CTL, and ( f ) shows the improvement of
mean bias for EXP2 over EXP1, where red indicates a smaller bias for EXPl in (d)
and EXP2 in (e) and ( f ) . Unit are Kelvin. White is used to identify areas that have no
meteorological air temperature in this data set, and also the ocean areas. Bias
indicates the global land area difference in the map, and SD indicates the standard
deviation of the difference map.
Figure 7 As in Figure 6, except for an enlargement of the United States.
Figure 8 As in Figure 6, except for an enlargement of Europe.
Figure 9 July 2001 mean difference between CTL and EXP2 of (a) sensible heat flux, (b)
latent heat flux and (c) soil wetness. The units are W m-2 for the fluxes and percent
fraction of saturation for soil wetness. Bias indicates the global land area difference in
the map, and SD indicates the standard deviation of the difference map.
Figure 10 Comparison of CTL and EXP2 surface energy budget terms for surface stations
contributing to CEOP. The experiment data are represented by lines and observations

41
are represented by markers, as identified in the legend in the top left corner of each
figure. See Table 3 for station locations and variable definitions. The bars in the top
right corner of each figure show the percentage of observations available during the
month of July 2001 for that station.
11. Figures
Analysis and Bias Correction
12 Hour
- - CTL-A1 -EXP2 - - - EXP2-A1 ISCCP
Figure 1
- - - - - - - - - July 2001 Ts Day (ANA) July 2001 Ts Night (ANA)
CTL - ISC P a CTL - ISC P Bias = 0.5741; SS = 1.770 Bias = 0.6157; S# = 0.786 b
EXPl - IgcCP C EXPl - IS CP Bias = 0.0375: D = 0.887 Bias = -0.098: 9% = 0.625 d /
E 2 Bias = %.0~:'8%~Po o.4t31 e Biar =E%2~~:1wE 0.248 f '
Figure 2
July 2001 Ts Day (BKG) CTL ISCCP
Bias = 1.6853: SD = 3.430 a
son 40N 30N
July 2001 Ts Night (BKG)
Figure 3
July 2001 T2m (BKG) CTL - Obs
Bias = 0.2697: SD = 3.447 8 4 2 1 0.6 -0.6 - 1 -2 -4 -8
Figure 4

July 2001 T 2 m (BKG) July 2001 T 2 m (BKG)
CTL - Obs CP - Obs 75#ias = 1.1803; SD = 2.327 Bias = 0. 210; SD = 2.552
k= L 6ON 45N 55N
40N
- Obe 60N
Bias = Eo%&a; sn = 2.240
55N SON
45N 40N 35N
30N 26N
12W l l O W 1 0 0 ~ 90W 80W 70W 60W
Figure 5
July 2001 T2m Amplitude (BKG) July 2001 T2m Am litude Improvement ( If KG)
w180 1901 WI 0 WE 121 180
Biar = 5?&8: as= 2.961 ~PZ.$(IS: 'kE ;.&?'I f
Figure 6

Julv 2001 T2m ~mpli tude (BKG) - CTL - obi Bias = 1.3136; SD = 2.672 a
July 2001 T2m Amplitude Improvement (BKG) CTL - Obsl - lEXPl - Obsl
60N bias = -0.169; SD = 0.346 d
55N
SON
46N
40N
35N
30N
26N 120W 110W lOOW 90W 80'11 '?OW 601
EXPl E 2 - Obsl Bias = 1.~101: 88'- 2.764 b 'EE-=Dbl8Lii: 'P= 0.720 e
50N SON
45N 45N
SON
25N L- 26N 120W l l O W 10bw 901 801 705' 60W 120W 1lOW 10OW 90W BOW 70W 60W
SON
25N 120W l l O W 10OW 90W 0 1 701 IOW 26N
12011 l l O W W 90W 801 70W 6( - - - 1 - 1 - Q d D -3 -1 -1 -0.8 -020 0.M
Figure 7

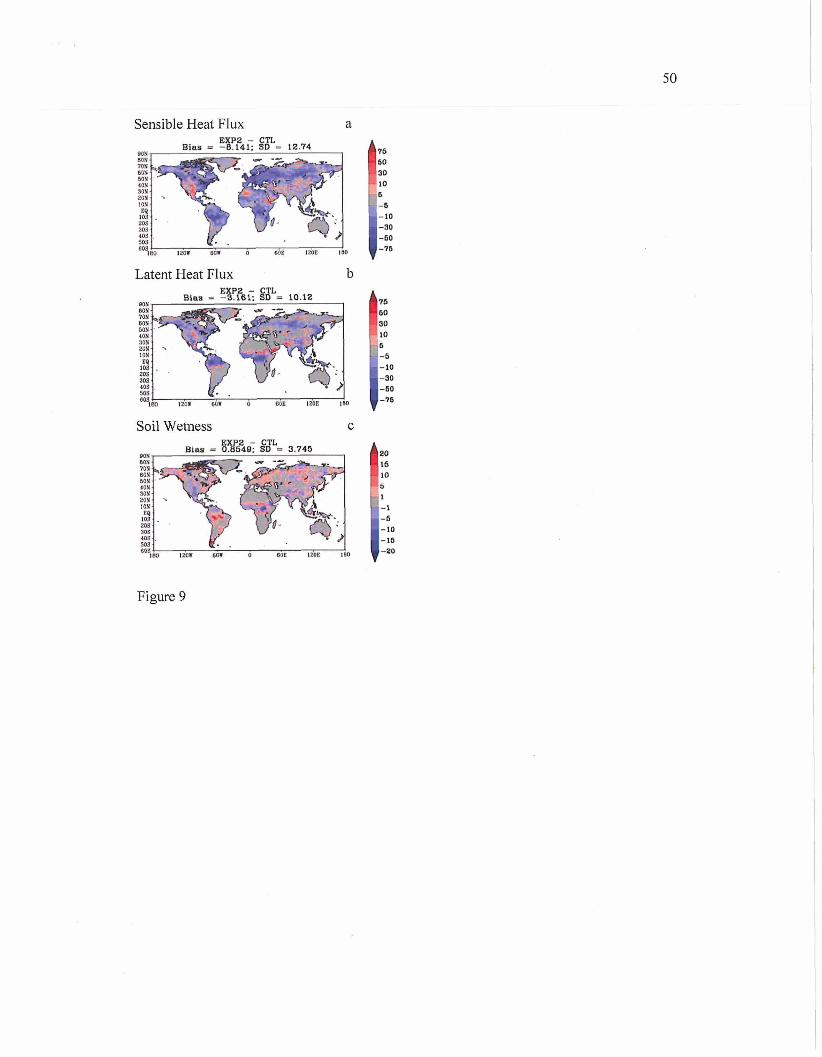
Sensible Heat Flux a
Latent Heat Flux
mu Bias = 9Fk.i:. @=. 10.12
Soil Wetness
Figure 9
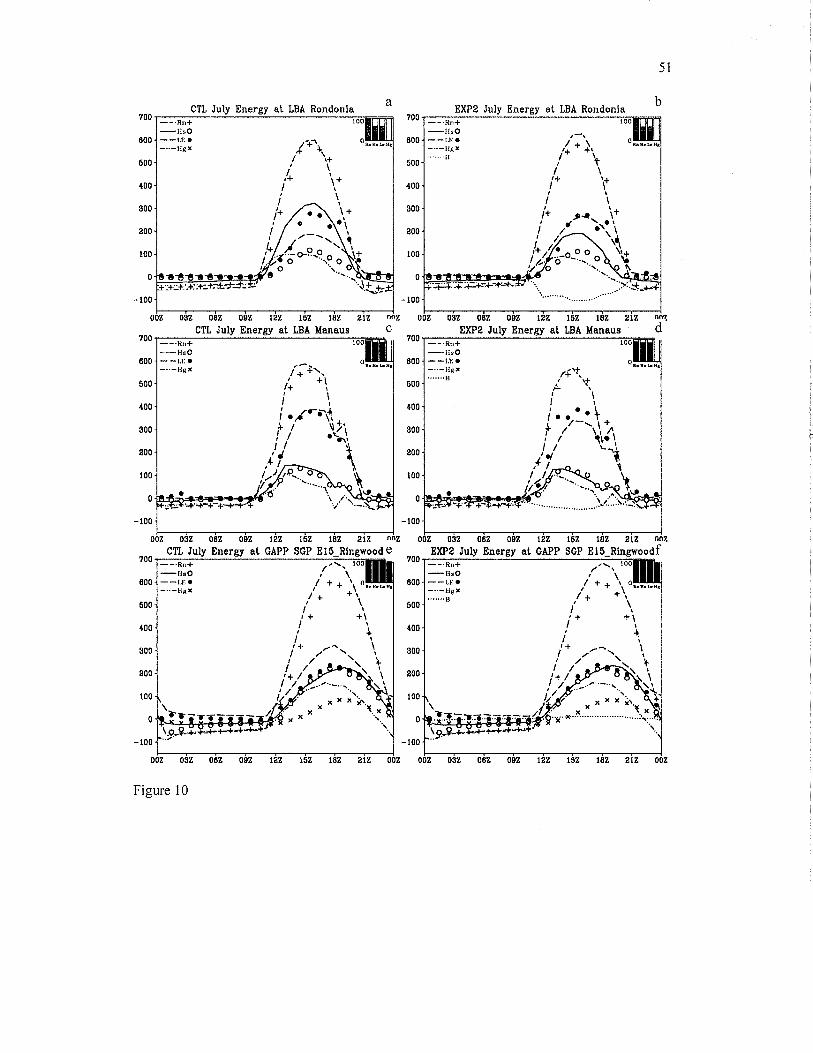
CTL July Energy at LBA Rondonia a
I I OOZ 032 08Z OIJZ 122 15Z 18Z 212 ""Z
CTL July Energy at LBA Manaus C
EXP2 July Energy at LBA Rondonia b
I I 002 03Z OBZ OW2 122 152 18Z 212 ""7
EXP2 July Energy at LEA ldanaus d
-1iso
. . . . . . . 600
CTL July Energy at GAPP SGP E15-Ringwoode EXP2 July Energy at GAPP SGP ~ 1 5 ~ ~ i n ~ w o o d f
I I I OOZ 032 08Z 09Z 122 152 18Z 212 002 OOZ 03Z 08Z OIJZ 122 15Z 18Z 212 OOZ
Figure 10

CTL July Energy at MAGS BERMS Old-Black-Spruc 700
600
EXP2 July Energy at MAGS BERMS Old-Black-Spruc 700
600
I I I I OOZ 03Z 08Z OQZ 12Z 152 18Z 212 : OOZ 032 08Z OQZ 122 152 18Z 212
CTL July Energy at BALTEX Lindenberg I EXP2 July Energy at BALTEX Lindenberg
......................... I I I
OOZ 032 06Z 082 122 152 16Z 212 OOZ 002 032 06Z 0% 122 15Z 18Z 212 OOZ
Figure 10 Cont.