a parametric study for intake flows - anasayfa
TRANSCRIPT

i
ISTANBUL TECHNICAL UNIVERSITY FACULTY OF AERONAUTICS AND ASTRONAUTICS
GRADUATION PROJECT
A PARAMETRIC STUDY FOR INTAKE FLOWS
Hasan Berk GÜÇLÜ
JULY, 2020
Thesis Advisor: Doç.Dr. Bayram ÇELİK
Department of Aeronautical Engineering
Anabilim Dalı : Herhangi Mühendislik, Bilim
Programı : Herhangi Program

ii

iii
JULY, 2020
ISTANBUL TECHNICAL UNIVERSITY FACULTY OF AERONAUTICS AND ASTRONAUTICS
GRADUATION PROJECT
Hasan Berk GÜÇLÜ
(110150046)
(110150046)
Department of Aeronautical Engineering
Anabilim Dalı : Herhangi Mühendislik, Bilim
Programı : Herhangi Program
Thesis Advisor: Doç.Dr. Bayram ÇELİK
A PARAMETRIC STUDY FOR INTAKE FLOWS

iv
Thesis Advisor : Doç.Dr. Bayram ÇELİK .............................
İstanbul Technical University
Jury Members : Prof. Dr. Mehmet ŞAHİN .............................
İstanbul Technical University
Prof. Dr. Fırat Oğuz EDİS ..............................
İstanbul Technical University
Hasan Berk Güçlü,student of ITU Faculty of Aeronautics and Astronautics student
ID 110150046, successfully defended the graduation entitled “A Parametric Study
For Intake Flows”, which he prepared after fulfilling the requirements specified in
the associated legislations, before the jury whose signatures are below.
Date of Submission : 13 July 2020
Date of Defense : 21 July 2020

v
To my family,

vi
FOREWORD
I would like to express my deepest appreciation to my supervisor, Doç.Dr. Bayram
ÇELİK.
Additionally, I would like to thank to whole lecturers of Aeronautics and Astronautics
Faculty for their valuable efforts that lead to improve my engineering perspective.
I would like to express my special thanks to Turkish Aerospace Industruies and Sergen
UYSAL for invaluable supports for this thesis.
Also, I would like to express thanks to National Center for High Performance
Computing of Turkey (UHeM) for their support
July 2020
Hasan Berk GÜÇLÜ

vii
TABLE OF CONTENTS
Page
ABBREVIATIONS ............................................................................................... ix
NOMENCLATURE ................................................................................................x
GREEK SYMBOLS.............................................................................................. xi
SUBSCRIPTS........................................................................................................ xi
SUPERSCRIPTS .................................................................................................. xi
SUMMARY ........................................................................................................... xv
ÖZ .........................................................................................................................xvi
1. INTRODUCTION ...............................................................................................1
1.1 Objective of Thesis ......................................................................................... 3
2. CHARACTERISTICS OF S-DUCT DIFFUSERS ............................................3
2.1 Pressure Recovery Coefficient (PR) ................................................................ 3
2.2 Distortion Coefficient (DC) ............................................................................ 4
2.3 Contracting Ratio (CR) ................................................................................... 6
3. COMPUTATIONAL FLUID DYNAMICS ANALYSIS ...................................6
3.1 Numerical Approach ...................................................................................... 6
3.2 Flow Solver .................................................................................................... 7
3.3 Turbulence Modelling .................................................................................... 8
4. VALIDATION STUDY ......................................................................................8
4.1 RAE M2129 model details.............................................................................. 9
4.2 Experimental study details .............................................................................10
4.3 Grid Generation .............................................................................................12
4.4 Mesh Independency .......................................................................................13
5. INLET DESIGN STUDY .................................................................................. 16

viii
5.1 Review of several Inlets .................................................................................16
5.2 Grid generation ..............................................................................................18
6. CFD ANALYSIS ............................................................................................... 21
6.1 Selected Flight Phases ...................................................................................21
6.2 Boundary Conditions .....................................................................................21
6.3 Analysis ........................................................................................................22
6.4 Results...........................................................................................................22
7. OPTIMIZATION .............................................................................................. 26
8. CONCLUSION ................................................................................................. 27
REFERENCES ..................................................................................................... 28

ix
ABBREVIATIONS
AGARD : The Advisory Group for Aerospace Research and Development
AIP : Aerodynamic interface plane
AoA : Angle of attack
ARA : Aircraft Research Association
CFD : Computational fluid dynamics
CFL : Courant number
CFR : Contracting flow ratio
CR : Contracting ratio
DC : Distortion coefficient
HMFR : High mass flow ratio
ISA : International Standard Atmosphere
NACA : National Advisory Committee for Aeronautics
NASA : National Aeronautics and Space Adminstration
PR : Pressure recovery coefficient
RAE : Royal Aircraft Establishment
RANS : Reynolds-Averaged Navier Stokes
TUI : Text user interface
UHeM : National Center for High Performance Computing of Turkey

x
NOMENCLATURE
𝐴 : Area
𝑎 : Speed of sound
𝐷 : Diameter
𝐹 : Force
𝐻 : Total enthalpy
𝐽 : Mass flux; diffusion flux
𝐿 : Duct length
L : Reference length
𝑀 : Mach number
𝑃 : Pressure
R : Gas constant
𝑅𝑒 : Reynolds Number
𝑆 : Total entropy
𝑠 : First layer thickness
𝑞 : Dynamic pressure
𝑢, 𝑣, 𝑤 : Cartesian velocity components
𝑥, 𝑦, 𝑧 : Cartesian coordinate system

xi
GREEK SYMBOLS
Angle of attack
𝛽 Sideslip angle
𝛿 Boundary layer thickness
Δ Change in a variable
∇ Nabla operator
Shear stress
Sector angle
𝛾 Ratio of specific heat
𝜇 Molecular viscosity
Sector angle
Density
SUBSCRIPTS
ℎ𝑙 Condition at engine highlight
𝑡 Local total value i. e. total pressure, 𝑃𝑡
∞ Freestream value i. e. 𝑃∞
SUPERSCRIPTS
− Mean value of component i. e. �̅�
− Time averaged component i. e. ̅
→ Vectoral quantity

xii

xiii
LIST OF TABLES
Page
Table 2.1 : Table with single row and centered columns ...........................................6
Table 4.1: Geometrical parameters for M2129 ....................................................... 10
Table 4.2: Boundary conditions for experiment DP3532 ........................................ 10
Table 4.3: Additional boundary conditions for experiment DP3532 ........................ 11
Table 4.4: Additional boundary conditions for experiment DP3532 ........................ 12
Table 4.5: Mesh details for independency study. .................................................... 13
Table 4.6: Validation study analysis results.. .......................................................... 15
Table 5.1: Properties of EJ200 turbofan.................................................................. 16
Table 5.2: Values for selected parameters.. ............................................................. 17
Table 5.3: Details of the boundary layer mesh... ..................................................... 18
Table 6.1: Details of boundary conditions for all flight phases. ............................... 21
Table 7.1: Geometrical details and predicted performance values of optimum
geometries.. ............................................................................................................ 26

xiv
LIST OF FIGURES
Page
Figure 1.1: Schematic drawing of an S-duct diffuser.Hata! Yer işareti
tanımlanmamış.
Figure 2.1: Total pressure distribution in AIP- Definition of critical sector .. ......... 5
Figure 2.2: Slices in AIP used for DC(60) calculation. ............................................ 5
Figure 4.1 : M2129 diffuser geometry.. ................................................................... 9
Figure 4.2: Structure of the mesh. ..........................................................................13
Figure 5.1: Highlight area of inlet. .........................................................................17
Figure 5.2: Isometric view of designded inlet geometry. ........................................18
Figure 5.3: Mesh structure of designed inlet.. .........................................................19
Figure 5.4: Wireframe mesh structure of designed inlet. .........................................20
Figure 6.1: Variation of the flow with lip radius. ....................................................23
Figure 6.2: Variation of seperation point with lip radius.. .......................................23

xv
A PARAMETRIC STUDY FOR INTAKE FLOWS
SUMMARY
The experimental study for RAE2129 subsonic intake model presented in AGARD
advisory report 270 was used for validation study. M2129 is a subsonic inlet model
improved for calibration of CFD codes for S duct diffuser by NASA and UK defense
ministry. AGARD report contains experimental data for high and low mass flow cases
for M2129 which is a S duct inlet. The validation study done by using high mass flow
case. Candidate intake geometries for a jet trainer are created with two geometric
parameters which are lip radius and lip relative length. CATIA V5 generative shape
design module is used to construct candidate inlet geometries. Four values are selected
for each parameter which means total sixteen geometry are created as candidate. Also,
three different flight condition selected for analysis which are take-off, cruise and max
power. Assumptions for flight conditions and geometrical measures are done by
similar jet trainer analysis. EJ200 turbofan engine is selected as reference for required
dimension about engine. ANSYS Fluent 18.2 computational fluid dynamics solver is
used for all analyses. Total 48 analyses are performed with 16 candidate geometry and
3 flight condition. Analysis are performed at National Center for High Performance
Computing of Turkey (UHeM). The effects of the geometrical parameters on the
aerodynamic performance of intake are examined via results of computational fluid
dynamics analysis. The response surface methodology is used to analyze effects of
geometrical parameters. An optimization study is performed in the light of such
information that is taken from response surface analyze. The objective function
importance of the pressure recovery and performance parameters at the takeoff flight
is increased because pressure recovery is the most important parameter and takeoff is
the most critical flight phase. Four optimum geometry is obtained via response surface
analyze.

xvi
HAVA ALIĞI İÇİN PARAMETRİK OPTİMİZASYON ÇALIŞMASI
ÖZ
AGARD 270 numaralı tavsiye raporunda yer alan RAE 2129 ses altı hava alığı
modelinin deneysel çalışma verileri kullanılarak validasyon çalışması
gerçekleştirilmiştir. M2129 modeli S şekilli difüzörler için geliştirilen hesaplamalı
akışkanlar dinamiği yazılımlarının kalibre edilebilmeleri amacıyla NASA ve Birleşik
Krallık savunma bakanlığı tarafından geliştirilen ses haltı hava alığıdır. AGARD
raporunda ‘S şekilli’ difüzöre sahip hava alığı için yüksek ve düşük kütlesel debide
olan deneysel çalışmalar yer almaktadır. Yapılan validasyon çalışmasında yüksek
kütlesel debili deneysel çalışma kullanılmıştır. Bir jet motorlu eğitim uçağı için uygun
olan hava alığı tasarımı yapılmıştır. Bu tasarımda dudak yarıçapı ve dudak bağıl
uzunluğu parametre olarak seçilmiştir. CATIA V5 yazılımının “Generative Shape
Design” modülü kullanılarak aday geometriler oluşturulmuştur. Her bir parametre için
dört farklı değer belirlenmiş ve toplamda 16 adet aday geometri oluşturulmuştur.
Ayrıca kalkış, seyir uçuşu ve maksimum güç durumu olmak üzere üç farklı uçuş
koşulu belirlenmiştir. Geometrisini tasarımı ve uçuş koşullarının belirlenmesi
sırasında yapılan varsayımlar benzer özellikteki eğitim uçaklarının incelenmesi
sonucunda yapılmıştır. EJ200 turbofan motoru, tasarım aşamasında ihtiyaç duyulan
boyut bilgilerinde kullanılmak üzere referans olarak seçilmiştir. Analizler ANSYS
Fluent 18.2 hesaplamalı akış çözücüsü kullanılarak yapılmıştır. 3 farklı uçuş koşulu ve
16 farklı aday geometri için toplamda 48 adet analiz gerçekleştirilmiştir. Tüm analizler
Ulusal Yüksek Başarımlı Hesaplama Merkezi (UHeM) kaynakları kullanılarak
gerçekleştirilmiştir. Hesaplamalı akışkan analizi araçlarıyla, parametrelerin hava alığı
aerodinamik performansı üzerindeki etkileri araştırılmıştır. Bu inceleme yanıt yüzeyi
metodolojisi kullanılarak gerçekleştirilmiştir. Analiz sonucunda elde edilen bilgiler
ışığında optimizasyon çalışması gerçekleştirilmiştir. Optimizasyon çalışması
kapsamında basınç kazanımı oranının eniyileme önemi arttırılmıştır. Benzer şekilde
kalkış durumundaki uçuş için eniyileme önemi de arttırılmıştır. Belirtilen amaç
fonksiyonları doğrultusunda 4 optimum geometri belirlenmiştir.

1
1. INTRODUCTION
Jet engines are widely used in both civil and military aviation applications because of their high
efficiency rates and high propulsion characteristics. Jet engines absorbs air from atmosphere
and process it to increase total energy. The final mixture is thrown from the exhaust to produce
required propulsion. One of the most important factors affecting the performance of these
engines is the quality of the air at the compressor face. The main purpose of air inlet is to provide
high quality air stream to the aerodynamic interface plane at specific flow conditions that jet
engine requires via slowing down freestream flow. The quality of the flow at the aerodynamic
interface plane can be measured with uniformity of the flow at that plane and total pressure loss
among inlet. [1]
Air inlets are supposed to be designed as meet the requirements for optimum engine
performance. The total pressure of the air at the aerodynamic interface plane is a crucial
parameter that directly affects the performance of a jet engine. Therefore, it is aimed by inlet
designer that as low as possible total pressure loss among inlet. Also, uniformity of flow at the
compressor face is another objective for inlet performance. In addition of these, there are some
other objectives that affect the inlet design beyond jet engine performance. Especially for
military aviation applications stealth is very important. Rotating compressor blades which are
located at the aerodynamic interface plane can be detected easily by radar system. [2] Besides,
hot sections of jet engine are easily detectable by infrared based systems. [3] Because of these
reasons, the jet engines are usually located at the inside of the aircraft body for military
applications. Another advantage for designers of this configuration is providing more space at
the wings for military instruments. It is required to use S-duct diffusers for inside body jet
engine configurations.

2
Figure 1.1: Schematic drawing of an S-duct diffuser. [4]
It is known that using S-duct diffuser causes vortex at the aerodynamic interface plane. [4]
Also, total pressure loss among the inlet will be higher with S-duct diffuser configuration
because of thicker boundary layer relatively. Emerged vortices at the aerodynamic interface
plane affect the flow locally at that plane which results as local increase or decrease at angle of
attacks of compressor blades. In case of dramatic angle of attack increase, stall may occur for
compressor blades which in turn lead to decrease in the engine performance. Also, that change
in the angle of attack causes cyclic loadings on the compressor blades which are root cause for
high-cycle fatigue problem for blades. [4] High-cycle fatigue may cause compressor blades to
failure which intemperately affects the flight performance and engine reliability. [5] Moreover,
failure at the high-speed components like compressor blades endangers passengers, air crew
and surrounding instruments. [6] So, inlet design affects not only performance and efficiency,
but also flight safety and reliability. Briefly, inlet system design and integration of propulsion
system into the aircraft are processes that must be done very precisely because of effects on the
engine performance and flight safety and reliability. The objectives of inlet system design are
minimum loss at the total pressure and uniform flow with minimum vortices possible at the
aerodynamic interface plane.

3
1.1 Objective of Thesis
In this thesis, it is aimed to analyze the effects of some selected geometrical parameters which
describes inlet geometry on the aerodynamic performance of the inlet via computational fluid
dynamics tools and conduct an optimization study for a jet trainer inlet in light of such
information.
2. CHARACTERISTICS OF S-DUCT DIFFUSERS
It is difficult to perform measurement at the compressor plane while engine is running. In
experimental studies, measurements are performed on the aerodynamic interface plane (AIP)
which is slightly forward from compressor face but has very similar flow conditions with
compressor face. [7] The most common parameters which describe the performance of the inlet
are pressure recover coefficient, distortion coefficient and mass flow rate. Also, there are
geometrical parameters that describe the inlet geometry like highlight area, throat area and
contraction ratio. The basic formulas and explanations about geometrical and performance
parameters are given in the sections below.
2.1 Pressure Recovery Coefficient (PR)
The most important performance parameter for the turbojet and turbofan engine inlet design
studies is the pressure recovery coefficient. The pressure recovery coefficient is the ratio of
total pressure of the air at aerodynamic interface plane to total pressure of freestream. Pressure
recovery coefficient is significant because it represents the loss in the total pressure among the
inlet which is an indicator for efficiency of the inlet. The aim for the inlet design is to maximize
the pressure recovery because pressure loss is an undesirable condition for optimum engine
performance. [8]

4
Also, pressure recovery coefficient directly affects thrust and the stability of the engine
compressor blades. [9] The pressure recovery coefficient will be calculated as given Equation
2.1.
𝑃𝑅 = 𝑃𝑡,𝐴𝐼𝑃
𝑃𝑡 (2.1)
2.2 Distortion Coefficient (DC)
Distortion coefficient is a parameter that represents the variation of the total pressure at the
aerodynamic interface plane. In other words, distortion coefficient is a measurement for
uniformity of the flow at the engine face. Total pressure distribution may be steady state or
time-variant. [7] High distortion coefficient values represents that the characteristics of the flow
at the aerodynamic interface plane is far away from uniformity. This condition leads to non-
uniform pressure load on the compressor blades which may cause aerodynamic stall for blades
and stability issues. [8] The aim for the inlet design is to minimize the distortion coefficient to
achieve uniform flow at the engine face. There are several forms for distortion coefficient
definition. Propulsion system manufacturers usually develops their own methods for calculation
of distortion coefficient. Although there is no consensus for distortion coefficient method, the
aim for all the definitions is to express variation of the total pressure at the aerodynamic
interface plane. The usual form of definition is given at Equation 2.2.
𝐷𝐶( ) = 𝑃𝑡,𝐴𝐼𝑃̅̅ ̅̅ ̅̅ ̅̅ ̅−𝑃𝑡,̅̅ ̅̅ ̅
𝑞𝑡,𝐴𝐼𝑃̅̅ ̅̅ ̅̅ ̅̅ (2.2)
This definition is developed by Rolls Royce and used in many applications like Tornado and
Eurofighter. [10] Numerator of the equation is the difference between mean total pressure at
the aerodynamic interface plane and mean total pressure of the worst sector, with angle at that
plane. Denominator is mean dynamic pressure of the aerodynamic interface plane which is
used for normalization of pressure difference between AIP and sector that has lowest total
pressure. It is expected that is enough to explain total pressure variation clearly. 60° is
regarded as satisfactory minimum for . Commonly used coefficient for inlet design studies is
DC(60). Besides, DC(90) and DC(120) are used. [11]

5
Figure 2.1: Total pressure distribution in AIP- Definition of critical sector .
In this study, DC(60) coefficient is used for investigate total pressure distribution at AIP.
Identical slices with 10° degrees in the AIP which are shown in the Figure 2.2 are used for easy
calculation of DC(60) for symmetrical geometry conditions. Area weighted average of total
pressure for every 10° slices are calculated. Then, average total pressure for each 60° sector,
which is 𝑃𝑡,̅̅ ̅̅ , is calculated with using average total pressures of every six neighbor slices.
Total 36 sectors are used for distortion coefficient calculation. The first sector is [0° - 60°] and
the last sector is [350° - 50°]. There are some limitations for distortion coefficient for different
applications. These limitations are shown in the Table 2.1.
Figure 2.2: Slices in AIP used for DC(60) calculation.

6
Table 2.1 : Table with single row and centered columns.
Engine Type DC(60)
Civil Subsonic Transport 0.2
Military Fighter Aircraft 0.9
Industrial, Marine and Automotive Engine Less than 0.1
2.3 Contracting Ratio (CR)
Contracting ratio is an important geometrical parameter for inlet design. It can be defined as
ratio of highlight area to aerodynamic interface plane area and it is shown with Equation 1.3.
This parameter is important to investigate engine demand because it relates directly capture
highlight area to engine area.
𝐶𝑅 = 𝐴ℎ𝑙
𝐴𝐴𝐼𝑃 (2.3)
3. COMPUTATIONAL FLUID DYNAMICS ANALYSIS
3.1 Numerical Approach
The whole calculation domain volume is discretized to simulate fluid flow. Mass (continuity),
momentum and energy conservation equations are applied to each discrete volume. Any
convergence criteria is not defined for conservation equations because defined goals like mass
flow or total pressure at AIP are monitored as convergence criteria. The continuity, momentum
and energy equations are shown in the Equations (3.1 – 3.5). [15]

7
Continuity equation:
𝜕𝜌
𝜕𝑡+ ∇ · (�⃗� ) = 0 (3.1)
where 𝜌 is density and �⃗� is velocity vector.
Momentum equations:
𝜕(𝜌𝑢)
𝜕𝑡+ ∇ · (𝑢𝑉⃗⃗⃗⃗ ⃗) = −
𝜕𝑝
𝜕𝑥+
𝜕𝑥𝑥
𝜕𝑥+
𝜕𝑦𝑥
𝜕𝑦+
𝜕𝑧𝑥
𝜕𝑧+𝑔 + 𝐹 (3.2)
𝜕(𝜌𝑣)
𝜕𝑡+ ∇ · (𝑣𝑉⃗⃗⃗⃗ ⃗) = −
𝜕𝑝
𝜕𝑦+
𝜕𝑥𝑦
𝜕𝑥+
𝜕𝑦𝑦
𝜕𝑦+
𝜕𝑧𝑦
𝜕𝑧+𝑔 + 𝐹 (3.3)
𝜕(𝜌𝑤)
𝜕𝑡+ ∇ · (𝑤𝑉⃗⃗⃗⃗⃗⃗ ) = −
𝜕𝑝
𝜕𝑧+
𝜕𝑥𝑧
𝜕𝑥+
𝜕𝑦𝑧
𝜕𝑦+
𝜕𝑧𝑧
𝜕𝑧+𝑔 + 𝐹 (3.4)
where 𝑝 is pressure, 𝜏 is shear stress and 𝐹 external body force.
Euler energy equation:
𝜕(𝜌𝐸)
𝜕𝑡+ ∇ . (�⃗� (𝜌𝐸 + 𝑝)) = −∇ . (∑ ℎ𝑗𝐽𝑗𝑗 ) + 𝑆ℎ (3.5)
3.2 Flow Solver
Pressure-Based solver is used for analysis. Coupled flow solver is selected for pressure velocity
coupling. Coupled flow solver algorithm solves the momentum and continuity equations
simultaneously instead of separately. [16] Because of that algorithm, required solving time per
iteration is higher compared to other coupling methods. [17] However, the advantage of the
coupled flow solver is that the results for conditions with compressible flow and shock waves
is more precise compared to other coupling methods. Flow conditions of inlets are usually very
similar as mentioned above. Therefore, using coupled flow solver is necessary for better results
despite more source is required. Spatial discretization schemes for all variables are adjusted as
iteration dependent. First order upwind scheme is used in the earlier iterations, then second
order upwind scheme is used for rest of the analysis. The reason for that is reduce the
convergence probability at earlier iterations.

8
3.3 Turbulence Modelling
The S duct inlet flow is challenging because of its turbulent characteristics, strong pressure
gradients and complex secondary flow. It is known that the velocity profiles at wall-fluid
interaction region have large gradients which cause to increase shear stress at the wall surface
and to decrease pressure of fluid. [18] The statistical approach named Reynolds-averaged
Navier-Stokes (RANS) proposed by Osborne Reynolds [19] is widely used for turbulence
modelling. Instantaneous quantities in the Navier-Stokes equations are converted to time
averaged and fluctuating quantities in RANS equations.
There are many developed turbulent models to simulate turbulent characteristics of the flow. It
is impossible to say that a turbulence model exist which is proper for all flow conditions. Design
and development of turbulence models are done for specific conditions. Different turbulence
models based on RANS equations are compared for internal flow at Lim, Al-Kayiem ve
Kurnia’s study. [20] The results show that k − ω SST turbulent model can predict the flow
conditions more precisely compared to other turbulent models. Prediction error decreases with
increase of Reynolds number for all turbulent models. However, the most precise results can
be got with k − ω SST turbulent model. Thus, k − ω SST is selected for turbulence modelling.
4. VALIDATION STUDY
The experimental study of AGARD (Advisory Group for Aerospace Research&Development)
published in “Air intakes for High Speed Vehicles” is used for validation study. The experiment
conducted with RAE M2129 S duct diffuser model. The details of geometry and experiment
are given in the sections below.

9
4.1 RAE M2129 model details
Figure 4.1 : M2129 diffuser geometry.
The RAE 2129 subsonic inlet model was designed within a program between NASA and the
United Kingdom defense ministry at the 1900. The aim of the project was to improve the
calibration of the CFD codes for an S duct diffuser. [13] The geometry is defined with two
equations which are centerline curve and radius, given with Equation 4.1 and Equation 4.2.
Geometry of M2129 is given with Figure 4.1.
𝑧 = 0.15𝐿 [1 − cos (𝜋𝑥
𝐿)] (4.1)
(𝑅− 𝑅𝑡
𝑅𝐴𝐼𝑃− 𝑅𝑡 ) = 3(1 −
𝑥
𝐿)4
−4(1 − 𝑥
𝐿)3
+ 1 (4.2)
M2129 model has circular cross section with varying radius all among its length. Geometrical
parameters are normalized with throat radius, 𝑅𝑡. Throat radius is equal to 6.44 cm and AIP
radius is equal to 1.18𝑅𝑡. The ratio of engine face area to throat area is, 𝐴𝐴𝐼𝑃 𝐴𝑡⁄ = 1.40. The
length of the diffuser, L, is 7.1𝑅𝑡. Detailed information about geometrical parameters that
define the M2129 are given in the Table 4.1.
10
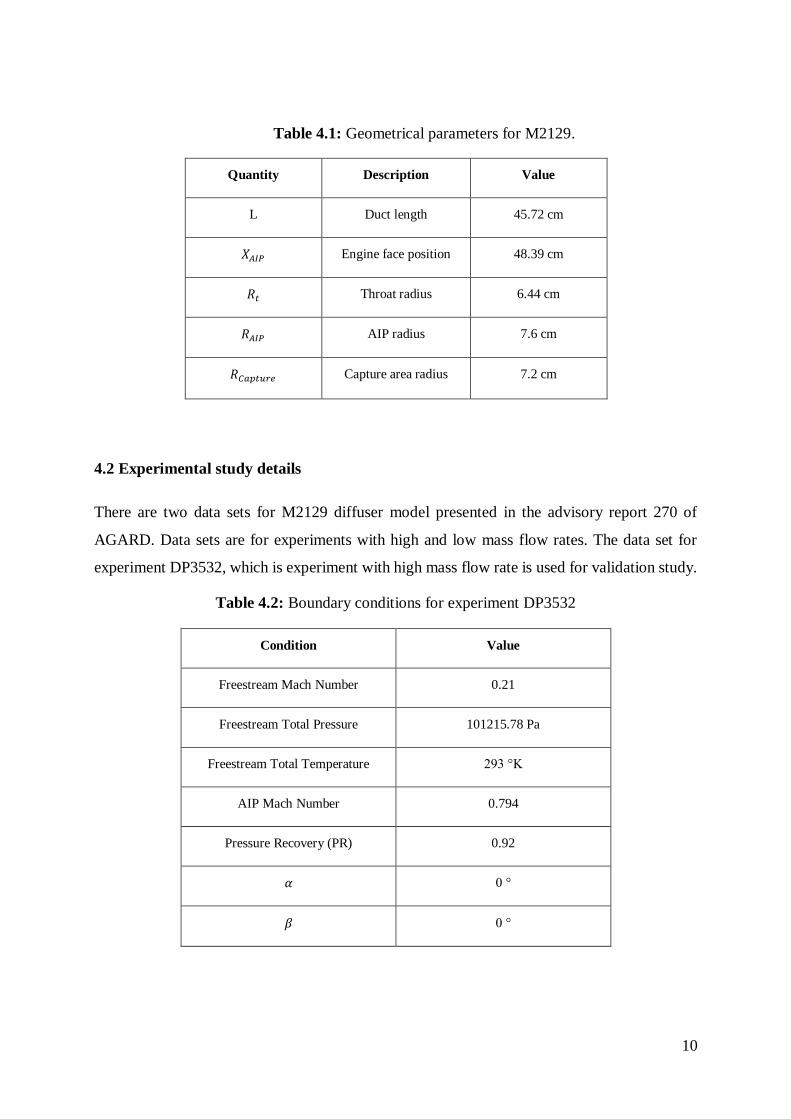
Table 4.1: Geometrical parameters for M2129.
Quantity Description Value
L Duct length 45.72 cm
𝑋𝐴𝐼𝑃 Engine face position 48.39 cm
𝑅𝑡 Throat radius 6.44 cm
𝑅𝐴𝐼𝑃 AIP radius 7.6 cm
𝑅𝐶𝑎𝑝𝑡𝑢𝑟𝑒 Capture area radius 7.2 cm
4.2 Experimental study details
There are two data sets for M2129 diffuser model presented in the advisory report 270 of
AGARD. Data sets are for experiments with high and low mass flow rates. The data set for
experiment DP3532, which is experiment with high mass flow rate is used for validation study.
Table 4.2: Boundary conditions for experiment DP3532
Condition Value
Freestream Mach Number 0.21
Freestream Total Pressure 101215.78 Pa
Freestream Total Temperature 293 °K
AIP Mach Number 0.794
Pressure Recovery (PR) 0.92
𝛼 0 °
𝛽 0 °

11
Experiments were conducted at a 13ft x 9ft wind tunnel in the RAE Bedford (UK). This wind
tunnel was designed for low speed cases and has closed circuit. [14] The experiment DP3532
was conducted with a freestream Mach number 0.21. Experiment boundary conditions given in
the AGARD report are Mach number, total pressure and temperature for freestream, pressure
recovery ratio (PR) and AIP Mach number. Boundary conditions are shown in the Table 4.2.The
boundary conditions given in the report are pretty limited. However, additional boundary
conditions that is required for computational fluid dynamics analysis can be calculated with
isentropic flow equations. Isentropic flow equations given below are used to calculate
additional boundary conditions. Additional boundary conditions are shown in the Table 4.3.
𝑃
𝑃𝑡= ( 1 +
𝛾−1
2 M2)
−𝛾
𝛾−1 (4.3)
𝑇
𝑇𝑡= ( 1 +
𝛾−1
2 M2)
−1
(4.4)
Table 4.3: Additional boundary conditions for experiment DP3532
Condition Value
Freestream Static Temperature 290.44 K
Speed of Sound at Freestream 341.61 m/s
Freestream Static Pressure 98152.27 Pa
AIP Static Temperature 277.08 K
Speed of Sound at AIP 333.66 m/s
AIP Static Pressure 77245.56 Pa
Velocity at AIP 178.84 m/s
�̇� 2.953 kg/s

12
4.3 Grid Generation
RAE M2129 is a symmetrical intake model. Half of the inlet geometry with symmetry condition
is used to reduce total computation time. A hemispherical domain is added to forward part of
the inlet. The radius of the domain hemisphere is 50𝑅𝐴𝐼𝑃. Dimension calculations are done by
using Equations (4.5 – 4.8). It is assumed that y+ value is equal to 1. Total turbulent boundary
layer thickness, 𝛿𝑡𝑢𝑟𝑏,, is found as 3.269749 mm. It is calculated that for a growth rate 1.2, 30
layers are required with a first layer thickness, Δs, 2.99705𝑥10−5mm. The details of grid that
represents the boundary layer are given in the Table 4.4.
𝑅𝑒𝑑ℎ = ∗𝑉 ∗𝑑ℎ
𝜇 (4.5)
𝛿𝑡𝑢𝑟𝑏 =0.37∗𝑑ℎ
𝑅𝑒𝑑ℎ1/5 (4.6)
𝛥𝑠 = 5.06 ∗ 𝑑ℎ ∗ 𝑦+ ∗ 𝑅𝑒𝑑ℎ−7/8
(4.7)
𝛿𝑡𝑢𝑟𝑏 = (𝛥𝑠) ∗ (1−(𝐺𝑟𝑜𝑤𝑡ℎ 𝑅𝑎𝑡𝑒)𝐿𝑎𝑦𝑒𝑟 𝑁𝑢𝑚𝑏𝑒𝑟)
1−𝐺𝑟𝑜𝑤𝑡ℎ 𝑅𝑎𝑡𝑒 (4.8)
Table 4.4: Additional boundary conditions for experiment DP3532
Property Value
𝑅𝑒𝑑ℎ 1525321.184
𝛿𝑡𝑢𝑟𝑏 3.269749 mm
𝛥𝑠 2.99705𝑥10−5mm
Growth rate 1.2
Layer number 30

13
Figure 4.2: Structure of the mesh.
4.4 Mesh Independency
Ten different meshes are created between element number 734,813 and 90,823 to determine the
point that dependency to element number is not significant. The details of the candidate meshes
for mesh independency study are given in the Table 4.5.
Table 4.5: Mesh details for independency study.
Mesh no Element Number Nodes Skewness
#1 734,813 313,281 0,80489
#2 667,603 283,420 0,81236
#3 561,292 236,845 0,79673
#4 513,896 195,065 0,79648
#5 409,483 167,341 0,79918
#6 315,406 127,478 0,82134

14
#7 250,275 100,756 0,79564
#8 186,953 76,885 0,79796
#9 131,537 55,814 0,79768
#10 90,823 39,188 0,79919
All the meshes are analyzed with identical conditions and results of analyses are visualized
which are shown with Figure 4.3. According to analysis results, it is shown that approximately
after 500,000 element number the change in the result become negligible. This element number
is normalized with AIP diameter. As result, 3281 elements are needed for an AIP diameter of 1
mm. The results of validation study are given with Table 4.6.
Figure 4.3: Relation between element number and mass flow ratio.

15
Figure 4.4: Flow at AIP- Numerical results
Table 4.6: Validation study analysis results.
Figure 4.6: RAE M2129 Mach contour at symmetry plane.
Property Experimental Result Analysis Result
PR 0.92 0.85
Mass flow (kg/s) 1.476 1.494
DC60 0.398 0.317691
Figure 4.5: Flow at AIP
Experimental results

16
5. INLET DESIGN STUDY
The aim of this study is to analyze and optimize an inlet for a jet trainer aircraft. The inlet
geometry used in this study is designed uniquely via examination of jet trainers which are
currently in operation. It is impossible to reach exact geometry details of aircrafts because of
privacy. The design details are given sections below.
5.1 Review of several Inlets
Several jet trainer aircraft are examined. The design study is based on jet trainer that has single
engine in the body with two pilots. It is seen that for jet trainer aircraft, mostly symmetrical
armpit inlet configuration is used. The advantage of using this type of inlet is providing better
inlet flow for unsymmetrical flight conditions. The cross section of capture areas varying for
each aircraft. It is assumed that capture areas are in circular form for calculation and CAD
simplicity. The EJ200 turbofan engine of Eurojet company is sufficient for the requirements of
a jet trainer. The geometrical parameters that is related with engine are referenced with EJ200
turbofan engine. Features of engine which are used for design study and analysis are given in
the Table 5.1.
Table 5.1: Properties of EJ200 turbofan.
Property Value
Compressor face diameter (AIP) 79 cm
Length 391 cm
Maximum massflow 66 kg/s
The KAI T-50 jet trainer selected as reference aircraft. It is seen that total diffuser length must
be 400 cm. There is no information about centerline of S duct diffuser. Because of that, the
form that is used for RAE M2129 centerline curve is used for inlet design. The variation in
radius among duct is selected as linear for easy drawing unlike RAE M2129. Total capture area
is approximately 0.4 𝑚2. As mentioned before, half circular capture area is used. However, it
is seen that symmetry line leads to highly sharped edges which is not proper for flow
17
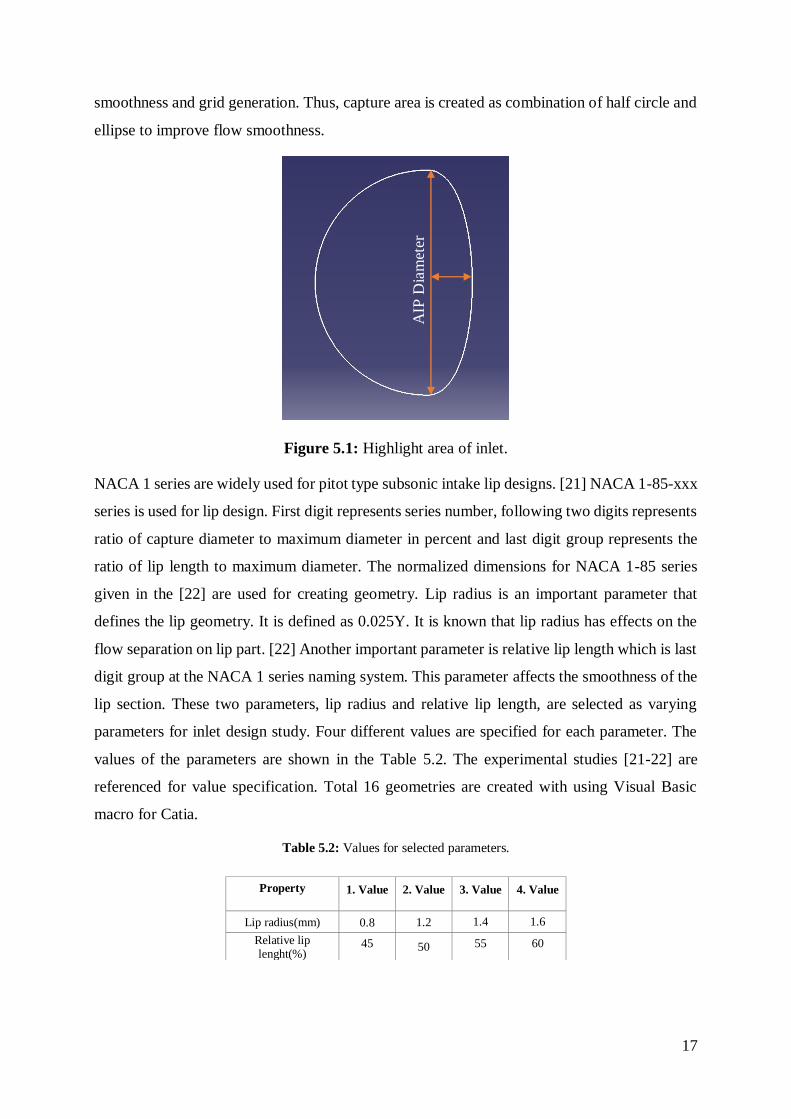
smoothness and grid generation. Thus, capture area is created as combination of half circle and
ellipse to improve flow smoothness.
Figure 5.1: Highlight area of inlet.
NACA 1 series are widely used for pitot type subsonic intake lip designs. [21] NACA 1-85-xxx
series is used for lip design. First digit represents series number, following two digits represents
ratio of capture diameter to maximum diameter in percent and last digit group represents the
ratio of lip length to maximum diameter. The normalized dimensions for NACA 1-85 series
given in the [22] are used for creating geometry. Lip radius is an important parameter that
defines the lip geometry. It is defined as 0.025Y. It is known that lip radius has effects on the
flow separation on lip part. [22] Another important parameter is relative lip length which is last
digit group at the NACA 1 series naming system. This parameter affects the smoothness of the
lip section. These two parameters, lip radius and relative lip length, are selected as varying
parameters for inlet design study. Four different values are specified for each parameter. The
values of the parameters are shown in the Table 5.2. The experimental studies [21-22] are
referenced for value specification. Total 16 geometries are created with using Visual Basic
macro for Catia.
Table 5.2: Values for selected parameters.
Property 1. Value 2. Value 3. Value 4. Value
Lip radius(mm) 0.8 1.2 1.4 1.6
Relative lip lenght(%)
45 50 55 60
AIP
Dia
met
er

18
Figure 5.2: Isometric view of designded inlet geometry.
5.2 Grid generation
It was mentioned in mesh independency study that 3281 elements are needed for an AIP
diameter of 1 mm for mesh independency. AIP diameter of designed inlet is 790 mm which is
compressor face diameter of EJ200 engine. Thus, it is seen that approximately 2,500,000
elements are needed for mesh independent results. Identical processes in the section 4.3 are
done for every candidate geometry to generate grid. The boundary layer calculations are done
with same manner. The details of the boundary layer mesh are given in the Table 5.3.
Table 5.3: Details of the boundary layer mesh.
Property Value
𝑅𝑒𝑑ℎ 5,746,271.506
𝛿𝑡𝑢𝑟𝑏 0.013000246
𝛥𝑠 4.8676E-06

19
Growth rate 1.2
Layer number 35
y+ 1
Figure 5.3: Mesh structure of designed inlet.

20
Figure 5.4: Wireframe mesh structure of designed inlet.

21
6. CFD ANALYSIS
6.1 Selected Flight Phases
Three different flight conditions are selected to create boundary conditions which are required
for computational fluid dynamics analysis. The first selected flight condition is takeoff. Takeoff
phase is quite critical for aircraft because the velocity of the aircraft is equal to stall velocity at
that phase. Also, it is critical for inlet because relatively high mass flow demand of engine must
be satisfied although freestream velocity is quite low. The second selected flight condition is
cruise. Cruise flight is critical for optimization because this flight phase is the most time
consumed phase for operation. The last selected flight condition is flight with maximum power.
It is challenging for the inlet to supply very high mass flow rate to the engine. These critic flight
conditions are selected to optimize inlet geometry for all operation conditions.
6.2 Boundary Conditions
In commercial practice, the demand of engine for a given thrust is known through information
taken from software provided by engine manufacturer. But these software are not open to public
because of privacy policy. Thus, some assumptions are done to specify boundary conditions. It
is known that Mach number at the compressor face should not exceed 0.6. [23] Assumptions are
done according to satisfy this limit. Freestream static pressure and temperatures are specified
according to ISA conditions. Flight altitude, speed and angle of attack are specified with
assumptions. The details of boundary conditions for all flight phases are shown in the Table 6.1.

22
Table 6.1: Details of boundary conditions for all flight phases.
6.3 Analysis
ANSYS Fluent 18.2 software is used for both grid generation and computational fluid dynamics
analysis. For 3 different flight conditions and 16 candidate geometries, total 48 analyses were
performed. The journal files as TUI commands were prepared for each analysis. Computing
resources used in this work were provided by the National Center for High Performance
Computing of Turkey (UHeM) under grant number 4007942020. Parallel processing was
performed via CPU’s with clock frequency 2.40 GHz. The number of CPU used for analyses
varied with workload density at UHeM.
6.4 Results
PR, DC(60) and drag force values are monitored to investigate effects of the geometrical
parameters on the aerodynamic performance of the inlet for all analyses. It is seen that lip radius
affects the vortices at AIP dominantly. Vortex structures grow with increase in lip radius. This
phenomenon is shown in the Figure 6.1.
Property Takeoff Cruise Flight Maximum Power
Altitude (m)
0 9200
7500
Flight Velocity (km/s)
225 480
1000
Flight Mach number 0.189
0.45 0.89
Angle of Attack (°) 6
0 0
Freestream Static Temperature (K) 273
220 238
Freestream Static Pressure (Pa)
AIP Mach Number 0.4
0.5 0.6

23
Figure 6.1: Variation of the flow with lip radius.
Figure 6.2: Variation of seperation point with lip radius.
24
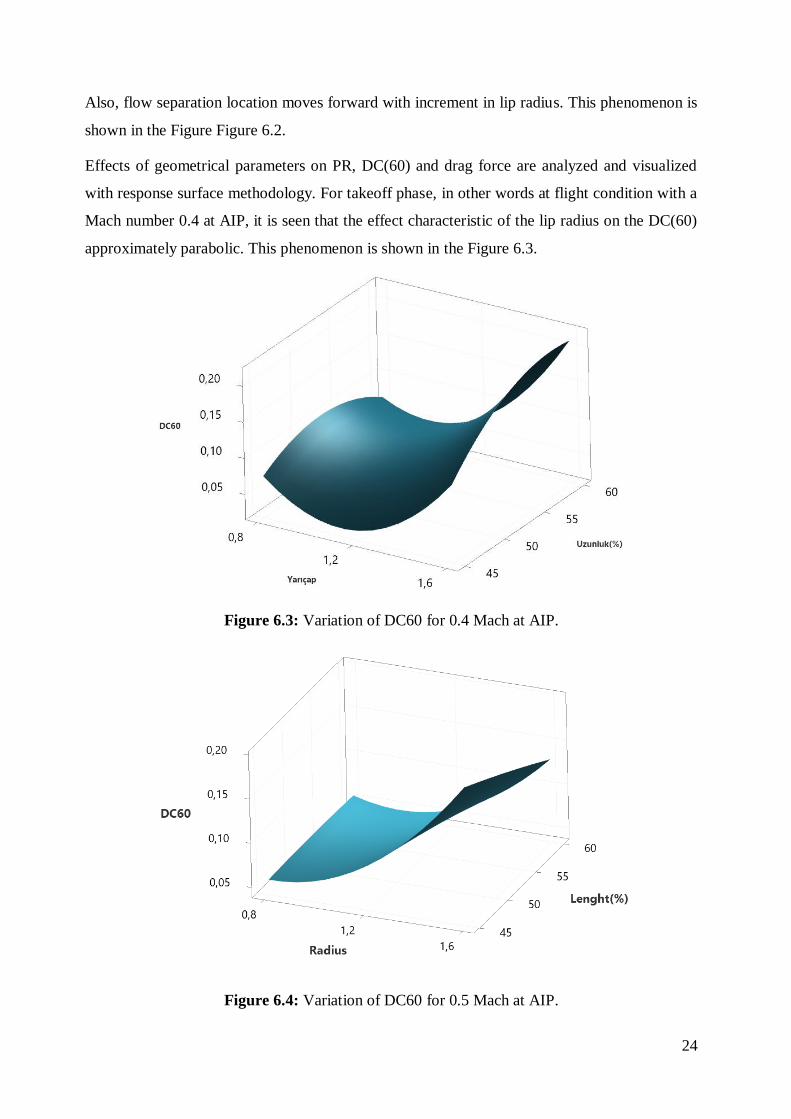
Also, flow separation location moves forward with increment in lip radius. This phenomenon is
shown in the Figure Figure 6.2.
Effects of geometrical parameters on PR, DC(60) and drag force are analyzed and visualized
with response surface methodology. For takeoff phase, in other words at flight condition with a
Mach number 0.4 at AIP, it is seen that the effect characteristic of the lip radius on the DC(60)
approximately parabolic. This phenomenon is shown in the Figure 6.3.
Figure 6.3: Variation of DC60 for 0.4 Mach at AIP.
Figure 6.4: Variation of DC60 for 0.5 Mach at AIP.

25
Figure 6.5: Variation of DC60 for 0.6 Mach at AIP.
The characteristics of this effect on the DC60 is changing with increment of Mach number at
AIP which is shown with Figure 6.4 and 6.5. Effects of geometrical parameters on PR and drag
force are approximately linear unlike DC(60).
Figure 6.6: Variation of PR for 0.4 Mach at AIP.
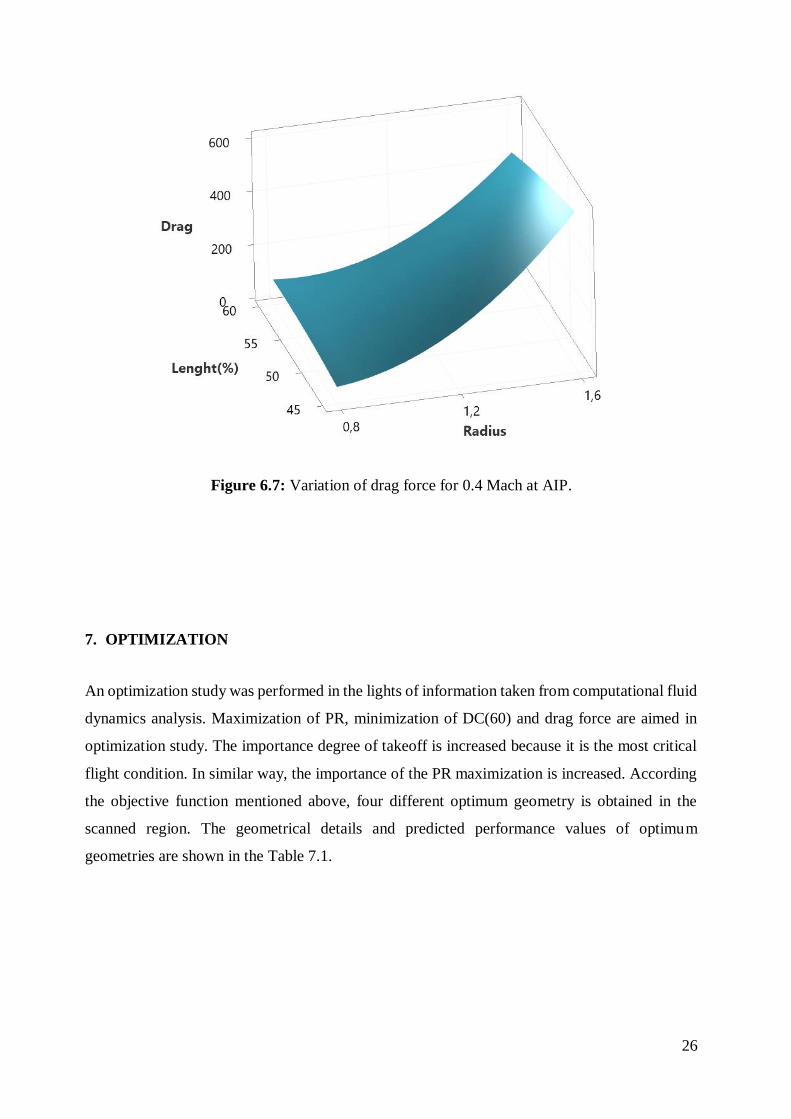
26
Figure 6.7: Variation of drag force for 0.4 Mach at AIP.
7. OPTIMIZATION
An optimization study was performed in the lights of information taken from computational fluid
dynamics analysis. Maximization of PR, minimization of DC(60) and drag force are aimed in
optimization study. The importance degree of takeoff is increased because it is the most critical
flight condition. In similar way, the importance of the PR maximization is increased. According
the objective function mentioned above, four different optimum geometry is obtained in the
scanned region. The geometrical details and predicted performance values of optimum
geometries are shown in the Table 7.1.

27
Table 7.1: Geometrical details and predicted performance values of optimum geometries.
8. CONCLUSION
In this thesis, investigation of effects of geometrical parameters on the aerodynamics
performance of the inlet for a jet trainer and optimization of inlet geometry are aimed.
Experimental study data for subsonic inlet model M2129 in the AGARD Advisory report 270 is
used for validation study. An inlet design is performed with two geometrical parameters which
are lip radius and relative lip lenght. Sixteen candidate geometry is created for optimization
study. Analyses were performed on UHeM. According to CFD results, it is seen that lip radius
affects dominantly the flow at the AIP and the starting point of seperation. An optimization study
was performed in the lights of information taken form CFD analyses with using response surface
methodology. Four optimum geometry is obtained from optimization study. Performance values
are predicted for all optimum geometries.
Optimum
Geometry
Lip Radius
(mm)
Relative
Lenght (%)
PR DC60
Drag Force (N)
#1 0.8 45 0.99 0.072 53.581
#2 0.8 60 0.9897
0.068 84.219
#3 1.18899 48.1449 0.9854 0.057 195.388
#4 1.31655 60 0.9847 0.097 211.129

28
REFERENCES
[1] Farokhi, S. (2014). The Turbojet Engine. In S. Farokhi (Author), Aircraft propulsion (pp.
153-154). Chichester: J. Wiley.
[2] Aslan, S. (2017). Experimental And Numerical Investigation Of An S-Duct Diffuser That Is
Designed For A Micro Turbojet Engine Powered Aircraft (Master's thesis). Middle East
Technical University.
[3] Mahulikar, Shripad & Gangoli Rao, Arvind & Sonawane, Dr Hemant & Prasad, H.
(2009). Infrared Signature Studies of Aircraft and Helicopters. PIERS Proceedings. 2. 26-30.
[4] Farokhi, S. (2014). Real Diffusers and Their Stall Characteristics. In Aircraft propulsion
(pp. 331-333). Chichester: J. Wiley.
[5] Yakui, Z., & Shuxiang, G. (2018). Research on the Fatigue Performance of TC6 Compressor
Blade under the CCF Effect. International Journal of Aerospace Engineering, 2018, 1-10.
doi:10.1155/2018/7154784
[6] Witek, L. (2009). Experimental Crack Propagation Analysis of the Compressor Blades
Working in High Cycle Fatigue Condition. Fatigue of Aircraft Structures, 2009(1).
doi:10.2478/v10164-010-0017-7
[7] Menzies, R. D. (2002). Investigation of S-shaped intake aerodynamics using computational
fluid dynamics (Master's thesis, University of Glasgow). Glasgow Theses Service.
[8] Akman, O. (2014). Subsonıc-Transonıc Submerged Intake Desıgn For A Cruise Missile
(Master's thesis, 2014). Middle East Technical University.
[9] T. Reynolds, Flow Control Application in a Submerged Inlet Characterized by Three-
Component LDV, Wright-Patterson Air Force Base, Ohio: Graduate School of Engineering
and Management Air Force Institute of Technology Air University, 2010.
[10] Breuer, T., & Bissinger, N. C. (2010). Basic Principles - Gas Turbine Compatibility - Gas
Turbine Aspects. Encyclopedia of Aerospace Engineering, 8.
doi:10.1002/9780470686652.eae573

29
[11] Seddon, J., & Goldsmith, E. L. (1985). Total-pressure distortion. In Intake aerodynamics:
Account of the mechanics of flow in and around the air intakes of turbine-engined and
ramjet aircraft and missiles (pp. 296-297). London: Collins.
[12] Lee, K., Lee, B., Kang, S., Yang, S., & Lee, D. (2010). Inlet Distortion Test with Gas
Turbine Engine in the Altitude Engine Test Facility. 27th AIAA Aerodynamic Measurement
Technology and Ground Testing Conference. doi:10.2514/6.2010-4337
[13] Aref, P., Ghoreyshi, M., Jirasek, A., & Satchell, M. J. (2018). CFD Validation and Flow
Control of RAE-M2129 S-Duct Diffuser Using CREATETM-AV Kestrel Simulation
Tools. Aerospace, 5(1), 31. doi:10.3390/aerospace5010031
[15] ANSYS Fluent User Manual
[16] ANSYS Fluent User's Guide, Section 18.4.3, Pressure-Velocity Coupling
[17] Kelecy, F. (2008). Coupling Momentum and Continuity Increases CFD Robustness.
ANSYS Advantage, II(2), 49-51.
[18] Martin, S., & Bhushan, B. (2016). Fluid flow analysis of continuous and segmented
riblet structures. RSC Advances, 6(13), 10962-10978. doi:10.1039/c5ra20944g
[19] Reynolds, O. (1895). IV. On the dynamical theory of incompressible viscous fluids and the
determination of the criterion. Philosophical Transactions of the Royal Society of London.
(A.), 186, 123-164. doi:10.1098/rsta.1895.0004
[20] Lim, D. C., Al-Kayiem, H. H., & Kurnia, J. C. (2018). Comparison of different turbulence
models in pipe flow of various Reynolds numbers. AIP Conference Proceedings, 2035.
doi:10.1063/1.5075553
[21] Re, R. J., & Abeyounis, W. K. (1996). A Wind Tunnel Investigation of Three NACA 1-
Series Inlets at Mach Numbers Up to 0.92. NASA Technical Memorandum.
[22] Re, R. J. (1975). An Investigation of Several NACA 1-Series Inlets at Mach Numbers
From 0.4 to 1.29 for Mass-Flow Ratios Near 1.0. NASA Technical Memorandum.

30
[23] Aref, P., Ghoreyshi, M., Jirasek, A., & Satchell, M. J. (2018). CFD Validation and
Flow Control of RAE-M2129 S-Duct Diffuser Using CREATETM-AV Kestrel Simulation
Tools. Aerospace, 5(1), 31. doi:10.3390/aerospace5010031