a parametric study on the axial behaviour of elastomeric ... · pdf filea parametric study on...
TRANSCRIPT
ORIGINAL RESEARCH PAPER
A parametric study on the axial behaviour of elastomericisolators in multi-span bridges subjected to horizontalseismic excitations
E. Tubaldi1 • S. A. Mitoulis2 • H. Ahmadi3 • A. Muhr3
Received: 1 October 2015 /Accepted: 28 January 2016 / Published online: 19 February 2016� The Author(s) 2016. This article is published with open access at Springerlink.com
Abstract This paper investigates the potential tensile loads and buckling effects on
rubber-steel laminated bearings on bridges. These isolation bearings are typically used to
support the deck on the piers and the abutments and reduce the effects of seismic loads and
thermal effects on bridges. When positive means of fixing of the bearings to the deck and
substructures are provided using bolts, the isolators are exposed to the possibility of tensile
loads that may not meet the code limits. The uplift potential is increased when the bearings
are placed eccentrically with respect to the pier axis such as in multi-span simply supported
bridge decks. This particular isolator configuration may also result in excessive com-
pressive loads, leading to bearing buckling or in the attainment of other unfavourable limit
states for the bearings. In this paper, an extended computer-aided study is conducted on
typical isolated bridge systems with multi-span simply-supported deck spans, showing that
elastomeric bearings might undergo tensile stresses or exhibit buckling effects under
certain design situations. It is shown that these unfavourable conditions can be avoided
with the rational design of the bearing properties and in particular of the shape factor,
which is the geometrical parameter controlling the axial bearing stiffness and capacity for a
& S. A. [email protected];http://www.mitoulis.com
1 Department of Civil and Environmental Engineering, Imperial College London, London, UK
2 Department of Civil and Environmental Engineering, Faculty of Engineering and PhysicalSciences, University of Surrey, Guildford, Surrey GU2 7XH, UK
3 Tun Abdul Razak Research Centre (TARRC), Brickendonbury, Brickendon Lane, Hertford, UK
123
Bull Earthquake Eng (2016) 14:1285–1310DOI 10.1007/s10518-016-9876-9
given shear stiffness. Alternatively, the unfavourable conditions could be reduced by
reducing the flexural stiffness of the continuity slab.
Keywords Bridges � Seismic isolation � Steel-laminated elastomeric bearings � Tensilestress � Buckling � Shape factor
1 Introduction
Seismic isolation with rubber-steel laminated bearings is used extensively in contemporary
bridge engineering as a means of mitigating the effect of earthquake loads by reducing the
forces transmitted to the substructures (Lee et al. 2001; Chen and Duan 2003; Tubaldi and
Dall’Asta 2011). Bridge isolation bearings are designed mainly to sustain the compressive
loads, transmitted from the deck, while accommodating horizontal and rotational deflec-
tions. However, under some design situations they may be exposed to the possibility of
uplift and to tensile loads during an earthquake. These loadings may be induced by the
seismic motion of the deck along the longitudinal (Mitoulis 2014) and/or the transverse
direction of the bridge (Katsaras et al. 2009), when the bearings are fixed to the super-
structure and the substructures through bolted connections, as often suggested by seismic
codes (EN1337-3 2005; EN15129 2009). The occurrence of tensile forces in isolation
bearings has been reported in many reconnaissance surveys such as those following the
2011 Tohoku earthquake (Buckle et al. 2012) and also in experimental shaking-table tests
on isolated structures, as discussed in Yang et al. (2010).
Rubber-steel laminated bearings are vulnerable to tensile loads. In fact, it has long been
known that hydrostatic tensile stress causes internal local ruptures in the rubber known as
cavitation (Gent and Lindley 1959; Gent 1990; Pond 1995; Dorfmann and Burtscher 2000).
Void nucleation and the growth of microcavities in rubber is a complex process that
involves breakage of bonds in the polymer network, fracture of filler clusters and
detachments of rubber chains from reinforcing particles. While in compression the rubber
can easily withstand high pressures without exhibiting damage (Gent 1990), the tensile
stresses, at which cavitation initiates, are very low. According to Gent and Lindley (1959),
cavitation occurs at a negative pressure of about 2.5 G, where G is the shear modulus of the
bearing, obtained experimentally from testing at moderate shear strain (between 100 and
200 %) under nominal axial loads (Kumar et al. 2014). The load deformation of the
isolators under pure tensile loads has been described by Constantinou et al. (2007) and
Warn et al. (2007). Yang et al. (2010) tested bearings that had a shear modulus of
0.55 MPa under pure tensile loads and identified that the bearings exhibit cavitation when
the tensile strains exceeded 1.0 % (corresponding to tensile stress between 1 and 2 MPa).
The potential of bearing uplift, i.e. tension, is also evident throughout most bridge design
codes (AASHTO 2012; CalTrans 1999; EN1998-2 2005; JRA 2002), providing rules to
limit the likelihood of occurrence.
In order to adequately describe the behaviour of laminated rubber-steel isolation
bearings in bridges, accurate models are required, which are capable of simulating the
response under a combined state of stress following the imposition of shear and vertical
loadings. Kumar et al. (2014) recently developed models for describing the combined
axial, rotational, and shear response of different types of laminated steel-rubber bearings,
including low damping rubber bearings, high-damping rubber bearings, and lead rubber
1286 Bull Earthquake Eng (2016) 14:1285–1310
123
bearings. The proposed models have been implemented in OpenSees (McKenna et al.
2006) and can simulate the coupling of vertical and horizontal deflection, cavitation and
post-cavitation behaviour in tension and strength degradation in cyclic tensile loading due
to cavitation.
This study analyses the potential of occurrence of tensile failure or of other limit states
related to bearing performance (EN15129 2009; EC8-2 2005; EN1337-3 2005) in multi-
span simply supported bridges having steel-rubber laminated bearings placed eccentrically
with respect to the vertical axis of the piers. This type of bridge configuration may be
particularly vulnerable to bearing failure due to excessive axial loads (Mitoulis 2014). In
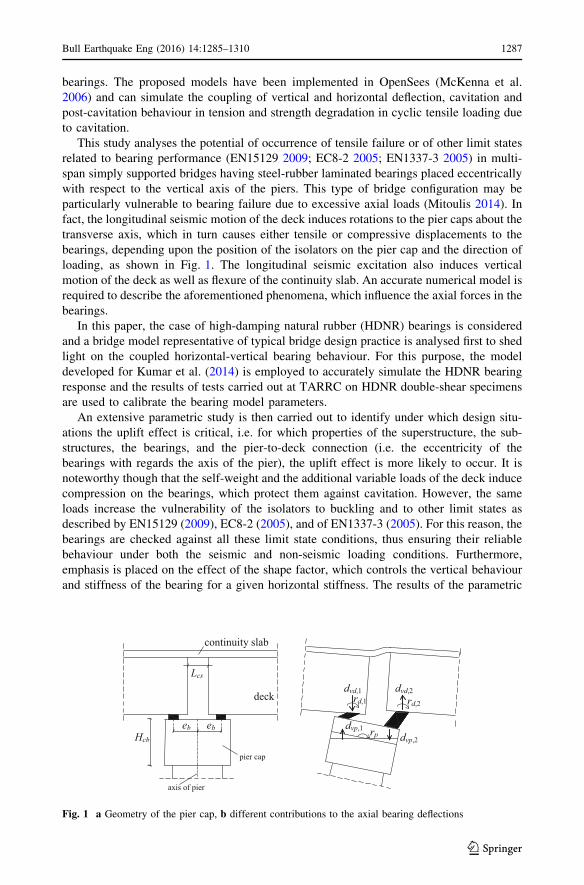
fact, the longitudinal seismic motion of the deck induces rotations to the pier caps about the
transverse axis, which in turn causes either tensile or compressive displacements to the
bearings, depending upon the position of the isolators on the pier cap and the direction of
loading, as shown in Fig. 1. The longitudinal seismic excitation also induces vertical
motion of the deck as well as flexure of the continuity slab. An accurate numerical model is
required to describe the aforementioned phenomena, which influence the axial forces in the
bearings.
In this paper, the case of high-damping natural rubber (HDNR) bearings is considered
and a bridge model representative of typical bridge design practice is analysed first to shed
light on the coupled horizontal-vertical bearing behaviour. For this purpose, the model
developed for Kumar et al. (2014) is employed to accurately simulate the HDNR bearing
response and the results of tests carried out at TARRC on HDNR double-shear specimens
are used to calibrate the bearing model parameters.
An extensive parametric study is then carried out to identify under which design situ-
ations the uplift effect is critical, i.e. for which properties of the superstructure, the sub-
structures, the bearings, and the pier-to-deck connection (i.e. the eccentricity of the
bearings with regards the axis of the pier), the uplift effect is more likely to occur. It is
noteworthy though that the self-weight and the additional variable loads of the deck induce
compression on the bearings, which protect them against cavitation. However, the same
loads increase the vulnerability of the isolators to buckling and to other limit states as
described by EN15129 (2009), EC8-2 (2005), and of EN1337-3 (2005). For this reason, the
bearings are checked against all these limit state conditions, thus ensuring their reliable
behaviour under both the seismic and non-seismic loading conditions. Furthermore,
emphasis is placed on the effect of the shape factor, which controls the vertical behaviour
and stiffness of the bearing for a given horizontal stiffness. The results of the parametric
rp
deck
axis of pier
ebeb dvp,1
continuity slab
rd,1dvd,1
Lcs
Hcb
pier cap
rd,2
dvd,2
dvp,2
Fig. 1 a Geometry of the pier cap, b different contributions to the axial bearing deflections
Bull Earthquake Eng (2016) 14:1285–1310 1287
123
study provide useful information on the sensitivity of the uplift mechanism to the prop-
erties of the bridge and the bearing and sheds light on the most critical limit states of
eccentrically-placed bearings.
2 Bridge modelling and seismic input
2.1 Description of the reference bridge
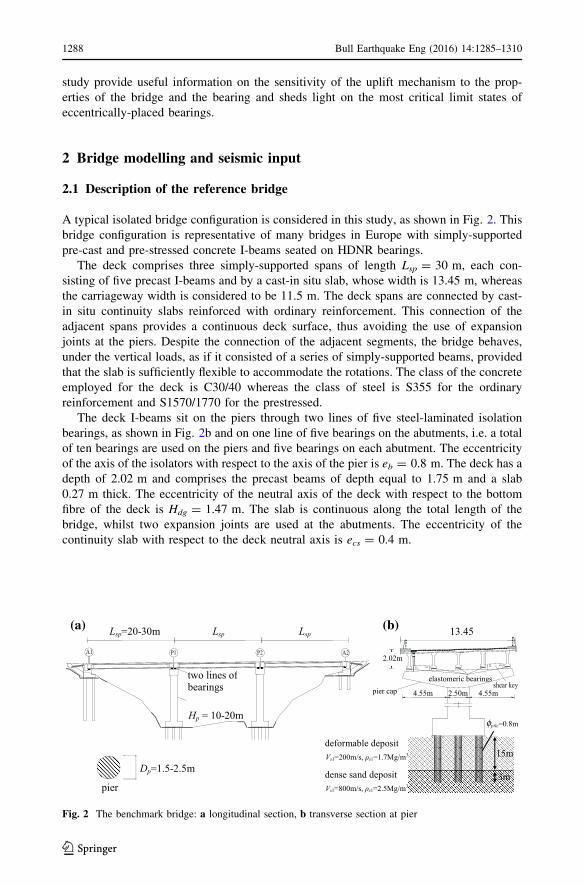
A typical isolated bridge configuration is considered in this study, as shown in Fig. 2. This
bridge configuration is representative of many bridges in Europe with simply-supported
pre-cast and pre-stressed concrete I-beams seated on HDNR bearings.
The deck comprises three simply-supported spans of length Lsp = 30 m, each con-
sisting of five precast I-beams and by a cast-in situ slab, whose width is 13.45 m, whereas
the carriageway width is considered to be 11.5 m. The deck spans are connected by cast-
in situ continuity slabs reinforced with ordinary reinforcement. This connection of the
adjacent spans provides a continuous deck surface, thus avoiding the use of expansion
joints at the piers. Despite the connection of the adjacent segments, the bridge behaves,
under the vertical loads, as if it consisted of a series of simply-supported beams, provided
that the slab is sufficiently flexible to accommodate the rotations. The class of the concrete
employed for the deck is C30/40 whereas the class of steel is S355 for the ordinary
reinforcement and S1570/1770 for the prestressed.
The deck I-beams sit on the piers through two lines of five steel-laminated isolation
bearings, as shown in Fig. 2b and on one line of five bearings on the abutments, i.e. a total
of ten bearings are used on the piers and five bearings on each abutment. The eccentricity
of the axis of the isolators with respect to the axis of the pier is eb = 0.8 m. The deck has a
depth of 2.02 m and comprises the precast beams of depth equal to 1.75 m and a slab
0.27 m thick. The eccentricity of the neutral axis of the deck with respect to the bottom
fibre of the deck is Hdg = 1.47 m. The slab is continuous along the total length of the
bridge, whilst two expansion joints are used at the abutments. The eccentricity of the
continuity slab with respect to the deck neutral axis is ecs = 0.4 m.
pier
two lines ofbearings
Hp = 10-20m
Lsp=20-30m Lsp Lsp
pile=0.8m
4.55m 4.55m2.50m
deformable depositVs1=200m/s, ρs1=1.7Mg/m3
dense sand depositVs1=800m/s, ρs1=2.5Mg/m3
13.45
Dp=1.5-2.5m15m
3m
(a) (b)
elastomeric bearings
2.02m
φ
pier cap
Fig. 2 The benchmark bridge: a longitudinal section, b transverse section at pier
1288 Bull Earthquake Eng (2016) 14:1285–1310
123
The piers are circular solid sections with diameter Dp = 2.5 m. The height of the pier
Hp is equal to 10 m. The cap beam of the pier has a depth of 1.5 m. The longitudinal
dimension of the cap beam is equal to the diameter of the pier plus 0.5 m, the transverse
dimension is 5 m. The longitudinal pier reinforcement consists of 93 rebars of diameter
26 mm, whereas the transverse reinforcement consists of rebars of 14 mm with a spacing
of 100 mm. The class of the concrete is C30/40 whereas the class of steel is S355.
The foundations of the bridge piers consist of 3 9 3 piles and the soil profile consists of
a deformable soil layer overlying a very dense sand deposit. The soil type is classified as C
according to EC8-1 (2005), corresponding to a soil factor S = 1.15 and the peak ground
acceleration (PGA) expected at the site is PGA = 0.4 Sg, where g denotes the gravity
constant.
2.2 Finite element model of the benchmark bridge
A three-dimensional finite element model (FEM) of the benchmark bridge is built in
OpenSees (McKenna et al. 2006) by following the guidelines of Kappos et al. (2012).
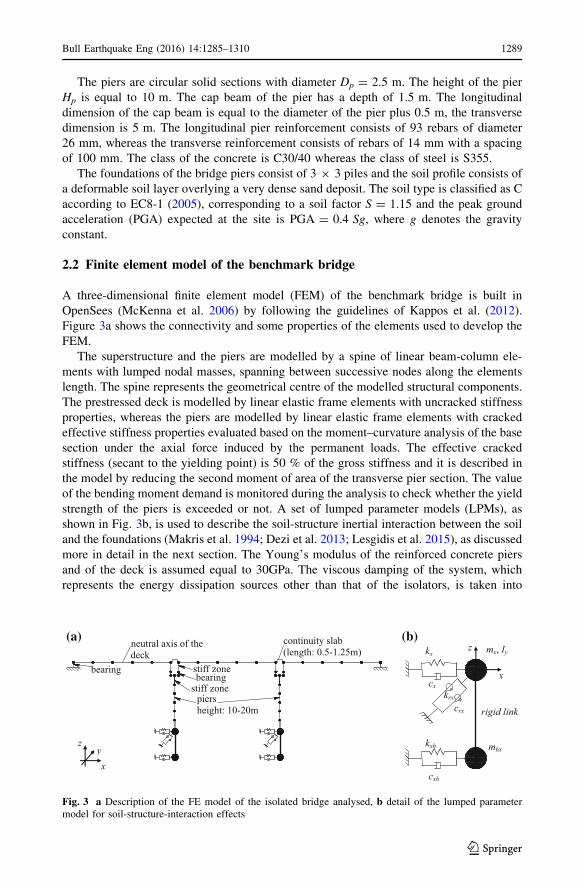
Figure 3a shows the connectivity and some properties of the elements used to develop the
FEM.
The superstructure and the piers are modelled by a spine of linear beam-column ele-
ments with lumped nodal masses, spanning between successive nodes along the elements
length. The spine represents the geometrical centre of the modelled structural components.
The prestressed deck is modelled by linear elastic frame elements with uncracked stiffness
properties, whereas the piers are modelled by linear elastic frame elements with cracked
effective stiffness properties evaluated based on the moment–curvature analysis of the base
section under the axial force induced by the permanent loads. The effective cracked
stiffness (secant to the yielding point) is 50 % of the gross stiffness and it is described in
the model by reducing the second moment of area of the transverse pier section. The value
of the bending moment demand is monitored during the analysis to check whether the yield
strength of the piers is exceeded or not. A set of lumped parameter models (LPMs), as
shown in Fig. 3b, is used to describe the soil-structure inertial interaction between the soil
and the foundations (Makris et al. 1994; Dezi et al. 2013; Lesgidis et al. 2015), as discussed
more in detail in the next section. The Young’s modulus of the reinforced concrete piers
and of the deck is assumed equal to 30GPa. The viscous damping of the system, which
represents the energy dissipation sources other than that of the isolators, is taken into
kx
cxkrx
crx
kxh
cxh
mhx
mx, Iy
rigid link
x
z
piersheight: 10-20m
continuity slab(length: 0.5-1.25m)
neutral axis of thedeck
stiff zonebearing
bearing stiff zone
(a) (b)
xy
z
Fig. 3 a Description of the FE model of the isolated bridge analysed, b detail of the lumped parametermodel for soil-structure-interaction effects
Bull Earthquake Eng (2016) 14:1285–1310 1289
123
account through the ‘‘region command’’, i.e. by assigning a Rayleigh damping to the piers
nodes. The parameters of the Rayleigh damping model are evaluated by considering a
damping ratio of 5 % in correspondence of the vibration frequencies of the two higher
modes which involve the flexure of the piers in the longitudinal direction. In the reference
bridge configuration and for the fixed base condition, these circular vibration frequencies
are 50.3 rad/s and 241.0 rad/s.
2.3 High damping rubber isolators model description
The isolators are described by employing the high damping rubber (HDRB) model
developed by Kumar et al. (2014). This model consists of a two-node, twelve degrees-of-
freedom discrete element, where the two nodes are connected by six springs representing
the mechanical behaviour along the six main degrees of freedom of the bearing. The
HDRB element permits to accurately describe both the nonlinear amplitude-dependent
behaviour in shear of the isolator and the vertical (tensile or compressive) behaviour, as
well as the coupling between the horizontal and vertical responses.
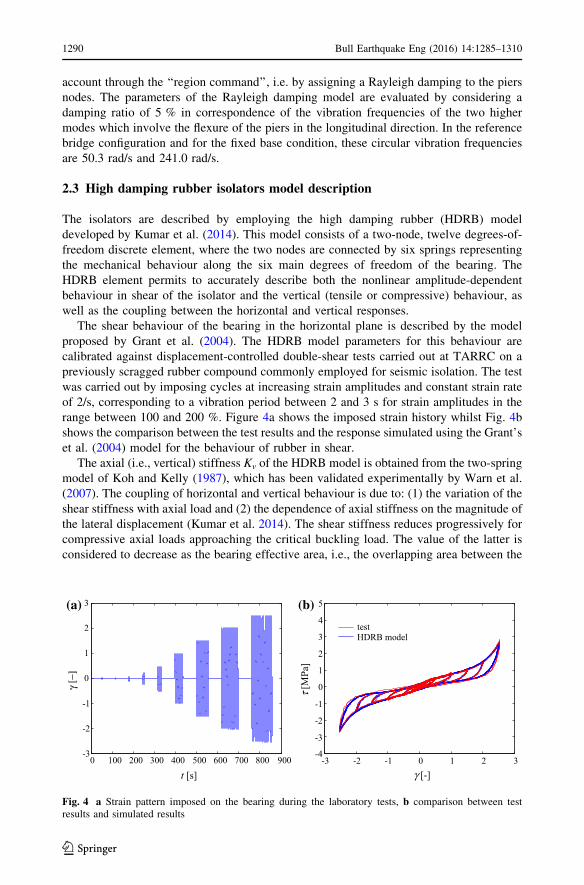
The shear behaviour of the bearing in the horizontal plane is described by the model
proposed by Grant et al. (2004). The HDRB model parameters for this behaviour are
calibrated against displacement-controlled double-shear tests carried out at TARRC on a
previously scragged rubber compound commonly employed for seismic isolation. The test
was carried out by imposing cycles at increasing strain amplitudes and constant strain rate
of 2/s, corresponding to a vibration period between 2 and 3 s for strain amplitudes in the
range between 100 and 200 %. Figure 4a shows the imposed strain history whilst Fig. 4b
shows the comparison between the test results and the response simulated using the Grant’s
et al. (2004) model for the behaviour of rubber in shear.
The axial (i.e., vertical) stiffness Kv of the HDRB model is obtained from the two-spring
model of Koh and Kelly (1987), which has been validated experimentally by Warn et al.
(2007). The coupling of horizontal and vertical behaviour is due to: (1) the variation of the
shear stiffness with axial load and (2) the dependence of axial stiffness on the magnitude of
the lateral displacement (Kumar et al. 2014). The shear stiffness reduces progressively for
compressive axial loads approaching the critical buckling load. The value of the latter is
considered to decrease as the bearing effective area, i.e., the overlapping area between the
0 100 200 300 400 500 600 700 800-3
-2
-1
0
1
2
3
γ [−
]
t [s]900
γ [-]
τ[M
Pa]
-3 -2 -1 0 1 2 3-4
-3
-2
-1
0
1
2
3
4
5
test HDRB model
(a) (b)
Fig. 4 a Strain pattern imposed on the bearing during the laboratory tests, b comparison between testresults and simulated results
1290 Bull Earthquake Eng (2016) 14:1285–1310
123
top and bottom internal plates, reduces, but, in first approximation, a residual buckling
resistance of the bearing at zero overlap area is considered (Kumar et al. 2014). Also, the
vertical stiffness of the isolator reduces with increase in the horizontal displacement. It is
worth pointing out that the large lateral displacements experienced by the isolators, cor-
responding to shear strains of the order of 100–200 %, can potentially lead to substantial
reductions in the vertical load-carrying capacity and the vertical stiffness of the HDRB
bearings (Cardone and Perrone 2012), and the employed bearing model is capable of
reproducing this behaviour.
With regards to the behaviour of the bearings under tension, prior to the cavitation of the
elastomer, the vertical stiffness of a steel-laminated rubber bearing is the same as that in
compression. The onset of cavitation occurs for tensile stresses of 3 Geff, where Geff is the
effective shear modulus. The torsional behaviour as well as the rotational behaviour are
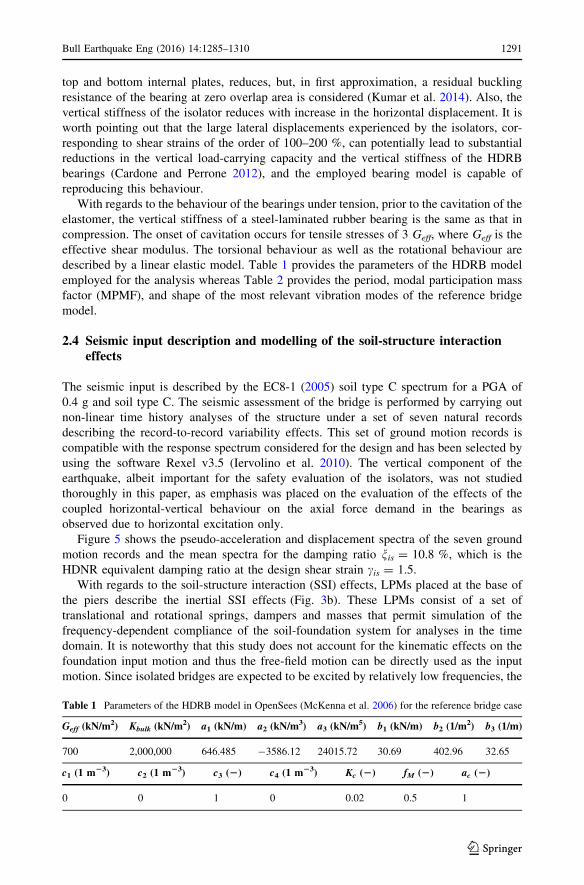
described by a linear elastic model. Table 1 provides the parameters of the HDRB model
employed for the analysis whereas Table 2 provides the period, modal participation mass
factor (MPMF), and shape of the most relevant vibration modes of the reference bridge
model.
2.4 Seismic input description and modelling of the soil-structure interactioneffects
The seismic input is described by the EC8-1 (2005) soil type C spectrum for a PGA of
0.4 g and soil type C. The seismic assessment of the bridge is performed by carrying out
non-linear time history analyses of the structure under a set of seven natural records
describing the record-to-record variability effects. This set of ground motion records is
compatible with the response spectrum considered for the design and has been selected by
using the software Rexel v3.5 (Iervolino et al. 2010). The vertical component of the
earthquake, albeit important for the safety evaluation of the isolators, was not studied
thoroughly in this paper, as emphasis was placed on the evaluation of the effects of the
coupled horizontal-vertical behaviour on the axial force demand in the bearings as
observed due to horizontal excitation only.
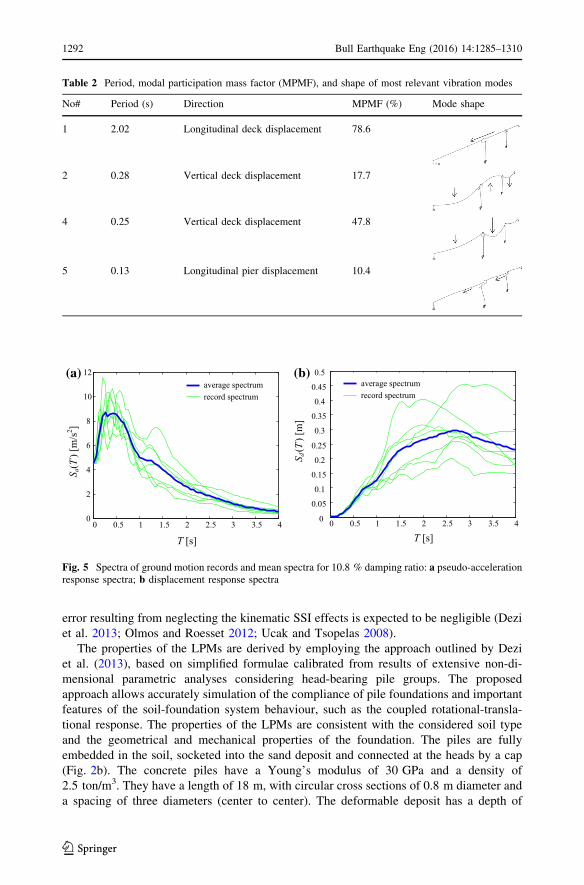
Figure 5 shows the pseudo-acceleration and displacement spectra of the seven ground
motion records and the mean spectra for the damping ratio nis = 10.8 %, which is the
HDNR equivalent damping ratio at the design shear strain cis = 1.5.
With regards to the soil-structure interaction (SSI) effects, LPMs placed at the base of
the piers describe the inertial SSI effects (Fig. 3b). These LPMs consist of a set of
translational and rotational springs, dampers and masses that permit simulation of the
frequency-dependent compliance of the soil-foundation system for analyses in the time
domain. It is noteworthy that this study does not account for the kinematic effects on the
foundation input motion and thus the free-field motion can be directly used as the input
motion. Since isolated bridges are expected to be excited by relatively low frequencies, the
Table 1 Parameters of the HDRB model in OpenSees (McKenna et al. 2006) for the reference bridge case
Geff (kN/m2) Kbulk (kN/m
2) a1 (kN/m) a2 (kN/m3) a3 (kN/m
5) b1 (kN/m) b2 (1/m2) b3 (1/m)
700 2,000,000 646.485 -3586.12 24015.72 30.69 402.96 32.65
c1 (1 m23) c2 (1 m23) c3 (2) c4 (1 m23) Kc (2) fM (2) ac (2)
0 0 1 0 0.02 0.5 1
Bull Earthquake Eng (2016) 14:1285–1310 1291
123
error resulting from neglecting the kinematic SSI effects is expected to be negligible (Dezi
et al. 2013; Olmos and Roesset 2012; Ucak and Tsopelas 2008).
The properties of the LPMs are derived by employing the approach outlined by Dezi
et al. (2013), based on simplified formulae calibrated from results of extensive non-di-
mensional parametric analyses considering head-bearing pile groups. The proposed
approach allows accurately simulation of the compliance of pile foundations and important
features of the soil-foundation system behaviour, such as the coupled rotational-transla-
tional response. The properties of the LPMs are consistent with the considered soil type
and the geometrical and mechanical properties of the foundation. The piles are fully
embedded in the soil, socketed into the sand deposit and connected at the heads by a cap
(Fig. 2b). The concrete piles have a Young’s modulus of 30 GPa and a density of
2.5 ton/m3. They have a length of 18 m, with circular cross sections of 0.8 m diameter and
a spacing of three diameters (center to center). The deformable deposit has a depth of
0 0.5 1 1.5 2 2.5 3 3.5 40
2
4
6
8
10
12
T [s]
S a(T
) [m
/s2 ]
(a)average spectrumrecord spectrum
0 0.5 1 1.5 2 2.5 3 3.5 40
0.05
0.1
0.15
0.2
0.25
0.3
0.35
0.4
0.45
0.5
T [s]
S d(T
)[m
]
average spectrumrecord spectrum
(b)
Fig. 5 Spectra of ground motion records and mean spectra for 10.8 % damping ratio: a pseudo-accelerationresponse spectra; b displacement response spectra
Table 2 Period, modal participation mass factor (MPMF), and shape of most relevant vibration modes
No# Period (s) Direction MPMF (%) Mode shape
1 2.02 Longitudinal deck displacement 78.6
2 0.28 Vertical deck displacement 17.7
4 0.25 Vertical deck displacement 47.8
5 0.13 Longitudinal pier displacement 10.4
1292 Bull Earthquake Eng (2016) 14:1285–1310
123
15 m, a shear wave velocity Vs1 = 200 m/s and a density qs1 = 1.7 ton/m3. The dense
sand deposit has shear wave velocity Vs2 = 800 m/s and density qs2 = 2.5 ton/m3. Pois-
son’s ratio is considered to be vs = 0.4 and material hysteretic damping ns = 10 %, which
is compatible with the design level of strain in the soil.
The impedance matrix ~N xð Þ corresponding to the proposed LPM is expressed in the
form:
~N xð Þ ¼ ~K� x2 ~Mþ ix ~C ð1Þ
where ~K, ~M, and ~C are frequency independent stiffness, mass and damping matrices whose
parameters are calibrated by employing the procedure reported in Dezi et al. (2013).
Having considered a seismic input along the bridge longitudinal direction, the bridge
exhibits a non-null response in the longitudinal direction and only some components of the
impedance matrix ~N xð Þ are significant for the problem studied. In particular, the real and
imaginary part of the translational component of the matrix ~N xð Þ are equal to 1.26E?06
and 7.26E?04 kN/m, those of the rotational component are equal to 4.84E?07 and
4.00E?05 kNm, those of the coupled rotational-translation component are equal to
1.57E?06 and 6.20E?04 kN, and those of the vertical translational component are equal
to 7.49E?06 and 2.17E?05 kN/m.
3 Parametric study
This section investigates the likelihood of the occurrence of bearing uplift, buckling, or of
other relevant limit states, as prescribed in the Appendix of this paper, for the bridge
configuration under consideration. First, the reference bridge model is analysed in detail to
show some important features of the bridge response. In particular, the following response
parameters are monitored, since they provide information useful to assess the performance
of the bridge components: (a) the isolator translational and rotational deflections and forces
along the horizontal and vertical directions; (b) the internal actions on the piers; (c) the
displacements and the rotations of the pier cap with respect to the ground; (d) the hori-
zontal and vertical displacements and rotations of the deck with respect to the ground;
(e) the displacements and rotation of the continuity slab with respect to the ground.
Particular emphasis is placed on the response of the isolators, which mainly depends on the
displacements and rotations of the deck and the pier cap.
Successively, an extensive parametric study is carried out to evaluate the performance
of a set of realistic bridge models obtained by varying critical design parameters of the
reference model, which are related to the properties of the superstructure, the substructures
and the isolators. The aforementioned critical design parameters were defined based on a
preliminary sensitivity analysis, which has identified which design choices influence sig-
nificantly the bearing vertical response.
Then, analyses are carried out for two different load combinations, i.e. the ultimate limit
state (ULS) combination for non-seismic actions and the seismic design combination
corresponding to the earthquake input described previously. The adequacy of the isolation
system to sustain the design loads is assessed on the basis of the checks provided in
EN1337-3 (2005) for the ULS design combination of actions, EN15129 (2009) and EC8-2
(2005) for the seismic load combinations.
The code prescriptions that need to be satisfied by the bearings are given in the
Appendix of this paper. These prescriptions are expressed in the form of inequalities based
Bull Earthquake Eng (2016) 14:1285–1310 1293
123
upon demand-to-capacity ratios (D/C), where the demand is the value of the response
parameter of interest for the limit state being monitored, evaluated by structural analysis,
whilst the capacity is the maximum allowable value for the relevant parameter, as pre-
scribed by the codes. It is noteworthy that in calculating the D/C ratios, the mean value of
the peak response parameters obtained for the seven natural seismic motions considered
are used. A value of the ratio higher than one, i.e. D/C[ 1, implies that the limit state is
not satisfied, whereas a value less than 1 implies that that the design satisfies the relevant
code requirement.
In addition to the assessment of the bearing performance, the performance of the piers is
monitored to make sure that they do not yield under the combination of the axial loads and
bending moments and that the shear demand does not exceed their shear capacity.
It is noteworthy that for all bridge models investigated, the isolation bearing system is
designed through the procedure outlined in the following section to achieve a target period
of 2.0 s. This value is significantly higher than the value of 0.46 s corresponding to the
fixed-base configuration.
3.1 Procedure for the design of the isolation system
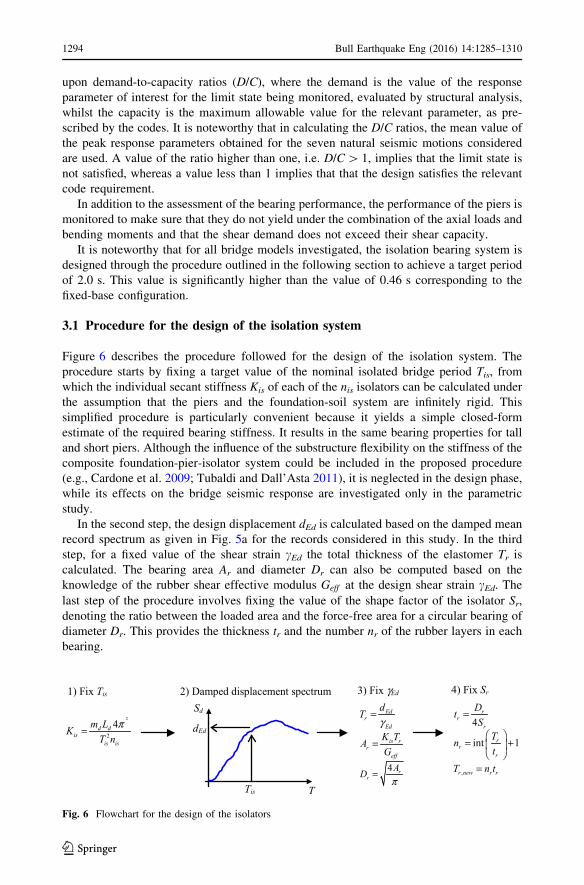
Figure 6 describes the procedure followed for the design of the isolation system. The
procedure starts by fixing a target value of the nominal isolated bridge period Tis, from
which the individual secant stiffness Kis of each of the nis isolators can be calculated under
the assumption that the piers and the foundation-soil system are infinitely rigid. This
simplified procedure is particularly convenient because it yields a simple closed-form
estimate of the required bearing stiffness. It results in the same bearing properties for tall
and short piers. Although the influence of the substructure flexibility on the stiffness of the
composite foundation-pier-isolator system could be included in the proposed procedure
(e.g., Cardone et al. 2009; Tubaldi and Dall’Asta 2011), it is neglected in the design phase,
while its effects on the bridge seismic response are investigated only in the parametric
study.
In the second step, the design displacement dEd is calculated based on the damped mean
record spectrum as given in Fig. 5a for the records considered in this study. In the third
step, for a fixed value of the shear strain cEd the total thickness of the elastomer Tr is
calculated. The bearing area Ar and diameter Dr can also be computed based on the
knowledge of the rubber shear effective modulus Geff at the design shear strain cEd. Thelast step of the procedure involves fixing the value of the shape factor of the isolator Sr,
denoting the ratio between the loaded area and the force-free area for a circular bearing of
diameter Dr. This provides the thickness tr and the number nr of the rubber layers in each
bearing.
Fig. 6 Flowchart for the design of the isolators
1294 Bull Earthquake Eng (2016) 14:1285–1310
123
The parameters Tis, Tr, and Sr, the mechanical (effective) properties of the bearings, Geff
and nis, and the seismic input spectral ordinate Sd(Tis) define unequivocally the geometry of
the isolation bearings with the exception of some parameters such as the thickness of the
steel plates and of the side cover layer of rubber for which additional design rules are given
in the codes. In particular, values of the thickness of the steel plates significantly higher
than the minimum value required to avoid steel yielding are chosen, since very flexible
plates have been found to affect significantly the stability of the bearings (Muhr 2006,
2007).
The design procedure employed in this study is not intended to cover all the aspects
related to the bearing design and may lead to bearing properties not consistent with those
available in manufacturer catalogues. Although alternative design procedures and criteria
could have been employed for the design (e.g. Cardone et al. 2009, 2010), the proposed one
was chosen for its simplicity, as it requires no iterations and also allows to obtain and
control directly all the properties required for the calibration of the HDNR bearing model.
3.2 Seismic response of the reference bridge with emphasis on the responseof the bearings
The geometry of the reference bridge considered for the in-depth analysis of the seismic
response is described by the following parameters: span length Lsp = 30 m, pier height
Hp = 10 m, cap beam height Hcb = 1.35 m, bearing eccentricity eb = 0.8 m, continuity
slab length Lcs = 0.5 m. The design of the bearing is carried out by following the pro-
cedure outlined above for a target vibration period of Tis = 2.0 s, corresponding to a
displacement demand in the fundamental mode of vibration of 0.264 m and a damping
ratio nis = 10.8 %. The initial value of the design shear deformation under the seismic
input is cEd = 1.5. For the assumed effective shear modulus Geff = 700 kPa, this corre-
sponds to bearings with a total rubber height Tr = 176 mm and a rubber diameter
Dr = 490 mm. The value of the bearing shape factor is Sr = 15, leading to a thickness of
single rubber layer of tr = 8 mm, and number of rubber layers nr = 22. The assumed
value of the shim plate thickness is ts = 5 mm.
The material, geometric and mechanical properties of the elastomeric bearings for this
reference bridge configuration are reported in Table 3; calculations of properties from the
primary parameters have been carried out in accordance with the formulae reported in
Kumar et al. (2014). Reference has been made to Kelly (1997) for the evaluation of the
critical buckling load and adjusted (effective) bearing geometrical properties, and to Warn
et al. (2007), with reference mainly to the horizontal-vertical behaviour interaction.
Figure 7 reports the time history of the deck horizontal displacement, dhd, and of the
pier cap displacement, dhp, for the first record (#1) considered in this study. This fig-
ure shows that the piers are efficiently isolated as the pier displacement is significantly
smaller than the deck displacement. The mean value of the deck displacement, obtained by
averaging the results for the seven records, is 0.280 m, whereas the design value is
0.264 m, i.e. a relative deviation of 5 % was obtained. The difference between the design
value and the mean value obtained from the analysis is the effect of (1) the pier dynamics,
(2) the nonlinear behaviour of the rubber and (3) the moment developed at the top of the
piers due to the axial forces of the bearings, which influence the pier boundary conditions.
The time history of the deck displacement is characterised by a fundamental period of
approximately 2.0 s, which is the design period, whereas the time history of the pier
displacement is characterised by a higher frequency content, since its is influenced by
higher vibration modes of the piers.
Bull Earthquake Eng (2016) 14:1285–1310 1295
123
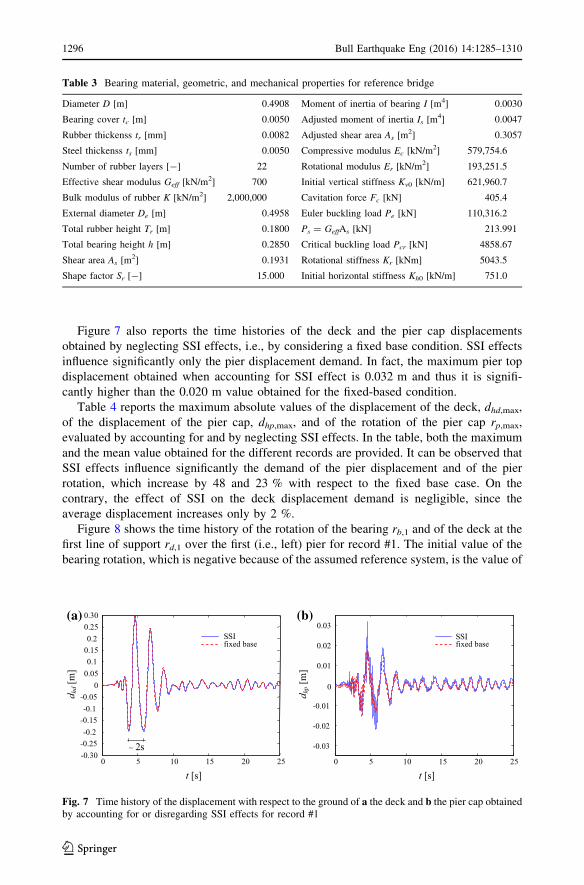
Figure 7 also reports the time histories of the deck and the pier cap displacements
obtained by neglecting SSI effects, i.e., by considering a fixed base condition. SSI effects
influence significantly only the pier displacement demand. In fact, the maximum pier top
displacement obtained when accounting for SSI effect is 0.032 m and thus it is signifi-
cantly higher than the 0.020 m value obtained for the fixed-based condition.
Table 4 reports the maximum absolute values of the displacement of the deck, dhd,max,
of the displacement of the pier cap, dhp,max, and of the rotation of the pier cap rp,max,
evaluated by accounting for and by neglecting SSI effects. In the table, both the maximum
and the mean value obtained for the different records are provided. It can be observed that
SSI effects influence significantly the demand of the pier displacement and of the pier
rotation, which increase by 48 and 23 % with respect to the fixed base case. On the
contrary, the effect of SSI on the deck displacement demand is negligible, since the
average displacement increases only by 2 %.
Figure 8 shows the time history of the rotation of the bearing rb,1 and of the deck at the
first line of support rd,1 over the first (i.e., left) pier for record #1. The initial value of the
bearing rotation, which is negative because of the assumed reference system, is the value of
0 5 10 15 20 25
-0.25-0.2
-0.15-0.1
-0.050
0.050.1
0.150.2
0.25
t [s]
0.30
-0.30
d hd [
m]
(a)
fixed baseSSI
2s∼
t [s]
d hp [
m]
0 5 10 15 20 25
-0.03
-0.02
-0.01
0
0.01
0.02
0.03SSIfixed base
(b)
Fig. 7 Time history of the displacement with respect to the ground of a the deck and b the pier cap obtainedby accounting for or disregarding SSI effects for record #1
Table 3 Bearing material, geometric, and mechanical properties for reference bridge
Diameter D [m] 0.4908 Moment of inertia of bearing I [m4] 0.0030
Bearing cover tc [m] 0.0050 Adjusted moment of inertia Is [m4] 0.0047
Rubber thickenss tr [mm] 0.0082 Adjusted shear area As [m2] 0.3057
Steel thickenss ts [mm] 0.0050 Compressive modulus Ec [kN/m2] 579,754.6
Number of rubber layers [-] 22 Rotational modulus Er [kN/m2] 193,251.5
Effective shear modulus Geff [kN/m2] 700 Initial vertical stiffness Kv0 [kN/m] 621,960.7
Bulk modulus of rubber K [kN/m2] 2,000,000 Cavitation force Fc [kN] 405.4
External diameter De [m] 0.4958 Euler buckling load Pe [kN] 110,316.2
Total rubber height Tr [m] 0.1800 Ps = GeffAs [kN] 213.991
Total bearing height h [m] 0.2850 Critical buckling load Pcr [kN] 4858.67
Shear area As [m2] 0.1931 Rotational stiffness Kr [kNm] 5043.5
Shape factor Sr [-] 15.000 Initial horizontal stiffness Kh0 [kN/m] 751.0
1296 Bull Earthquake Eng (2016) 14:1285–1310
123
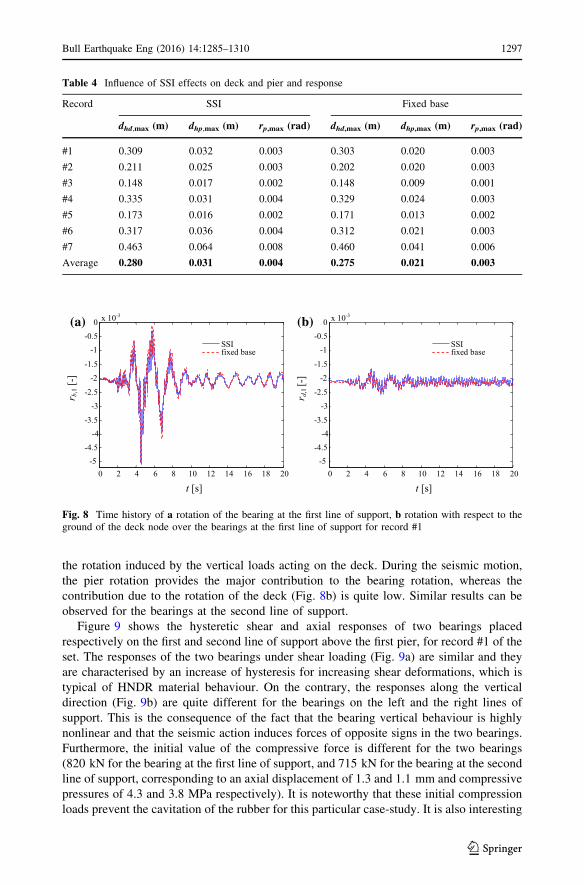
the rotation induced by the vertical loads acting on the deck. During the seismic motion,
the pier rotation provides the major contribution to the bearing rotation, whereas the
contribution due to the rotation of the deck (Fig. 8b) is quite low. Similar results can be
observed for the bearings at the second line of support.
Figure 9 shows the hysteretic shear and axial responses of two bearings placed
respectively on the first and second line of support above the first pier, for record #1 of the
set. The responses of the two bearings under shear loading (Fig. 9a) are similar and they
are characterised by an increase of hysteresis for increasing shear deformations, which is
typical of HNDR material behaviour. On the contrary, the responses along the vertical
direction (Fig. 9b) are quite different for the bearings on the left and the right lines of
support. This is the consequence of the fact that the bearing vertical behaviour is highly
nonlinear and that the seismic action induces forces of opposite signs in the two bearings.
Furthermore, the initial value of the compressive force is different for the two bearings
(820 kN for the bearing at the first line of support, and 715 kN for the bearing at the second
line of support, corresponding to an axial displacement of 1.3 and 1.1 mm and compressive
pressures of 4.3 and 3.8 MPa respectively). It is noteworthy that these initial compression
loads prevent the cavitation of the rubber for this particular case-study. It is also interesting
Table 4 Influence of SSI effects on deck and pier and response
Record SSI Fixed base
dhd,max (m) dhp,max (m) rp,max (rad) dhd,max (m) dhp,max (m) rp,max (rad)
#1 0.309 0.032 0.003 0.303 0.020 0.003
#2 0.211 0.025 0.003 0.202 0.020 0.003
#3 0.148 0.017 0.002 0.148 0.009 0.001
#4 0.335 0.031 0.004 0.329 0.024 0.003
#5 0.173 0.016 0.002 0.171 0.013 0.002
#6 0.317 0.036 0.004 0.312 0.021 0.003
#7 0.463 0.064 0.008 0.460 0.041 0.006
Average 0.280 0.031 0.004 0.275 0.021 0.003
t [s]
r b,1
[-]
0 2 4 6 8 10 12 14 16 18 20-5
-4.5-4
-3.5
-3
-2.5
-2
-1.5
-1-0.5
0 x 10-3
SSIfixed base
(a)
t [s]
r d,1
[-]
0 2 4 6 8 10 12 14 16 18 20-5
-4.5-4
-3.5
-3
-2.5
-2
-1.5
-1-0.5
0 x 10-3
SSIfixed base
(b)
Fig. 8 Time history of a rotation of the bearing at the first line of support, b rotation with respect to theground of the deck node over the bearings at the first line of support for record #1
Bull Earthquake Eng (2016) 14:1285–1310 1297
123
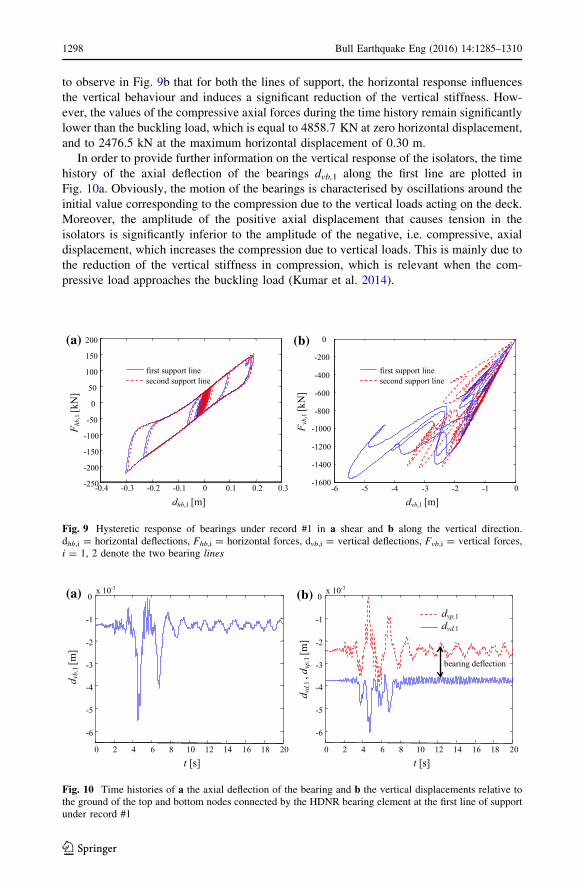
to observe in Fig. 9b that for both the lines of support, the horizontal response influences
the vertical behaviour and induces a significant reduction of the vertical stiffness. How-
ever, the values of the compressive axial forces during the time history remain significantly
lower than the buckling load, which is equal to 4858.7 KN at zero horizontal displacement,
and to 2476.5 kN at the maximum horizontal displacement of 0.30 m.
In order to provide further information on the vertical response of the isolators, the time
history of the axial deflection of the bearings dvb,1 along the first line are plotted in
Fig. 10a. Obviously, the motion of the bearings is characterised by oscillations around the
initial value corresponding to the compression due to the vertical loads acting on the deck.
Moreover, the amplitude of the positive axial displacement that causes tension in the
isolators is significantly inferior to the amplitude of the negative, i.e. compressive, axial
displacement, which increases the compression due to vertical loads. This is mainly due to
the reduction of the vertical stiffness in compression, which is relevant when the com-
pressive load approaches the buckling load (Kumar et al. 2014).
-0.4 -0.3 -0.2 -0.1 0 0.1 0.2 0.3-250
-200
-150
-100
-50
0
50
100
150
200
first support line second support line
dhb,1 [m]
F hb,
1[k
N]
(a)
-6 -5 -4 -3 -2 -1 0-1600
-1400
-1200
-1000
-800
-600
-400
-200
0
dvb,1 [m]
F vb,
1[k
N]
(b)
first support line second support line
Fig. 9 Hysteretic response of bearings under record #1 in a shear and b along the vertical direction.dhb,i = horizontal deflections, Fhb,i = horizontal forces, dvb,i = vertical deflections, Fvb,i = vertical forces,i = 1, 2 denote the two bearing lines
t [s]
d vb,
1[m
]
x 10-3
0 2 4 6 8 10 12 14 16 18 20
-6
-5
-4
-3
-2
-1
0(a)
t [s]
d vd,
1,d
vp, 1
[m]
x 10-3
0 2 4 6 8 10 12 14 16 18 20
-6
-5
-4
-3
-2
-1
0
dvd,1
dvp,1
(b)
bearing deflection
Fig. 10 Time histories of a the axial deflection of the bearing and b the vertical displacements relative tothe ground of the top and bottom nodes connected by the HDNR bearing element at the first line of supportunder record #1
1298 Bull Earthquake Eng (2016) 14:1285–1310
123
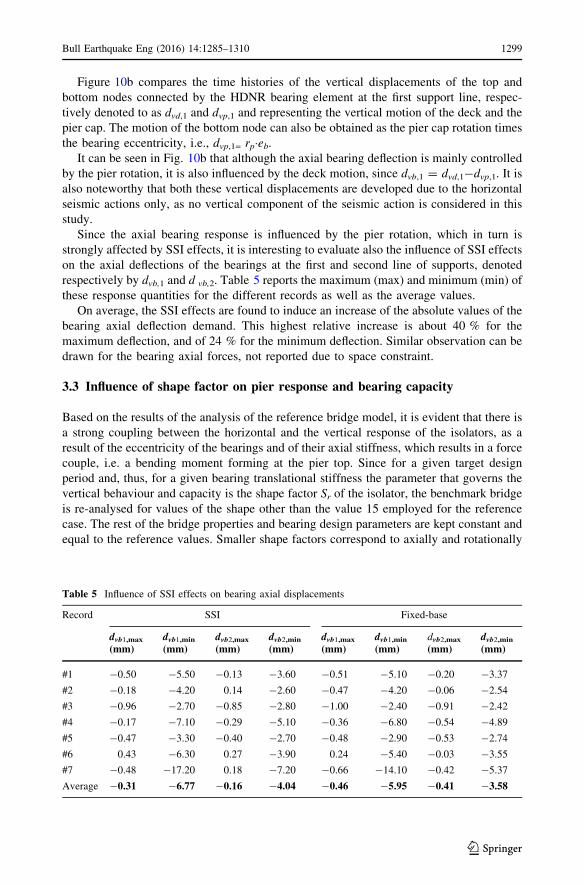
Figure 10b compares the time histories of the vertical displacements of the top and
bottom nodes connected by the HDNR bearing element at the first support line, respec-
tively denoted to as dvd,1 and dvp,1 and representing the vertical motion of the deck and the
pier cap. The motion of the bottom node can also be obtained as the pier cap rotation times
the bearing eccentricity, i.e., dvp,1= rp�eb.It can be seen in Fig. 10b that although the axial bearing deflection is mainly controlled
by the pier rotation, it is also influenced by the deck motion, since dvb,1 = dvd,1-dvp,1. It is
also noteworthy that both these vertical displacements are developed due to the horizontal
seismic actions only, as no vertical component of the seismic action is considered in this
study.
Since the axial bearing response is influenced by the pier rotation, which in turn is
strongly affected by SSI effects, it is interesting to evaluate also the influence of SSI effects
on the axial deflections of the bearings at the first and second line of supports, denoted
respectively by dvb,1 and d vb,2. Table 5 reports the maximum (max) and minimum (min) of
these response quantities for the different records as well as the average values.
On average, the SSI effects are found to induce an increase of the absolute values of the
bearing axial deflection demand. This highest relative increase is about 40 % for the
maximum deflection, and of 24 % for the minimum deflection. Similar observation can be
drawn for the bearing axial forces, not reported due to space constraint.
3.3 Influence of shape factor on pier response and bearing capacity
Based on the results of the analysis of the reference bridge model, it is evident that there is
a strong coupling between the horizontal and the vertical response of the isolators, as a
result of the eccentricity of the bearings and of their axial stiffness, which results in a force
couple, i.e. a bending moment forming at the pier top. Since for a given target design
period and, thus, for a given bearing translational stiffness the parameter that governs the
vertical behaviour and capacity is the shape factor Sr of the isolator, the benchmark bridge
is re-analysed for values of the shape other than the value 15 employed for the reference
case. The rest of the bridge properties and bearing design parameters are kept constant and
equal to the reference values. Smaller shape factors correspond to axially and rotationally
Table 5 Influence of SSI effects on bearing axial displacements
Record SSI Fixed-base
dvb1,max
(mm)dvb1,min
(mm)dvb2,max
(mm)dvb2,min
(mm)dvb1,max
(mm)dvb1,min
(mm)dvb2,max
(mm)dvb2,min
(mm)
#1 -0.50 -5.50 -0.13 -3.60 -0.51 -5.10 -0.20 -3.37
#2 -0.18 -4.20 0.14 -2.60 -0.47 -4.20 -0.06 -2.54
#3 -0.96 -2.70 -0.85 -2.80 -1.00 -2.40 -0.91 -2.42
#4 -0.17 -7.10 -0.29 -5.10 -0.36 -6.80 -0.54 -4.89
#5 -0.47 -3.30 -0.40 -2.70 -0.48 -2.90 -0.53 -2.74
#6 0.43 -6.30 0.27 -3.90 0.24 -5.40 -0.03 -3.55
#7 -0.48 -17.20 0.18 -7.20 -0.66 -14.10 -0.42 -5.37
Average -0.31 -6.77 -0.16 -4.04 -0.46 -5.95 -0.41 -3.58
Bull Earthquake Eng (2016) 14:1285–1310 1299
123
flexible bearings, which are also more prone to buckling under compression, whilst the
opposite is valid for larger shape factors.
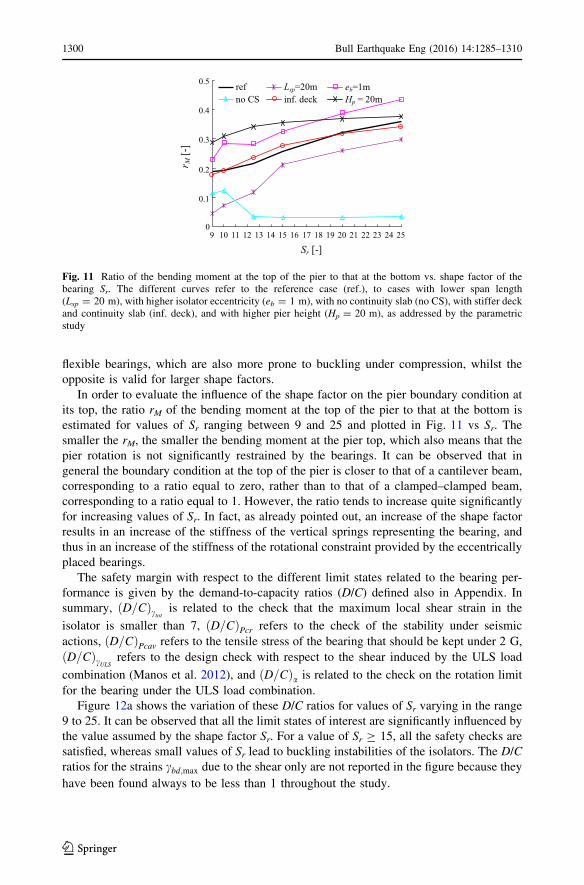
In order to evaluate the influence of the shape factor on the pier boundary condition at
its top, the ratio rM of the bending moment at the top of the pier to that at the bottom is
estimated for values of Sr ranging between 9 and 25 and plotted in Fig. 11 vs Sr. The
smaller the rM, the smaller the bending moment at the pier top, which also means that the
pier rotation is not significantly restrained by the bearings. It can be observed that in
general the boundary condition at the top of the pier is closer to that of a cantilever beam,
corresponding to a ratio equal to zero, rather than to that of a clamped–clamped beam,
corresponding to a ratio equal to 1. However, the ratio tends to increase quite significantly
for increasing values of Sr. In fact, as already pointed out, an increase of the shape factor
results in an increase of the stiffness of the vertical springs representing the bearing, and
thus in an increase of the stiffness of the rotational constraint provided by the eccentrically
placed bearings.
The safety margin with respect to the different limit states related to the bearing per-
formance is given by the demand-to-capacity ratios (D/C) defined also in Appendix. In
summary, D=Cð Þctot is related to the check that the maximum local shear strain in the
isolator is smaller than 7, D=Cð ÞPcr refers to the check of the stability under seismic
actions, D=Cð ÞPcav refers to the tensile stress of the bearing that should be kept under 2 G,
D=Cð ÞcULS refers to the design check with respect to the shear induced by the ULS load
combination (Manos et al. 2012), and D=Cð Þa is related to the check on the rotation limit
for the bearing under the ULS load combination.
Figure 12a shows the variation of these D/C ratios for values of Sr varying in the range
9 to 25. It can be observed that all the limit states of interest are significantly influenced by
the value assumed by the shape factor Sr. For a value of Sr C 15, all the safety checks are
satisfied, whereas small values of Sr lead to buckling instabilities of the isolators. The D/C
ratios for the strains cbd;max due to the shear only are not reported in the figure because they
have been found always to be less than 1 throughout the study.
0
0.1
0.2
0.3
0.4
0.5
9 10 11 12 13 14 15 16 17 18 19 20 21 22 23 24 25
Sr [-]
r M [-
]
ref Lsp=20m eb=1mno CS inf. deck Hp = 20m
Fig. 11 Ratio of the bending moment at the top of the pier to that at the bottom vs. shape factor of thebearing Sr. The different curves refer to the reference case (ref.), to cases with lower span length(Lsp = 20 m), with higher isolator eccentricity (eb = 1 m), with no continuity slab (no CS), with stiffer deckand continuity slab (inf. deck), and with higher pier height (Hp = 20 m), as addressed by the parametricstudy
1300 Bull Earthquake Eng (2016) 14:1285–1310
123
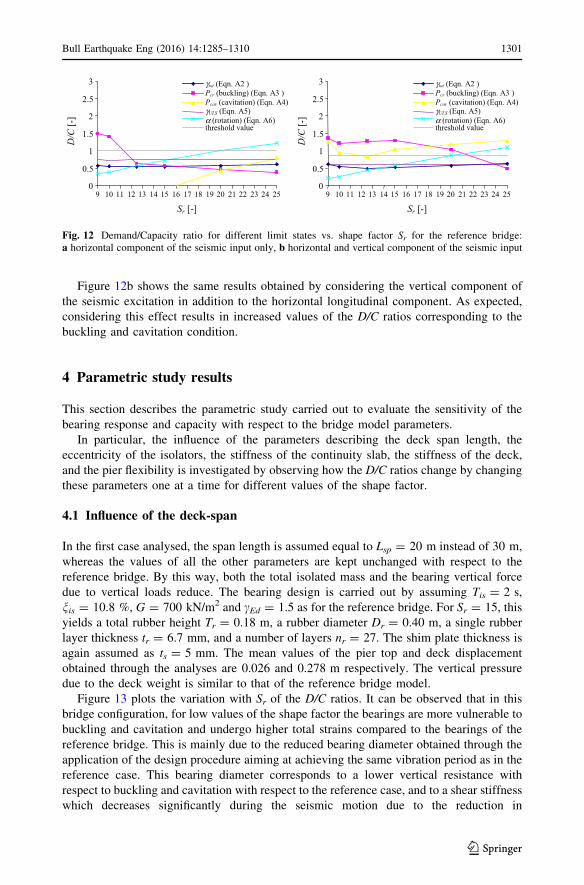
Figure 12b shows the same results obtained by considering the vertical component of
the seismic excitation in addition to the horizontal longitudinal component. As expected,
considering this effect results in increased values of the D/C ratios corresponding to the
buckling and cavitation condition.
4 Parametric study results
This section describes the parametric study carried out to evaluate the sensitivity of the
bearing response and capacity with respect to the bridge model parameters.
In particular, the influence of the parameters describing the deck span length, the
eccentricity of the isolators, the stiffness of the continuity slab, the stiffness of the deck,
and the pier flexibility is investigated by observing how the D/C ratios change by changing
these parameters one at a time for different values of the shape factor.
4.1 Influence of the deck-span
In the first case analysed, the span length is assumed equal to Lsp = 20 m instead of 30 m,
whereas the values of all the other parameters are kept unchanged with respect to the
reference bridge. By this way, both the total isolated mass and the bearing vertical force
due to vertical loads reduce. The bearing design is carried out by assuming Tis = 2 s,
nis = 10.8 %, G = 700 kN/m2 and cEd = 1.5 as for the reference bridge. For Sr = 15, this
yields a total rubber height Tr = 0.18 m, a rubber diameter Dr = 0.40 m, a single rubber
layer thickness tr = 6.7 mm, and a number of layers nr = 27. The shim plate thickness is
again assumed as ts = 5 mm. The mean values of the pier top and deck displacement
obtained through the analyses are 0.026 and 0.278 m respectively. The vertical pressure
due to the deck weight is similar to that of the reference bridge model.
Figure 13 plots the variation with Sr of the D/C ratios. It can be observed that in this
bridge configuration, for low values of the shape factor the bearings are more vulnerable to
buckling and cavitation and undergo higher total strains compared to the bearings of the
reference bridge. This is mainly due to the reduced bearing diameter obtained through the
application of the design procedure aiming at achieving the same vibration period as in the
reference case. This bearing diameter corresponds to a lower vertical resistance with
respect to buckling and cavitation with respect to the reference case, and to a shear stiffness
which decreases significantly during the seismic motion due to the reduction in
Sr [-]
0
0.5
1
1.5
2
2.5
3
9 10 11 12 13 14 15 16 17 18 19 20 21 22 23 24 25
D/C
[-]
γtot (Eqn. A2 )Pcr (buckling) (Eqn. A3 )Pcav (cavitation) (Eqn. A4)
α (rotation) (Eqn. A6)γULS (Eqn. A5)
threshold value
Sr [-]
0
0.5
1
1.5
2
2.5
3
9 10 11 12 13 14 15 16 17 18 19 20 21 22 23 24 25
D/C
[-]
γtot (Eqn. A2 )Pcr (buckling) (Eqn. A3 )Pcav (cavitation) (Eqn. A4)
α (rotation) (Eqn. A6)γULS (Eqn. A5)
threshold value
Fig. 12 Demand/Capacity ratio for different limit states vs. shape factor Sr for the reference bridge:a horizontal component of the seismic input only, b horizontal and vertical component of the seismic input
Bull Earthquake Eng (2016) 14:1285–1310 1301
123
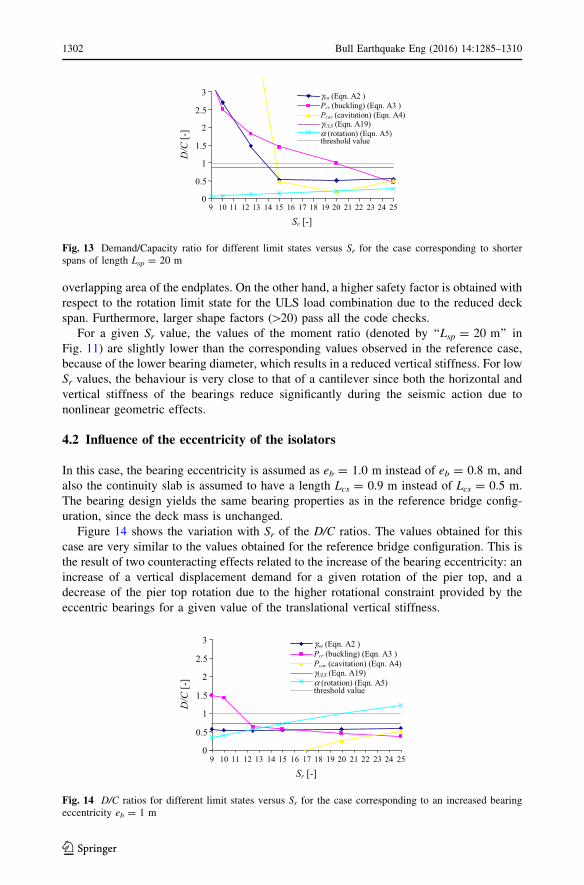
overlapping area of the endplates. On the other hand, a higher safety factor is obtained with
respect to the rotation limit state for the ULS load combination due to the reduced deck
span. Furthermore, larger shape factors ([20) pass all the code checks.
For a given Sr value, the values of the moment ratio (denoted by ‘‘Lsp = 20 m’’ in
Fig. 11) are slightly lower than the corresponding values observed in the reference case,
because of the lower bearing diameter, which results in a reduced vertical stiffness. For low
Sr values, the behaviour is very close to that of a cantilever since both the horizontal and
vertical stiffness of the bearings reduce significantly during the seismic action due to
nonlinear geometric effects.
4.2 Influence of the eccentricity of the isolators
In this case, the bearing eccentricity is assumed as eb = 1.0 m instead of eb = 0.8 m, and
also the continuity slab is assumed to have a length Lcs = 0.9 m instead of Lcs = 0.5 m.
The bearing design yields the same bearing properties as in the reference bridge config-
uration, since the deck mass is unchanged.
Figure 14 shows the variation with Sr of the D/C ratios. The values obtained for this
case are very similar to the values obtained for the reference bridge configuration. This is
the result of two counteracting effects related to the increase of the bearing eccentricity: an
increase of a vertical displacement demand for a given rotation of the pier top, and a
decrease of the pier top rotation due to the higher rotational constraint provided by the
eccentric bearings for a given value of the translational vertical stiffness.
Sr [-]
0
0.5
1
1.5
2
2.5
3
9 10 11 12 13 14 15 16 17 18 19 20 21 22 23 24 25
D/C
[-]
γtot (Eqn. A2 )Pcr (buckling) (Eqn. A3 )Pcav (cavitation) (Eqn. A4)
α (rotation) (Eqn. A5)γULS (Eqn. A19)
threshold value
Fig. 13 Demand/Capacity ratio for different limit states versus Sr for the case corresponding to shorterspans of length Lsp = 20 m
Sr [-]
0
0.5
1
1.5
2
2.5
3
9 10 11 12 13 14 15 16 17 18 19 20 21 22 23 24 25
D/C
[-]
γtot (Eqn. A2 )Pcr (buckling) (Eqn. A3 )Pcav (cavitation) (Eqn. A4)
α (rotation) (Eqn. A5)γULS (Eqn. A19)
threshold value
Fig. 14 D/C ratios for different limit states versus Sr for the case corresponding to an increased bearingeccentricity eb = 1 m
1302 Bull Earthquake Eng (2016) 14:1285–1310
123
For a given value of the shape factor, the values assumed by the moment ratio (denoted by
‘‘eb = 1 m’’ in Fig. 11) are higher than the corresponding values observed in the reference
case, because of the stiffer rotational constraint provided by the eccentric bearings.
4.3 Influence of the stiffness of the continuity slab
In order to investigate the influence of the continuity slab, the analyses are carried out
again by assuming a zero stiffness value for the element representing it. This is equivalent
to assuming that there are expansion joints in place of the continuity slabs between the
adjacent deck spans. For this particular case the potential pounding interaction between the
adjacent spans is not taken into account, as it was considered that adequate expansion
joints prevent the interaction between the spans. The bearing design yields the same
bearing properties as in the reference bridge.
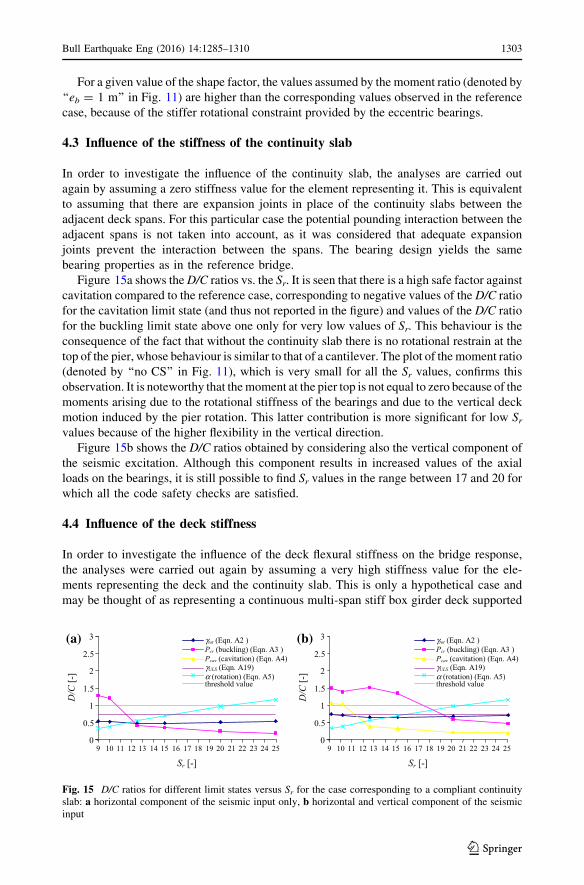
Figure 15a shows theD/C ratios vs. the Sr. It is seen that there is a high safe factor against
cavitation compared to the reference case, corresponding to negative values of the D/C ratio
for the cavitation limit state (and thus not reported in the figure) and values of the D/C ratio
for the buckling limit state above one only for very low values of Sr. This behaviour is the
consequence of the fact that without the continuity slab there is no rotational restrain at the
top of the pier, whose behaviour is similar to that of a cantilever. The plot of the moment ratio
(denoted by ‘‘no CS’’ in Fig. 11), which is very small for all the Sr values, confirms this
observation. It is noteworthy that themoment at the pier top is not equal to zero because of the
moments arising due to the rotational stiffness of the bearings and due to the vertical deck
motion induced by the pier rotation. This latter contribution is more significant for low Srvalues because of the higher flexibility in the vertical direction.
Figure 15b shows the D/C ratios obtained by considering also the vertical component of
the seismic excitation. Although this component results in increased values of the axial
loads on the bearings, it is still possible to find Sr values in the range between 17 and 20 for
which all the code safety checks are satisfied.
4.4 Influence of the deck stiffness
In order to investigate the influence of the deck flexural stiffness on the bridge response,
the analyses were carried out again by assuming a very high stiffness value for the ele-
ments representing the deck and the continuity slab. This is only a hypothetical case and
may be thought of as representing a continuous multi-span stiff box girder deck supported
Sr [-]
0
0.5
1
1.5
2
2.5
3
9 10 11 12 13 14 15 16 17 18 19 20 21 22 23 24 25
D/C
[-]
γtot (Eqn. A2 )Pcr (buckling) (Eqn. A3 )Pcav (cavitation) (Eqn. A4)
α (rotation) (Eqn. A5)γULS (Eqn. A19)
threshold value
Sr [-]
0
0.5
1
1.5
2
2.5
3
9 10 11 12 13 14 15 16 17 18 19 20 21 22 23 24 25
D/C
[-]
γtot (Eqn. A2 )Pcr (buckling) (Eqn. A3 )Pcav (cavitation) (Eqn. A4)
α (rotation) (Eqn. A5)γULS (Eqn. A19)
threshold value
(a) (b)
Fig. 15 D/C ratios for different limit states versus Sr for the case corresponding to a compliant continuityslab: a horizontal component of the seismic input only, b horizontal and vertical component of the seismicinput
Bull Earthquake Eng (2016) 14:1285–1310 1303
123
on the piers through two lines of bearings. The bearing design yields the same bearing
properties as in the reference bridge configuration.
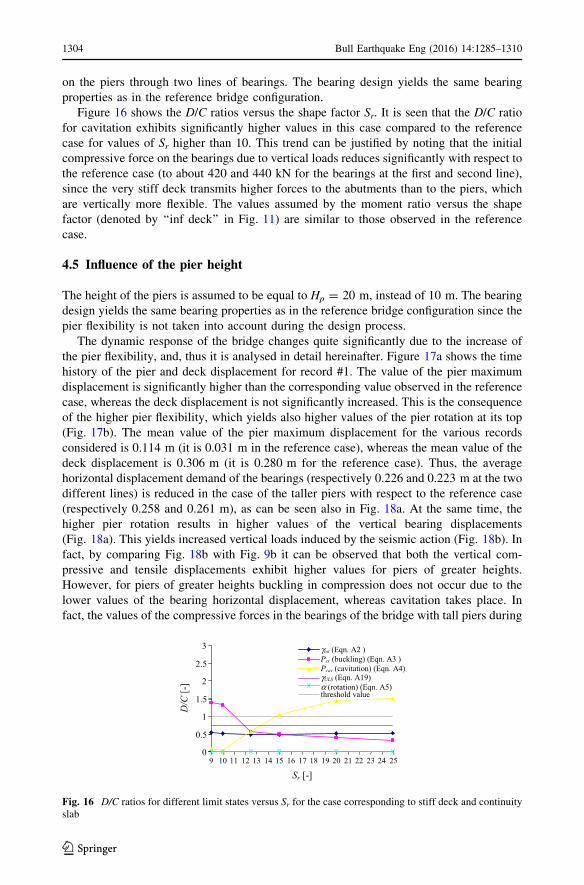
Figure 16 shows the D/C ratios versus the shape factor Sr. It is seen that the D/C ratio
for cavitation exhibits significantly higher values in this case compared to the reference
case for values of Sr higher than 10. This trend can be justified by noting that the initial
compressive force on the bearings due to vertical loads reduces significantly with respect to
the reference case (to about 420 and 440 kN for the bearings at the first and second line),
since the very stiff deck transmits higher forces to the abutments than to the piers, which
are vertically more flexible. The values assumed by the moment ratio versus the shape
factor (denoted by ‘‘inf deck’’ in Fig. 11) are similar to those observed in the reference
case.
4.5 Influence of the pier height
The height of the piers is assumed to be equal to Hp = 20 m, instead of 10 m. The bearing
design yields the same bearing properties as in the reference bridge configuration since the
pier flexibility is not taken into account during the design process.
The dynamic response of the bridge changes quite significantly due to the increase of
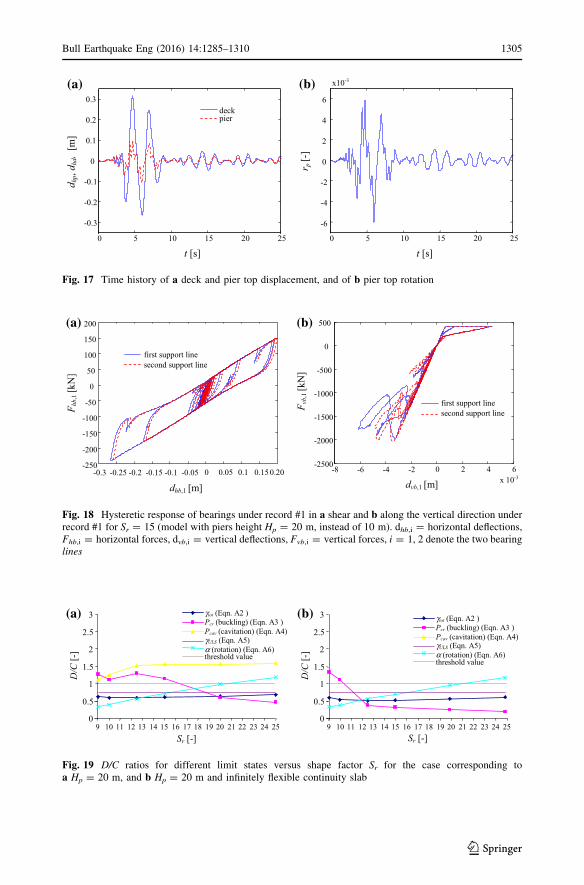
the pier flexibility, and, thus it is analysed in detail hereinafter. Figure 17a shows the time
history of the pier and deck displacement for record #1. The value of the pier maximum
displacement is significantly higher than the corresponding value observed in the reference
case, whereas the deck displacement is not significantly increased. This is the consequence
of the higher pier flexibility, which yields also higher values of the pier rotation at its top
(Fig. 17b). The mean value of the pier maximum displacement for the various records
considered is 0.114 m (it is 0.031 m in the reference case), whereas the mean value of the
deck displacement is 0.306 m (it is 0.280 m for the reference case). Thus, the average
horizontal displacement demand of the bearings (respectively 0.226 and 0.223 m at the two
different lines) is reduced in the case of the taller piers with respect to the reference case
(respectively 0.258 and 0.261 m), as can be seen also in Fig. 18a. At the same time, the
higher pier rotation results in higher values of the vertical bearing displacements
(Fig. 18a). This yields increased vertical loads induced by the seismic action (Fig. 18b). In
fact, by comparing Fig. 18b with Fig. 9b it can be observed that both the vertical com-
pressive and tensile displacements exhibit higher values for piers of greater heights.
However, for piers of greater heights buckling in compression does not occur due to the
lower values of the bearing horizontal displacement, whereas cavitation takes place. In
fact, the values of the compressive forces in the bearings of the bridge with tall piers during
Sr [-]
0
0.5
1
1.5
2
2.5
3
9 10 11 12 13 14 15 16 17 18 19 20 21 22 23 24 25
D/C
[-]
γtot (Eqn. A2 )Pcr (buckling) (Eqn. A3 )Pcav (cavitation) (Eqn. A4)
α (rotation) (Eqn. A5)γULS (Eqn. A19)
threshold value
Fig. 16 D/C ratios for different limit states versus Sr for the case corresponding to stiff deck and continuityslab
1304 Bull Earthquake Eng (2016) 14:1285–1310
123
0 5 10 15 20 25
t [s]
d hp,
d hd,
[m]
deckpier
-0.3
-0.2
-0.1
0
0.1
0.2
0.3
(a)
0 5 10 15 20 25
t [s]
r p[ -
]
-6
-4
-2
0
2
4
6
x10-3(b)
Fig. 17 Time history of a deck and pier top displacement, and of b pier top rotation
-250
-200
-150
-100
-50
0
50
100
150
200
-0.3 -0.25 -0.2 -0.15 -0.1 -0.05 0 0.05 0.1 0.15 0.20
dhb,1 [m]
F hb,
1[k
N]
(a)
first support line second support line
-8 -6 -4 -2 0 2 4 6x 10⁻³
-2500
-2000
-1500
-1000
-500
0
500
dvb,1 [m]
F vb,
1[k
N]
(b)
first support line second support line
Fig. 18 Hysteretic response of bearings under record #1 in a shear and b along the vertical direction underrecord #1 for Sr = 15 (model with piers height Hp = 20 m, instead of 10 m). dhb,i = horizontal deflections,Fhb,i = horizontal forces, dvb,i = vertical deflections, Fvb,i = vertical forces, i = 1, 2 denote the two bearinglines
Sr [-]
0
0.5
1
1.5
2
2.5
3
9 10 11 12 13 14 15 16 17 18 19 20 21 22 23 24 25
(a)
D/C
[-]
γtot (Eqn. A2 )Pcr (buckling) (Eqn. A3 )Pcav (cavitation) (Eqn. A4)
α (rotation) (Eqn. A6)γULS (Eqn. A5)
threshold value
Sr [-]
0
0.5
1
1.5
2
2.5
3
9 10 11 12 13 14 15 16 17 18 19 20 21 22 23 24 25
(b)
D/C
[-]
γtot (Eqn. A2 )Pcr (buckling) (Eqn. A3 )Pcav (cavitation) (Eqn. A4)
α (rotation) (Eqn. A6)γULS (Eqn. A5)
threshold value
Fig. 19 D/C ratios for different limit states versus shape factor Sr for the case corresponding toa Hp = 20 m, and b Hp = 20 m and infinitely flexible continuity slab
Bull Earthquake Eng (2016) 14:1285–1310 1305
123
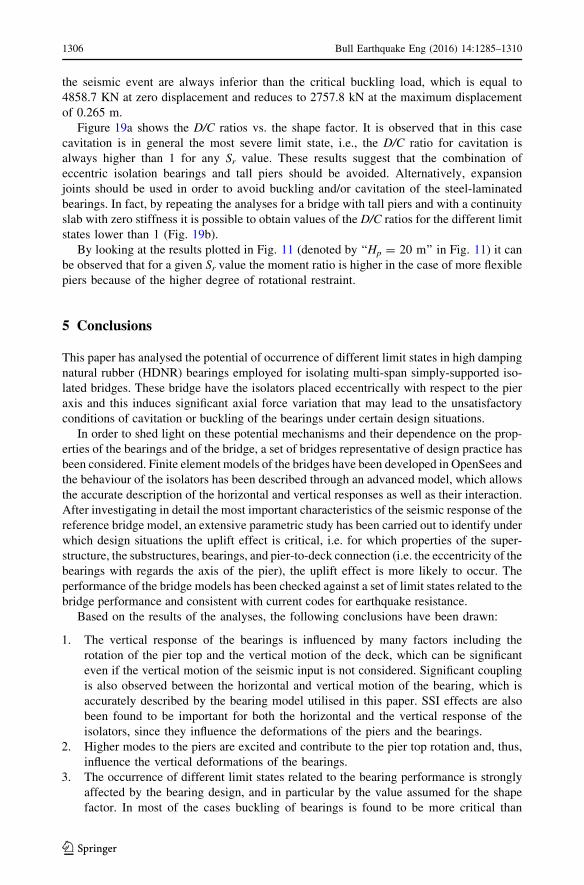
the seismic event are always inferior than the critical buckling load, which is equal to
4858.7 KN at zero displacement and reduces to 2757.8 kN at the maximum displacement
of 0.265 m.
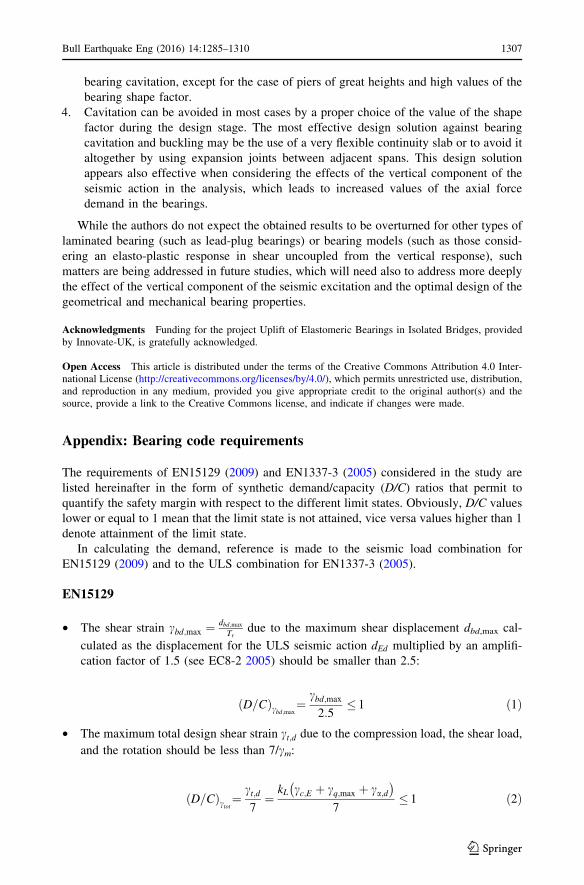
Figure 19a shows the D/C ratios vs. the shape factor. It is observed that in this case
cavitation is in general the most severe limit state, i.e., the D/C ratio for cavitation is
always higher than 1 for any Sr value. These results suggest that the combination of
eccentric isolation bearings and tall piers should be avoided. Alternatively, expansion
joints should be used in order to avoid buckling and/or cavitation of the steel-laminated
bearings. In fact, by repeating the analyses for a bridge with tall piers and with a continuity
slab with zero stiffness it is possible to obtain values of the D/C ratios for the different limit
states lower than 1 (Fig. 19b).
By looking at the results plotted in Fig. 11 (denoted by ‘‘Hp = 20 m’’ in Fig. 11) it can
be observed that for a given Sr value the moment ratio is higher in the case of more flexible
piers because of the higher degree of rotational restraint.
5 Conclusions
This paper has analysed the potential of occurrence of different limit states in high damping
natural rubber (HDNR) bearings employed for isolating multi-span simply-supported iso-
lated bridges. These bridge have the isolators placed eccentrically with respect to the pier
axis and this induces significant axial force variation that may lead to the unsatisfactory
conditions of cavitation or buckling of the bearings under certain design situations.
In order to shed light on these potential mechanisms and their dependence on the prop-
erties of the bearings and of the bridge, a set of bridges representative of design practice has
been considered. Finite element models of the bridges have been developed in OpenSees and
the behaviour of the isolators has been described through an advanced model, which allows
the accurate description of the horizontal and vertical responses as well as their interaction.
After investigating in detail the most important characteristics of the seismic response of the
reference bridge model, an extensive parametric study has been carried out to identify under
which design situations the uplift effect is critical, i.e. for which properties of the super-
structure, the substructures, bearings, and pier-to-deck connection (i.e. the eccentricity of the
bearings with regards the axis of the pier), the uplift effect is more likely to occur. The
performance of the bridge models has been checked against a set of limit states related to the
bridge performance and consistent with current codes for earthquake resistance.
Based on the results of the analyses, the following conclusions have been drawn:
1. The vertical response of the bearings is influenced by many factors including the
rotation of the pier top and the vertical motion of the deck, which can be significant
even if the vertical motion of the seismic input is not considered. Significant coupling
is also observed between the horizontal and vertical motion of the bearing, which is
accurately described by the bearing model utilised in this paper. SSI effects are also
been found to be important for both the horizontal and the vertical response of the
isolators, since they influence the deformations of the piers and the bearings.
2. Higher modes to the piers are excited and contribute to the pier top rotation and, thus,
influence the vertical deformations of the bearings.
3. The occurrence of different limit states related to the bearing performance is strongly
affected by the bearing design, and in particular by the value assumed for the shape
factor. In most of the cases buckling of bearings is found to be more critical than
1306 Bull Earthquake Eng (2016) 14:1285–1310
123
bearing cavitation, except for the case of piers of great heights and high values of the
bearing shape factor.
4. Cavitation can be avoided in most cases by a proper choice of the value of the shape
factor during the design stage. The most effective design solution against bearing
cavitation and buckling may be the use of a very flexible continuity slab or to avoid it
altogether by using expansion joints between adjacent spans. This design solution
appears also effective when considering the effects of the vertical component of the
seismic action in the analysis, which leads to increased values of the axial force
demand in the bearings.
While the authors do not expect the obtained results to be overturned for other types of
laminated bearing (such as lead-plug bearings) or bearing models (such as those consid-
ering an elasto-plastic response in shear uncoupled from the vertical response), such
matters are being addressed in future studies, which will need also to address more deeply
the effect of the vertical component of the seismic excitation and the optimal design of the
geometrical and mechanical bearing properties.
Acknowledgments Funding for the project Uplift of Elastomeric Bearings in Isolated Bridges, providedby Innovate-UK, is gratefully acknowledged.
Open Access This article is distributed under the terms of the Creative Commons Attribution 4.0 Inter-national License (http://creativecommons.org/licenses/by/4.0/), which permits unrestricted use, distribution,and reproduction in any medium, provided you give appropriate credit to the original author(s) and thesource, provide a link to the Creative Commons license, and indicate if changes were made.
Appendix: Bearing code requirements
The requirements of EN15129 (2009) and EN1337-3 (2005) considered in the study are
listed hereinafter in the form of synthetic demand/capacity (D/C) ratios that permit to
quantify the safety margin with respect to the different limit states. Obviously, D/C values
lower or equal to 1 mean that the limit state is not attained, vice versa values higher than 1
denote attainment of the limit state.
In calculating the demand, reference is made to the seismic load combination for
EN15129 (2009) and to the ULS combination for EN1337-3 (2005).
EN15129
• The shear strain cbd;max ¼dbd;max
Trdue to the maximum shear displacement dbd,max cal-
culated as the displacement for the ULS seismic action dEd multiplied by an amplifi-
cation factor of 1.5 (see EC8-2 2005) should be smaller than 2.5:
D=Cð Þcbd;max¼
cbd;max
2:5� 1 ð1Þ
• The maximum total design shear strain ct;d due to the compression load, the shear load,
and the rotation should be less than 7/cm:
D=Cð Þctot¼ct;d7
¼kL cc;E þ cq;max þ ca;d� �
7� 1 ð2Þ
Bull Earthquake Eng (2016) 14:1285–1310 1307
123
where:
– KL = 1;
– cc;E is the design local maximum shear strain due to the compressive strain;
– cq;max is the design maximum shear strain due to the shear displacement;
– ca;d is the design local maximum shear strain due to rotation. A minimum rotation
angle of 0.003 rad shall be assumed for each orthogonal direction in calculating ea;d .
These strains can be calculated by referring to European Committee for Standardization
(ECS) (2009).
• The horizontal deflection capacity (stability) under seismic actions should be checked
by checking that D=Cð ÞPcr � 1, where:
D=Cð ÞPcr¼
d0:7
NEd �Pcr=4
NEd;max
Pcr
21� 0:7dð Þ
Pcr=4�NEd �Pcr=2
8>><
>>:ð3Þ
and where d ¼ dEda0 and a
0 is the diameter of the internal reinforcing plates and Pcr is the
critical buckling load at zero horizontal displacement.
• The value of NEd,min shall not be a tension force producing a stress greater than 2G,
where G is the shear modulus measured at 100 % strain:
D=Cð ÞPcav ¼NEd;min
2GAr
� 1 ð4Þ
where Ar is the bearing area.
EN1337-3
• The maximum value for the shear strains cULS due to translational movements under the
ULS non-seismic load combination should be smaller than 2.5:
D=Cð ÞcULS ¼cULS2:5
� 1 ð5Þ
In calculating the values of cULS the effects of temperature, shrinkage and of the
breaking forces due to the traffic loads are taken into account.
• For laminated bearings, the rotational limitation shall be satisfied under the ULS non-
seismic load combination when:
D=Cð Þa¼a0 � ad3P
vz;d� 1 ð6Þ
where
–P
vz;d is the vertical displacement simultaneous with the rotation ad;– Kr;d = 3 is a rotation factor.
1308 Bull Earthquake Eng (2016) 14:1285–1310
123
References
American Association of State Highway and Transportation Officials (AASHTO) (2014) Guide specifica-tions for seismic isolation design, 4th edn. AASHTO, Washington
Buckle I, Yen W-H, Marsh L, Monzon E (2012) Implications of bridge performance during Great East JapanEarthquake for US seismic design practice. In Proceedings of the international symposium on engi-neering lessons learned from the 2011 Great East Japan Earthquake, Tokyo, 1–4 Mar 2012,pp 1363–1374
California Department of Transportation (CalTrans) (1999) Bridge memo to designers (20-1)—seismicdesign methodology. CalTrans, Sacramento
Cardone D, Perrone G (2012) Critical load of slender elastomeric seismic isolators: an experimental per-spective. Eng Struct 40:198–204
Cardone D, Dolce M, Palermo G (2009) Direct displacement-based design of seismically isolated bridges.Bull Earthq Eng 7(2):391–410
Cardone D, Palermo G, Dolce M (2010) Direct displacement-based design of buildings with differentseismic isolation systems. J Earthq Eng 14(2):163–191
Chen WF, Duan L (eds) (2003) Bridge engineering: seismic design (principles and applications in engi-neering). CRC Press, Boca Raton
Constantinou MC, Whittaker AS, Kalpakidis Y, Fenz DM, Warn GP (2007) Performance of seismic iso-lation hardware under service and seismic loading. MCEER-07-0012, Multidisciplinary Center forEarthquake Engineering Research, University at Buffalo, New York
Dezi F, Carbonari S, Leoni G (2013) Lumped parameter model for the time-domain soil-structure interactionanalysis of structures on pile foundations. ANIDIS, Padova
Dorfmann A, Burtscher SL (2000) Aspects of cavitation damage in seismic bearings. J Struct Eng126:573–579
European Committee for Standardization (ECS) (2005a) Structural bearings—Part 3: elastomeric bearings(EN 1337-3). ECS, Brussels
European Committee for Standardization (ECS) (2005b) Eurocode 8: design of structures for earthquakeresistance, Part 1: general rules, seismic actions and rules for buildings (EN 1998-1). ECS, Brussels
European Committee for Standardization (ECS) (2005c) Eurocode 8: design of structures for earthquakeresistance, Part 2: bridges (EN 1998-2). ECS, Brussels
European Committee for Standardization (ECS) (2009) Anti-seismic devices (EN 15129. ECS, BrusselsGent AN (1990) Cavitation in rubber: a cautionary tale. Rubber Chem Technol 63:49–53Gent AN, Lindley PB (1959) Internal rupture of bonded rubber cylinders in tension. Proc R Soc Lond A
Math Phys Eng Sci 249(1257):195–205Grant DN, Fenves GL, Whittaker AS (2004) Bidirectional modelling of high-damping rubber bearings.
J Earthq Eng 8:161–185Iervolino I, Galasso C, Cosenza E (2010) REXEL: computer aided record selection for code-based seismic
structural analysis. Bull Earthquake Eng 8(2):339–362Japan Road Association (JRA) (2002) Chapter 1: seismic design specifications for highway bridges.
International Institute of Seismology and Earthquake Engineering, Japan Road Association, TokyoKappos AJ, Saiidi MS, Aydinoglu MN, Isakovic T (2012) Seismic design and assessment of bridges,
inelastic methods of analysis and case studies. In: Geotechnical, geological and earthquake engi-neering. Springer
Katsaras CP, Panagiotakos TB, Kolias B (2009) Effect of torsional stiffness of prestressed concrete boxgirders and uplift of abutment bearings on seismic performance of bridges. Bull Earthq Eng7(2):363–375
Kelly JM (1997) Earthquake-resistant design with rubber. Springer, LondonKoh CG, Kelly JM (1987) Effects of axial load on elastomeric isolation bearings. EERC/UBC 86/12,
Earthquake Engineering Research Center, University of California, Berkeley, p 108Kumar M, Whittaker AS, Constantinou MC (2014) An advanced numerical model of elastomeric seismic
isolation bearings. Earthq Eng Struct Dyn 43:1955–1974Lee GC, Kitane Y, Buckle IG (2001) Literature review of the observed performance of seismically isolated
bridges. In: Research progress and accomplishments: multidisciplinary center for earthquake engi-neering research, pp 51–62
Lesgidis N, Kwon OS, Sextos A (2015) A time-domain seismic SSI analysis method for inelastic bridgestructures through the use of a frequency-dependent lumped parameter model. Earthq Eng Struct Dyn44(13):2137–2156
Makris N, Badoni D, Delis E, Gazetas G (1994) Prediction of observed bridge response with soil–pile-structure interaction. J Struct Eng (ASCE) 120(10):2992–3011
Bull Earthquake Eng (2016) 14:1285–1310 1309
123
Manos GC, Mitoulis SA, Sextos A (2012) A knowledge-based software for the design of the seismicisolation system of bridges. Bull Earthq Eng 10(3):1029–1047
McKenna F, Fenves GL, Scott MH (2006) OpenSees: open system for earthquake engineering simulation.Pacific Earthquake Engineering Center, University of California, Berkeley
Mitoulis SA (2014) Uplift of bearings in isolated bridges subjected to longitudinal seismic actions. StructInfrastr Eng. doi:10.1080/15732479.2014.983527
Muhr AH (2006) Effect of thickness of reinforcing plates on rubber-steel laminated bearings. In: 6th Worldconference on joints and bearings and seismic systems for concrete structures, Halifax, 17–21 Sept2006
Muhr AH (2007) Mechanics of Elastomer-Shim laminates. CMC 5(1):11–30Olmos B, Roesset J (2012) Inertial interaction effects on deck isolated bridges. Bull Earthq Eng
10(3):1009–1028Pond TJ (1995) Cavitation in bonded natural rubber cylinders repeatedly loaded in tension. J. Nat Rubber
Res 10(1):14–25Tubaldi E, Dall’Asta A (2011) A design method for seismically isolated bridges with abutment restraint.
Eng Struct 33(3):786–795Ucak A, Tsopelas P (2008) Effect of soil-structure interaction on seismic isolated bridges. J Struct Eng
134(7):1154–1164Warn GP, Whittaker AS, Constantinou MC (2007) Vertical stiffness of elastomeric and lead-rubber seismic
isolation bearings. J Struct Eng 133(9):1227–1236Yang QR, Liu WG, He WF, Feng DM (2010) Tensile stiffness and deformation model of rubber isolators in
tension and tension-shear states. J Eng Mech 136:429–437
1310 Bull Earthquake Eng (2016) 14:1285–1310
123