a pat to prouer protalt - holstein canada...5. proactively positioning the dairy cattle improvement...
TRANSCRIPT
2010 ANNUAL REPORT
A PATH TO PRODUCER PROFITABILITYHolstein Canada, 20 Corporate Place, Brantford, ON N3R 8A6 | Tel: 519-756-8300 | Fax: 519-756-3502 | www.holstein.ca

Blondin Redman Seisme (VG-89)
President’s Message
Board of Directors’ Report
Chief Executive Officer Report
Business Activity
Action Taken from 2010 Resolutions
Financial Report
Provide leadership through genetic improvement programs to enhance profitability for all
dairy producers.
3
4
7
8
9
13
TABLE OF CONTENTS
Mission Statement
Supreme Champion 2010 Royal Agricultural Winter Fair
2
The governance of our Association and our responsibility towards
our members has been emphasized this past year. Our goal now
consists of ensuring improved communication between the national
Association and its respective branches, always striving to be closer
to our customers. The issues discussed at various levels directly affect
our clients and members and the profitability of their operations. In
conclusion, I would like to sincerely thank everyone who has sat on the
Board of Directors for the trust they have bestowed upon me during
my mandate at Holstein Canada. Together, we have accomplished and
initiated change that will have a major impact on our organization’s
future. Also, I wish to thank all the staff at Holstein Canada; it has
been an honour and a sheer pleasure getting to know you. I appreciate
you for your commitment, respect, and love of our Association.
Finally, thank you to the whole Lehoux family; to my wife Claire, my
children Audrey, Mathieu, Valérie, Marie-Ève, Dany and Pier-Olivier for
their support throughout this wonderful adventure you have allowed
me to fulfill. And finally, I thank you dear friends and… good luck with
Holstein Canada Network!
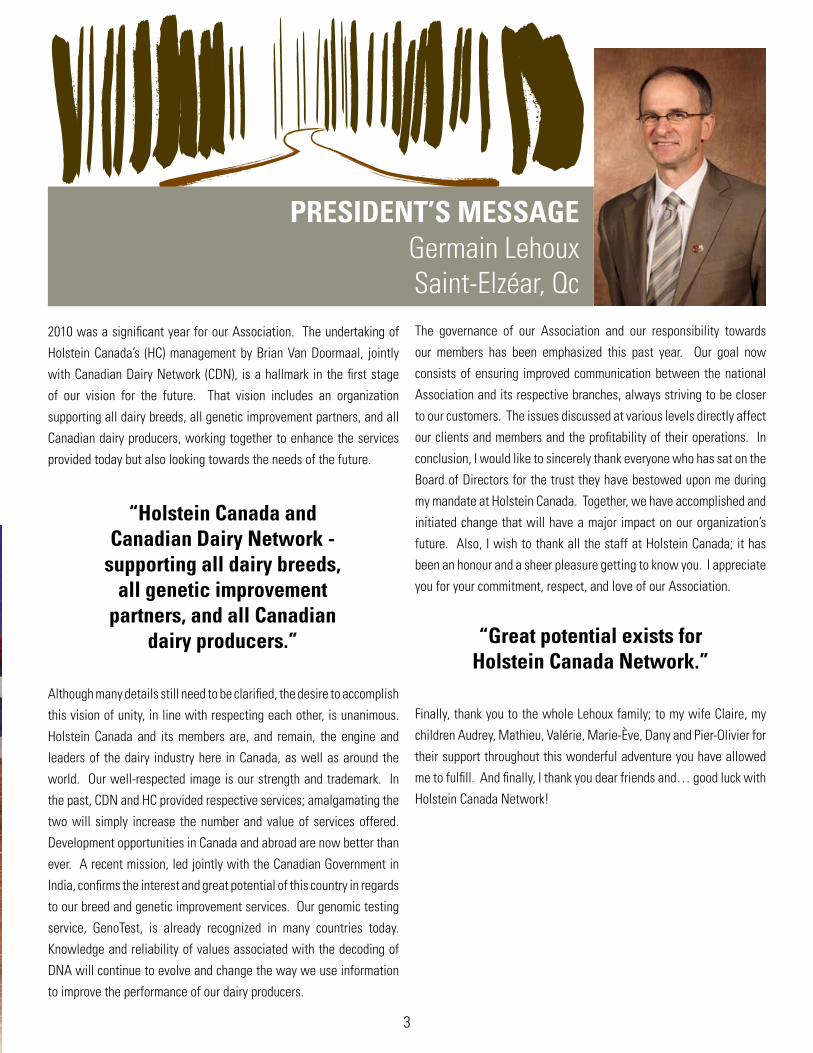
2010 was a significant year for our Association. The undertaking of
Holstein Canada’s (HC) management by Brian Van Doormaal, jointly
with Canadian Dairy Network (CDN), is a hallmark in the first stage
of our vision for the future. That vision includes an organization
supporting all dairy breeds, all genetic improvement partners, and all
Canadian dairy producers, working together to enhance the services
provided today but also looking towards the needs of the future.
Although many details still need to be clarified, the desire to accomplish
this vision of unity, in line with respecting each other, is unanimous.
Holstein Canada and its members are, and remain, the engine and
leaders of the dairy industry here in Canada, as well as around the
world. Our well-respected image is our strength and trademark. In
the past, CDN and HC provided respective services; amalgamating the
two will simply increase the number and value of services offered.
Development opportunities in Canada and abroad are now better than
ever. A recent mission, led jointly with the Canadian Government in
India, confirms the interest and great potential of this country in regards
to our breed and genetic improvement services. Our genomic testing
service, GenoTest, is already recognized in many countries today.
Knowledge and reliability of values associated with the decoding of
DNA will continue to evolve and change the way we use information
to improve the performance of our dairy producers.
PRESIDENT’S MESSAGEGermain LehouxSaint-Elzéar, Qc
“Holstein Canada andCanadian Dairy Network -
supporting all dairy breeds, all genetic improvement
partners, and all Canadian dairy producers.” “Great potential exists for
Holstein Canada Network.”
3

Changes throughout 2010 for Holstein Canada’s Board of Directors
started right at the top, with Brian Van Doormaal hired as its new Chief
Executive Officer (CEO). This makes Brian the CEO of both Holstein
Canada and Canadian Dairy Network (CDN).
One of Brian’s mandates is the merger of CDN and Holstein Canada.
Key reasons and goals for this amalgamation include:
The Board of Directors and management of both organizations will
also address these areas individually.
Following meetings with the other dairy breeds, it has been agreed
that Holstein Canada would become the service provider. The Board
of Directors approved the memorandum of understanding that has
been signed by all partners. It is the intent to offer this service by the
end of 2012. This move falls in line with the positive acceptance of
the All-Breeds Classification initiative. This will benefit all Canadian
dairy producers.
The uptake in the use of genomics—especially with the GenoTest
launch and partnering with the Semex Alliance—has been outstanding.
As the number of animals tested increases, so does the reliability of
the information provided by this technology. We recognize this as one
of the tools of the future, needed to increase the profitability of the
industry.
In response to the resolution on Master Breeder points, the Awards
Committee reviewed and has suggested that a section be included
for awarding points due to longevity in addition to production and
classification. Incorporating this component will allow for the breeders
of the Canadian cow to be recognized among the elite in the world for
breeding cattle with a combination of conformation, production, and
longevity. This is now being evaluated by staff, and will be submitted
to the Board of Directors for approval.
Animal identification is a core service of Holstein Canada. This falls
in line with the Canadian Quality Milk (CQM) standards, as well as
traceability, to continue keeping Canada at the forefront of the world
for all markets.
BOARD OF DIRECTORS’ REPORTChairman Paul MacLeodWoodstock, ON
4
1. Increasing efficiencies through the reduction of fees and/or increasing value of services to producers.
2. Reducing costs associated with industry structure, administrative expenses, governance, and boards, etc.
3. Creating a structure allowing continued industry streamlining, both physical and services, in the future.
4. Strengthening our dairy industry through creating a body with a perspective in providing services that include animal identification, herdbook registration, genotyping, type classification, genetic evaluation, research co-ordination, and government relations.
5. Proactively positioning the dairy cattle improvement industry and dairy producers while the economic situation is healthy and self-sufficient.
This proposed merger initiated the formation of an amalgamation
team, which consists of three directors from each board. These
members will identify and assess the options in four areas:
1. Governance Structure
2. Legal Status and Corporate Name
3. Organizational Chart
4. Office Location

With the upcoming 2012 World Holstein Conference, Holstein Canada
continues to plan and prepare to host various tours and forums for
Holstein breeders worldwide. This Conference coincides with the
Royal Agricultural Winter Fair, our showcase of the best that Canada
has to display.
The Board of Directors reviews the mandates and makeup of all
committees. The success of our organization depends on having the
right people on committees that best suit their strengths to challenge
us to continue to move forward. We would like to thank those that have
served on the various committees for their time and commitment.
(back row, l-r) Orville Schmidt, AB; John Buckley, ON; John Davidson, NS; Ron Sleeth, ON(middle row, l-r) Richard Bosma, BC; Dale Strudwick, SK; Mario Perreault, Qc; Jean-Albert Fleury, Qc; Elyse Gendron, Qc; Brian Van Doormaal, Chief Executive Officer
(front row, l-r) Paul MacLeod, ON; Germain Lehoux, Qc; Glen McNeil, ON
5
2010 National Board of Directors
“Holstein Canada is proudly hosting the World Holstein
Conference in 2012.”
Next year will be a year of continued growth with the goals the Board
of Directors has established. The Board of Directors continues to
direct and protect the interest of our members. I would like to thank
all Board members, especially Germain Lehoux and John Davidson
who are retiring, for their time and commitment to the betterment of
the Holstein breed.

2010 EDUCATION AWARD WINNERS
CANADIAN CHAMPION 2010
• 5-Year-Old for Total Performance• 2 Super 3’s, 4 Superior Lactations• Calved at 2-01, 3-05, 4-06, 5-05• Breeder: William Moreland, Joyceville, ON• Owner: Mark Moreland, Joyceville, ON• Sire: Comestar Stormatic (EX-CAN)
Rustowil Stormy Stavros (EX-90-CAN)
Jonathan Gord AlblasBranchton, ON
Mélanie BoucherAudet, QC
Nicholas BrownLower Cove, NB
Kenton LindenbachBalgonie, SK
Eric MartinRipley, ON
Mélissa PerreaultSaint-Bernard-de-Michaudville, QC
MILK
FAT
PROTEIN
TOTAL
23,750
1,066
686
475 (+215)
576 (+289)
434 (+164)
1,485 (+668)
Production (kg) BCA05-05 305 (Deviation)
(4.5%)
(2.9%)
6

CHIEF EXECUTIVE OFFICER REPORTBrian Van Doormaal
For the Holstein Association of Canada and the Canadian dairy industry
2010 has been exemplary in terms of vision, leadership, embracing
opportunity and success. With the goal of finding a new CEO for the
Association, the Board of Directors converted a difficult challenge into
a major opportunity. The new strategic direction included a common
manager for Holstein Canada and Canadian Dairy Network (CDN) with
the vision of amalgamating the two nationally scoped organizations
into a single entity. While many agree this direction is logical and the
right one, it is a huge challenge that can only be achieved with your
support and commitment as members. Seize this opportunity, embrace
this change and shape it in a manner that proactively positions Holstein
Canada and Canadian dairy producers for the future.
Genomics has revolutionised our industry and will continue to do
so. The only question is at what speed? During 2010, your Board of
Directors and management team have wrestled with this ‘force’ to
maximize the opportunities that genomics can bring to the Association,
its members and the Canadian industry, while reinforcing existing core
services. To this end, the launch of 3K genotyping and the GenoTest
Program in September 2010, in collaboration with Semex Alliance
has broadened the opportunity for low-cost genotyping of heifers
and cows to all producers across the country. Thanks to you and your
commitment to our services, 2010 represents an all-time record year
for herdbook registration, type classification and genotyping services,
which translated into a significant financial surplus for the year.
Another area of important opportunity for the industry has been the
discussions among all breed associations to establish a common
provider of services beyond type classification and genomic testing.
The fruitful meetings during 2010 have been nothing short of
remarkable. Within a six month time frame from May to November, all
seven Canadian dairy cattle breed associations reached agreement to
commit resources towards the development of a system for common
herdbook services to be offered by Holstein Canada. The menu of
services that each breed association is expected to be offered, starting
late 2012, includes herdbook registration, parentage verification
using DNA, pedigree services, memberships, invoicing for services,
award calculations, and database support for respective web sites.
A working group led by Linda Markle, which involves staff from each
breed association and CDN, has been established to proceed with
this major industry initiative. Simultaneously, the management team
at Holstein Canada has prioritised the development of the required
database design and computer system to meet the current and future
business needs of the organisation.
High activity levels of existing services, the introduction of new
services and the planning for future business needs all impact your
Association staff. Whether it is the classifiers working at the farm level
or the staff at head office, everyone has had to boost their productivity
to achieve success in 2010. To each and every employee, I wish to
express sincere appreciation for your positive attitude, acceptance
of change and dedication towards quality customer service. Thank
you! Also, I have to recognize your Board of Directors with Germain
Lehoux as President and Paul MacLeod as Vice-President. Not only
have I been truly impressed with your leadership and compassion
for the Association, I have witnessed your dedication towards the
membership and your spirit of respect for each other. You have openly
welcomed me into the Holstein Canada family as your CEO and it has
been a great honour and privilege working for you and with you. I
sincerely look forward to the great things ahead!
7
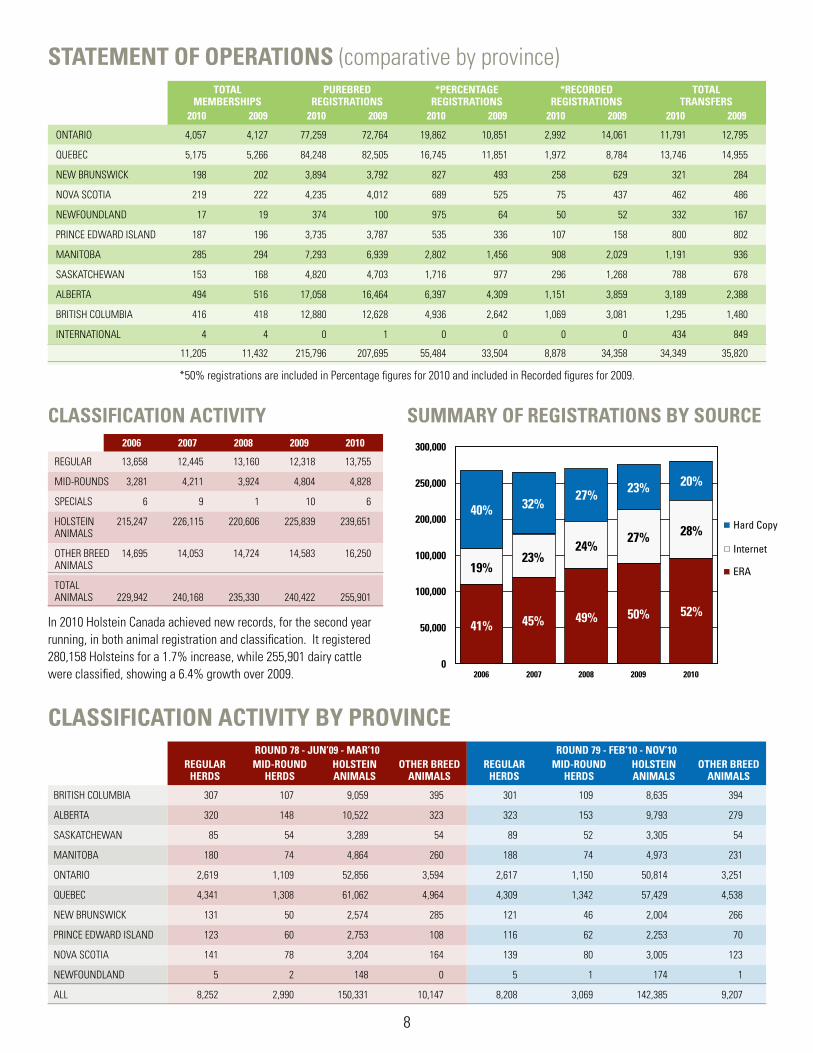
STATEMENT OF OPERATIONS (comparative by province)
ONTARIO
QUEBEC
NEW BRUNSWICK
NOVA SCOTIA
NEWFOUNDLAND
PRINCE EDWARD ISLAND
MANITOBA
SASKATCHEWAN
ALBERTA
BRITISH COLUMBIA
INTERNATIONAL
4,057
5,175
198
219
17
187
285
153
494
416
4
4,127
5,266
202
222
19
196
294
168
516
418
4
TOTALMEMBERSHIPS
PUREBREDREGISTRATIONS
*PERCENTAGEREGISTRATIONS
*RECORDEDREGISTRATIONS
TOTALTRANSFERS
2010 2009 2010 2009 2010 2009 2010 2009 2010 2009
77,259
84,248
3,894
4,235
374
3,735
7,293
4,820
17,058
12,880
0
72,764
82,505
3,792
4,012
100
3,787
6,939
4,703
16,464
12,628
1
19,862
16,745
827
689
975
535
2,802
1,716
6,397
4,936
0
10,851
11,851
493
525
64
336
1,456
977
4,309
2,642
0
2,992
1,972
258
75
50
107
908
296
1,151
1,069
0
14,061
8,784
629
437
52
158
2,029
1,268
3,859
3,081
0
11,791
13,746
321
462
332
800
1,191
788
3,189
1,295
434
12,795
14,955
284
486
167
802
936
678
2,388
1,480
849
11,205 11,432 215,796 207,695 55,484 33,504 8,878 34,358 34,349 35,820
BRITISH COLUMBIA
ALBERTA
SASKATCHEWAN
MANITOBA
ONTARIO
QUEBEC
NEW BRUNSWICK
PRINCE EDWARD ISLAND
NOVA SCOTIA
NEWFOUNDLAND
ALL
307
320
85
180
2,619
4,341
131
123
141
5
8,252
CLASSIFICATION ACTIVITY BY PROVINCEROUND 78 - JUN’09 - MAR’10
REGULARHERDS
MID-ROUNDHERDS
HOLSTEINANIMALS
OTHER BREEDANIMALS
REGULARHERDS
MID-ROUNDHERDS
HOLSTEINANIMALS
OTHER BREEDANIMALS
ROUND 79 - FEB’10 - NOV’10
107
148
54
74
1,109
1,308
50
60
78
2
2,990
9,059
10,522
3,289
4,864
52,856
61,062
2,574
2,753
3,204
148
150,331
395
323
54
260
3,594
4,964
285
108
164
0
10,147
301
323
89
188
2,617
4,309
121
116
139
5
8,208
109
153
52
74
1,150
1,342
46
62
80
1
3,069
8,635
9,793
3,305
4,973
50,814
57,429
2,004
2,253
3,005
174
142,385
394
279
54
231
3,251
4,538
266
70
123
1
9,207
SUMMARY OF REGISTRATIONS BY SOURCECLASSIFICATION ACTIVITY
REGULAR
MID-ROUNDS
SPECIALS
HOLSTEINANIMALS
OTHER BREEDANIMALS
TOTALANIMALS
13,658
3,281
6
215,247
14,695
229,942
12,445
4,211
9
226,115
14,053
240,168
13,160
3,924
1
220,606
14,724
235,330
12,318
4,804
10
225,839
14,583
240,422
13,755
4,828
6
239,651
16,250
255,901
2006 2007 2008 2009 2010
In 2010 Holstein Canada achieved new records, for the second year running, in both animal registration and classification. It registered 280,158 Holsteins for a 1.7% increase, while 255,901 dairy cattle were classified, showing a 6.4% growth over 2009.
8
*50% registrations are included in Percentage figures for 2010 and included in Recorded figures for 2009.
Hard Copy
ERA
Internet
40%
19%
41%
32%
23%
45%
27%
24%
49%
23%
27%
50%
20%
28%
52%
300,000
250,000
200,000
100,000
100,000
50,000
02006 2007 2008 2009 2010

ACTION TAKEN FROM 2010 RESOLUTIONS1. MID-ROUND CLASSIFICATION FEE
Submitted by: Nova Scotia / Newfoundland Holstein Branch
“Whereas additional Holstein breeders participate in mid-round classifications than when the program was originally announced, thus decreasing costs per Club or Provincial visits; and
Whereas it is important to the entire industry to collect information on young sire daughters relating to classification in a timely fashion; and
Whereas it is important to encourage all herds to classify; and
Whereas it is a greater convenience with respect to time and labor for large herds, in particular, to classify more often;
Therefore be it resolved that the $100.00 fee charged by Holstein Canada for Mid-Round Classifications be eliminated. Further, be it resolved that the Mid-Round Classifications be at the same cost as Regular round Classifications.”
The Board of Directors discussed this request noting that a detailed study comparing the mid-round and regular round services had been conducted in 2006. In principle, customers of one level of service should not subsidize customers of another level of service. A 2010 analysis presented to the Board of Directors showed that 36.3 percent of all herds used the mid-round service in Round 78. This ranged across clubs from 0 percent to over 80 percent. From a cost perspective, it was concluded that an additional mid-round fee was warranted. The Board therefore agreed to maintain its current policy of ‘user-pay’ services.
2. COMPUTER GENERATED REGISTRATION PAPERS
Submitted by: Ontario Holstein Branch
“Whereas it has been mentioned that Holstein Canada may offer the opportunity for Holstein breeders to print their own registration papers; and
Whereas Waterloo Holstein Breeders wish to express their concern of the possibility of fraudulent use;
Therefore be it resolved that Holstein Canada Board of Directors proceed with caution before offering this service to the membership.”
3. PORTRAITS ON HOLSTEIN CANADA WEBSITE
Submitted by: Ontario Holstein Branch
“Whereas pictures are not visible on the animal inquiry portion of the website; and
Whereas this would enhance the value of portraits taken by breeders at the farm level and also would enhance the marketability of Canadian Holsteins by allowing international enthusiasts and potential buyers to view portraits of family members easily and reliably on a trusted website;
4. E-LISTS
Submitted by: Prince Edward Island Holstein Branch “Whereas the Holstein Association of Canada has a well established database of registered animals; and
Whereas Members, Holstein Clubs, Provincial Branches and show committees regularly use this database to create lists and programs for events; and
Whereas this task requires re-entering and reformatting data;
Therefore be it resolved that the Holstein Association of Canada create an application for their website that will allow users to easily create lists that can be formatted for show programs or other uses as required by the industry.”
The above three (3) resolutions relate to Holstein Canada’s computer system and website development therefore they were each taken under advisement by the Board of Directors for future consideration within the priorities of all computer development projects.
5. MAINTAIN AVAILABILITY OF DIRECT GENOMIC VALUE (DGV)
Submitted by: Québec Holstein Branch
“Whereas genomics is currently an important part in the selection of animals; and
Whereas the genomic lifetime profit index (GLPI) is based on 2 sources of information: the lifetime profit index (LPI) and the direct genomic value (DGV); and
Whereas Canadian breeders want to know the origin of the combined GLPI;
Therefore be it resolved that Holstein Canada ask the Canadian Dairy Network (CDN) that direct genomic value of each animal remain available to all breeders.”
It was noted that direct genomic values were currently available, and no intent presently existed to cease their publication by Canadian Dairy Network (CDN).
9
Therefore be it resolved that Holstein Canada develop a system on the animal inquiry portion of the website that would allow professional portraits to be displayed along with all other pedigree information.”

7. TRACEABILITY
Submitted by: Ontario Holstein Branch
“Whereas considerable resources are already invested in bovine identification and to ensure consumer confidence in animal products and for producer protection;
Therefore be it resolved that Holstein Canada pressure the powers that be to implement mandatory registration with enhanced tag quality and 100% adaptation of all bovines with full traceability of movement from birth to after death.”
This resolution was taken under advisement by the Board of Directors recognizing that the achievement of full traceability was a process of time. Holstein Canada staff are collaborating with Dairy Farmers of Canada (DFC) as the lead organization for implementing a national dairy cattle traceability system.
Bridon Farms Inc.
Phoenix Bros.
Ferme Prés Verts inc.
Elmbridge Farms
Erbcrest Farm
Ferme Gilson inc.
Heather Holme Holsteins
Les Hectares Verts inc.
Maple-Ain Holsteins
Quecy Holstein
Raivue Farms Ltd.
Rock Hébert & Nathalie Dumais
Sandy Crest Holsteins
Shylane Holsteins
Smithden Holsteins Inc.
Stanhope Dairy Farm Ltd.
Stanton Farms
Sunspark Farms Inc.
Ferme Vinbert inc.
Wikkerink Farms Ltd.
BRIDON
DAPPLEDALE
DEPRESVERTS
ELMBRIDGE
ERBCREST
GILSON
HEATHER HOLME
HECTARE
MAPLE-AIN
QUECY
RAIVUE
ROTALY
SANDY CREST
SHYLANE
SMITHDEN
STANHOPE
STANTONS
SUNSPARK
VINBERT
WIKKERINK
Paris, ON
Greenbank, ON
Saint-Gabriel-de-Rimouski, Qc
Chilliwack, BC
Milverton, ON
Upton, Qc
Goderich, ON
Roxton Pond, Qc
Smith Falls, ON
Saint-Isidore-de-Dorchester, Qc
Sunderland, ON
Sainte-Hélène-de-Kamouraska, Qc
Arnprior, ON
Shakespeare, ON
Woodstock, ON
Victoria, BC
Ilderton, ON
Hepworth, ON
Acton Vale, Qc
Norwich, ON
6. MASTER BREEDER POINTS
Submitted by: Ontario Holstein Branch
“Whereas HAC takes great pride in long living high production cows; and
Whereas Master Breeder points are capped at 2E and 100,000 kgs.;
Therefore be it resolved that HAC consider awarding additional points for cows scoring 3E or higher or produce over 120,000 kgs.”
This resolution request was reviewed in detail by the Board of Directors and an ad-hoc Awards Committee has been appointed to review the entire Master Breeder Award formula. Consideration will be given to including a component for allocation of points based on longevity in addition to production and classification.
10
2010 MASTER BREEDERS
Grillsdale Holsteins

2009 COW OF THE YEAR (presented in 2010)
•••
•
•
Blondin Skychief Supra EX-93-3E-CAN 15* (12/67)
2010 CENTURY OF HOLSTEINS AWARD
Campbellwood, ON1911 - 2010
Breeder: Ferme Blondin, (Simon Lalande), Saint-Placide, QcOwners: Ferme Blondin and Pierre Boulet, Montmagny, QcBest 305: 9yr. 17,354 kg M 710 kg F 4.1% 525 kg P 3.0%BCAs 355 397 339 Dev. +119 +127 +88Lifetime: 6 lacts: 119,657 kg M 4,630 kg F 3.9% 4,062 kg P 3.4% Average BCAs 276 268 2731 Superior Lactation
GENOMIC TESTING
Genomic testing continues to be an important service offered by
Holstein Canada to dairy producers. In September, Holstein Canada
partnered with Semex Alliance to launch GenoTest, which included
the newly available 3K test. At the same time nasal swabs were
offered as a convenient and effective method to collect DNA samples.
The use of genomic testing continues to expand as this technology
evolves and producers realize the benefits.
Genomic Testing completed in 2010*TotalNasalHair
50K 1,909 29 1,938
3K (Sept - Dec) 786 698 1,484
Total 2,695 727 3,422
*excludes testing for special research projects
11
Grillsdale Holsteins

REGISTRY
BREED IMPROVEMENT
MARKETING
NLID
BOARD & EXECUTIVE
ADMINISTRATION
INFORMATION TECHNOLOGY
DEPRECIATION
$4,606,924
5,732,395
289,751
1,351,291
0
54,121
0
0
$12,034,482
SCHEDULE OF REVENUE AND EXPENSES
$4,193,879
5,407,436
239,648
1,282,995
0
53,259
0
0
$11,177,217
$1,705,118
3,899,397
928,467
1,361,792
1,170,286
985,807
975,019
411,273
$11,437,159
$1,637,239
3,710,208
881,056
1,227,255
1,217,641
1,149,704
1,109,659
439,429
$11,372,191
REVENUE2010 2009
EXPENSES
DEPARTMENT 2010 2009 2010 20092010 2009
EXCESS / (DEFICIT)
2010 2009
Total Revenue less
Total Expenses
= Excess (Deficit)
$597,323 ($194,974)
12

FINANCIAL REPORT 2010Rhonda Morley, Chief Financial OfficerSteady growth in core services has resulted in a net Operating Fund
surplus of $597,323 for the 2010 fiscal year.
The general operating revenue increased by 10.8% and exceeded $12
million at year-end. This favourable performance reflected the increase
in activity for herdbook, classification, and genotyping services.
During 2010, increased sales activity was recorded for registrations,
classifications, herd visits, genomic testing services and National
Livestock Identification (NLID) tags. As predicted, membership
numbers of 11,205 reflected a 2% decline, which is consistent with
the trend for the past several years.
Total operating expenses of $11.4 million reflected a 3.5% increase
compared to last year. The cost of tags went up in relation to the
number of tag sets sold and the laboratory costs were higher due to an
increase in the number of genomic tests. Additionally, the Association
incurred greater market development costs for breeder incentives
related to enrolment programs.
Holstein Canada’s Reserve Fund totalled $6.59 million and consisted of
an investment portfolio with an asset allocation of 8% cash and cash
equivalents, 17% equities and managed funds and 75% fixed income.
The Association continued to follow a conservative investment strategy
whereby the portfolio is designed primarily to produce income while
protecting the principal investment.
The Development Fund was used to support the 2012 World Holstein
Conference as well as a herd recruitment and retention program.
During 2010 Holstein Canada contributed $36,972 in funds for the two
initiatives.
2011 OutlookThe outlook for 2011 is cautiously optimistic with an expectation of
slightly less activity and a small surplus budgeted for the Operating
Fund. Consistent performance from the Reserve Fund investments is
expected as the economy continues to strengthen.
The Association remains committed to the highest standard of
financial management while continuing to offer services and programs
of benefit to our members and customers.
2010 SOURCES OF REVENUE
40% Classification
38% Registration3% Information
Services
5% Genomic Testing
2% Marketing11% NLID 1% Administration
13

STATEMENT OF OPERATIONS AND CHANGE IN FUND BALANCES
REVENUES
Income from Operations
Investment Income (Note 9)
$ 12,013,556
20,926
12,034,482
$ 298,813
298,813
$ 127
127
$ -
-
$ 12,013,556
319,866
12,333,422
$ 10,829,865
382,617
11,212,482
Year ended December 31, 2010
EXPENSES
Excess of Revenues Over Expenses
Transfer from Reserve to Development
Transfer from General to Development
Transfer from Development to Conference
Fair market value adjustment (Note 9)
Extraordinary Item -Funds received on dissolution
Fund Balances, Beginning
Fund Balances, Ending
RESERVEFUND
DEVELOPMENTFUND
CONFERENCEFUND
TOTAL 2010 TOTAL 2009OPERATINGFUND
11,437,159
597,323
(370,912)
5,662,854
$ 5,889,265
298,813
(107,217)
62,909
6,339,435
$ 6,593,940
11,974
(11,847)
107,217
370,912
(25,000)
21,871
$ 463,153
25,488
(25,488)
25,000
18,787
$ 18,299
11,474,621
858,801
0
0
0
62,909
0
12,042,947
$ 12,964,657
11,759,611
(547,129)
0
0
0
203,230
142,611
12,244,235
$ 12,042,947
STATEMENT OF FINANCIAL POSITION
CURRENT ASSETS
Cash and Bank (Note 3)
Temporary Investments (Note 4)
Accounts Receivable (Note 5)
Other Receivables
Inventory
Prepaids
Due (to) from other funds
$ 1,104,797
1,252,827
1,323,785
157,571
29,618
139,237
207
4,008,042
$ 372,888
178,602
551,490
$ 163,233
300,127
(207)
463,153
$ 18,299
18,299
$ 1,659,217
1,731,556
1,323,785
157,571
29,618
139,237
0
5,040,984
$ 691,249
1,428,649
1,235,946
135,191
13,998
122,480
0
3,627,513
as at December 31, 2010
RESERVEFUND
DEVELOPMENTFUND
CONFERENCEFUND
TOTAL 2010 TOTAL 2009OPERATINGFUND
CURRENT LIABILITIES
Accounts Payable & Accrued Liabilities
FUND BALANCES
Invested in Capital Assets
Unrestricted
$ 1,204,047
3,085,270
2,803,995
5,889,265
$ 7,093,312
6,593,940
6,593,940
$ 6,593,940
463,153
463,153
$ 463,153
18,299
18,299
$ 18,299
$ 1,204,047
3,085,270
9,879,387
12,964,657
$ 14,168,704
$ 933,237
3,353,816
8,689,131
12,042,947
$ 12,976,184
INVESTMENTS
Reserve Fund (Note 6)
CAPITAL ASSETS (Note 7) 3,085,270
$ 7,093,312
6,042,450
$ 6,593,940 $ 463,153 $ 18,299
6,042,450
3,085,270
$ 14,168,704
5,994,855
3,353,816
$ 12,976,184
14

STATEMENT OF CASH FLOWSYear ended December 31, 2010
CASH FROM OPERATINGACTIVITIES
Excess (deficiency) of revenue over expenses
Items not affecting cash
Amortization ofcapital assets
(Gain) / Loss on disposal of capital assets
(Gain) / Loss on sale of investments
Amortization of premiums / discounts onheld to maturity inventments
(Changes) in non-cashworking capital
Net cash provided by(used in) operating activities
INVESTING ACTIVITIES
Additions to capital assets
Proceeds on disposal ofcapital assets
Proceeds on sale ofinvestments
Investment purchases
Funds received ondissolution
Interfund transfers
Net cash used ininvesting activities
INCREASE/(DECREASE)IN CASH AND BANK
CASH AND BANK, BEGINNING OF YEAR
CASH AND BANK,END OF YEAR
OperatingFund
$ 597,323
TOTAL
$ 298,813 $ (11,847) $ (25,488) $ 858,801
411,273 411,273
5,004 5,004
(6,188) (23,781) (29,969)
(11,326) 8,792 (127) (2,661)
996,086 283,824 (11,974) (25,488) 1,242,448
131,901 3,323 (7,010) 128,214
1,127,987 287,147 (18,984) (25,488) 1,370,662
(167,731) (167,731)
20,000 20,000
956,234 656,218 300,000 1,912,452
(941,500) (625,915) (600,000) (2,167,415)
0 0
(503,909) (76,914) 153,129 25,000 (402,694)
624,078 210,233 134,145 (488) 967,968
480,719 162,655 29,088 18,787 691,249
$ 1,104,797 $ 372,888 $ 163,233 $ 18,299 $ 1,659,217
ReserveFund
DevelopmentFund
ConferenceFund
(370,912) (107,217) 453,129 25,000 0
$ (194,974) $ 357,187 $ (703,129) $ (6,213) $ (547,129)
439,429 439,429
5,526 5,526
(14,911) (3,762) (20,000)
(8,547) (60,748) (69,295)
226,523 292,677 (704,456) (6,213) (191,469)
169,393 (3,323) (25,022) 141,048
395,916 289,354 (729,478) (6,213) (50,421)
(492,630) (492,630)
38,400 38,400
1,400,017 689,699 432,500 2,522,216
(1,457,543) (867,925) (216,042) (2,541,510)
142,611 142,611
(511,756) (555,488) 711,331 25,000 (330,913)
(115,840) (266,134) (18,147) 18,787 (381,334)
596,559 428,789 47,235 1,072,583
$ 480,719 $ 162,655 $ 29,088 $ 18,787 $ 691,249
(519,873) 494,873 25,000 0
(1,327)
2010Operating
Fund TOTALReserve
FundDevelopment
FundConference
Fund
2009
15

NOTES TO THE FINANCIAL STATEMENTSYear ended December 31, 2010
The Holstein Association of Canada is a national organization
authorized to register Holstein cattle in Canada. The basic purpose of
the Association is to improve the breed of Holstein cattle. To this end,
it maintains a Herd Book and provides many services to its members
to assist them in evaluating, selecting and improving their herds. The
Association is a non-profit organization and accordingly is not taxable
by virtue of Section 149 (1)(e) of the Income Tax Act.
1. PURPOSE OF THE ORGANIZATION
The financial statements of the Holstein Association of Canada have
been prepared in accordance with generally accepted accounting
principles, and reflect the following policies:
2. SIGNIFICANT ACCOUNTING POLICIES
Fund AccountingRevenues and expenses related to service delivery and administrative
activities are reported in the Operating Fund.
The Reserve Fund reports assets, liabilities and revenues and expenses
needed to provide for future contingencies.
The Development Fund reports assets, liabilities and revenues and
expenses needed for special projects and business development.
The Conference Fund reports assets, liabilities and revenues and
expenses needed for the 2012 World Holstein Conference.
Revenue RecognitionThe Association recognizes revenue as services are rendered.
Contributions ReceivableContributions receivable are recognized as an asset when the amounts
to be received can be reasonably estimated and ultimate collection is
reasonably assured.
InventoryThe inventory is recorded at the lower of cost and replacement cost.
Financial InstrumentsThe Association utilizes various financial instruments which include
cash, accounts receivable, temporary and long-term investments, and
accounts payable. Unless otherwise noted, it is management’s opinion
that the Association is not exposed to significant interest, currency or
credit risks arising from these financial instruments and the carrying
amounts approximate fair values.
All transactions related to financial instruments are recorded on a
settlement date basis.
The Association classifies its financial instruments into one of the
following categories based on the purpose for which the asset was
acquired. The Association’s accounting policy for each category is as
follows:
Held-to-maturity investmentsThese assets are non-derivative financial assets with fixed or
determinable payments and fixed maturities that the Association’s
management has the positive intention and ability to hold to maturity
and comprises certain investments in debt securities, GIC’s and T-Bills.
These assets are initially recognized at fair value and subsequently
carried at amortized cost, using the effective interest rate method, less
any provision for impairment. Transaction costs related to held-to-
maturity investments are included in the amount initially recognized.
Available-for-sale investmentsNon-derivative financial assets not included in the above category are
classified as available-for-sale and comprise certain investments in
equity instruments, including the Association’s investments in private
companies. All such instruments have a quoted market price in an
active market and are carried at fair value with changes in fair value
recognized as a separate component of the fund balance. Where a
decline in the fair value is determined to be other than temporary, the
amount of the loss is removed from the fund balance and recognized in
the statement of operations and changes in fund balances. Transaction
costs related to available-for-sale investments are included in the
amount initially recognized.
Loans and receivablesThese assets and liabilities are accounts receivable and accounts
payable and accrued liabilities and are measured at their fair market
values which are equal to the carrying amounts due to their short term
nature.
16

Measurement UncertaintyThe preparation of financial statements in accordance with Canadian
generally accepted accounting principles requires management to
make estimates and assumptions that affect the reported amounts
of assets and liabilities at the date of the financial statements, and
the reported amounts of revenues and expenses during the reporting
period. Actual results could differ from management’s best estimates
as additional information becomes available in the future.
Capital AssetsThe Association’s capital assets are recorded at cost. Amortization is
provided as follows:
Composite Rates Method
Building
Sculptures
Office furniture and equipment
Automobiles
Data processing
30 yr.
20%
30%
3-5 yr.
Straight-line
Straight-line
Declining-balance
Straight-line
Also included in capital assets is a Fafard Sculpture. This asset is not
depreciated as it is considered to be a work of art.
The Association’s bank accounts are held at one chartered bank. The
bank accounts earn interest at average rate of 0.20%
3. CASH AND BANK
4. TEMPORARY INVESTMENTS
2009
GICs, due between May 6, 2011and December 3, 2013, with interest rates between 1.25% and 4.45%
2010
$1,429,181 $1,127,461
Ontario savings bonds, due June 21, 2014, variable interest
302,375 301,188
$1,731,556 $1,428,649
A significant portion of the Association’s trade accounts receivable are
to individuals/organizations in the agricultural industry and, as such,
the Association is exposed to all the risks of that industry.
5. ACCOUNTS RECEIVABLE
The Government of Canada bonds have a carrying value of $204,860
(2009 - $409,910), a fair value of $203,045 (2009 - $403,813) and an
interest rate of 4.50% (2009 – 4.50%-9.50%). This investment will
mature within 2-5 years.
The Canadian provincial and public authorities bonds have a carrying
value of $2,245,511 (2009 - $2,042,631), a fair value of $2,232,408
(2009 - $2,033,095) and interest rates of 3.70%-6.00% (2009 – 4.40%-
6.00%). These investments will mature as follows: $200,310 within 1
year, $506,588 within 2 to 5 years and $1,525,510 after 5 years.
The Canadian corporate bonds have a carrying value of $2,140,548
(2009 - $2,244,448), a fair value of $2,119,962 (2009 - $2,224,419)
and interest rates of 4.10%-8.30% (2009 - 4.10% - 8.30%). These
investments will mature as follows: $300,190 within 1 year, $805,557
within 2 to 5 years and $1,014,215 after 5 years.
6. LONG-TERM INVESTMENTS - RESERVE FUND
2009
Bonds and debenturesGovernment of CanadaCanadian province and public authoritiesCanadian corporate
2010
$203,0452,232,4082,119,9624,555,415
$403,8132,033,0952,224,4194,661,327
Held to maturity investments:
Available for sale investments:
Preferred SharesEquitiesManaged Equities
359,301569,395558,339
$6,042,450
339,465481,057513,006
$5,994,855
Bonds and Debentures
The preferred shares have a carrying value of $363,980 (2009 - $363,980)
and a fair value of $359,301 (2009 - $339,465). The preferred dividend
yields range from 4.75%-6.00% (2009 – 4.75%-6.00%).
Preferred Shares
The equities consist of common shares with a carrying value of
$574,967 (2009 - $486,565) and a fair value of $569,395 (2009 -
$481,057). The shares have no fixed maturity dates and are generally
not exposed to interest rate risk. Dividends are generally declared on
an annual basis.
Equities
These equity pools have a carrying value of $552,797 (2009 - $551,405)
and a quoted market value of $558,339 (2009 - $513,006).
Managed Equities
17
Held to maturity investments:

The Association maintains a defined contribution pension plan for
all employees whereby it will match employee contributions up to a
maximum of 5% of salary. The pension expense for the year was
$211,627 (2009- $219,743).
8. PENSION PLAN
7. CAPITAL ASSETS
The operating fund investment income is comprised of interest income
from a bank account in the amount of $1,177 and interest income in the
amount of $19,749 on held to maturity investments.
The reserve fund investment income is comprised of interest income in
the amount of $283,824 and net gains/losses in the amount of $14,989
on investments classified as held to maturity or available for sale.
The development fund investment income is comprised of interest
income in the amount of $127 on held to maturity investments.
For available for sale investments held in the reserve fund, the total
amount of the gain recognized to adjust these investments to fair market
value at year end is $62,909 and has been included in the reserve fund
statement of operations and changes in fund balances.
9. INVESTMENT INCOME
Management has established policies and procedures to manage
risks related to financial instruments, with the objective of minimizing
any adverse effects on financial performance. A brief description of
management’s assessments of these risks is as follows:
(a) General Objective, Policies and Processes:The Board and management are responsible for the determination of the
Association’s risk management objectives and policies and designing
operating processes that ensure the effective implementation of the
10. FINANCIAL INSTRUMENT RISK EXPOSURE AND MANAGEMENT
Land
Building
Fafard Sculpture
Office furniture and equipment
Automobiles
Data processing
TOTALS:
$328,851
3,008,125
177,525
1,269,112
831,155
4,080,189
$9,694,957
$902,584
1,249,730
416,470
4,040,903
$6,609,687
$328,851
2,105,541
177,525
19,382
414,685
39,286
$3,085,270
$328,851
3,008,125
177,525
1,268,879
837,437
4,119,219
$9,740,036
$802,284
1,248,621
358,660
3,976,655
$6,386,220
$328,851
2,205,841
177,525
20,258
478,777
142,564
$3,353,816
objectives and policies. In general, the Association measures and
monitors risk through the preparation and review of monthly reports
by management.
(b) Credit Risk:Financial instruments potentially exposed to credit risk include cash
and cash equivalents and accounts receivable. Management considers
its exposure to credit risk over cash and cash equivalents to be remote
as the Association holds cash deposits at one major Canadian bank.
Accounts receivable are not concentrated significantly and therefore
the carrying amount of accounts receivable represents the maximum
credit risk exposure.
(c) Interest Rate Risk:The Association is exposed to interest rate risk arising from fluctuations
in interest rates depending on prevailing rates at renewal of investments.
To manage interest rate exposure, the Association invests in fixed
income vehicles backed by a chartered bank.
(d) Liquidity Risk:Liquidity risk is the risk the Association will not be able to meet its
financial obligations as they come due. The Association has taken
steps to ensure that it will have sufficient working capital available to
meet its obligations.
The Association considers its capital to be comprised of its net assets
and deferred contributions. The Association is in compliance with all
its externally imposed capital requirements.
The Association manages capital to safeguard the organization’s ability
to operate and to meet its financial obligations as they become due.
11. CAPITAL MANAGEMENT
18
ACCUMULATEDAMORTIZATION
NET BOOKVALUE
COSTCOST ACCUMULATEDAMORTIZATION
NET BOOKVALUE
2010 2009
ASSET