a path to balance - center for american progress€¦ · a path to balance a strategy for...
TRANSCRIPT

WWW.AMERICANPROGRESS.ORG
AP PHO
TO/PABLO
MARTIN
EZ MO
NSIVA
IS
A Path to BalanceA Strategy for Realigning the Federal Budget
Michael Ettlinger, Michael Linden, and Lauren Bazel December 2009


A Path to BalanceA Strategy for Realigning the Federal Budget
Michael Ettlinger, Michael Linden, and Lauren Bazel December 2009


Introduction and summary | www.americanprogress.org 1
Introduction and summary
It’s time to show the world that the U.S. government has a path to reducing its budget de!cits. Current projections show that annual de!cits will be running at above 4 percent of gross domestic product and be on the rise even once the nation is well clear of the Great Recession. "at’s too high. "e mere prospect of large sustained de!cits poses risks to !nancial markets, endangers the rest of the economy, and undermines U.S. standing in the world. "e reality of those de!cits would mean pirating public expenditures away from needed public services and investments into the sinkhole of debt service. No one seriously denies that we face a real !scal challenge. We need lower de!cits.
Yet we need to move along a sloping path to get to those lower de!cits, not dive o# a precipice. It would be unwise to try to completely balance the budget at the same time as we are !ghting our way back from the worst economic period since the Great Depression. De!cit spending is needed right now to change the momentum of the economy and to spur growth. Policies that produce immediate GDP growth and a$ack unemployment will help the economy in the short term and the nation’s !scal health in the long term.
Spending reductions and revenue increases are the tools for achieving !scal balance, but just as important are the natural increases in revenue and reduced budget pressures that come from a strong economy. It is not only that jumpstarting the economy is currently a higher priority than de!cit reduction; it is also that running de!cits now will actually help reduce de!cits later by bringing about a faster recovery.
We shouldn’t leap to a balanced budget, but neither can we do nothing. Without a de!ned path that has credible stepping stones along the way, the markets and the world will wonder at our intentions, worry about purchasing the debt we’re selling, question invest-ments in the United States, and act with excessive caution in fear of higher interest rates. Balancing the budget right now could slam the brakes on economic recovery, but not embracing a way forward could slow our recovery as well, and in the worst case, provoke a crisis of con!dence that scu$les the progress we have made.
"e path proposed in this paper is a gradual one with an ultimate goal of a fully balanced budget in 2020, an intermediate target for 2014, and benchmarks along the way. Adopting such a path, as well as a way to enforce it, would send a strong signal to !nancial markets and the world that we are serious about addressing federal budget de!cits. It would also create a necessary discipline for Congress and the president.

2 Center for American Progress | A Path to Balance
Of course, having alternative routes is always advisable. "ere are many uncertainties regarding how economic and !scal circumstances will unfold over the next few years. Economic growth, unemployment levels, the timing of savings from health care reform, and war costs are not entirely predictable at this point and are variables that will need to be accounted for as we go along.
"e path we propose is, to a large extent, designed around those unknowns. We will have a be$er sense by 2014 of how the economy has recovered, how health care reform will a#ect costs, and where we stand with defense spending. But dictating a balanced budget that soon, with stringent limits along the way, would be irresponsible and unrealistic. By 2020 the economy should be well clear of the Great Recession, and we can honestly hope that the nation will be at peace and we will have started to see substantial !scal bene!ts from health reform. Other challenges may arise in the interim, but with a de!ned path and commi$ed policymakers, such challenges can be dealt with in the context of the goal of a balanced budget instead of swept under the rug as they have been in recent years.
"is paper proposes that the intermediate goal for 2014 be a return to the !scal discipline that existed in the 1990s before the Bush era practice of cu$ing taxes while increasing spending and engaging in two expensive wars. "e speci!c objective for 2014 is a budget that is in “primary balance”%where federal revenues equal program spending. "ere will still be overall de!cits under this plan because of the cost of payments on past debt, but we will be paying for all spending on federal government programs by 2014 under this proposal. Our estimate is that a primary balance in 2014 will equate to an overall de!cit of about 2.7 percent of GDP.1
But undoing the de!cit legacy of the Bush era is not enough. "ere are another set of forces driving our future de!cits, as well. "e aging of the population and rising health care costs have been pu$ing more and more pressure on the federal budget%and that pres-sure is only going to increase. "is has been well known for some time and was partially addressed under both a Republican president and a Democratic one. With bi-partisan support, President Reagan substantially extended the solvency of Social Security and President Clinton substantially extended the solvency of Medicare. Yet this discipline was lost under President Bush. In fact, the long-term problem was made worse when the Bush administration extended Medicare to prescription drugs without any plan to pay for it.
Another substantial challenge is cost of increased interest payments on the debt that has been built up by past de!cits. "ese payments are projected to exceed 11 percent of all spending by 2013 and top 15 percent by 2019.
Once primary balance is achieved in 2014, the next goal should be overall budget balance by 2020. "at is, revenues should be equal to all expenditures, including the cost of servic-ing the debt. Achieving a balanced budget will reduce our overall debt and our debt servic-ing costs. "is declining debt burden will leave us less vulnerable to interest and exchange

Introduction and summary | www.americanprogress.org 3
rate &uctuations and in a be$er !scal posture to deal with crises. If we can achieve budget balance by 2020, the nation will be in a strong position to face whatever challenges may lie ahead. Unanticipated events may still intervene, but achieving the !scal fortitude to withstand these crises by 2020 should be our ultimate goal.
"is paper also o#ers a path for annual de!cit improvement, starting in !scal year 2011, with speci!c yearly targets. "ese signposts will prevent us from meandering o# course and show the world that we are sincere about ge$ing to our destination. Our recommendation is that Congress pass and the president sign statutory mechanisms to enforce these targets.
"e !scal challenges we face are serious, but not insurmountable. It would be a mistake to try and balance the budget in the next few years, but it would also be a mistake to put o# any !scal improvement until some unde!ned later date. We should adopt a credible plan for balancing the budget over a reasonable amount of time with clear targets along the way in order to avoid the most dramatic dangers posed by intransigent de!cits. Adopting the plan o#ered here would demonstrate a very real commitment to !scal sustainability, without the risk of undermining economic recovery.

4 Center for American Progress | A Path to Balance
Dangers from deficit and debt
"e federal government in !scal year 2009 ran the largest de!cit since the end of World War II, measured as a share of the total economy. "e de!cit in !scal year 2010, which began on October 1, 2009, is likely to be close to that magni-tude. Even if Congress enacts the de!cit reduction measures proposed by President Barack Obama in his initial budget outline, de!cits will remain at or above 4 percent of GDP, with an upward trajectory, for the next decade. Debt levels are also expected to rise to heights not seen in close to 70 years. By 2019, debt as a share of GDP is projected to exceed 80 percent.2
"ese facts have generated a substantial amount of a$ention and angst. Some prominent !gures have played the role of Chicken Li$le, crying that the sky is falling and that we need to abandon other priorities and balance the budget imme-diately.3 Cooler heads have recognized that the immediate de!cits are in fact desirable given the economic situation.
"e de!cits projected beyond the recession are, however, of concern to everyone%though there are di#erences of opinion over how quickly they need to be addressed. Some believe that we have time and can ignore the problem for the immediate future. Others believe that, while we do have time, we nevertheless need to signal clearly now that we will take action later. Still others believe that we need to take action as soon as the economy is in recovery.
What almost everyone agrees on is that running de!cits of the size currently projected carries substantial risks and will eventually, if not immediately, lead to some undesirable outcomes. Large de!cits can reduce national savings, push up interest rates, spark in&ation, and adversely a#ect exchange rates. At the very least, running large de!cits requires borrowing, o'en from foreign investors, and that means diverting a portion of our future income to pay them back.4
Federal budget deficit as a percent of GDP, 1949-2019
-4%
-2%
0%
2%
4%
6%
8%
10%
12%Current projections without further deficit reduction
Source: Congressional Budget O!ce
19491953
19571961
19651969
19731977
19811985
19891993
19972001
20052009
20132017
Current projections without further deficit reduction
Publicly held debt as a share of GDP, 1949-2019
0%
10%
20%
30%
40%
50%
60%
70%
80%
90%
Source: Congressional Budget O!ce1949
19531957
19611965
19691973
19771981
19851989
19931997
20012005
20092013
2017
Federal budget deficit as a percent of GDP, 1949-2019
Source: Congressional Budget O!ce.
Publicly held debt as a share of GDP, 1949-2019
Source: Congressional Budget O!ce.

Dangers from deficit and debt | www.americanprogress.org 5
High de!cits, and their associated debt levels, can also prevent us from making needed investments. As the debt level grows, so too do interest payments on that debt. "ese inter-est payments are projected to rise to close to 4 percent of GDP by 2019, more than federal spending on all domestic discretionary programs combined.5 High de!cits also provide fodder to those who wish to block new initiatives and scale back existing programs. "e recent debates about economic stimulus, health care, and job creation show how the !scal situation can be exploited as a way to block even the most needed action.
Finally, there are risks that come with the mere perception that the federal budget is per-manently out of balance. "is perception could lead to serious economic consequences as creditors, investors, and traders try to protect themselves from the potential dangers. Fears of in&ation could become self-ful!lling if the federal government appears to have no inten-tion of, or credible plan for, bringing the budget back onto a sustainable path. "is would make borrowing more costly across the board and deter investment. In the worst-case scenario, another !nancial crisis could ensue.
All of these risks, from in&ation to potential !nancial crisis to ever growing interest payments, strongly suggest that the federal government needs to adopt a serious plan to achieve !scal sustainability within a reasonable time frame.
6 Center for American Progress | A Path to Balance
Our two fiscal challenges
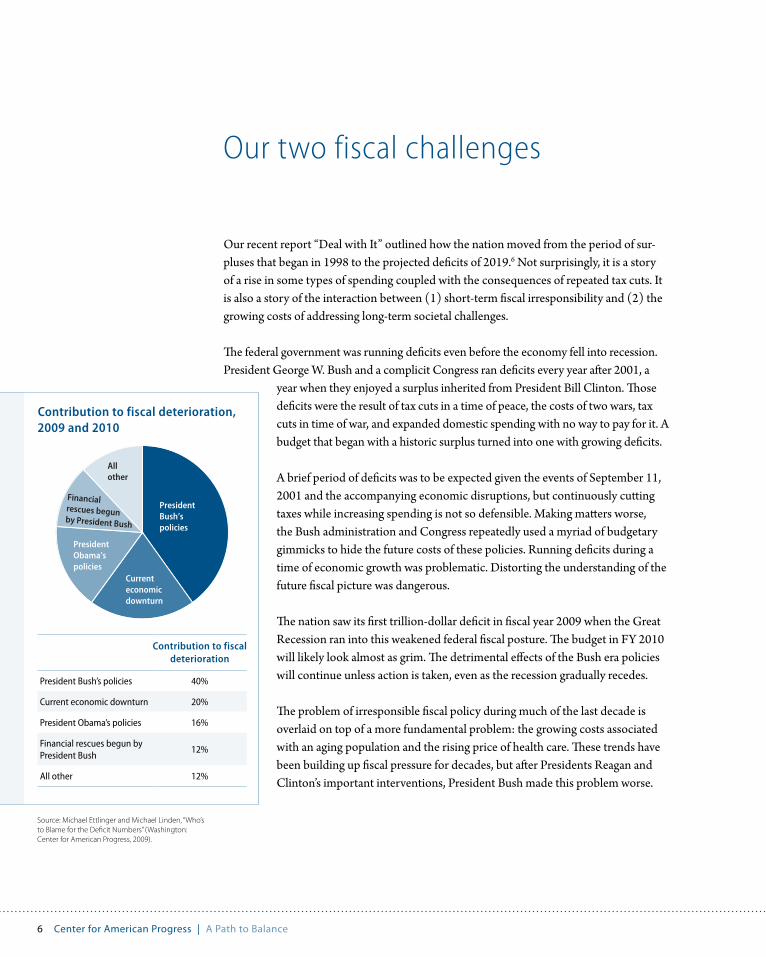
Our recent report “Deal with It” outlined how the nation moved from the period of sur-pluses that began in 1998 to the projected de!cits of 2019.6 Not surprisingly, it is a story of a rise in some types of spending coupled with the consequences of repeated tax cuts. It is also a story of the interaction between (1) short-term !scal irresponsibility and (2) the growing costs of addressing long-term societal challenges.
"e federal government was running de!cits even before the economy fell into recession. President George W. Bush and a complicit Congress ran de!cits every year a'er 2001, a
year when they enjoyed a surplus inherited from President Bill Clinton. "ose de!cits were the result of tax cuts in a time of peace, the costs of two wars, tax cuts in time of war, and expanded domestic spending with no way to pay for it. A budget that began with a historic surplus turned into one with growing de!cits.
A brief period of de!cits was to be expected given the events of September 11, 2001 and the accompanying economic disruptions, but continuously cu$ing taxes while increasing spending is not so defensible. Making ma$ers worse, the Bush administration and Congress repeatedly used a myriad of budgetary gimmicks to hide the future costs of these policies. Running de!cits during a time of economic growth was problematic. Distorting the understanding of the future !scal picture was dangerous.
"e nation saw its !rst trillion-dollar de!cit in !scal year 2009 when the Great Recession ran into this weakened federal !scal posture. "e budget in FY 2010 will likely look almost as grim. "e detrimental e#ects of the Bush era policies will continue unless action is taken, even as the recession gradually recedes.
"e problem of irresponsible !scal policy during much of the last decade is overlaid on top of a more fundamental problem: the growing costs associated with an aging population and the rising price of health care. "ese trends have been building up !scal pressure for decades, but a'er Presidents Reagan and Clinton’s important interventions, President Bush made this problem worse.
Contribution to fiscal deterioration, 2009 and 2010
Contribution to fiscal deterioration, 2009 and 2010
President Bush’spolicies
Currenteconomicdownturn
PresidentObama’spolicies
Financialrescues begunby President Bush
Allother
Contribution to fiscal deterioration
President Bush’s policies 40%
Current economic downturn 20%
President Obama’s policies 16%
Financial rescues begun by President Bush
12%
All other 12%
Source: Michael Ettlinger and Michael Linden, “Who’s to Blame for the Deficit Numbers” (Washington: Center for American Progress, 2009).

Our two fiscal challenges | www.americanprogress.org 7
Dealing with one of these challenges would be di(cult; dealing with both is harder and will take some time to solve. "is is another reason we allow 10 years for reaching our ulti-mate goal, with intermediate steps along the way. It is also the basis for, in essence, dividing the solution into two parts%a !rst step that restores basic responsibility, and a second step that tackles the much harder challenge of bringing revenues and spending in line in the face of all of the combined head winds.

8 Center for American Progress | A Path to Balance
The path to balance
The ultimate goal: a balanced budget by 2020
Our goal in tackling the !scal challenge does not have to be a completely balanced budget. We have run a de!cit in all but 12 of the 65 years since the end of World War II. "e average !scal balance over the period, leaving out recession years, has been a de!cit of 1.7 percent of GDP. Yet the republic has thrived. "ere are arguments that small de!cits ma$er, but it’s hard to argue they ma$er much. Most perceive that de!cits of less than 2 percent of GDP are safe, and some would argue that sustained de!cits as high as 3 percent of GDP are tolerable.
"ere are, however, two reasons not to accept persistent de!cits in the range of 2 to 3 percent of GDP. "e !rst is that “safe” or “tolerable” is not the same thing as “desirable.” De!cits in this range mean incurring debt and accruing debt-service costs. "ose costs are manageable at low levels, but there is seldom a reason for the government to run de!cits during good economic times. Government should be paying its bills. "e default position on the budget should be balance with the red ink reserved for recessions and emergencies.
"e second reason not to continue to tolerate de!cits when they are not needed is that we have an extraordinary amount of accumulated debt that we should pay down. Even if we follow the ambitious path outlined in this paper, we are almost certain to top debt of 70 percent of GDP%the highest levels since just a'er World War II. Debt levels have been at much lower levels when we have temporarily run de!cits of 2 or 3 percent of GDP in the past. Running de!cits in the range of 2 to 3 percent of GDP will not allow us to make a serious dent in our debt obligation. "is is a problem.
"ere are substantial consequences to carrying such high debt levels. One is simply that debt service becomes an enormous drain on the treasury. "e table on the le' shows an approximation of what the debt service costs would be at di#erent levels of debt as a share of GDP for 2014. "e di#erence in the cost of paying the interest on a debt level of 50 per-cent of GDP and 80 percent of GDP is enough to pay for the entire Department of Veteran A#airs, the entire space program, all Pell grants, and still have a li$le le' over.
Publicly held debt as a
share of GDP
Interest payments in 2014 (billions)
40% $257
50% $322
60% $386
70% $450
80% $515
90% $579
100% $643
Estimated interest payments given increasing levels of debt
Source: Author’s calculations based on the Congressional Budget O!ce’s June 2009 projection of the President’s 2010 budget request.

The path to balance | www.americanprogress.org 9
High debt levels also make the budget vulnerable to spikes in interest rates. When borrow-ing costs rise, the cost of debt service rises roughly proportionately. If interest rates were to go up by 10 percent, which is not an outlandish possibility, then all the numbers in the table would be approximately 10 percent higher.
Finally, the higher the debt is, the less &exibility the federal government has to deal with a crisis. For example, had debt already exceeded 60 percent of GDP when this Great Recession hit our ability to respond would have been much reduced. "e world is only willing to buy so much of our debt.
Absent unusual circumstances, the lower the debt, the be$er. And the quickest way to lower debt is balanced budgets or surpluses. Our ultimate goal should therefore be a fully balanced budget.
"e question is, when? "ere are important considerations that recommend a gradual approach to bringing down the de!cit. "ere is considerable uncertainty on the speed and vigor of the economic recovery, and continuing high levels of unemployment are almost a certainty. Dramatic cuts in spending or a rise in taxes could nip an economic recovery in the bud. Bringing unemployment down has to be a top priority. Furthermore, the current ambiguity surrounding several major aspects of the federal budget, including the cost of health care programs and defense spending, suggests we should take a gradual approach.
"ese uncertainties make it unwise to adopt a path to budget balance that is overly restric-tive. "is does not mean that we should postpone any action until all of the uncertainty disappears. It merely underscores the need to choose a path that is a$ainable and respon-sible, but will not excessively constrain policymakers as the appropriate course becomes clearer. Deadlines should not be too soon and the intermediate steps not too drastic.
Se$ing an ultimate target for complete budget balance in 2020 allows for a range of unexpected events along the way. "is path serves the goal of sensible !scal policy, as long as we return to the path, even as circumstances require deviation. But a long-term plan for addressing the de!cit needs clear benchmarks along the way to be credible.
An intermediate goal: primary balance by 2014
We propose a goal of “primary balance” by 2014 as a major intermediate objective. Primary balance is when total revenues equal total program expenditures. Achieving primary balance does not, it’s important to note, completely eliminate the overall budget de!cit, because interest payments on the debt are over and above program expenditures. But the federal government would not be spending more on programs, bene!ts, and ser-

10 Center for American Progress | A Path to Balance
vices than it collects in revenues. We estimate that the overall de!cit in 2014 will be about 2.7 percent of GDP if the federal government achieves primary balance. Meeting this goal is essentially a return to basic !scal responsibility.
"e target of revenues matching program spending has several features that make it appeal-ing. First, it is simple, clear, and easy to measure. Primary balance%like overall balance but unlike some other potential targets such as a de!cit that is a speci!c percent of GDP%is an objective that depends only on one number equaling another number, revenues equal-ing programmatic expenditures. Budget gimmicks to avoid compliance are less likely with such a clear measure.
Second, a budget in primary balance would stabilize publicly held debt as a share of the economy%although there can be small variations depending on interest rates and eco-nomic growth. A'er eight years of rising debt relative to GDP, this feature makes primary balance a$ractive as an intermediate step because it would mean an end to the !scal bleed-ing and put the budget on much more stable ground from which to take the next steps toward full balance.
"ird, this is an objective that we can achieve by 2014. "is more modest intermediate tar-get provides a credible goal, but will allow policymakers room to maneuver and recalibrate their e#orts as the path of the economy, the wars, and health spending become clearer.
The path to primary balance
Providing targets for 2014 and 2020 is not enough. Without benchmarks along the way, it is too likely that any target adopted will just be a distant glimmer in the annual budget-making process. But our ambitions should be modest, particularly in the immediate future as we face an uncertain climb from an economic abyss. "e benchmarks between now and 2014 should be a$ainable and allow room for further action to buoy the economy, yet constrain de!cits to a downward path.
"e statistic we suggest for measuring progress is the primary revenue-to-spending ratio%the ratio of federal government revenue to federal government spending.7 "is telling and underused measure captures the key relationship that determines the level of de!cit%the relationship between spending and revenues. Yet it avoids using dollar measures, which can be problematic as in&ation and the current economic outlook can change the meaning of hard dollar targets set well in advance. Other potential measures have similar limitations.
Benchmarks on the path to the 2014 target of primary balance are set at revenue-to-spend-ing ratios that represent percentages of noninterest or program spending required to be covered by revenues. When the 2014 target is hit, and revenues equal program spending, the primary revenue-to-spending ratio will equal 100 percent.

The path to balance | www.americanprogress.org 11
For 2009, total federal revenues equaled less than 64 percent of noninterest spending. "e ratio is expected to be about the same for !scal year 2010. "ese are record lows by a wide margin. "e previous post-war record was in 1983, under President Ronald Reagan, when revenues constituted 84 percent of noninterest spending.
Congress should adopt a very speci!c set of annual targets to gradually increase the pri-mary revenue-to-spending ratio. Our proposed targets are as follows:
Fiscal year 2011: revenues must equal 75 percent of programmatic spendingFiscal year 2012: revenues must equal 85 percent of programmatic spendingFiscal year 2013: revenues must equal 95 percent of programmatic spendingFiscal year 2014: revenues must equal 100 percent of programmatic spending
"is path requires signi!cant progress in each year, starting in !scal year 2011, and it results in complete primary balance within four years. "e improvements mandated by these targets can be achieved either by revenues rising up to meet expenditures, by programmatic spending dropping to meet revenues, or by some combination of the two.
Barring substantial economic setbacks, however, an improving economy alone should make the targets for 2011 and 2012 very reachable assuming that Congress does not extend the Bush era tax cuts set to expire at the end of 2010. "e targets for the later years, when the economy is expected to be in be$er shape are, !$ingly, more challenging.
"is path will steer the federal budget to much sturdier ground, and it will immediately signal the government’s intention and willingness to return to !scal responsibility a'er eight years of poor budgetary management.
The path to full balance
If primary balance is achieved in 2014, the budget will still have an overall de!cit. Revenues will fully cover noninterest spending, but the federal government will still have to borrow to pay for debt service expenditures. "e second step a'er accomplishing the intermediate goal of primary balance will be to move to overall balance by 2020.
We estimate that a 2014 budget in primary balance will mean that revenues will equal about 88 percent of total spending, which includes both programmatic spending and interest payments on the debt. Achieving the !nal goal will mean making deliberate progress from this overall revenue-to-spending ratio of 88 percent to 100 percent, when total revenues
The revenue to spending ratio and the proposed path to balance
Source: Congressional Budget O!ce.
The revenue to spending ratio and the proposed path to balance
0%
20%
40%
60%
80%
100%
120%
140%
160%
180%
19481952
19561960
19641968
19721976
19801984
19881992
19962000
20042008
20122016
2020
Revenues as a share of programmatic spending
Revenues as a share of total spending
Proposedpath
Source: Congressional Budget O!ce

12 Center for American Progress | A Path to Balance
will match total spending. And just as with the intermediate goal, policymakers should seek to hit speci!c targets along the way to ensure that the budget makes annual progress. We propose that those overall revenue-to-spending targets be:
Fiscal year 2015: revenues must equal 90 percent of all spendingFiscal year 2016: revenues must equal 92 percent of all spendingFiscal year 2017: revenues must equal 94 percent of all spendingFiscal year 2018: revenues must equal 96 percent of all spendingFiscal year 2019: revenues must equal 98 percent of all spendingFiscal year 2020: revenues must equal 100 percent of all spending
"is path requires measureable but not unrealistic progress in each year. "e culmination is a fully balanced budget.
Projected deficits as a percent of GDP
The above graph displays the unified deficits, expressed as a share of GDP, which we estimate would result from hitting the proposed targets. For comparison purposes, it also displays the unified federal deficits proposed by President Obama’s 2010 budget blueprint, as evaluated by the Congressional Budget O!ce in June 2009.
Source: Congressional Budget O!ce.
Projected deficits as a percent of GDP
0%
2%
4%
6%
8%
10%
12%
20102011
20122013
20142015
20162017
20182019
2020
Assuming targets are met
President Obama's 2010 budget
Source: Congressional Budget O!ce

Enforcing government benchmarks | www.americanprogress.org 13
Enforcing government benchmarks
Se$ing targets is only part of what the federal government needs to do to balance the budget. "ere must also be a way to ensure that the government adheres to these targets until it reaches the goal. Once the goal is hit, there should be a mechanism to ensure that budget discipline is maintained over the long term. "e challenge is how to design an enforcement mechanism that can impose su(cient discipline on the system while providing appropriate &exibility so lawmakers can adjust to changing national priorities and economic conditions. "ere are some lessons to be learned from past a$empts and principles to which lawmakers should adhere in designing such a mechanism.
Past attempts at establishing an enforcement mechanism
Congress has tried since the enactment of the Congressional Budget and Impoundment Control Act of 1974 to perfect a process that would help them achieve !scal discipline. "ese e#orts are, not surprisingly, associated with periods of high de!cits.
"e unprecedented de!cits caused by the Reagan era tax cuts and unpaid-for defense buildup led to the Balanced Budget and Emergency De!cit Control Act of 1985, also known as “Gramm-Rudman-Hollings.” "is bill established a schedule of !xed, declining de!cit targets and also created a sequestration procedure to automatically cut spending for many federal pro-grams if the de!cit for a !scal year was estimated to exceed a target level. "e crude statutory targets proved, however, to be unworkable. Congress and a complicit president were faced with the prospect of sequestration but failed to address the substantial de!cits. "ey employed bud-get tricks to make it appear as if the targets had been met or simply revised the targets rather than allow the automatic budget cuts to actually take e#ect.
Congress passed a multiyear de!cit reduction plan in 1990 to address the general failure of Gramm-Rudman-Hollings. "e Omnibus Budget Reconciliation Act raised taxes, reduced spending, and included new enforcement procedures%the Budget Enforcement Act. "e BEA took a less ambitious, more &exible approach to enforcing the de!cit reduction plan. It did not force lawmakers to enact legislation that achieved set de!cit targets; it instead focused on pre-venting new legislation from increasing the de!cit.
"e BEA looked at the distinct pieces of the federal budget and applied di#erent enforce-ment rules to each. Discretionary spending, which is allocated by the annual appropriations process, was limited by annual aggregate spending caps. New laws that a#ected mandatory

14 Center for American Progress | A Path to Balance
spending or revenues were covered by pay-as-you-go rules to prevent those laws from increas-ing the de!cit. An across-the-board reduction in discretionary program spending would have remedied a breach in the discretionary spending caps, and a breach of the PAYGO control triggered automatic sequestration of spending in certain mandatory programs.
"e next decade did witness an improving !scal situation. "e new budget processes made it di(cult for Congress to legislate increases to the de!cit. "e Clinton era tax increases and spend-ing discipline, coupled with strong economic growth, worked to turn de!cits into surpluses. "e federal budget climbed out of the red and ran surpluses from 1998 to 2001.
Yet Congress and President Bush allowed the statutory PAYGO and sequestration procedures that were enacted in 1990 and extended in the Balanced Budget Act of 1997 to expire in 2002. "is opened the doors to the budget-busting policies described above. "e House and Senate adopted rules in 2007 that a$empted to impose some budget discipline on the legislative process. But there is no sequestration or other sanction associated with those rules, which still exist today.
Considerations in designing an enforcement mechanism
"ere is li$le question that enforcement mechanisms, when designed correctly, can play an important role in helping policymakers adhere to budget goals. "ere are critical lessons to be learned from the last 35 years about how to design an e#ective budget enforcement regime that will complement the de!cit reduction targets set out in this plan.
First, the enforcement mechanism should be statutory. Mere congressional rules are too easily breached or disregarded. A system of PAYGO backed up by an automatic sequestration process, such as the BEA provided, should be reinstituted through federal law and reformed so that it is a true incentive for Congress to stay on course. Statutory PAYGO has worked to get Congress to enact responsible budgets in order to avoid a draconian imposition of sequestration. "e House of Representatives, by voting to reinstate statutory PAYGO rules this year, took a critical !rst step and the Senate should follow suit.
"at measure, however, will only help keep Congress from making the de!cit problem worse. It will not by itself drive de!cits down. Congress should set out a path toward balance with mea-surable targets that are e#ectively enforced. "ere are several elements that could be important to structuring a truly strong enforcement measure.
"e central objective of an enforcement measure should be to motivate Congress and the president to make the policy tradeo#s needed to hit targets, rather than face the arbitrary e#ects of sequestration. "e sequestration rules must therefore apply broadly. If the threat of sequestra-tion only puts a few programs at risk, the rules invite obstructionism.

Enforcing government benchmarks | www.americanprogress.org 15
"e concept of sequestration should be broadened beyond its previous implementations. It should apply to spending across the board. More importantly, it should include automatic tax increases as well as automatic spending cuts. Revenues that are too low are as much of the cause of de!cits as spending that is too high.
Automatic tax increases should be part of sequestration in two forms. First, across-the-board tax increases akin to the spending provisions should be in place. Second, with more-and-more government policy being implemented through the tax code rather than the spending bud-get, tax expenditures should be included in the automatic spending cuts. Tax expenditures are the equivalent of spending. In energy policy, for example, it’s measures like the oil deple-tion allowance and the Production Tax Credit; for innovation policy it’s the Research and Experimentation Tax Credit; and for housing policy it’s the mortgage interest deduction and the Low-Income Housing Tax Credit. "ese are government programs just like those that are handled through the spending side of the budget. Not including these costs distorts and under-mines the sequestration and would encourage lawmakers to move even more programs to the tax side of the ledger.
An across-the-board rule that requires in equal parts cuts in traditional government spending, cuts in tax expenditures, and increases in taxes would concern champions of all programs and opponents of all taxes. "e pain of such a sequestration rule would strongly motivate all policy-makers to engage in responsible budget making in order to avoid its use.
An enforcement mechanism must have teeth, but also be &exible when economic or other circumstances require a change in direction or short-term deviations. In the past, a safety valve was tripped when economic growth was negative for two consecutive quarters. "e federal unem-ployment rate would be a more appropriate trigger than falling GDP for temporarily suspend-ing budget discipline. We do not want to put the brakes on the economy by constraining de!cit spending as long as unemployment is high, even if there is GDP growth.
Congress and the president should certainly have the &exibility to forego strict compliance with the more stringent standards on the path outlined above when unemployment is high. "e path should be calibrated to the level of unemployment. When unemployment exceeds 8 percent, Congress and the president should be le' to their discretion on the appropriate level of de!cits. When unemployment is running in the 6.5 to 8 percent range, the !nal step to complete primary or total balance should not be required. More generally, any system should allow for exceptions where special circumstances and events occur. "e purpose of enforcement mechanisms is to further be$er budget policy, not block needed action.
Finally, no enforcement mechanism, no ma$er how expertly designed, will work unless there is broad, shared agreement among policymakers on the goals and targets%and continuing support as they start to bite. "e process can only support lawmakers’ will to make hard policy choices; it cannot be a substitute for it.

16 Center for American Progress | A Path to Balance
Conclusion
"e dangers posed by ignoring persistent, large de!cits are real, but so too are the dangers posed by overreacting or a$empting immediate !scal retrenchment. "at is why we have proposed a path toward full budget balance that entails signi!cant measurable steps for-ward in each year without risking our economic well-being.
Our plan includes both an ultimate goal of full balance by 2020 and an intermediate goal of primary balance by 2014. "e plan also includes annual benchmarks against which we can measure our progress toward the goals. We have also outlined some principles to guide lawmakers in se$ing up a budget enforcement regime that will help them achieve the goals in recognition that a de!cit reduction plan without enforceable rules for budget discipline
is less likely to succeed.
"e results of following this path will be notable. Our national debt will pause at 70 percent of GDP instead of climbing to 80 percent of GDP or more; it will drop to 65 percent of GDP by 2020, and it will be on a downward trajectory.8 Markets will be reassured, the burden of paying of debt will be relieved, more funds for impor-tant services and investments will be available, and we will have a stronger nation.
Ge$ing the federal budget into balance will not be easy or simple. It will require making hard choices about how we want to expend public resources, and how we want to pay for the public services we expect to receive. It will require compromise and discipline. "e path will be hard, but not impossible.
Projected debt as a percent of GDP, assuming targets are met
Source: Author’s calculations.
Projected debt as a percent of GDP, assuming targets are met
60%
62.%
64%
66%
68%
70%
72%
70%
Source: Author's calculations
20102011
20122013
20142015
20162017
20182019
2020

Conclusion | www.americanprogress.org 17
Endnotes
1 Our estimates of the overall deficits produced by hitting the targets proposed in this paper are based on the June 2009 Congressional Budget O!ce projection of the president’s 2010 budget. Obviously, any analysis of our fiscal future is dependent, in part, on the specific projections one chooses to employ. While CBO’s baseline projections are often used, they are problematic given the magnitude of expected changes from current law. For example, the CBO baseline assumes that all of the tax cuts passed under the Bush administration will expire. It also assumes that revenue from the Alternative Minimum Tax will grow at a very fast rate and that Medicare payments to doctors will be cut. It makes these assumptions because that is what is scheduled to happen under current law, even though Congress and the president have clearly signaled their intentions to do otherwise. One could, instead, employ a current policy baseline, but there are problems inherent in that choice as well. A current policy baseline would assume that none of the Bush tax cuts expire, and that is similarly unlikely. As a representation of likely overall spending and taxing trends, if not the details, President Obama’s budget blueprint serves well. As the analyses in this paper are largely una"ected by the details of what’s in the budget, which we know will be di"erent than what the president proposed, we choose this as the basis for our analysis.
2 Congressional Budget O!ce, “An Analysis of the President’s Budgetary Proposals for Fiscal Year 2010” (June 2009).
3 See, for example, Senator Charles Grassley, “Time to Reverse Spending Spree,” Iowa Politics.com, available at http://www.iowapolitics.com/index.iml?Article=178814.
4 See, for example, Robert E. Rubin, Peter R. Orszag, and Allen Sinai, “Sustained Budget Deficits: Longer-Run U.S. Economic Performance and the Risk of Financial and Fiscal Disarray” (Washington: Brookings Institute, 2004); William G. Gale and Peter R. Orszag, “The Economic E"ects of Long-Term Fiscal Discipline” (Washington: Tax Policy Center, 2002).
5 According to the Congressional Budget O!ce’s projections of the president’s budget, net interest payments on the debt will be almost $800 billion in 2019, while total nondefense discretionary spending will be less than $750 billion.
6 Michael Ettlinger and Michael Linden, “Deal with It: A Guide to the Federal Deficit and Debt” (Washington: Center for American Progress, 2009), available at http://www.americanprogress.org/issues/2009/09/deal_with_it.html.
7 Funds borrowed from the various government trust funds, especially the Social Security Trust Fund, do not count as revenues. Similarly, the costs associated with paying back those borrowed funds are not counted as outlays. This is typi-cal of federal budgeting, consistent with how the Congressional Budget O!ce scores these transfers of funds. Tax revenues that feed the trust fund, like payroll taxes, do count as overall revenues and spending on government programs that are associated with trust funds, like Social Security, does count toward overall outlays. In other words, the measure proposed here does not exempt any por-tion of the unified budget.
8 These projections of publicly held debt include estimates of the savings incurred from the reduced debt service payments that would be associated with meeting our proposed targets.


The Center for American Progress is a nonpartisan research and educational institute
dedicated to promoting a strong, just and free America that ensures opportunity
for all. We believe that Americans are bound together by a common commitment to
these values and we aspire to ensure that our national policies reflect these values.
We work to find progressive and pragmatic solutions to significant domestic and
international problems and develop policy proposals that foster a government that
is “of the people, by the people, and for the people.”