a-pdf merger demo : purchase from to …dwr.org.in/aicrp-wm document/2015-annual...
TRANSCRIPT

28 vaa vaaiYa-k
p`itvaodna
28th
Annual Report
2015-16
All Indian Coordinated Research Project on Weed Management
A-PDF Merger DEMO : Purchase from www.A-PDF.com to remove the watermark

ICAR-Directorate of Weed Research
Dr. Balasaheb sawant Konkan Krushi Vidyapeeth
Dapoli, Maharashtra 415 712
CONTENTS
Sr. No. Description Page No.
Introduction of the centre
1
General information Project objectives
Background information of the project
Location
II Weather conditions during the year and deviation from the normal 1
III Staff position and expenditure statement 2
IV Executive Summary (English) 2 to 3
V Results of practical utility 2 to 3
VI Research Achievements 3
A) Network Trials
WS.1. Weed survey, surveillance and ecological parameters 3 to10
WS.2. Weed biology and physiology 11
WS.2.1 Weed biology in cropped & non cropped area. 11
WS.3. Weed management in crops and cropping systems. 12 to 47
WS.3.1.3 Herbicides combinations for control of complex weed flora in direct seeded
rice.
12 to 20
WS.3.6 Weed management in conservation agriculture systems 21 to 24
WS 3.7 Long term herbicide trial in different cropping system. 25 to 47
WS 4. Management of problematic weeds. 48
WS 4.3 Biological control of water hyacinth by Neochetina bruchi 48
WS.6 On farm research & impact assessment
49 to 52
WS.6.1 On farm research 49 to 50
WS 6.2
Front Line Demonstration (FLD) 51 to 52
VII TSP programme 53
VIII List of publications(research, abstract of seminar/symposia/conference,
technical/extension bulletin, popular articles, books/books chapter, radio/TV
talks etc.
53
IX List of trainings/awareness campaign 54
X Awards/recognitions/students guided 54
XI Linkages and collaboration 54
XII Action taken on Recommendations & suggestions made in ARM meeting held on 17th-18th October, 2015
55-59
XIII Meteorological data -2015 60 to 61


1
AICRP on weed control, DAPOLI center 1. GENERAL INFORMATION:
1. Project title : All India Co-ordinated Research Project on Weed Control, Dapoli Centre
2. Name of location : Department of Agronomy, College of Agriculture, Dapoli, Dist. Ratnagiri.
3. Name of University : Dr. B. S. Konkan Krishi Vidyapeeth, Dapoli, Dist. Ratnagiri.
4. Name of the Principal Investigator of the centre
: Dr. S.B. Gangawane
5. Report period : January to December, 2015
6. Technical personnel’s employed during the report period
: Five (Table 1)
7. Total sanctioned outlay for the year 2015–2016
: Rs. 21,60,270/- lakhs (Table 2)
i. PROJECT OBJECTIVES: 1. Survey of weed flora in different agro-ecological zones of Konkan region 2. Studies on critical crop weed competition period. 3. Evaluation of different weed control measures and development of integrated weed
management practices for different crops and cropping systems. 4. Studies on weed biology and weed ecology. 5. On Farm Trials (OFT’s) in the farmers field to assess and refine developed technology. 6. To evolve integrated approaches for weed management including cultural method of weed
control under irrigated condition. 7. Training for extension personnels and farmers. 8. Studies on the management of perennial and problem weeds in cropped and non-cropped
area. BACKGROUND OF THE PROJECT AND LOCATION:
The Directorate of Weed Science Research Centre on Weed Control sponsored by the Indian Council of Agricultural Research was started at Dr. B. S. Konkan Krishi Vidyapeeth, Dapoli in its Department of Agronomy with effect from May, 1996. The main objective of this programme was to develop integrated weed management practices for optimum weed control for different crops and cropping systems with minimum hazards to the crops and environment.
The scheme scientists are of the discipline of Agronomy. The technical programme and research achievements are discussed in the annual workshop and the technical programmes are finalized for implementation aiming towards achieving the broad objectives of the project. The annual technical programme is approved by the Director, Directorate of Weed Science Research, Jabalpur.
The technologies developed are discussed in the state level scientific workers conference and are included in the crop production guide published by the Department of Agriculture, Govt. of Maharashtra for the benefits of extension personnels and farmers of the region. iii. LOCATION:
DWSR centre is located at Dapoli in the agroclimatic zone viz. ‘Very High Rainfall with Lateritic Soils’ in Maharashtra State. The experimental farm is located at 170 19' to 170 40' N latitudes, 730 16' to 730 19' E longitudes and 167 to 234 m above mean sea level (MSL). The topography of the region is uneven and can be described as rolling with mound and hillocks and gently slopping valleys in the middle having flat rice fields and the hills with slopes ranging from 1 to more than 30 per cent. II. Weather conditions during the year and deviation from the normal The weekly weather data for the 2015 is attached on last page of the report. The deviation from the normal is given below.
Dapoli location Maximum temp Minimum temp Rainfall
Normal 30.84 oC 19.81 oC 3649.92 mm
Average 31.70 20.20 2330.7 mm
Increase/decrease (+) 0.86 oC (+) 0.39 oC (-) 36.14 %

2
III. Staff position and Expenditure statement. Table 1: Technical personnel employed in 2015.
Sr. No.
Name Designation Date of Joining in
the project Scale of pay
Present basic pay
Remark
1. Dr.S.B.Gangawane Agronomist & PI
March-2015
37400-67000
46,400/-
-
2. Dr.S.S.Pinjari Junior
Agronomist
12/05/2015 Onwards
15600-39100
21,600/- -
3. Shri. A. P. Govale Technical Assistant
12/03/2014 onwards
5200-20200 11,510/- -
4. Mrs. S.K. Khanolkar Jr. steno typist 7/07/2010 onwards
5200-20200 11,510/- -
5. Mrs. A.N. Desai Messanger 8/07/2010 onwards
4470-7440 9,840/- -
Table 2 : Total sanctioned outlay for 2015-2016(Rs. in lakhs)
Head of Account
Sanctioned grants Total Expenditure upto
31.12.2015
Balance
ICAR share State share
1. Pay and Allowance 11,11,000/- 3,70,000/- 14,81,000/- 20,05,587/- -5,24,587/-
2. Traveling Allowance 44,000/- 15,000/- 59,000/- 5,374/- 53,626/-
3. Recurring contingencies
3,00,000/- 1,00,000/- 4,00,000/- 1,54,166/- 2,45,834/-
4. Tribal Sub Plan 2,20,270/- - 2,20,270/- 1,51,400/- 68,870/-
Total 16,75,270 4,85,000/- 21,60,270/- 23,16,527/- -1,56,257/-
(III). Executive Summary (V). Results of practical utility WS 3.1.3 : Herbicides combinations for control of complex weed flora in direct seeded rice. Pooled results revealed that, among various herbicide tried the total weed growth of monocots and BLWs was conspicuously suppressed by the application of Pendimethalin fb manual weeding exhibiting the highest weed control efficiency (83.95 and 92.84%) at 60 and 90 DAS respectively, next to that pendimethalin fb Bispyribac Na fb manual weeding (75.28 and 89.87).
All weed control measures under study recorded significant increase in grain & straw yield over weedy check. The weed free check recorded significantly highest grain & straw yield of 38.81 and 46.78 q/ha. respectively over all other treatments followed by Pendimethalin fb manual weeding and Pendimethalin fb Bispyribac-Na fb manual weeding for yield. The highest Benefit Cost Ratio was obtained from the application of Pendimethalin fb manual weeding (1.28). W S 3.6 Weed management in conservation agriculture systems
Amongst various weed control measures the application of oxadiargyl + 1 H.W. at 40 DAS was best treatment exhibiting highest WCE% in terms of growth of weeds and consequently grain and straw yield of rice. The weed growth of monocots at all stages of observation significantly least due CT (Transplanted rice) over all other tillage practices. However, weed growth of BLWs at harvest significantly list in CT-transplanted rice as compared to ZT- Direct seeded and it was remained at par with all other tillage practices and resulting into increase in yield attributes and yield of rice WS. 3.7:- Long term herbicide trial in different cropping systems. Kharif Rice: -
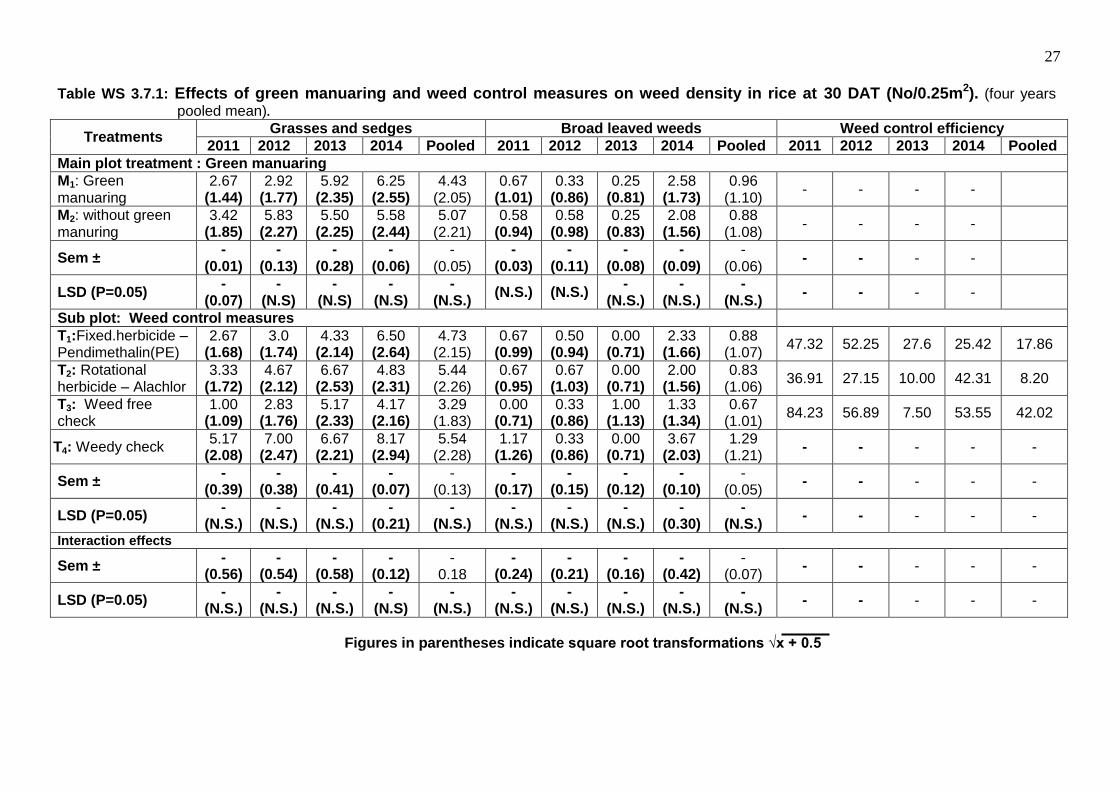
Pooled result revealed that green manuring did not influenced the weed density and weed growth at 30, 50 DAT and at harvest during all the years of experimentation. Similarly it was not influenced the yield attributes except plant height. However green manuring recorded significantly higher grain and straw yield of rice. Weed density of monocots was reduced significantly due to the application of fixed and rotational herbicides at 50 DAT and at harvest. The weed growth of monocots

3
and BLWs was also significantly influenced due to various weed control measures. The grain yield of rice was significantly highest in weed free check (39.15 q ha-1) followed by rotational herbicide (35.42). Rabi groundnut:-
Pooled results revealed that green manuaring to kharif rice did not influenced the weed density and growth of monocots and BLWs in rabi groundnut. While the various weed control measures significantly influenced the weed density & weed growth at 30 and 50 DAS. The fixed and rotational herbicides reduced weed density and weed growth resulted in increased dry pod yield of groundnut (33.18 & 30.97 qha-1 respectively) over weedy check (26.76 qha-1 ) Conclusion:- From four years study it can be concluded that, incorporation of Green manures and application of fixed herbicide pretilachlor for kharif rice and pendimethalin for rabi groundnut reduced weed growth with increase in total REY (186.76 q/ha) of the rice groundnut cropping system under Konkan region of Maharashtra. Microbial study :-
In case of Kharif rice and rabi groundnut, the total bacterial population, free living nitrogen fixers, phosphate solubilizers ,microbial biomass carbon and basal soil respiration in soil were significantly influenced by weed control measures at 30DAS. They were found significantly less in fixed herbicide, rotational herbicide as compared to the weed free treatment. The bacterial population, free living nitrogen fixers and phosphate solubilizers were at par with weedy check treatment at 30DAS.The fungal population was found to be non-significant at all the stages of the crop. Whereas the other microbial parameters were found to be non-significant at 50DAS and at harvesting stages of the crop. Conclusion
The green manuaring treatment stimulate significantly higher microbial population due to more availability of nutrient as compared to the without green manuaring treatment in both the crops. The microbial population were not badly affected by herbicides during all the stages of the groundnut crop during rabi season. The all microbial population and the associated parameters initially suppressed due to toxic effect of herbicides at initial stage (30DAT) in rice crop during Kharif season.
(VI). RESEARCH ACHEIVEMENT: Network Programme W. S. 1 Weed Survey, surveillance and ecological parameters.
Weed survey of Sindhudurg district (Kankavli, Malvan, Kudal, Vengurle, Sawantwadi and
Dodamarg Tahasils) Kharif 2015 Survey Route:- Wargaon N. – 16030’28.3” E. – 073039’05.9” MSL-120m.
Saliste N. – 16029’25.2” E. – 073038’54.1” MSL-136m.
Pise kamte N. – 16015’11.5” E. – 073039’11.2” MSL-44m.
Nerulpal N. – 1600.8’0.99” E. – 073037’16.0” MSL-31m.
Wagade N. – 16014’30.0” E. – 073042’24.4” MSL-30m.
Pawashi N. – 16002’14.7” E. – 073042’5.9” MSL-21m.
Mulde N. – 16001’10.0” E. – 073041’44.6” MSL-23m.
Majagaon N. – 15053’14.3” E. – 073049’38.2” MSL-97m.
Insuli N. – 15051’92.4” E. – 073050’17.9” MSL-31m.
Tulas N. – 15051’22.7” E. – 073040’28.5” MSL-63m.
RFRC-Vengurle N. – 15051’38.4” E. – 073039’06.3” MSL-11m.
Math N. – 15053’30.6” E. – 073039’56.1” MSL-21m.
Vetore N. – 15056’44.5” E. – 073040’53.6” MSL-55m.
Chauke N. – 1600.8’34.2” E. – 073031’11.3” MSL-98m.
Kasartake N. – 16002’29.2” E. – 073034’37.3” MSL-74m.
Poip N. – 16011’0.4” E. – 073035’47.0” MSL-22m.
Gotane N. – 16015’0.4” E. – 073037’54.4” MSL-34m.
Gotane kondwadi N. – 16015’0.4” E. – 073036’54.4” MSL-30m.
4
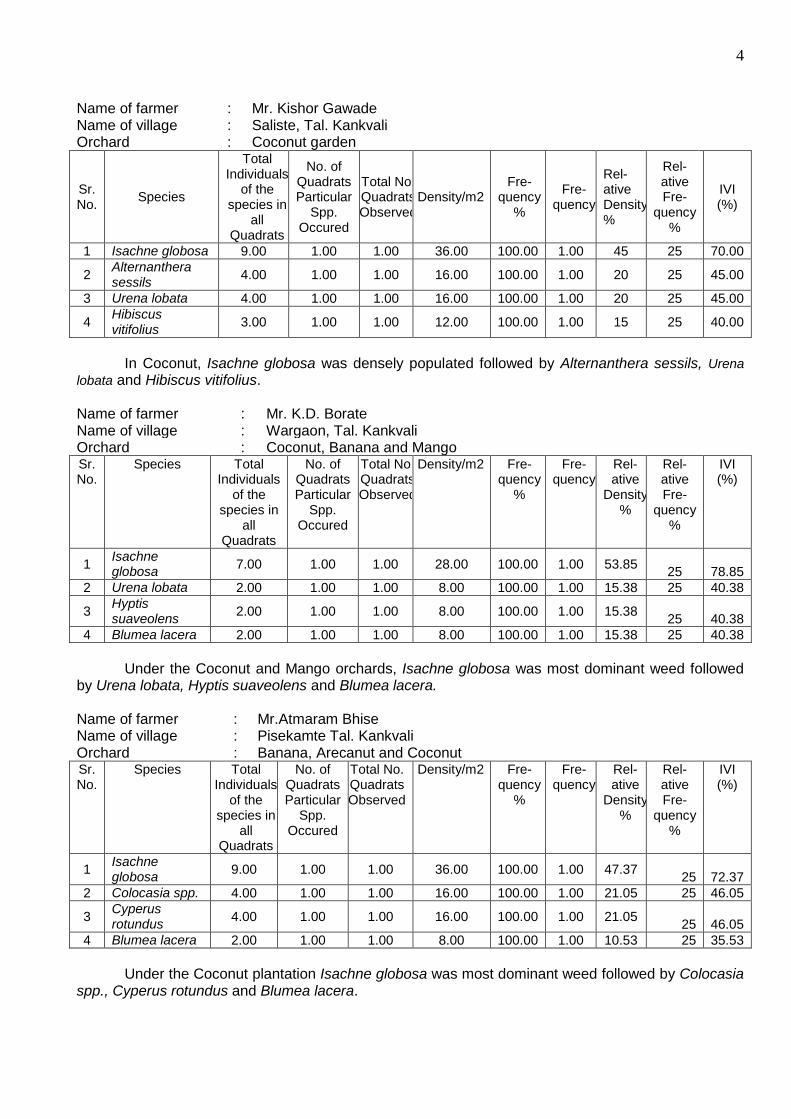
Name of farmer : Mr. Kishor Gawade Name of village : Saliste, Tal. Kankvali Orchard : Coconut garden
Sr. No.
Species
Total Individuals
of the species in
all Quadrats
No. of Quadrats Particular
Spp. Occured
Total No. Quadrats Observed
Density/m2 Fre-
quency %
Fre-quency
Rel-ative Density %
Rel-ative Fre-
quency %
IVI (%)
1 Isachne globosa 9.00 1.00 1.00 36.00 100.00 1.00 45 25 70.00
2 Alternanthera sessils
4.00 1.00 1.00 16.00 100.00 1.00 20 25 45.00
3 Urena lobata 4.00 1.00 1.00 16.00 100.00 1.00 20 25 45.00
4 Hibiscus vitifolius
3.00 1.00 1.00 12.00 100.00 1.00 15 25 40.00
In Coconut, Isachne globosa was densely populated followed by Alternanthera sessils, Urena
lobata and Hibiscus vitifolius. Name of farmer : Mr. K.D. Borate Name of village : Wargaon, Tal. Kankvali Orchard : Coconut, Banana and Mango Sr. No.
Species Total Individuals
of the species in
all Quadrats
No. of Quadrats Particular
Spp. Occured
Total No. Quadrats Observed
Density/m2 Fre-quency
%
Fre-quency
Rel-ative
Density %
Rel-ative Fre-
quency %
IVI (%)
1 Isachne globosa
7.00 1.00 1.00 28.00 100.00 1.00 53.85 25 78.85
2 Urena lobata 2.00 1.00 1.00 8.00 100.00 1.00 15.38 25 40.38
3 Hyptis suaveolens
2.00 1.00 1.00 8.00 100.00 1.00 15.38 25 40.38
4 Blumea lacera 2.00 1.00 1.00 8.00 100.00 1.00 15.38 25 40.38
Under the Coconut and Mango orchards, Isachne globosa was most dominant weed followed
by Urena lobata, Hyptis suaveolens and Blumea lacera.
Name of farmer : Mr.Atmaram Bhise Name of village : Pisekamte Tal. Kankvali Orchard : Banana, Arecanut and Coconut Sr. No.
Species Total Individuals
of the species in
all Quadrats
No. of Quadrats Particular
Spp. Occured
Total No. Quadrats Observed
Density/m2 Fre-quency
%
Fre-quency
Rel-ative
Density %
Rel-ative Fre-
quency %
IVI (%)
1 Isachne globosa
9.00 1.00 1.00 36.00 100.00 1.00 47.37 25 72.37
2 Colocasia spp. 4.00 1.00 1.00 16.00 100.00 1.00 21.05 25 46.05
3 Cyperus rotundus
4.00 1.00 1.00 16.00 100.00 1.00 21.05 25 46.05
4 Blumea lacera 2.00 1.00 1.00 8.00 100.00 1.00 10.53 25 35.53
Under the Coconut plantation Isachne globosa was most dominant weed followed by Colocasia
spp., Cyperus rotundus and Blumea lacera.

5
Name of farmer : Mrs. Sushma Shivram Lad Name of village : Gothane Kondvadi Tal. Malvan Vegetables : Amranthus, Carrot etc. Sr. No.
Species Total Individuals
of the species in
all Quadrats
No. of Quadrats Particular
Spp. Occurred
Total No. Quadrats Observed
Density/m2 Fre-quency
%
Fre-quency
Rel-ative
Density %
Rel-ative Fre-
quency %
IVI (%)
1 Isachne globosa
5.00 1.00 1.00 20.00 100.00 1.00 71.43 25 63.46
2 Cyperus rotundus
2.00 1.00 1.00 8.00 100.00 1.00 28.57 25 40.38
Under the vegetables Isachne globosa was most dominant weed followed by Cyperus rotundus
Name of farmer : Mrs. Sitabai Ramchandr Bagwe Name of village : Gothane Tal. Malvan Vegetables : Groundnut Sr. No.
Species Total Individuals of the species
in all Quadrats
No. of Quadrats Particular
Spp. Occured
Total No.
Quadrats
Observed
Density/m2
Fre-quency
%
Fre-quenc
y
Rel-ative
Density %
Rel-ative Fre-
quency %
IVI (%)
1 Cyperus rotundus 9.00 1.00 1.00 36.00 100.0 1.00 45 25 70.00
2 Isachne globosa 4.00 1.00 1.00 16.00 100.0 1.00 20 25 45.00
3 Euphorbia hirta 4.00 1.00 1.00 16.00 100.0 1.00 20 25 45.00
4 Mimosa pudica 3.00 1.00 1.00 12.00 100.0 1.00 15 25 40.00
In groundnut crop, Cyperus rotundus was densely populated weed followed by Isachne
globosa, Euphorbia hirta and Mimosa pudica
Name of farmer : Mr. Uday Daji Madhav Name of village : Poip Tal. Malvan Vegetables/ Orchard : Gauva, Coconut Sr. No.
Species Total Individuals
of the species in
all Quadrats
No. of Quadrats Particular
Spp. Occured
Total No.
Quadrats
Observed
Density/m2
Fre-quency
%
Fre-quen
cy
Rel-ative
Density %
Rel-ative Fre-
quency %
IVI (%)
1 Hyptis survealens
7.00 1.00 1.00 28.00 100.0 1.00 25.93 16.67 42.59
2 Isachne globosa 6.00 1.00 1.00 24.00 100.0 1.00 22.22 16.67 38.89
3 Alicarpus rugosus
5.00 1.00 1.00 20.00 100.0 1.00 18.52 16.67 35.19
4 Colocasia antiquarum
4.00 1.00 1.00 16.00 100.0 1.00 14.81 16.67 31.48
5 Urena lobata 3.00 1.00 1.00 12.00 100.0 1.00 11.11 16.67 27.78
6 Mimosa pudica 2.00 1.00 1.00 8.00 100.0 1.00 7.41 16.67 24.07
In Gauva and Coconut, Hyptis survealens was most dominant weed followed by Isachne
globosa, Colocasia antiquarum, Urena lobata and Mimosa pudica
6
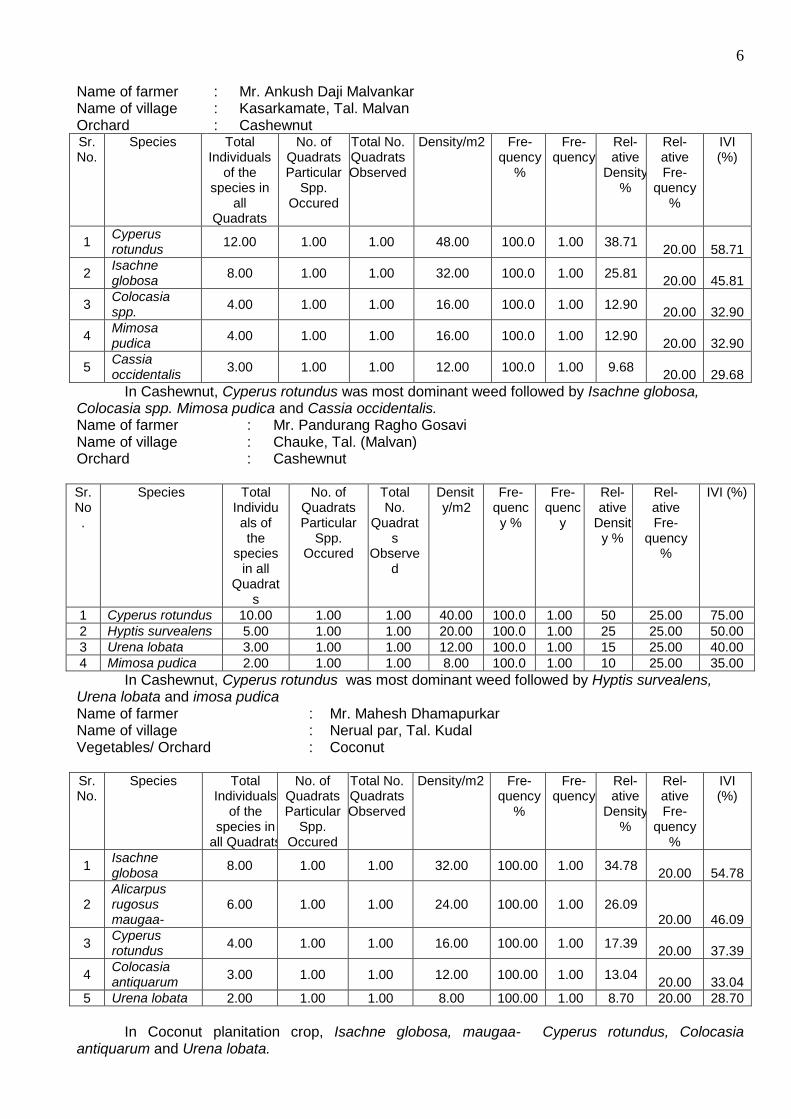
Name of farmer : Mr. Ankush Daji Malvankar Name of village : Kasarkamate, Tal. Malvan Orchard : Cashewnut Sr. No.
Species Total Individuals
of the species in
all Quadrats
No. of Quadrats Particular
Spp. Occured
Total No. Quadrats Observed
Density/m2 Fre-quency
%
Fre-quency
Rel-ative
Density %
Rel-ative Fre-
quency %
IVI (%)
1 Cyperus rotundus
12.00 1.00 1.00 48.00 100.0 1.00 38.71 20.00 58.71
2 Isachne globosa
8.00 1.00 1.00 32.00 100.0 1.00 25.81 20.00 45.81
3 Colocasia spp.
4.00 1.00 1.00 16.00 100.0 1.00 12.90 20.00 32.90
4 Mimosa pudica
4.00 1.00 1.00 16.00 100.0 1.00 12.90 20.00 32.90
5 Cassia occidentalis
3.00 1.00 1.00 12.00 100.0 1.00 9.68 20.00 29.68
In Cashewnut, Cyperus rotundus was most dominant weed followed by Isachne globosa, Colocasia spp. Mimosa pudica and Cassia occidentalis. Name of farmer : Mr. Pandurang Ragho Gosavi Name of village : Chauke, Tal. (Malvan) Orchard : Cashewnut Sr. No.
Species Total Individuals of the
species in all
Quadrats
No. of Quadrats Particular
Spp. Occured
Total No.
Quadrats
Observed
Density/m2
Fre-quency %
Fre-quenc
y
Rel-ative
Density %
Rel-ative Fre-
quency %
IVI (%)
1 Cyperus rotundus 10.00 1.00 1.00 40.00 100.0 1.00 50 25.00 75.00
2 Hyptis survealens 5.00 1.00 1.00 20.00 100.0 1.00 25 25.00 50.00
3 Urena lobata 3.00 1.00 1.00 12.00 100.0 1.00 15 25.00 40.00
4 Mimosa pudica 2.00 1.00 1.00 8.00 100.0 1.00 10 25.00 35.00
In Cashewnut, Cyperus rotundus was most dominant weed followed by Hyptis survealens, Urena lobata and imosa pudica Name of farmer : Mr. Mahesh Dhamapurkar Name of village : Nerual par, Tal. Kudal Vegetables/ Orchard : Coconut Sr. No.
Species Total Individuals
of the species in
all Quadrats
No. of Quadrats Particular
Spp. Occured
Total No. Quadrats Observed
Density/m2 Fre-quency
%
Fre-quency
Rel-ative
Density %
Rel-ative Fre-
quency %
IVI (%)
1 Isachne globosa
8.00 1.00 1.00 32.00 100.00 1.00 34.78 20.00 54.78
2 Alicarpus rugosus maugaa-
6.00 1.00 1.00 24.00 100.00 1.00 26.09 20.00 46.09
3 Cyperus rotundus
4.00 1.00 1.00 16.00 100.00 1.00 17.39 20.00 37.39
4 Colocasia antiquarum
3.00 1.00 1.00 12.00 100.00 1.00 13.04 20.00 33.04
5 Urena lobata 2.00 1.00 1.00 8.00 100.00 1.00 8.70 20.00 28.70
In Coconut planitation crop, Isachne globosa, maugaa- Cyperus rotundus, Colocasia
antiquarum and Urena lobata.

7
Name of farmer : Mr. M.K. Gawade Name of village : Vetore, Tal. Kudal Orchard : Cashewnut and Mango Sr. No.
Species Total Individuals
of the species in
all Quadrats
No. of Quadrats Particular
Spp. Occured
Total No. Quadrats Observed
Density/m2 Fre-quency
%
Fre-quency
Rel-ative
Density %
Rel-ative Fre-
quency %
IVI (%)
1 Isachne globosa
8.00 1.00 1.00 28.00 100.00 1.00 57.14 33.33 90.48
2 Lantana camera
4.00 1.00 1.00 24.00 100.00 1.00 28.57 33.33 61.90
3 Colocasia antiquarum
2.00 1.00 1.00 16.00 100.00 1.00 14.29 33.33 47.62
In orchard crops, Isachne globosa was most dominant weed followed by Lantana camera and
Colocasia ntiquarum.
Name of farmer : Mr. Madhav Yashvant Marathe Name of village : Math Tal. Vengurle Orchard : Mango, Coconut and Areconut
Sr. No.
Species Total Individuals
of the species in
all Quadrats
No. of Quadrats Particular
Spp. Occured
Total No. Quadrats Observed
Density/m2
Fre-quency %
Fre-quenc
y
Rel-ative
Density %
Rel-ative Fre-
quency %
IVI (%)
1 Alicarpus rugosus maugaa-
7.00 1.00 1.00 28.00 100.0 1.00 41.18 25.00 66.18
2 Colocasia antiquarum
4.00 1.00 1.00 16.00 100.0 1.00 23.53 25.00 48.53
3 Urena lobata 4.00 1.00 1.00 16.00 100.0 1.00 23.53 25.00 48.53
4 Mimosa pudica 2.00 1.00 1.00 8.00 100.0 1.00 11.76 25.00 36.76
In orchard crops of Vengurle tahasil, maugaa- was most dominant weed followed by Colocasia
antiquarum, Urena lobata and Mimosa pudica. Name of farmer : Region Fruit Research Station Name of village : Vengurla Orchard : Mango, Areconut and Coconut,
Sr. No.
Species Total Individuals
of the species in
all Quadrats
No. of Quadrats Particular
Spp. Occured
Total No.
Quadrats
Observed
Density/m2
Fre-quency %
Fre-quenc
y
Rel-ative
Density %
Rel-ative Fre-
quency %
IVI (%)
1 Isachne globosa 14.00 1.00 1.00 56.00 100.0
0 1.00 58.33
25.00 83.33
2 Alternanthera sessils
4.00 1.00 1.00 16.00 100.0
0 1.00 16.67
25.00 41.67
3 Colocasia antiquarum
3.00 1.00 1.00 12.00 100.0 1.00 12.50 25.00 37.50
4 Mimosa pudica 3.00 1.00 1.00 12.00 100.0
0 1.00 12.50
25.00 37.50
In orchard crops, Isachne globosa was most dominant weed followed by Alternanthera sessils,
Colocasia antiquarum and Mimosa pudica.

8
Name of farmer : Mr. Yogesh Pendnekar Name of village : Tulas Tal. Sawantwadi Orchard : Mango and Cashewnut
Sr. No.
Species Total Individuals
of the species in
all Quadrats
No. of Quadrats Particular
Spp. Occurred
Total No. Quadrats Observed
Density/m2 Fre-quency
%
Fre-quency
Rel-ative
Density %
Rel-ative Fre-
quency %
IVI (%)
1 Isachne globosa
10.00 1.00 1.00 40.00 100.00 1.00 41.67 16.67 58.33
2 Mimosa pudica
4.00 1.00 1.00 16.00 100.00 1.00 16.67 16.67 33.33
3 Hyptis surveoslens
3.00 1.00 1.00 12.00 100.0 1.00 12.50 16.67 29.17
4 Cassia tora 3.00 1.00 1.00 12.00 100.00 1.00 12.50 16.67 29.17
5 Colocasia antiquarum
2.00 1.00 1.00 8.00 100.00 1.00 8.33 16.67 25.00
6 Urena lobata
2.00 1.00 1.00 8.00 100.00 1.00 8.33 16.67 25.00
In orchard crops, Isachne globosa was most dominant weed followed by Mimosa pudica, Hyptis surveoslens, Cassia tora, Colocasia antiquarum and Urena lobata. Name of farmer : Mr. Anant Sanbhaji Sawant Name of village : Majagaon Tal. Sawantwadi Orchard : Mango and Cashewnut
Sr. No.
Species
Total Individuals
of the species in
all Quadrats
No. of Quadrats Particular
Spp. Occured
Total No. Quadrats Observed
Density/m2 Fre-
quency %
Fre-quency
Rel-ative
Density %
Rel-ative Fre-
quency %
IVI (%)
1 Cyperus rotundus
6.00 1.00 1.00 24.00 100.00 1.00 33.33 20.00 53.33
2 Mimosa pudia 5.00 1.00 1.00 20.00 100.00 1.00 27.78 20.00 47.78
3 Lantana camera
3.00 1.00 1.00 12.00 100.00 1.00 16.67 20.00 36.67
4 Urena lobata 2.00 1.00 1.00 8.00 100.00 1.00 11.11 20.00 31.11
5 Cassia tora 2.00 1.00 1.00 8.00 100.00 1.00 11.11 20.00 31.11
In orchard crops Cyperus rotundus was most dominant weed followed by Mimosa pudica, Lantana camera, Urena lobata and Cassia tora. Name of farmer : Mr. Ganpat Patu Palav Name of village : Insuli Tal. Dodamarg Orchard : Coconut and Banana Sr. No.
Species Total Individuals
of the species in
all Quadrats
No. of Quadrats Particular
Spp. Occured
Total No. Quadrats Observed
Density/m2 Fre-quency
%
Fre-quency
Rel-ative
Density %
Rel-ative Fre-
quency %
IVI (%)
1 Isachne globosa
11.00 1.00 1.00 24.00 100.00 1.00 47.83 20.00 67.83
2 Mimosa pudica
4.00 1.00 1.00 20.00 100.00 1.00 17.39 20.00 37.39
3 Colocassia spp.
3.00 1.00 1.00 12.00 100.00 1.00 13.04 20.00 33.04
4 Cyperus rotundus
3.00 1.00 1.00 8.00 100.00 1.00 13.04 20.00 33.04
5 Urena lobata 2.00 1.00 1.00 8.00 100.00 1.00 8.70 20.00 28.70
Under the Coconut and Banana mixed cropping systems, Isachne globosa was most dominant weed followed by Mimosa pudica, Colocassia spp., Cyperus rotundus, Urena lobata.

9
Name of farmer : Mr. Gajanan Shrirshat Name of village : Mulde Tal. Kudal Orchard/Vegetable : Okra, ridge gourd and Amaranthus Sr. No.
Species Total Individuals
of the species in
all Quadrats
No. of Quadrats Particular
Spp. Occured
Total No. Quadrats Observed
Density/m2 Fre-quency
%
Fre-quency
Rel-ative
Density %
Rel-ative Fre-
quency %
IVI (%)
1 Isachne globosa
10.00 1.00 1.00 40.00 100.0 1.00 47.62 20.00 67.62
2 Mimosa pudica 4.00 1.00 1.00 16.00 100.0 1.00 19.05 20.00 39.05
3 Euphorbia hirta 3.00 1.00 1.00 12.00 100.0 1.00 14.29 20.00 34.29
4 Cyperus rotundus
2.00 1.00 1.00 8.00 100.0 1.00 9.52 20.00 29.52
5 Urena lobata 2.00 1.00 1.00 8.00 100.0 1.00 9.52 20.00 29.52
In vegetables , Isachne globosa was most dominant weed followed by Mimosa pudica, Euphorbia hirta, Cyperus rotundus and Urena lobata. Name of farmer : Mr. Prakash Tukaram Borate Name of village : Pawasi Tal. Kudal Orchard/Vegetable : Mango Sr. No.
Species Total Individuals of the species in all Quadrats
No. of Quadrat
s Particula
r Spp. Occured
Total No. Quadrats Observed
Density/m2
Fre-quency
%
Fre-quenc
y
Rel-ative
Density %
Rel-ative Fre-quency %
IVI (%)
1 Isachne globosa 7.00 1.00 1.00 28.00 100.00 1.00 35 25.0
0 60.00
2 Hyptis surveoslens
6.00 1.00 1.00 24.00 100.00 1.00 30 25.0
0 55.00
3 Urena lobata 4.00 1.00 1.00 16.00 100.00 1.00 20 25.0
0 45.00
4 Mimosa pudica 3.00 1.00 1.00 12.00 100.00 1.00 15 25.0
0 40.00
In Mango, Isachne globosa was most dominant weed followed by Hyptis surveoslens, Urena
lobata and Mimosa pudica. Name of farmer : Mr. Prashad Ramchandra Kambal Name of village : Wagda Tal. Kankavli Vegetable : Mango Sr. No.
Species Total Individuals
of the species in
all Quadrats
No. of Quadrats Particular
Spp. Occured
Total No. Quadrats Observed
Density/m2 Fre-quency
%
Fre-quency
Rel-ative
Density %
Rel-ative Fre-
quency %
IVI (%)
1 maugaa- 7.00 1.00 1.00 28.00 100.0 1.00 25.93 16.67 42.59
2 Isachne globosa
6.00 1.00 1.00 24.00 100.0 1.00 22.22 16.67 38.89
3 Hyptis surveoslens
5.00 1.00 1.00 20.00 100.0 1.00 18.52 16.67 35.19
4 Cassia occidentalis
4.00 1.00 1.00 16.00 100.0 1.00 14.81 16.67 31.48
5 Cyperus rotundus
3.00 1.00 1.00 12.00 100.00 1.00 11.11 16.67 27.78
6 Urena lobata 2.00 1.00 1.00 8.00 100.00 1.00 7.41 16.67 24.07
In Mango, Isachne globosa was most dominant weed followed by Hyptis surveoslens, Cassia
occidentalis, Cyperus rotundus and Urena lobata.

10
Shift in weed flora Sindhudurga Crop: Coconut
2009
Sr. No.
Species IVI (%)
1 Hyptis surveoslens 73.77
2 Eragrotis major 38.75
3 Mimosa pudica 53.11
2015
Sr. No.
Species IVI (%)
1 Isachne globosa, Qaur 70.0
2 Urena lobata icakna KDa
45.00
3 Cyperus rotundus lavaaLa
46.05
4 Alicarpus rugosus maugaa-
46.09
Crop : Mango 2009
Sr. No.
Species IVI (%)
1 Chromolaena odorata 95.86
2 Digitaria ciliaris 51.45
3 Mimosa pudica, laajaaLu 56.04
2015
Sr. No.
Species IVI (%)
1 Isachne globosa, Qaur 83.33
2 Urena lobata icakna KDa 45.00
3 Hyptis surveoslens ranaTI tuLsa
55.00
4 Mimosa pudica laajaaLu 47.78
Crop: Cashunut 2009
Sr. No.
Species IVI (%)
1 Chromolaena odorata 206.37
2 Ageratum conyzoides 67.72
3 Urena lobata icakna KDa
67.05
2015
Sr. No.
Species IVI (%)
1 Isachne globosa, Qaur 58.33
2 Cyperus rotundus lavaaLa 75.00
3 Hyptis surveoslens ranaTI tuLsa
50.00
Mimosa pudica laajaaLu 47.78
Crop: Arecanut 2009
Sr. No.
Species IVI (%)
1 Themeda quadrivolvis 56.34
2 Ageratum conyzoides 52.42
3 Bluea lacera 41.10
2015
Sr. No.
Species IVI (%)
1 Alicarpus rugosus maugaa- 66.18
2 Urena lobata icakna KDa 75.00
3 Colocasia antiquorum ranaTI ALu
48.53
4 Mimosa pudica laajaaLu 36.76
Summary- Weed survey was conducted in different tahsils including Kankavali, Kudal, Dodamarg, Sawantwadi, Malvan and Wengurla in Sindhudurga district during Kharif season 2015. Under study in different villages of different tahasils of Sindhudurga district Isachne globosa, Urena lobata, Cyperus rotundus, Alicarpus rugosus, Hyptis surveoslens, Colocasia antiquorum and Mimosa pudica were most dominant weed species observed in kharif season of 2015 in different fruit and vegetable crops, where as Hyptis suaveolens, Eragrotis major, Mimosa pudica, Chromolaena odorata, Digitaria ciliaris, Ageratum conyzoides, Urena lobata Themeda quadrivolvis and Bluea lacera were most dominant during kharif season 2009.
11
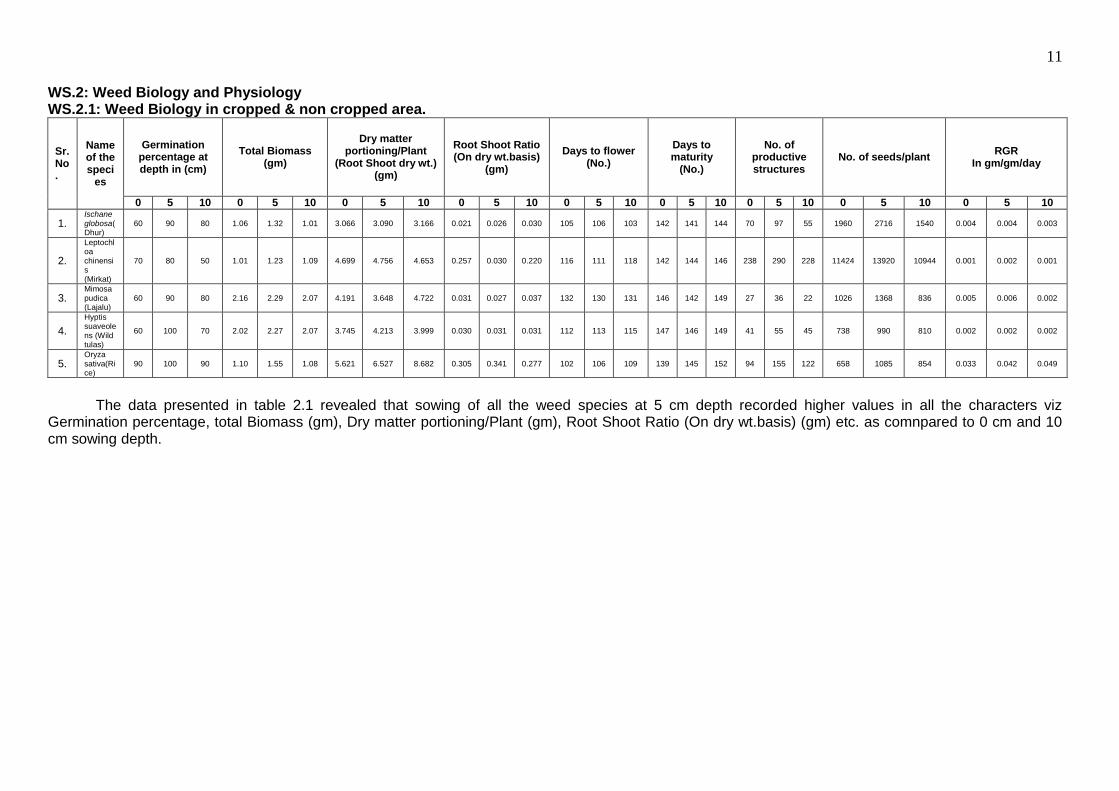
WS.2: Weed Biology and Physiology WS.2.1: Weed Biology in cropped & non cropped area.
Sr. No.
Name of the speci
es
Germination percentage at depth in (cm)
Total Biomass (gm)
Dry matter portioning/Plant
(Root Shoot dry wt.) (gm)
Root Shoot Ratio (On dry wt.basis)
(gm)
Days to flower (No.)
Days to maturity
(No.)
No. of productive structures
No. of seeds/plant RGR
In gm/gm/day
0 5 10 0 5 10 0 5 10 0 5 10 0 5 10 0 5 10 0 5 10 0 5 10 0 5 10
1. Ischaneglobosa(Dhur)
60 90 80 1.06 1.32 1.01 3.066 3.090 3.166 0.021 0.026 0.030 105 106 103 142 141 144 70 97 55 1960 2716 1540 0.004 0.004 0.003
2.
Leptochloa chinensis (Mirkat)
70 80 50 1.01 1.23 1.09 4.699 4.756 4.653 0.257 0.030 0.220 116 111 118 142 144 146 238 290 228 11424 13920 10944 0.001 0.002 0.001
3. Mimosa pudica (Lajalu)
60 90 80 2.16 2.29 2.07 4.191 3.648 4.722 0.031 0.027 0.037 132 130 131 146 142 149 27 36 22 1026 1368 836 0.005 0.006 0.002
4.
Hyptis suaveolens (Wild tulas)
60 100 70 2.02 2.27 2.07 3.745 4.213 3.999 0.030 0.031 0.031 112 113 115 147 146 149 41 55 45 738 990 810 0.002 0.002 0.002
5. Oryza sativa(Rice)
90 100 90 1.10 1.55 1.08 5.621 6.527 8.682 0.305 0.341 0.277 102 106 109 139 145 152 94 155 122 658 1085 854 0.033 0.042 0.049
The data presented in table 2.1 revealed that sowing of all the weed species at 5 cm depth recorded higher values in all the characters viz Germination percentage, total Biomass (gm), Dry matter portioning/Plant (gm), Root Shoot Ratio (On dry wt.basis) (gm) etc. as comnpared to 0 cm and 10 cm sowing depth.

12
W.S 3.1.3 : Herbicides combinations for control of complex weed flora in direct seeded rice. Objectives
: 1) To study the bio-efficiency of combination of herbicides against weed complex and their effects on growth and yield of direct-seeded rice.
2) To study the phytotoxic effects on the crop, if any.
Year of commencement : Kharif, 2012
Location : Agronomy Farm, College of Agriculture, Dapoli.
Treatments details : Treatments Dose
(g/ha) Time of application (DAS)
T1 Bispyribac-Na 25 20 DAS (3-4 leaf stage) T2 Pendimethalin fb bispyribac-Na 1000 fb 25 0-2 fb 25 T3 Oxadiargyl fb bispyribac-Na 100/25 0-2 fb. 25 T4 Pyrazosulfuron fb bispyribac -Na 20/25 0-3 fb. 25 T5 Pendimethalin fb bispyribac-Na fb manual
weeding 1000 fb 25
0-2 fb. 20 DAS (3-4 leaf stage) fb 45d
T6 Pendimethalin fb manual weeding(Pendistar)
1000 0-2 fb. 25-30d
T7 Bispyribac -Na + (chlorimuron + metsulfuron)
20+4 20 DAS
T8 Three mechanical weedings (cono / rotary weeder)
_ 20,40,60 DAS
T9 Weed free check (HW at 20,40, and 60 DAS)
_ _
T10 Weedy check _
_
Design : RBD Replications : Three
Plot size : 5 m x 3 m Crop and variety : Rice- Ratngiri-1
Fertilizers : 100:50:50 Kg N,P2O5,K2O Kg/ha Date of sowing : 05/06/2015 Date of harvesting : 14/10/2015

13
Table WS 3.1.1: Effects of herbicide combinations on weed density at 60 and 90 DAS (No. 0.25 m2)(Four year pooled mean)
Treatments
60 DAS 90 DAS
Grasses & Sedges Broad leaved weeds Grasses & Sedges Broad leaved weeds
2012 2013 2014 2015 Pooled 2012 2013 2014 2015 Pooled 2012 2013 2014 2015 Pooled 2012 2013 2014 2015 Pooled
T1: Bispyribac-Na 33.00 (5.68)
29.00 (5.16)
44.33 (6.64)
19.67 (4.45)
15.71 (4.00)
00.00 (0.71)
00.00 (0.71)
15.00 (3.93)
1.33 (1.18)
3.46 (1.98)
26.00 (5.04)
46.67 (6.81)
42.33 (6.50)
18.00 (4.26)
33.25 (5.81)
00.00 (0.71)
00.00 (0.71)
15.67 (4.02)
6.67 (2.66)
5.58 (2.47)
T2: Pendimethalin fb Bispyribac-Na
53.00 (6.56)
21.33 (4.32)
23.33 (4.88)
21.33 (4.66)
14.02 (3.80)
1.67 (1.26)
3.00 (1.68)
11.00 (3.38)
4.00 (2.12)
2.73 (1.80)
17.33 (4.09)
19.33 (4.22)
22.67 (4.81)
22.67 (4.79)
20.50 (4.58)
3.00 (1.50)
3.67 (1.81)
11.67 (3.51)
5.67 (2.45)
6.00 (2.55)
T3: Oxadiargyl fb Bispyribac-Na
26.33 (4.64)
23.33 (4.41)
17.00 (4.13)
20.00 (4.52)
13.13 (3.67)
1.00 (1.10)
00.00 (0.71)
14.67 (3.89)
2.33 (1.57)
1.96 (1.57)
17.67 (3.87)
26.00 (4.76)
18.33 (4.32)
21.00 (4.61)
20.75 (4.60)
2.67 (0.89)
0.33 (0.88)
15.00 (3.94)
6.00 (2.54)
6.00 (2.55)
T4: Pyrazosulfuron fb Bispyribac-Na
33.00 (5.68)
34.67 (5.88)
32.33 (5.70)
25.00 (5.03)
18.61 (4.34)
0.00 (0.71)
0.00 (0.71)
15.00 (3.91)
4.33 (2.18)
1.89 (1.54)
23.33 (4.74)
76.33 (8.73)
27.67 (5.28)
28.33 (5.31)
38.92 (6.27)
0.00 (0.71)
0.67 (1.00)
15.33 (3.95)
6.33 (2.59)
5.58 (2.45)
T5: Pendimethalin fb Bispyribac-Na fb manual weeding
57.00 (4.43)
2.67 (1.74)
15.67 (4.00)
9.33 (3.06)
6.36 (2.54)
4.00 (1.63)
1.00 (1.17)
9.33 (3.13)
3.67 (1.83)
1.61 (1.42)
1.00 (1.17)
32.33 (5.32)
15.67 (4.00)
9.00 (3.07)
14.50 (3.83)
8.67 (2.98)
4.00 (2.02)
12.00 (3.53)
5.67 (2.47)
7.58 (2.84)
T6: Pendimethalin fb manual weeding
6.67 (2.60)
0.67 (1.00)
16.00 (4.05)
8.67 (3.02)
4.07 (2.14)
3.00 (1.50)
3.33 (1.79)
6.67 (2.67)
0.67 (1.00)
1.38 (1.36)
3.00 (1.71)
5.33 (2.06)
17.67 (4.26)
7.33 (2.79)
8.33 (2.96)
7.33 (2.65)
6.67 (2.58)
7.67 (2.83)
4.00 (2.09)
6.42 (2.61)
T7: Bispyribac-Na + (chlorimuron+metsulfuron)
55.00 (7.41)
26.00 (5.02)
45.67 (6.78)
19.33 (4.42)
11.48 (3.46)
7.33 (2.04)
0.0 (0.71)
13.67 (3.76)
3.00 (1.72)
3.33 (1.93)
19.00 (4.32)
39.33 (6.26)
39.67 (6.30)
18.67 (4.34)
29.17 (5.45)
0.00 (0.71)
1.00 (1.10)
15.00 (3.94)
6.33 (2.59)
5.58 (2.46)
T8: Three mechanical weedings (cono / rotary weeder)
21.33 (4.45)
12.00 (2.88)
28.67 (5.37)
13.00 (3.57)
8.59 (2.95)
15.00 (3.59)
3.67 (1.85)
11.00 (3.37)
2.33 (1.68)
2.07 (1.60)
12.67 (3.15)
30.00 (5.31)
20.67 (4.68)
10.33 (3.23)
18.42 (4.31)
5.67 (2.24)
3.67 (1.55)
10.00 (3.24)
4.33 (2.15)
5.92 (2.50)
T9: Weed free check (HW at 20,40, & 60DAS)
7.67 (2.85)
3.00 (1.86)
16.00 (4.03)
4.67 (2.24)
3.48 (1.99)
0.67 (1.00)
0.0 (0.71)
5.33 (2.39)
0.67 (1.00)
0.78 (1.12)
0.67 (1.00)
3.00 (1.82)
18.00 (4.10)
4.33 (2.18)
6.50 (1.96)
1.00 (1.10)
1.00 (1.10)
9.00 (3.08)
2.67 (1.76)
3.42 (1.96)
T10: Weedy check 57.33 (7.45)
47.67 (6.71)
116.00 (10.78)
34.00 (5.86)
23.74 (4.92)
12.67 (2.53)
1.67 (1.39)
26.67 (5.26)
8.00 (2.87)
6.18 (2.58)
21.00 (4.56)
156.67 (12.03)
105.67 (10.29)
40.33 (6.37)
80.92 (8.95)
10.00 (2.81)
7.33 (2.17)
27.33 (5.27)
9.67 (3.18)
13.58 (3.72)
S.Em ± - (0.79)
- (0.67)
- (0.58)
- (0.32)
- (0.29)
- (1.31)
- (0.50)
- (0.20)
- (0.50)
- (0.18)
- (0.53)
- (0.81)
- (0.22)
- (0.33)
- (0.27)
- (0.76)
- (0.81)
- (0.14)
- 0.23
- 0.21
C.D.at 5% - (2.20)
- (1.86)
- (0.78)
- (0.89)
- (0.79)
- (N.S.)
- (N.S.)
- (0.55)
- (N.S.)
- (N.S.)
- (1.46.)
- (2.25)
- (0.62)
- (0.90)
- (0.75)
- (2.11)
- (N.S.)
- (0.40)
- 0.64
- 0.58

14
Results and discussion:- I) Effect of herbicide combinations on weed density- As compared to weedy check all the weed control measures significantly reduced the weed density of monocots at 60 DAS during individual years and in pooled results. Application of pedimethalin fb manual weeding remained at par with weed free check and Pendimethalin fb Bispyriback-Nafb manual weeding and recording significantly lowest weed density of monocots over all other treatments during the year 2013, 2014 and in pooled results. While, during 2012 Pendimethalinfb manual weeding showed the lowest weed density over rest of the weed control measures tried except weed free check, Bispyribac-Na, Pendimethalin fb Bispyribac-Na, Pyrazosulfuron fb Bispyribac-Na and Bispyribac-Na + (chlorimuron + metsulfuron) which were at par with each other.
Weed density of BLWS at 60 DAS was not significantly influenced due to different weed control measures during all the years of experimentation and in pooled result except during 2014. Where in weed free check recorded significantly lowest weed density of BLWS except pendimethalin fb manual weeding. The weed free check exhibiting highest weed control efficiency followed by pendimethalin fb manual weeding and Pendimethalin fb Bispyriback-Nafb manual weeding. At 90 DAS weed free check (3HW) reduce significantly the density of monocots over all other weed control measures tried, except use of pendimethalin fb manual weeding and Pendimethalin fb Bispyriback-Nafb manual weeding during 2012 and 2015 while, Pendimethalin fb manual weeding during 2013. However, during 2014 use of Pendimethalin fb Bispyriback-Na fb manual weeding recorded significantly lowest weed density of monocots over all other weed control measures, except weed free check and Pendimethalin fb manual weeding. In pooled results weed free check reduce significantly the density of monocots over all other weed control measures followed by Pendimethalin fb Bispyribac-Na fb manual weeding and Pendimethalin fb manual weeding.
At 90 DAS weed free check (3HW) reduce significantly the density of BLWs over weedy check and remain at par with all other treatments during 1st year, while no significant difference was observed during 2nd year of experimentation. Weed free check (3HW) reduce significantly the density of BLWs over all other treatments except pendimethalin fb manual weeding during 2014 while during the year 2015 weed free check remained at par with pendimethalin fb manual weeding and Three mechanical weedings (cono / rotary weeder) and reduce significantly the density of BLWs as compared to all other treatment. However, in pooled results weed free check recorded significantly least the density of BLWs as compared to Pendimethalin fb Bispyribac-Na fb manual weeding, Pendimethalin fb manual weeding and Weedy check and remained at par with all other treatments.

15
Table W S 3.1.2 Effects of herbicide combinations on weed growth at 60 DAS (No. 0.25 m2) (Four year pooled mean).
Treatments Grasses & Sedges Broad leaved weeds WCI %
2012 2013 2014 2015 Pooled 2012 2013 2014 2015 Pooled 2012 2013 2014 2015 Pooled
T1: Bispyribac-Na 24.67 (4.74)
3.84 (1.97)
14.67 (3.88)
6.31 (2.58)
12.37 (3.55)
00.00 (0.71)
00.00 (0.71)
12.50 (3.59)
0.25 (0.85)
3.19 (1.91) 30.19 65.71 12.83 59.25 33.67
T2: Pendimethalin fb Bispyribac-Na
19.67 (4.34)
2.75 (1.79)
12.33 (3.56)
6.67 (2.67)
10.35 (3.28)
0.33 (0.88)
0.27 (0.87)
6.33 (2.61)
1.51 (1.41)
2.11 (1.61) 43.41 73.04 40.13 49.19 46.89
T3: Oxadiargyl fb Bispyribac-Na
15.00 (3.40)
3.53 (2.00)
14.00 (3.80)
8.45 (2.99)
10.25 (3.24)
0.33 (0.88)
0.00 (0.71)
5.17 (2.37)
0.98 (1.16)
1.62 (1.45) 56.62 68.48 38.50 41.43 49.40
T4: Pyrazosulfuron fb Bispyribac-Na
27.33 (4.83)
4.09 (2.13)
10.00 (3.30)
8.61 (2.98)
14.51 (3.83)
0.00 (0.71)
0.00 (0.71)
3.23 (1.92)
2.37 (1.69)
1.40 (1.38) 22.67 63.48 57.56 29.94 32.18
T5: Pendimethalin fb Bispyribac-Na fb manual weeding
10.67 (2.79)
0.44 (0.96)
5.00 (2.34)
3.39 (1.96)
4.87 (2.24)
0.33 (0.88)
0.09 (0.77)
2.33 (1.66)
0.95 (1.15)
0.93 (1.19)
68.87 95.27 76.48 73.04 75.28
T6: Pendimethalin fb manual weeding
1.00 (1.22)
0.12 (0.78)
6.50 (2.64)
1.60 (1.42)
2.31 (1.67)
0.33 (0.88)
0.36 (0.91)
4.17 (2.14)
0.00 (0.71)
1.22 (1.30) 96.24 95.71 65.77 90.06 83.95
T7: Bispyribac-Na + (chlorimuron+metsulfuron)
10.33 (3.18)
2.42 (1.57)
13.83 (3.78)
6.23 (2.55)
8.20 (2.94)
3.33 (1.53)
0.00 (0.71)
7.00 (2.73)
1.31 (1.31)
2.91 (1.83) 61.35 78.39 33.17 53.17 52.64
T8: Three mechanical weedings (cono / rotary weeder)
4.33 (2.09)
4.37 (2.00)
12.67 (3.61)
4.13 (2.14)
6.38 (2.59)
1.33 (1.34)
0.44 (0.96)
4.17 (2.13)
0.87 (1.17)
1.70 (1.48)
83.98 57.05 45.97 68.94 65.56
T9: Weed free check (HW at 20,40, & 60DAS)
2.00 (1.52)
0.42 (1.03)
6.83 (2.70)
3.30 (1.94)
3.14 (1.91)
0.33 (0.88)
0.00 (0.71)
2.12 (2.26)
0.23 (0.83)
0.67 (1.08) 93.41 96.25 71.29 78.07 84.76
T10: Weedy check 32.67 (5.70)
10.80 (3.25)
17.50 (4.22)
12.69 (3.63)
18.42 (4.34)
2.67 (1.45)
0.40 (0.98)
13.67 (6.87)
3.41 (1.92)
5.04 (2.35)
- - - - -
S.Em ± - (0.86)
- (0.38)
- (0.16)
- 0.25
- (0.31)
- (0.67)
- (0.13)
- (1.03)
- (0.26)
- (0.15)
C.D.at 5% - (2.39)
- (1.05)
- (0.45)
- 0.70
- (0.85)
- (N.S.)
- (N.S.) -
(N.S) -
(N.S.) -
(N.S.)
Figures in parentheses indicate square root transformations √x + 0.5

16
Table W S 3.1.3 Effects of herbicide combinations on weed growth at 90 DAS (No. 0.25 m2) (Four year pooled mean).
Treatments Grasses & Sedges Broad leaved weeds WCI %
2012 2013 2014 2015 Pooled 2012 2013 2014 2015 Pooled 2012 2013 2014 2015 Pooled
T1: Bispyribac-Na 33.50 (5.76)
102.00 (9.87)
25.38 (5.08)
2.67 (1.77)
39.48 (6.32)
00.00 (0.71)
00.00 (0.71)
18.70 (4.36)
2.27 (1.66)
1.66 (1.47) 68.54 16.39 24.29 56.82 32.12
T2: Pendimethalin fb Bispyribac-Na
20.00 (4.30)
23.67 (4.00)
18.04 (4.29)
2.87 (1.83)
12.71 (3.53)
1.33 (1.39)
1.00 (1.17)
9.10 (3.06)
2.65 (1.77)
2.26 (1.65) 81.10 79.78 53.38 51.75 75.30
T3: Oxadiargyl fb Bispyribac-Na
36.83 (6.02)
86.33 (8.27)
20.37 (4.56)
2.82 (1.81)
32.64 (5.45)
1.17 (1.22)
0.33 (0.88)
9.47 (3.14)
2.11 (1.61)
1.69 (1.48) 66.32 28.97 48.75 56.91 43.36
T4: Pyrazosulfuron fb Bispyribac-Na
28.83 (5.13)
66.33 (7.98)
29.78 (5.50)
3.16 (1.91)
25.96 (5.04)
0.00 (0.71)
0.33 (0.71)
6.18 (2.56)
2.68 (1.78)
1.40 (1.37) 74.45 45.36 38.23 48.95 54.86
T5: Pendimethalin fb Bispyribac-Na fb manual weeding
1.00 (1.15)
12.33 (3.22)
10.81 (3.35)
1.08 (1.25)
4.44 (2.18)
1.67 (1.45)
1.00 (1.22)
3.70 (2.04)
2.08 (1.58)
1.70 (1.48)
97.63 89.07 75.08 72.38 89.87
T6: Pendimethalin fb manual weeding
2.50 (1.53)
1.33 (1.27)
12.90 (3.65)
2.18 (1.64)
2.41 (1.69)
1.50 (1.38)
1.33 (1.34)
6.19 (2.90)
1.99 (1.55)
1.93 (1.56) 96.45 97.82 67.21 63.55 92.84
T7: Bispyribac-Na + (chlorimuron+metsulfuron)
17.50 (4.16)
112.67 (10.43)
21.61 (4.68)
2.67 (2.67)
34.34 (5.84)
0.00 (0.71)
0.33 (0.88)
13.16 (3.64)
2.77 (1.81)
1.69 (1.48) 84.49 7.38 40.28 52.45 40.55
T8: Three mechanical weedings (cono / rotary weeder)
10.50 (3.24)
53.00 (6.51)
18.26 (4.31)
2.60 (1.76)
17.60 (4.11)
15.17 (3.36)
0.67 (1.05)
7.20 (2.75)
1.99 (1.54)
5.14 (2.28)
77.25 56.01 56.27 59.88 62.48
T9: Weed free check (HW at 20,40, & 60DAS)
1.67 (1.26)
1.00 (1.22)
11.32 (3.43)
2.31 (1.67)
2.10 (1.60)
0.17 (0.81)
0.33 (0.88)
3.48 (1.97)
1.24 (1.30)
0.93 (1.19) 98.37 98.91 74.58 68.97 95.00
T10: Weedy check 74.50 (8.47)
116.67 (10.78)
32.90 (5.77)
5.59 (2.45)
46.96 (6.79)
38.33 (5.28)
5.33 (2.12)
25.32 (5.07)
5.85 (2.51)
13.65 (3.54)
- - - - -
S.Em ± - (0.58)
- (0.91)
- (0.15)
- (0.15)
- (0.47)
- (1.24)
- (0.43)
- (0.24)
- (0.19)
- (0.45)
C.D.at 5% - (1.61.)
- (1.52)
- (0.45)
- (0.42)
- (1.31)
- (3.42)
- (1.19)
- (0.70)
- (0.52)
- (1.25)
Figures in parentheses indicate square root transformations √x + 0.5
17
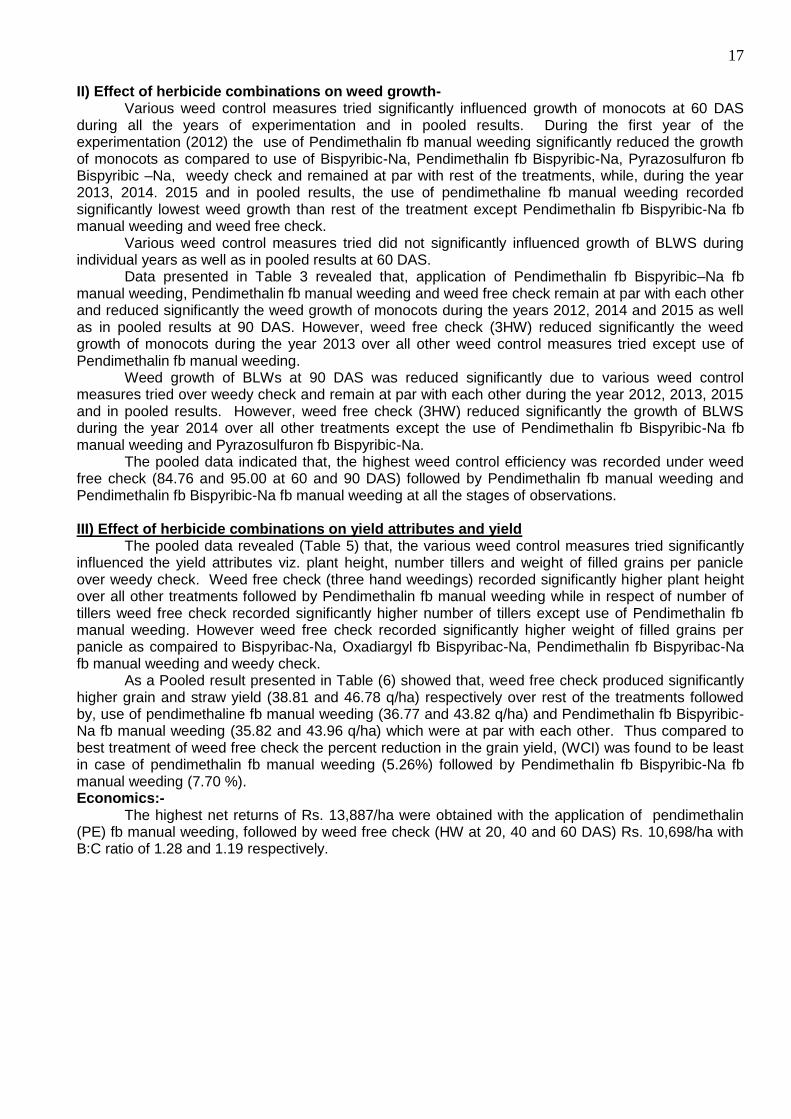
II) Effect of herbicide combinations on weed growth- Various weed control measures tried significantly influenced growth of monocots at 60 DAS during all the years of experimentation and in pooled results. During the first year of the experimentation (2012) the use of Pendimethalin fb manual weeding significantly reduced the growth of monocots as compared to use of Bispyribic-Na, Pendimethalin fb Bispyribic-Na, Pyrazosulfuron fb Bispyribic –Na, weedy check and remained at par with rest of the treatments, while, during the year 2013, 2014. 2015 and in pooled results, the use of pendimethaline fb manual weeding recorded significantly lowest weed growth than rest of the treatment except Pendimethalin fb Bispyribic-Na fb manual weeding and weed free check. Various weed control measures tried did not significantly influenced growth of BLWS during individual years as well as in pooled results at 60 DAS. Data presented in Table 3 revealed that, application of Pendimethalin fb Bispyribic–Na fb manual weeding, Pendimethalin fb manual weeding and weed free check remain at par with each other and reduced significantly the weed growth of monocots during the years 2012, 2014 and 2015 as well as in pooled results at 90 DAS. However, weed free check (3HW) reduced significantly the weed growth of monocots during the year 2013 over all other weed control measures tried except use of Pendimethalin fb manual weeding. Weed growth of BLWs at 90 DAS was reduced significantly due to various weed control measures tried over weedy check and remain at par with each other during the year 2012, 2013, 2015 and in pooled results. However, weed free check (3HW) reduced significantly the growth of BLWS during the year 2014 over all other treatments except the use of Pendimethalin fb Bispyribic-Na fb manual weeding and Pyrazosulfuron fb Bispyribic-Na. The pooled data indicated that, the highest weed control efficiency was recorded under weed free check (84.76 and 95.00 at 60 and 90 DAS) followed by Pendimethalin fb manual weeding and Pendimethalin fb Bispyribic-Na fb manual weeding at all the stages of observations. III) Effect of herbicide combinations on yield attributes and yield The pooled data revealed (Table 5) that, the various weed control measures tried significantly influenced the yield attributes viz. plant height, number tillers and weight of filled grains per panicle over weedy check. Weed free check (three hand weedings) recorded significantly higher plant height over all other treatments followed by Pendimethalin fb manual weeding while in respect of number of tillers weed free check recorded significantly higher number of tillers except use of Pendimethalin fb manual weeding. However weed free check recorded significantly higher weight of filled grains per panicle as compaired to Bispyribac-Na, Oxadiargyl fb Bispyribac-Na, Pendimethalin fb Bispyribac-Na fb manual weeding and weedy check. As a Pooled result presented in Table (6) showed that, weed free check produced significantly higher grain and straw yield (38.81 and 46.78 q/ha) respectively over rest of the treatments followed by, use of pendimethaline fb manual weeding (36.77 and 43.82 q/ha) and Pendimethalin fb Bispyribic-Na fb manual weeding (35.82 and 43.96 q/ha) which were at par with each other. Thus compared to best treatment of weed free check the percent reduction in the grain yield, (WCI) was found to be least in case of pendimethalin fb manual weeding (5.26%) followed by Pendimethalin fb Bispyribic-Na fb manual weeding (7.70 %). Economics:- The highest net returns of Rs. 13,887/ha were obtained with the application of pendimethalin (PE) fb manual weeding, followed by weed free check (HW at 20, 40 and 60 DAS) Rs. 10,698/ha with B:C ratio of 1.28 and 1.19 respectively.

18
Table W S 3.1.4: Effects of herbicide combinations on growth and yield attributes of rice (Four year pooled mean).
Treatments Height (cm) No. of Tillers Panicle Length (cm) Weight of filled Grain /panicles
2012 2013 2014 2015 Pooled 2012 2013 2014 2015 Pooled 2012 2013 2014 2015 Pooled 2012 2013 2014 2015 Pooled
T1: Bispyribac-Na 52.40 65.67 83.30 69.95 67.83 37.33 96.00 62.00 40.33 58.92 18.40 19.30 19.27 18.82 18.95 1.03 2.97 1.98 2.07 2.07
T2: Pendimethalin fb Bispyribac-Na
57.00 71.50 89.67 74.97 73.28 31.00 64.00 61.67 44.33 46.58 18.07 21.49 20.17 19.43 19.79 1.47 3.70 2.52 2.19 2.19
T3: Oxadiargyl fb Bispyribac-Na
59.67 63.53 88.20 74.74 71.54 50.00 72.67 64.00 43.33 57.50 19.67 20.29 20.26 19.68 19.98 2.01 4.18 2.40 2.06 2.06
T4: Pyrazosulfuron fb Bispyribac-Na
51.40 66.95 86.83 73.90 69.77 47.00 56.00 63.00 44.67 52.67 18.47 19.29 18.43 18.95 18.79 2.11 2.64 2.00 2.23 2.23
T5: Pendimethalin fb Bispyribac-Na fb manual weeding
63.67 72.63 91.33 79.30 76.57 48.33 62.67 66.00 51.33 54.25 19.27 19.57 31.37 19.86 20.02 2.01 3.38 3.19 2.08 2.08
T6: Pendimethalin fb manual weeding
59.67 69.70 93.20 78.89 75.37 60.67 75.33 69.00 50.00 63.75 19.87 20.47 21.54 20.10 20.49 2.25 3.35 3.08 2.24 2.24
T7: Bispyribac-Na + (chlorimuron+metsulfuron)
49.53 76.13 83.33 72.20 70.35 35.33 60.00 60.67 46.33 50.58 18.93 21.43 19.03 18.95 19.59 2.09 3.17 2.48 2.26 2.26
T8: Three mechanical weedings (cono / rotary weeder)
55.67 71.53 89.50 74.38 73.02 36.67 76.00 62.00 47.00 53.58 18.20 20.67 20.42 19.41 19.68 1.52 3.52 2.48 2.21 2.21
T9: Weed free check (HW at 20,40, & 60DAS)
60.80 76.43 91.03 80.58 77.71 51.67 80.00 68.00 56.33 64.00 19.33 20.40 20.70 20.05 20.12 2.22 3.68 2.63 2.27 2.27
T10: Weedy check 54.60 61.19 79.30 62.88 64.49 32.00 66.00 56.00 45.67 45.33 19.47 18.68 16.80 17.67 18.51 2.04 2.23 1.88 1.86 1.86
S.Em ± 0.72 0.72 0.36 0.63 0.28 2.45 2.09 0.29 0.23 0.95 0.38 0.27 0.12 0.34 0.16 0.41 0.32 0.16 0.03 0.03
C.D.at 5% N.S. N.S 1.01 1.75 0.77 N.S. N.S 0.80 0.63 2.62 N.S. N.S 0.33 N.S. N.S. N.S. 0.88 0.45 0.08 0.08

19
Table W S 3.1.5: Effects of herbicide combinations on yield of rice (Four year pooled mean).
Treatments Grain Yield qu/ha Straw Yield qu/ha WCI%
2012 2013 2014 2015 Pooled 2012 2013 2014 2015 Pooled 2012 2013 2014 2015 Pooled
T1: Bispyribac-Na 19.51 23.13 28.65 27.80 22.28 20.44 24.23 49.11 33.53 29.33 33.64 56.06 27.72 17.09 42.59
T2: Pendimethalin fb Bispyribac-Na
17.95 50.44 35.19 27.85 30.36 20.00 52.99 54.75 33.87 37.90 38.95 4.18 11.23 16.94 21.77
T3: Oxadiargyl fb Bispyribac-Na
17.96 40.56 36.76 28.93 31.05 19.11 43.00 52.87 35.44 37.60 38.91 22.95 7.27 13.72 19.99
T4: Pyrazosulfuron fb Bispyribac-Na
16.42 32.82 29.24 25.80 26.07 19.11 36.76 41.86 30.62 32.09 44.15 37.65 26.24 23.05 32.83
T5: Pendimethalin fb Bispyribac-Na fb manual weeding
25.71 46.38 39.19 32.05 35.82 28.89 50.09 58.24 38.62 43.96 12.55 11.89 1.14 4.41 7.70
T6: Pendimethalin fb manual weeding
23.22 52.33 39.45 32.09 36.77 24.15 56.49 55.55 38.80 43.82 21.02 0.59 0.48 4.29 5.26
T7: Bispyribac-Na + (chlorimuron+metsulfuron)
11.31 38.31 27.73 27.33 26.17 12.22 41.38 46.69 33.18 33.37 61.53 27.22 30.05 18.49 32.57
T8: Three mechanical weedings (cono / rotary weeder)
17.89 37.51 35.58 25.07 29.01 19.06 40.51 52.87 31.35 35.95 39.15 28.74 10.24 25.23 25.25
T9: Weed free check (HW at 20,40, & 60DAS)
29.40 52.64 39.64 33.53 38.81 30.44 56.85 59.58 40.24 46.78 - - - - -
T10: Weedy check 3.33 10.89 19.96 24.89 14.77 3.77 11.85 34.35 29.20 19.79 88.67 79.31 49.65 25.77 61.94
S.Em ± 0.60 0.75 0.27 0.57 0.29 0.41 0.78 0.54 0.62 0.36 - - - - -
C.D.at 5% 1.65 2.08 0.74 1.57 0.80 1.13 1.17 1.49 1.73 0.98 - - - - -

20
Table W S 3.1.6: Economics for Weed Control Measures Applied in Rice
* selling rate 1) Rice – 1500/- per qu. 2) Straw – 200/- per qu. * Herbicide rate : 1) Bispyribac-Na – 7950/liter 2) Pendimethalin – 500/liter 3) Oxadiargyl – 6772/kg 4) Pyrazosulfuron – 4000/kg 5) chlorimuron+metsulfuron – 21750/kg Summary: Pooled results revealed that, among various herbicide tried the total weed growth of monocots and BLWs was conspicuously suppressed by the application of Pendimethalin fb manual weeding exhibiting the highest weed control efficiency (83.95 and 92.84%) at 60 and 90 DAS respectively, next to that pendimethalin fb Bispyribac Na fb manual weeding (75.28 and 89.87).
All weed control measures under study recorded significant increase in grain & straw yield over weedy check. The weed free check recorded significantly highest grain & straw yield of 38.81 and 46.78 q/ha. respectively over all other treatments followed by Pendimethalin fb manual weeding and Pendimethalin fb Bispyribac-Na fb manual weeding for yield. The highest Benefit Cost Ratio was obtained from the application of Pendimethalin fb manual weeding (1.28). Conclusion On the basis four years pooled data it could be concluded that pre emergence application of pendimethalin (30EC) 1.00kg/ha in 500 lit. of water fb manual weeding was the most effective and economical treatment ( BC ratio 1.28) followed by weed free check (HW at 20, 40, and 60 DAS) ( BC ratio 1.19) to control weeds effectively in direct seeded drilled rice during Kharif season. Recommendation In Konkan region, for effective weed control and higher returns form Kharif dilled rice, pre emergence application of pendiethalin 1.00 kg./ha (30 EC) in 500 lit. of water with one hand weeding at 25 DAS.
f'kQkjl%&
dksd.k foHkkxkr [kjhi isjHkkrke/khy r.kkaPks izHkkfo
fu;a=.kklkBh vkf.k vf/kd mRiknu o uQk feG.;klkBh isj.khuarj
Treatments
Pooled Result (2012 to 2015)
Grain yield (q/ha)
Straw yield
(q/ha)
Gross Expenditure
(Rs./ha.)
Gross returns
in (Rs./ha.)
Net returns (Rs./ha.)
C: B ratio
T1: Bispyribac-Na 22.28 29.33 43408 39286 -4122 0.91
T2: Pendimethalin fb Bispyribac-Na
30.36 37.90 52546 53120 574 1.01
T3: Oxadiargyl fb Bispyribac-Na
31.05 37.60 52740 54095 1355 1.03
T4: Pyrazosulfuron fb Bispyribac-Na
26.07 32.09 44694 45523 829 1.02
T5: Pendimethalin fb Bispyribac-Na fb manual weeding
35.82 43.96 52505 62522 10017 1.19
T6: Pendimethalin fb manual weeding
36.77 43.82 50032 63919 13887 1.28
T7: Bispyribac-Na + (chlorimuron+metsulfuron)
26.17 33.37 44329 45929 1600 1.04
T8: Three mechanical weedings (cono / rotary weeder)
29.01 35.95 55225 50705 -4520 0.92
T9: Weed free check (HW at 20,40, & 60DAS)
38.81 46.78 56873 67571 10698 1.19
T10: Weedy check 14.77 19.79 35935 26113 -9822 0.73

21
isaMhfeFkkyhu 1 fd-xzW@gsDVjh 500 fyVj ik.;ke/;s mxo.khiwoZ Qokj.kh
d:u isj.khuarj 25 fnolkauh cs.k.kh djkoh-
W S 3.6 Weed management in conservation agriculture systems
Objectives
To monitor weed dynamics, crop productivity and herbicide residues under long-term tillage and residue management practices
To evaluate the effect on crop productivity and resource-use efficiency
To study C-sequestration, and changes in physico-chemical and biological properties of soil
Year of commencement : Kharif,2015
Location : Agronomy Farm, College of Agriculture, Dapoli
Treatments Details:
A) Main plot treatments : I) Sowing times
Cropping sequence Kharif- Rice
*Rabi (Mustered)
*Summer (cowpea)
1 : T1:: CT (Transplanted) CT -
2 : T2:: CT (Transplanted) ZT ZT
3 : T3:: CT (Direct -seeded) CT ZT
4 : T4:: ZT (Direct -seeded) ZT ZT
5 : T5:: ZT (Direct -seeded) ZT + R ZT
B ) Sub plot treatments : II) Weed control measures
1 W1:Oxadiargyl @ 0.1kg/ha (PE)
W1:Oxadiazon @ 2.0 kg/ha PE)
W1:Pendimethalin @ 1.0 kg/ha PE)
2
W2: Oxadiargyl @ 0.1kg/ha PE) + HW at 40 DAS/DAT
W2: Oxadiazon @ 2.0 kg/ha PE)+ 1Hoeing at 20 DAS & 1 HW at 30- 40 DAS
W2: Pendimethalin @ 1.0 kg/ha PE) 1Hoeing at 20 DAS & HW at 30 DAS
3 W3: weedy check W3: weedy check W3: weedy check
Plot size : Gross : 8.10 x 4.20 m = 34.05 m2
Replications : Three
Design : Strip plot
Season and crop : Kharif rice
Variety : Ratnagiri-24
Date of sowing : 06/06/2015
Date of transplanting 10 & 12/07/2015
Date of harvesting : T1 & T2 :-, 06 & 07/10/2015 T3, T4, & T5 :- 28/09/2015 & 01/10/2015

22
Table W S 3.6.1.: Effect of tillage and weed control measures as affected by different treatments
on weed density at 30, 60 DAS/DAT and at harvest.
Treatments
Weed density at 30 DAS/DAT (No./0.25 m2)
Weed density at 60 DAS/ DAT (No./0.25 m2)
Weed density at at harvest (No./0.25 m2)
G&S BLWs G&S BLWs G&S BLWs
A) Main plot treatments : Tillage and residue management
T1:: CT (Transplanted) 2.2 (1.6)
1.2 (1.2)
2.7 (1.6)
2.2 (1.6)
4.2 (2.1)
1.7 (1.4)
T2:: CT (Transplanted) 2.4 (1.6)
1.6 (1.4)
3.7 (2.0)
3.1 (1.8)
4.7 (2.2)
2.2 (1.6)
T3:: CT (Direct -seeded) 7.1 (2.9)
1.9 (1.7)
8.1 (2.8)
3.3 (1.9)
5.0 (2.2)
2.2 (1.6)
T4:: ZT (Direct -seeded) 8.3
(3.1) 2.7
(1.5) 8.9
(2.8) 4.8
(2.2) 5.3
(2.4) 2.9
(1.8)
T5:: ZT (Direct -seeded) 8.1
(2.3) 2.0
(1.5) 8.7
(2.8) 3.9
(2.0) 5.0
(2.1) 2.7
(1.8)
Sem ± -
(0.2) -
(0.2) -
(0.2) -
(0.16) -
(0.1) -
(0.1)
LSD (P=0.05) -
(0.5) -
(N.S) -
(0.7) -
(N.S) -
(N.S) -
(N.S)
B) Sub plot treatments : Weed control measures
W1:Oxadiargyl @ 0.1kg/ha 6.4
(2.3) 1.8
(1.6) 8.0
(2.8) 3.7
(2.0) 5.7
(2.5) 2.3
(1.6)
W2: Oxadiargyl @ 0.1kg/ha + HW at40DAS/DAT
2.2 (1.8)
0.8 (1.1)
1.3 (1.2)
1.6 (1.3)
1.2 (1.2)
1.4 (1.3)
W3: weedy check 8.4
(2.7) 3.0
(1.7) 9.9
(3.1) 5.1
(2.3) 7.6
(2.8) 3.3
(1.9)
Sem ± -
(0.2) -
(0.1) -
(0.1) -
(0.1) -
(0.1) -
(0.1)
LSD (P=0.05) -
(0.7) -
(0.3) -
(0.5) -
(0.4) -
(0.4) -
(0.3)
Interaction effects
Sem ± 0.18 0.14 0.2 0.2 0.1 0.1
LSD (P=0.05) (N.S) (N.S) (N.S) (N.S) (N.S) (N.S)
(Figures in parentheses indicate square root transformations √x + 0.5 and WCE%) Result & discussion:- Composition of weed flora: Kharif 2015 (Rice) i) Effect on weed density:- a) Effect of tillage and residue management The data revealed that, the effect of tillage and residue management did not influenced significantly in reducing weed density of monocots at harvest and BLWs at all the stages of observation. However, weed density of monocots at 30 and 60 DAS/DAT was significantly reduced in (CT: transplanted rice) treatment (T1) and which was remained at par with (CT : transplanted rice) treatment T2 followed by treatments CT (Direct -seeded), ZT (Direct -seeded) and ZT (Direct -seeded). b) Effect of weed control measures:- It is seen from the data (Table-1) that different weed control measures influenced significantly the weed density of monocots and BLWs at all the stages of observations. Application of oxadiargyl @ 0.1 kg/ha + 1 HW at 40 DAS/DAT recorded significantly least weed density of monocots and BLWs over oxadiargyl alone and weedy check during all the stages of observations except 30 DAS/DAT pertaining to monocots and at harvest to BLWs and it was remain at par with use of oxadiargyl alone.

23
c) Interaction effect:- The interaction effect between tillage and weed control measures was found to be non significant. Table W S 3.6.2.: Effect of tillage and weed control measures as affected by different treatments
on weed growth at 30, 60 DAS/DAT and at harvest.
Treatments
Weed growth at 30 DAS/DAT
Weed growth at 60 DAS/ DAT
Weed growth at harvest
G&S BLWs Total WCI %
G&S BLWs Total WCI %
G&S BLWs Total WCI %
A) Main plot treatments : Tillage and residue management
T1:: CT (Transplanted)
0.8 (1.1)
0.4 (0.9)
1.0 (1.1)
0.9 (1.1)
1.2 (1.3)
0.6 (1.0)
T2:: CT (Transplanted)
0.9 (1.2)
0.5 (1.0)
1.3 (1.3)
1.0 (1.2)
1.8 (1.4)
0.9 (1.1)
T3:: CT (Direct -seeded)
1.8 (1.6)
0.5 (1.0)
2.8 (1.9)
1.3 (1.3)
1.9 (1.5)
0.9 (1.2)
T4:: ZT (Direct -seeded)
2.3 (1.6)
0.7 (1.0)
3.2 (2.2)
1.8 (1.4)
2.9 (1.8)
1.1 (1.6)
T5:: ZT (Direct -seeded)
2.2 (1.4)
0.6 (1.1)
3.1 (2.1)
1.3 (1.3)
2.1 (1.5)
0.9 (1.2)
Sem ± -
(0.1) -
(0.1)
- (0.2)
- (0.1)
-
(0.1) -
(0.1)
LSD (P=0.05) -
(0.2) -
(N.S)
- (0.6)
- (N.S)
-
(0.3) -
(0.2)
B) Sub plot treatments : Weed control measures
W1:Oxadiargyl @ 0.1kg/ha
1.6 (1.4)
0.5 (1.0)
2.1 40.0 2.8
(2.1) 1.3
(1.3) 4.1 25.5
2.5 (1.7)
0.9 (1.2)
3.4 17.1
W2: Oxadiargyl @ 0.1kg/ha + HW at40DAS/DAT
0.5 (1.1)
0.2 (0.8)
0.7 80.0 0.4
(0.7) 0.5
(1.0) 0.9 83.6
0.7 (1.0)
0.4 (0.9)
1.1 73.2
W3: weedy check
2.7 (1.6)
0.8 (1.1)
3.5 3.6
(2.4) 1.9
(1.5) 5.5
2.8 (1.8)
1.3 (1.5)
4.1
Sem ± 0.04 0.02 0.3 0.1 0.1 0.1
LSD (P=0.05) 0.1 0.1 1.3 0.2 0.6 0.2
Interaction effects
Sem ± 0.1 0.1 0.3 0.1 0.1 0.1
LSD (P=0.05) (N.S) (N.S) (N.S) (N.S) (N.S) (N.S)
Figures in parentheses indicate square root transformations √x + 0.5 and WCE%
II) Effect on weed growth:- a) Effect of tillage and residue management-:- The data presented in Table 2 revealed that, the effect tillage practices and residue management influenced significantly the weed growth of monocots at all the stages of observation and at harvest pertaining to BLWs. The weed growth of monocots was significantly reduced due treatment T1 (CT:- transplanted rice) as compared to all other tillage practice except treatment T2 (CT:- transplanted rice). However, significantly least weed growth of BLWs was observed in T1(CT-transplanted rice) treatments as compared to T4 (ZT: Direct seeded) and it was remained at par with all other remaining tillage practices. b) Weed control measures:- The data presented in Table 2 revealed that the different weed control measures influenced significantly the weed growth of monocots and BLWs at 30, 60 DAS/DAT and at harvest. Application of oxadiargyl 0.1 kg/ha +1 HW at 40 DAS/DAT recorded significantly least weed growth of monocots and BLWs than weedy check and oxadiargyl alone during all the stages of observations. The highest weed control efficiency (73.2%) was observed in oxadiargyl 0.1 kg/ha +1 HW at 40 DAS/DAT during all the stages of observations followed by oxadiargyl alone (17.1%). c) Interaction effect:-

24
The interaction effects between tillage and weed control measures was found to be non significant. III) Effect on yield attribute & yield of rice:- a) Effect of tillage and residue management:- The growth parameter viz. Height of plant, number of tillers at harvest, grain and straw yield of rice was significantly influenced by different tillage practices. The treatment T1 and T2 (CT: Transplanted rice) remained at par with each other and recorded significantly higher number of tiller as well as grain and straw yield of rice as compared to all other tillage practices. However, height of plant at harvest was significantly increased in T1 (CT: Transplanted) treatment over all other treatments except treatment T2 (CT: Transplanted). b) Effect of weed control measures:- As regards weed control measures integration of oxadiorgyl + 1 HW at 40 DAS/DAT recorded significantly higher growth parameters viz height of plant, number of tillers, as well as grain and straw yield of Kharif rice compared to weedy check and remained at par with application oxadiargyl alone. c) Interaction effect:-
The interaction effects between tillage and weed control measures was found to be non significant. Table W S 3.6.3.: Effect tillage and weed control measures as affected by different treatments.
(Kharif Rice)
Treatments Height
at harvest (cm)
Number of tillers at harvest
Grain yield (t/ha)
Straw yield (t/ha)
Weed Index (%)
A) Main plot treatments : Tillage and residue management
T1:: CT (Transplanted) 74.1 52.6 2.88 3.24
T2:: CT (Transplanted) 72.6 52.4 2.82 3.27
T3:: CT (Direct -seeded) 72.2 39.1 2.29 2.58
T4:: ZT (Direct -seeded) 69.6 38.0 2.17 2.41
T5:: ZT (Direct -seeded) +R 72.1 38.6 2.25 2.56
Sem ± 0.5 3.4 0.11 0.13
LSD (P=0.05) 1.6 11.0 0.36 0.42
B) Sub plot treatments : Weed control measures
W1:Oxadiargyl @ 0.1kg/ha 72.5 42.1 2.56 2.87 1.63
W2: Oxadiargyl @ 0.1kg/ha + HW at 40 DAS/DAT 72.7 49.0 2.58 2.94
-
W3: weedy check 71.1 41.2 2.31 2.62 10.69
Sem ± 0.3 1.5 0.03 0.06
LSD (P=0.05) 1.2 6.1 0.12 0.24
Interaction effects
Sem ± 0.7 3.0 0.13 0.15
LSD (P=0.05) NS NS NS NS
Summary:- Amongst various weed control measures the application of oxadiargyl + 1 HW at 40 DAS was best treatment exhibiting highest WCE% in terms of growth of weeds and consequently grain and straw yield of rice. The weed growth of monocots at all stages of observation significantly least due CT (Transplanted rice) over all other tillage practices and resulting into increase in yield attributes and yield of rice

25

26
W. S. 3.7:- Long term herbicide trial in different cropping systems.
Objective : To find out combined effects of herbicides and green manuaring on weed dynamics, herbicide efficacy and growth and productivity of rice-groundnut cropping sytem.
Year of commencement : Kharif, 2011
Location : Agronomy Farm, College of Agriculture, Dapoli, Dist. Ratnagiri.
Dominant Cropping system : Rice – Groundnut
Treatment details :
A) Main plot treatments : Green manuring
M1 : Green manuring (Sesbania rostrata)
M2 : Without Green manuring
B) Sub plot treatments : Weed control measures
For Rice (Kharif) : For Groudnut (Rabi)
T1 : Fixed herbicide Pretilachlor-S 50 EC @ 0.75 kg/ha 3-7
DAT
Pendimethalin 30EC @ 1.0 kg/ha PE
T2: Rotational herbicide sequence Pyrazosulfuron 10 WP @ 0.25 kg/ha
8-10 DAT(I yr), Fenoxaprop 10 EC @ 80 kg/ ha25-30
DAT (IIyr), Oxadiargyl 80 WP@
0.100 kg/ha 0-5 DAT(IIIyr)
: Oxadiargyl 80 [email protected] kg/ha 0-2 DAS (Iyr),
Butachlor 50 EC @ 1.0 kg/ha 0-3 DAS(IIyr), Alachlor 50 EC
@ 1.5 kg/ha0-3 DAS (IIIyr)
T3:
Weed free check (2HW at 20&40DAT)
: Weed free check (2HW at 20&40DAS)
T4: Weedy check : Weedy check
Plot size : Gross :10 m X10 m (Main plot) Net:2.30 m X10m(Sub plot)
Replications : Three
Design : Split plot
Season and crop : Kharif rice – Rabi groundnut
Variety : R-24 Konkan Tapora
Spacing : 20 × 15 cm 30 × 15cm
Fertilizers (N:P2O5:K2O kg/ha) : 100:50:50 25:50-00
Date of Sowing (Groundnut) : 03/01/2015
Date of Harvesting : 11/05/2015
Date of sowing (Rice) : 20/06/2014
Date of sowing of dhaincha : 25/06/2014
Date of incorporation : 17/07/2014
Date of Transplanting : 19/07/2014
Date of Harvesting (Rice) : 29/10/2014
27
Table WS 3.7.1: Effects of green manuaring and weed control measures on weed density in rice at 30 DAT (No/0.25m2). (four years
pooled mean).
Treatments Grasses and sedges Broad leaved weeds Weed control efficiency
2011 2012 2013 2014 Pooled 2011 2012 2013 2014 Pooled 2011 2012 2013 2014 Pooled
Main plot treatment : Green manuaring
M1: Green manuaring
2.67 (1.44)
2.92 (1.77)
5.92 (2.35)
6.25 (2.55)
4.43 (2.05)
0.67 (1.01)
0.33 (0.86)
0.25 (0.81)
2.58 (1.73)
0.96 (1.10)
- - - -
M2: without green manuring
3.42 (1.85)
5.83 (2.27)
5.50 (2.25)
5.58 (2.44)
5.07 (2.21)
0.58 (0.94)
0.58 (0.98)
0.25 (0.83)
2.08 (1.56)
0.88 (1.08)
- - - -
Sem ± -
(0.01) -
(0.13) -
(0.28) -
(0.06) -
(0.05) -
(0.03) -
(0.11) -
(0.08) -
(0.09) -
(0.06) - - - -
LSD (P=0.05) -
(0.07) -
(N.S) -
(N.S) -
(N.S) -
(N.S.) (N.S.) (N.S.)
- (N.S.)
- (N.S.)
- (N.S.)
- - - -
Sub plot: Weed control measures
T1:Fixed.herbicide – Pendimethalin(PE)
2.67 (1.68)
3.0 (1.74)
4.33 (2.14)
6.50 (2.64)
4.73 (2.15)
0.67 (0.99)
0.50 (0.94)
0.00 (0.71)
2.33 (1.66)
0.88 (1.07)
47.32 52.25 27.6 25.42 17.86
T2: Rotational herbicide – Alachlor
3.33 (1.72)
4.67 (2.12)
6.67 (2.53)
4.83 (2.31)
5.44 (2.26)
0.67 (0.95)
0.67 (1.03)
0.00 (0.71)
2.00 (1.56)
0.83 (1.06)
36.91 27.15 10.00 42.31 8.20
T3: Weed free check
1.00 (1.09)
2.83 (1.76)
5.17 (2.33)
4.17 (2.16)
3.29 (1.83)
0.00 (0.71)
0.33 (0.86)
1.00 (1.13)
1.33 (1.34)
0.67 (1.01)
84.23 56.89 7.50 53.55 42.02
T4: Weedy check 5.17
(2.08) 7.00
(2.47) 6.67
(2.21) 8.17
(2.94) 5.54
(2.28) 1.17
(1.26) 0.33
(0.86) 0.00
(0.71) 3.67
(2.03) 1.29
(1.21) - - - - -
Sem ± -
(0.39) -
(0.38) -
(0.41) -
(0.07) -
(0.13) -
(0.17) -
(0.15) -
(0.12) -
(0.10) -
(0.05) - - - - -
LSD (P=0.05) -
(N.S.) -
(N.S.) -
(N.S.) -
(0.21) -
(N.S.) -
(N.S.) -
(N.S.) -
(N.S.) -
(0.30) -
(N.S.) - - - - -
Interaction effects
Sem ± -
(0.56) -
(0.54) -
(0.58) -
(0.12) -
0.18 -
(0.24) -
(0.21) -
(0.16) -
(0.42) -
(0.07) - - - - -
LSD (P=0.05) -
(N.S.) -
(N.S.) -
(N.S.) -
(N.S) -
(N.S.) -
(N.S.) -
(N.S.) -
(N.S.) -
(N.S.) -
(N.S.) - - - - -
Figures in parentheses indicate square root transformations √x + 0.5

28
Table WS 3.7.2: Effects of green manuaring and weed control measures on weed density in rice at 50 DAT (No/0.25m2) (four years pooled mean).
Treatments Grasses and sedges Broad leaved weeds Weed control efficiency
2011 2012 2013 2014 Pooled 2011 2012 2013 2014 Pooled 2011 2012 2013 2014 Pooled
Main plot treatment : Green manuring
4.67 (1.98)
1.25 (1.27)
6.67 (2.61)
7.33 (2.76)
6.07 (2.34)
0.00 (0.71)
0.75 (1.00)
1.83 (1.39)
5.58 (2.45)
2.11 (1.40)
- - - - -
M1: Green manuring
10.17 (2.83)
2.08 (1.49)
11.00 (3.25)
7.08 (2.70)
6.45 (2.41)
0.33 (0.67)
1.00 (1.15)
2.08 (1.44)
4.92 (2.22)
2.02 (1.43)
- - - - -
M2: without green manuring
- (0.26)
- (0.02)
- (0.18)
- (0.04)
- (0.07)
- (0.02)
- (0.05)
- (0.13)
- (0.12)
- (0.01)
- - - - -
Sem ± -
(N.S.) -
(0.13) -
(1.08) -
(N.S) -
(N.S.) -
(0.13) -
(N.S) -
(N.S) -
(N.S.) -
(N.S.) - - - - -
LSD (P=0.05)
Sub plot: Weed control measures
T1:Fixed.herbicide – Pendimethalin(PE)
9.17 (2.74)
1.83 (1.45)
9.00 (2.88)
8.33 (2.97)
7.06 (2.54)
0.33 (0.88)
0.67 (0.99)
0.17 (0.80)
5.00 (2.34)
1.54 (1.25)
30.45 28.57 31.20 24.56 27.91
T2: Rotational herbicide – Alachlor
5.67 (2.14)
1.83 (1.42)
9.83 (3.11)
5.50 (2.43)
5.75 (2.29)
0.00 (0.71)
0.83 (1.09)
2.50 (1.63)
5.17 (2.36)
2.13 (1.45)
58.49 24.0 7.50 39.62 33.95
T3: Weed free check
1.50 (1.21)
1.17 (1.22)
6.17 (2.53)
4.33 (2.19)
3.29 (1.79)
0.00 (0.71)
0.33 (0.88)
2.17 (1.52)
3.83 (1.91)
1.58 (1.30)
89.02 57.15 37.43 53.82 59.18
T4: Weedy check 13.33 (3.53)
1.83 (1.42)
10.33 (3.20)
10.67 (3.34)
8.93 (2.88)
0.33 (0.86)
1.67 (1.35)
3.00 (1.71)
7.00 (2.73)
3.00 (1.66)
- - - - -
Sem ± -
(0.52) -
(0.24) -
(0.22) -
(0.11) -
(0.16) -
(0.10) -
(0.21) -
(0.28) -
(0.13) -
(0.11) - - - - -
LSD (P=0.05) -
(N.S.) -
(N.S.) -
(N.S.) -
(0.35) -
(0.49) -
(N.S.) -
(N.S.) -
(N.S.) -
(0.38) -
(N.S.) - - - - -
Interaction effects
Sem ± -
(0.74) -
(0.35) -
(0.32) -
(0.16) -
(0.23) -
(0.14) -
(0.30) -
(0.39) -
(0.18) -
(0.16) - - - - -
LSD (P=0.05) -
(N.S.) -
(N.S.) -
(N.S.) -
(N.S) -
(N.S.) -
(N.S.) -
(N.S.) -
(N.S.) -
(N.S.) -
(N.S.) - - - - -
Figures in parentheses indicate square root transformations √x + 0.5

29
Results :- A) Kharif Rice :- I) Effect on weed density a) Effect of green manuaring:- The data presented in Table No. 1 Weed density of monocots and BLWs in kharif rice at 30 and 50 DAT did not significantly influenced during the individual years and in pooled results due to green manuaring. b) Effect of weed control measures:- Various weed control measures tried did not significantly influenced weed density of monocots and BLWs at 30 DAS during all the individual years and also in pooled results except during the year 2014. Weed free check reduced significantly the weed density of monocots over weedy check and fixed herbicide but it was at par with rotational herbicide. While, all the weed control measures were at par with each other and reduce significantly the density of BLWs than weedy check . In kharif rice, weed free check reduced significantly the density of monocots during the year 2014 over weedy check and rotational herbicide but it was at par with fixed herbicide at 50 DAT (Table No. 2). While, in pooled results, weed free check reduced significantly the density of monocots than weedy check and fixed herbicide and remained at par with rotational herbicide, however weed free check reduced significantly the density of BLWs than rest of the weed control measures followed by fixed and rotational herbicide. c) Interaction effect:- Interaction effect between green manuaring and weed control measures on weed density found to be non significant. II) Effect on weed growth a) Effects of green manuring:- Four year pooled data presented in Table No. 3 revealed that green manuaring did not influence significantly the growth of monocots and BLWs at all the stages of observation during all the years of experimentation and in pooled results. b) Effect of weed control measures:- Weed free check reduced significantly the weed growth of monocots at 30 DAT during the year 2011 over all other weed control measures tried, however it was at par with the use of fixed herbicide during the year 2014, and it was identical with rotational herbicide and fixed herbicide in pooled results. Growth of BLWs did not significantly influence due to weed control measures during all the years as well as in pooled results. Lowest growth of monocots was recorded significantly due to weed free check over weedy check and rotational herbicide and was at par with fixed herbicide during the year 2014 at 50 DAT (Table No. 4). While, in pooled results weed free check remained at par with fixed and rotational herbicides. Among the herbicides tried rotational herbicide reduced weed growth of monocots than fixed herbicides. However growth of BLWs did not significantly influenced due to various weed control measures tried during individual years as well as in pooled analysis. c) Interaction effects:- The interaction effects between green manuaring and weed control measures on weed growth were found to be non significant.

30
Table WS 3.7.3: Effects of green manuaring and weed control measures on weed growth in rice at 30 DAT(No/0.25m2) (four years pooled mean).
Treatments Grasses and sedges Broad leaved weeds Weed control Index
2011 2012 2013 2014 Pooled
2011 2012 2013 2014 Pooled
2011 2012 2013 2014 Poole
d
Main plot treatment : Green manuring
M1: Green manuring 1.00
(1.15) 2.71
(1.64) 0.84
(1.10) 1.14
(1.27) 1.74
(1.41) 0.83
(1.05) 0.18
(0.80) 0.01
(0.71) 0.54
(1.02) 0.39
(0.89) - - - - -
M2: without green manuring
1.50 (1.35)
1.28 (1.34)
2.14 (1.56)
1.15 (1.28)
1.19 (1.27)
0.58 (0.95)
0.63 (0.93)
0.01 (0.71)
0.41 (0.95)
0.41 (0.88)
- - - - -
Sem ± -
(0.06) -
(0.17) -
(0.05) -
(0.01) -
(0.04) -
(0.07) -
(0.07) -
(0.01) -
(0.03) -
(0.01) - - - - -
LSD (P=0.05) -
(N.S.) -
(N.S.) -
(0.29) -
(N.S) -
(N.S.) -
(N.S.) -
(N.S.) -
(N.S.) -
(N.S.) -
(N.S.) - - - - -
Sub plot: Weed control measures
T1:Fixed.herbicide – Pendimethalin(PE)
1.83 (1.50)
0.86 (2.12)
0.93 (1.17)
1.10 (1.26)
1.18 (1.26)
0.50 (0.94)
0.29 (0.85)
0.00 (0.72)
0.47 (0.98)
0.31 (0.87)
39.16 65.77 46.9 20.70 45.02
T2: Rotational herbicide – Alachlor
1.17 (1.26)
1.77 (1.34)
1.72 (1.38)
1.17 (1.29)
1.45 (1.32)
0.50 (0.90)
0.78 (0.84)
0.00 (0.72)
0.51 (1.00)
0.45 (0.89)
56.40 24.11 - 3.61 15.15 29.89
T3: Weed free check
0.00 (0.71)
2.37 (1.74)
1.65 (1.39)
0.99 (1.22)
1.25 (1.27)
0.00 (0.71)
0.16 (0.79)
0.04 (0.73)
0.26 (0.87)
0.11 (0.78)
100 24.70 - 1.81 36.87 49.82
T4: Weedy check 2.00
(1.52) 2.98
(1.74) 1.66
(1.38) 1.31
(1.34) 1.99
(1.50) 1.83
(1.43) 0.38
(0.87) 0.00
(0.71) 0.67
(1.07) 0.72
(1.02) - - - - -
Sem ± -
(0.15) -
(0.18) -
(0.19) -
(0.02) -
(0.05) -
(0.19) -
(0.13) -
(0.01) -
(0.03) -
(0.05) - - - - -
LSD (P=0.05) -
(0.45) -
(N.S) -
(N.S) -
(0.05) -
(0.15) -
(N.S.) -
(N.S.) -
(N.S.) -
(N.S.) -
(N.S.) - - - - -
Interaction effects
Sem ± -
(0.21) -
(0.26) -
(0.27) -
(0.02) -
(0.07) -
(0.27) -
(0.19) -
(0.01) -
(0.03) -
(0.07) - - - -
LSD (P=0.05) -
(N.S.) -
(N.S.) -
(N.S.) -
(N.S) -
(N.S.) -
(N.S.) -
(N.S.) -
(N.S.) -
(N.S.) -
(N.S.) - - - -
Figures in parentheses indicate square root transformations √x + 0.5

31
Table WS 3.7.4 : Effects of green manuaring and weed control measures on weed growth in rice at 50 DAT(No/0.25m2).
Treatments Grasses and sedges Broad leaved weeds Weed control Index
2011 2012 2013 2014 Pooled 2011 2012 2013 2014 Pooled 2011 2012 2013 2014 Pooled
Main plot treatment : Green manuaring
M1: Green manuaring
1.27 (1.22)
2.01 (1.49)
2.22 (1.31)
1.18 (1.29)
2.15 (1.46)
0.00 (0.71)
0.76 (0.99)
0.12 (0.79)
0.75 (1.11)
0.41 (0.90)
- - - - -
M2: without green manuring
3.08 (1.70)
2.96 (1.74)
4.14 (1.67)
1.22 (1.30)
2.38 (1.57)
0.67 (0.97)
1.43 (1.23)
0.14 (0.79)
0.64 (1.06)
0.72 (1.01)
- - - - -
Sem ± - (0.17)
- (0.12)
- (0.16)
- (0.01)
- (0.02)
- (0.05)
- (0.15)
- (0.03)
- (0.04)
- (0.04)
- - - - -
LSD (P=0.05) - (N.S.)
- (N.S.)
- (N.S.)
- (N.S)
- (N.S.)
- (N.S.)
- (N.S.)
- (N.S.)
- (N.S.)
- (N.S.)
- - - - -
Sub plot: Weed control measures
T1:Fixed.herbicide – Pendimethalin(PE)
2.87 (1.67)
2.54 (1.67)
2.61 (1.83)
1.14 (1.27)
2.29 (1.57)
0.63 (0.98)
0.93 (1.05)
0.00 (0.72)
0.72 (1.10)
0.57 (0.96)
17.26 35.74 66.84 10.58 41.75
T2: Rotational herbicide – Alachlor
1.92 (1.31)
2.71 (1.65)
1.33 (1.51)
1.26 (1.32)
1.80 (1.40)
0.00 (0.71)
0.85 (1.07)
0.23 (0.85)
0.79 (1.13)
0.47 (0.94)
54.61 34.07 80.18 1.44 53.77
T3: Weed free check
0.38 (0.90)
1.60 (1.31)
1.09 (1.18)
1.05 (1.24)
1.03 (1.16)
0.00 (0.71)
0.29 (0.86)
0.12 (0.79)
0.55 (1.02)
0.24 (0.84)
91.02 65.00 84.62 23.08 74.13
T4: Weedy check 3.53 (1.97)
3.10 (1.82)
7.70 (2.54)
1.35 (1.36)
3.93 (1.92)
0.70 (0.85)
2.30 (1.46)
0.17 (0.81)
0.83 (1.19)
0.98 (1.08)
- - - - -
Sem ± - (0.30)
- (0.30)
- (0.37)
- (0.02)
- (0.16)
- (0.16)
- (0.28)
- (0.04)
- (0.03)
- (0.11)
- - - - -
LSD (P=0.05) - (N.S.)
- (N.S.)
- (N.S.)
- (0.05)
- (0.48)
- (N.S.)
- (N.S.)
- (N.S.)
- (0.08)
- (N.S.)
- - - - -
Interaction effects
Sem ± -
(0.42) -
(0.42) -
(0.52) -
(0.02) -
(0.22) -
(0.23) -
(0.39) -
(0.06) -
(0.04) -
(0.15) - - - - -
LSD (P=0.05) -
(N.S.) -
(N.S.) -
(N.S.) -
(N.S) -
(N.S.) -
(N.S.) -
(N.S.) -
(N.S.) -
(N.S.) -
(N.S.) - - - - -
Figures in parentheses indicate square root transformations √x + 0.5

32
Table WS 3.7.5: Effects of green manuaring and weed control measures on yield (q/ha) of Kharif rice.
Treatments Grain Pooled Straw Pooled WI% Pooled
2011 2012 2013 2014 2011 2012 2013 2014 2011 2012 2013 2014 Main plot treatment : Green manuaring M1: Green manuring
37.69 48.72 30.71 31.31 38.62 38.34 48.94 36.18 37.36 38.69 - - - -
M2: without green manuring
24.41 36.50 29.70 30.00 31.65 20.98 37.68 30.40 35.98 29.77 - - - -
Sem ± 0.79 0.94 0.19 0.26 0.34 0.39 1.10 1.39 0.23 0.70 - - - -
LSD (P=0.05) 4.83 5.71 N.S N.S 2.09 2.38 6.70 N.S N.S 4.28 - - - -
Sub plot: Weed control measures
T1:Fixed.herbicide – Pendimethalin(PE)
31.53 41.81 28.17 31.40 34.39 33.18 46.01 33.25 36.07 35.96 13.69 9.21 11.83 14.84 12.39
T2: Rotational herbicide – Alachlor
34.25 43.33 31.80 28.65 35.42 33.51 40.99 33.67 33.93 34.19 6.24 5.91 0.47 21.01 8.41
T3: Weed free check
36.53 46.05 31.95 34.90 39.15 27.81 44.57 32.66 44.33 34.98 - - - -
T4: Weedy check 21.90 40.25 28.89 22.67 31.57 24.13 41.67 33.60 28.34 31.78 40.05 12.60 9.58 35.62 24.46
Sem ± 2.07 1.18 1.51 0.60 0.98 1.45 1.63 3.75 0.72 1.19 - - - -
LSD (P=0.05) 6.37 3.65 N.S 1.84 3.03 4.46 N.S N.S 2.20 N.S. - - - -
Interaction effects
Sem ± 2.93 1.67 2.14 0.84 1.39 2.05 2.31 5.31 1.01 1.69 - - - -
LSD (P=0.05) N.S. N.S. N.S N.S N.S. N.S. N.S. N.S N.S N.S. - - - -

33
III) Effect on grain and straw yield of Kharif rice a) Effects of green manuaring:- Green manuaring influence significantly grain and straw yield of Kharif rice and produce significantly higher grain and straw yield as compared to without green manuaring during the year 2011, 2012 and in pooled results. b) Effect of weed control measures:- As regards, weed control measures tried, influence significantly the grain yield of rice during individual years as well as in pooled results except during the year 2013. (Table No. 5) Weed free check (2HW) produced significantly highest grain yield of rice over use of both (fixed and rotational) herbicide and weedy check during the year 2014 and in pooled results while, it was at par with fixed and rotational herbicide during the year 2011 and during the year 2012 with rotational herbicide. Various weed control measures did not influence significantly the straw yield of rice during the year 2012, 2013 and in pooled analysis. Pooled result revealed that compared to best treatment of weed free check the percent reduction in grain yield in terms of WCI was found to be the least in case of use of rotational herbicide (8.41%) followed by fixed herbicide (12.39%). c) Interaction effects:- The interaction effects between green manuring and weed control measures on grain yield of Kharif rice was found to be non significant. Summary
Pooled result revealed that green manuring did not influenced the weed density and weed growth at 30, 50 DAT and at harvest during all the years of experimentation. Similarly it was not influenced the yield attributes except plant height. However green manuring recorded significantly higher grain and straw yield of rice. Weed density of monocots was reduced significantly due to the application of fixed and rotational herbicides at 50 DAT and at harvest. The weed growth of monocots and BLWs was also significantly influenced due to various weed control measures. The grain yield of rice was significantly highest in weed free check (39.15 q ha-1) followed by rotational herbicide (35.42).

34
Table WS 3.7.6: Effects of green manuaring weed control measures on weed density in Rabi Groundnut at 30 DAS (No./0.25m2)
Treatments Grasses and sedges Broad leaved weeds Weed control efficiency
2012 2013 2014 2015 Pooled 2012 2013 2014 2015 Pooled 2012 2013 2014 2015 Pooled
Main plot treatment : Green manuring
M1: Green manuring
23.50 (4.35)
42.25 (6.09)
28.50 (5.10)
35.38 (5.66)
32.41 (5.31)
0.42 (0.89)
3.75 (1.66)
4.83 (2.47)
4.29 (2.05)
3.32 (1.71)
- - - - -
M2: without green manuring
13.17 (3.49)
34.50 (5.59)
23.50 (4.64)
29.29 (5.19)
25.22 (4.69)
0.00 (0.71)
6.75 (2.06)
5.17 (2.43)
5.96 (2.29)
4.47 (1.82)
- - - - -
Sem ± -
(0.06) -
(0.41) -
(0.16) -
(0.14) -
(0.18) -
(0.04) -
(0.32) -
(0.30) -
(0.13) -
(0.11) - - - - -
LSD (P=0.05) -
(0.38) -
(N.S) -
(N.S) -
(N.S.) -
(N.S.) (N.S.)
- (N.S.)
- (N.S.)
- (N.S.)
- (N.S.)
Sub plot: Weed control measures
T1:Fixed.herbicide – Pendimethalin(PE)
22.50 (4.63)
37.17 (6.08)
22.33 (4.76)
29.75 (5.49)
27.94 (5.27)
0.00 (0.71)
0.17 (0.80)
3.00 (1.86)
1.58 (1.43)
1.19 (1.20)
20.61 49.24 53.52 51.18 47.24
T2: Rotational herbicide – Alachlor
23.17 (5.17)
50.50 (6.95)
33.00 (5.78)
41.75 (6.48)
37.10 (6.01)
0.17 (0.80)
3.17 (1.69)
5.83 (2.51)
4.50 (2.22)
3.42 (1.80)
17.64 27.31 58.75 27.93 26.61
T3: Weed free check
0.00 (0.71)
7.83 (2.83)
4.67 (2.23)
6.42 (2.60)
4.73 (2.09)
0.00 (0.71)
1.83 (1.36)
1.50 (1.25)
1.67 (1.46)
1.25 (1.22)
100.00 86.92 88.68 87.39 89.17
T4: Weedy check 27.67 (5.17)
58.00 (7.49)
44.83 (6.71)
51.42 (7.14)
45.48 (6.65)
0.67 (0.99)
15.83 (3.60)
9.67 (3.17)
12.75 (3.57)
9.73 (2.84)
- - -
Sem ± -
(0.34) -
(0.44) -
(0.10) -
(0.28) -
(0.23) -
(0.10) -
(0.54) -
(0.30) -
(0.17) -
(0.16) - - - - -
LSD (P=0.05) -
(1.05) -
(1.36) -
(0.32) -
(0.86) -
(0.70) -
(N.S.) -
(1.67) -
(0.93) -
(0.52) -
(0.49) - - - - -
Interaction effects
Sem ± -
(0.48) -
(0.62) -
(0.15) -
(0.41) -
(0.32) -
(0.15) -
(0.76) -
(0.43) -
0.24 -
(0.23) - - -
LSD (P=0.05) -
(N.S.) -
(N.S.) -
(N.S) -
(N.S.) -
(N.S.) -
(N.S.) -
(N.S.) -
(N.S.) -
(N.S.) -
(N.S.) - - - - -
Figures in parentheses indicate square root transformations √x + 0.5

35
Table WS 3.7.7: Effects of green manuaring weed control measures on weed density in Rabi Groundnut at 50 DAS (No./0.25m2)
Treatments Grasses and sedges Broad leaved weeds Weed control efficiency
2012 2013 2014 2015 Pooled 2012 2013 2014 2015 Pooled 2012 2013 2014 2015 Pooled
Main plot treatment : Green manuaring
M1: Green manuaring
21.42 (4.54)
30.33 (5.02)
17.75 (5.12)
24.04 (4.70)
23.39 (4.52)
2.00 (1.43)
9.25 (2.50)
7.67 (2.75)
8.50 (2.71)
6.85 (2.34)
- - - - -
M2: without green manuring
14.83 (3.51)
27.25 (4.64)
25.50 (4.97)
26.38 (4.91)
23.49 (4.52)
2.00 (1.33)
8.75 (2.63)
6.33 (3.29)
7.54 (2.62)
6.16 (2.26)
- - - - -
Sem ± -
(0.39) -
(0.12) -
(0.71) -
0.11 -
(0.08) -
(0.18) -
(0.27) -
(0.05) -
0.18 -
(0.10) - - - - -
LSD (P=0.05) -
(N.S) -
(N.S) -
(N.S) -
(N.S.) -
(N.S.) -
(N.S) -
(N.S) -
(N.S.) -
(N.S.) -
(N.S.) - - - - -
Sub plot: Weed control measures
T1:Fixed.herbicide – Pendimethalin(PE)
22.67 (4.68)
20.33 (4.48)
18.67 (4.34)
19.50 (4.46)
20.29 (4.52)
1.00 (1.16)
0.83 (1.03)
5.33 (2.39)
3.08 (1.84)
2.56 (1.60)
29.00 70.12 48.94 61.68 1.10
T2: Rotational herbicide – Alachlor
22.67 (4.17)
45.00 (6.60)
24.50 (4.96)
34.75 (5.91)
31.73 (5.57)
0.83 (1.07)
10.17 (3.03)
8.83 (3.75)
9.50 (3.10)
7.33 (2.57)
29.51 22.12 29.09 24.90 25.63
T3: Weed free check
0.00 (0.71)
1.67 (1.33)
8.67 (3.01)
5.17 (2.37)
3.88 (1.85)
0.00 (0.71)
2.33 (1.56)
1.50 (1.36)
2.0 (1.53)
1.46 (1.29)
100 94.35 78.36 87.83 89.83
T4: Weedy check 27.1
(6.00) 48.17 (6.91)
34.67 (7.87)
41.42 (6.47)
37.85 (6.14)
6.17 (2.57)
22.67 (4.63)
12.33 (3.57)
17.50 (4.19)
14.67 (3.74)
- - - - -
Sem ± -
(0.47) -
(0.42) -
(0.99) -
(0.17) -
(0.14) -
(0.17) -
(0.38) -
(0.08) -
(0.18) -
(0.11) - - - - -
LSD (P=0.05) -
(1.44) -
(1.30) -
(3.04) -
(0.51) -
(0.43) (0.53)
- (1.16)
- (0.24)
- (0.55)
- (0.33)
- - - - -
Interaction effects
Sem ± -
(0.66) -
(0.60) -
(1.39) -
(0.24) -
(0.20) -
(0.24) -
(0.53) -
(0.11) -
(0.25) -
(0.15) - - - - -
LSD (P=0.05) -
(N.S.) -
(N.S.) -
(N.S) -
(N.S.) -
(N.S.) -
(N.S.) -
(N.S.) -
(N.S.) -
(N.S.) -
(N.S.) - - - - -
Figures in parentheses indicate square root transformations √x + 0.5

36
B) Rabi Groundnut I. Effect on weed density a). Effect of green manuaring:-
In the groundnut cultivated during rabi season both group of weeds (monocots and BLWs) did not differ significantly due to green manuaring treatments during individual years as well as in pooled results at all stages of observations. b). Effect of weed control Measures:-
In rabi groundnut, weed free check (2 HW) was found to be the most effective and significantly superior in reducing weed density of monocots over all other treatments at 30 DAS during individual years and also in pooled results. Among herbicides tried the fixed herbicide reduced significantly the weed density of monocots at 30 DAS than rotational herbicide during the years 2014, 2015 and also in pooled results, but it was at par with each other during the years 2012 and 2013 (Table 6). However, the use of fixe herbicide (Pendimethalin) remained at par with weed free check at 30 DAS and recorded significantly the lowest weed density of BLWs over rest of the treatment during the years 2014, 2015 and in pooled result. While, all the weed control measures tried reduced significantly the weed growth of BLWs as compared to weedy check during the year 2013. However, weed growth of BLWs did not differ significantly at 30 DAS due to various weed control measures during the year 2012.
Two hand weeding at 20 and 40 DAS reduced significantly the weed density of monocots at 50 DAS during individual years and in pooled results over all other weed control measures tried, except the use of fixed and rotational herbicides during the year 2014 (Table 7). Among the herbicides tried use of fixed herbicide the weed density of monocots reduced significantly than rotational herbicides during the years 2013, 2015 and in pooled results, but it was remained at par with rotational herbicide during the years 2012 and 2014. However, weed free check (2HW) significantly reduced the density of BLWs at 50 DAS during the years 2013, 2014 and in pooled results as compared to rotational herbicides but remained at par with fixed herbicides during the years 2012 and 2015. c). Interaction effect:-
Interaction effects between green manuring and weed control measures on density of weed was found to be non-significant.

37
Table WS 3.7.8: Effects of green manuaring and weed control measures on weed growth in Rabi Groundnut at 30 DAS (g/0.25m2)
Treatments Grasses and sedges Broad leaved weeds Weed control Index
2012 2013 2014 2015 Pooled 2012 2013 2014 2015 Pooled 2012 2013 2014 2015 Pooled
Main plot treatment : Green manuaring
M1: Green manuaring
0.93 (1.20)
2.37 (1.61)
1.85 (1.59)
2.11 (1.57)
1.82 (1.46)
0.03 (0.73)
0.17 (0.81)
0.51 (1.00)
0.34 (0.91)
0.27 (0.86)
- - - - -
M2: without green manuring
0.57 (0.99)
2.03 (1.54)
1.82 (1.49)
1.92 (1.52)
1.58 (1.39)
0.00 (0.71)
0.81 (1.01)
0.45 (0.87)
0.41 (0.94)
0.42 (0.90)
- - - - -
Sem ± -
(0.06) -
(0.08) -
(0.07) -
(0.07) -
(0.05) -
(0.01) -
(0.05) -
(0.06) -
(0.02) -
(0.01) - - - - -
LSD (P=0.05) -
(N.S.) -
(N.S.) -
(N.S) -
(N.S.) -
(N.S.) -
(N.S.) -
(N.S.) -
(N.S.) -
(N.S.) -
(N.S.) - - - - -
Sub plot: Weed control measures
T1:Fixed.herbicide – Pendimethalin(PE)
0.88 (1.15)
2.32 (1.66)
2.13 (1.78)
2.23 (1.65)
1.89 (1.52)
0.00 (0.71)
0.02 (0.72)
0.28 (0.88)
0.15 (0,80)
0.11 (0.78)
24.79 54.38 28.27 37.53 40.12
T2: Rotational herbicide – Alachlor
1.00 (1.24)
2.58 (1.73)
2.26 (1.66)
2.42 (1.70)
2.09 (1.58)
0.02 (0.71)
0.22 (0.84)
0.35 (1.02)
0.41 (0.95)
0.31 (0.89)
12.82 45.42 14.88 25.72 28.14
T3: Weed free check
0.00 (0.71)
0.39 (0.83)
0.54 (1.02)
o.47 (0.97)
0.35 (0.91)
0.00 (0.71)
0.10 (0.77)
0.10 (0.77)
o.10 (0.77)
0.07 (0.76)
100.0 90.45 80.95 85.04 87.43
T4: Weedy check 1.12
(1.28) 3.51
(1.99) 2.41
(1.81) 2.96
(1.85) 2.47
(1.69) 0.05
(0.74) 1.62
(1.31) 0.95
(1.20) 0.85
(1.16) 0.87
(1.10) - - -
Sem ± -
(0.06) -
(0.10) -
(0.08) -
(0.06) -
(0.04) -
(0.01) -
(0.15) -
(0.08) -
(0.02) -
(0.04) - - - - -
LSD (P=0.05) -
(0.20) -
(0.31) -
(0.22) -
(0.19) -
(0.13) -
(N.S.) -
(N.S.) -
(0.28) -
(0.05) -
(0.12) - - - - -
Interaction effects
Sem ± -
(0.08) -
(0.14) -
(0.11) -
(0.09) -
(0.06) -
(0.01) -
(0.21) -
(0.12) -
(0.02) -
(0.06) - - -
LSD (P=0.05) -
(N.S.) -
(N.S.) -
(N.S) -
(N.S.) -
(N.S.) -
(N.S.) -
(N.S.) -
(N.S.) -
(N.S.) -
(N.S.) - - - - -
Figures in parentheses indicate square root transformations √x + 0.5

38
Table WS 3.7.9 : Effects of green manuaring and weed control measures on weed growth in Rabi Groundnut at 50 DAS (g/0.25m2) Treatments Grasses and sedges Broad leaved weeds Weed control Index
2012 2013 2014 2015 Pooled 2012 2013 2014 2015 Pooled 2012 2013 2014 2015 Pooled
Main plot treatment : Green manuaring
M1: Green manuaring
2.32 (1.58)
4.97 (2.14)
1.51 (1.32)
3.24 (1.85)
3.01 (1.75)
1.22 (1.22)
3.73 (1.86)
0.67 (1.17)
2.20 (1.50)
1.95 (1.39)
- - - - -
M2: without green manuring
1.69 (1.42)
4.29 (1.91)
1.81 (1.50)
3.05 (1.79)
2.71 (1.68)
1.14 (1.15)
6.32 (2.22)
0.59 (1.02)
3.46 (1.77)
2.88 (1.54)
- - - - -
Sem ± -
(0.07) -
(0.06) -
(0.06) -
(0.04) -
(0.01) -
(0.17) -
(0.21) -
(0.08) -
(0.08) -
(0.02) - - - - -
LSD (P=0.05) -
(N.S.) -
(N.S.) -
(N.S) -
(N.S.) -
(N.S.) -
(N.S.) -
(N.S.) -
(N.S.) -
(N.S.) -
(N.S.) - - - - -
Sub plot: Weed control measures
T1:Fixed.herbicide – Pendimethalin(PE)
2.48 (1.72)
3.74 (2.03)
1.76 (1.58)
2.75 (1.79)
2.68 (1.76)
0.85 (1.12)
0.94 (1.04)
0.37 (1.14)
0.65 (1.02)
0.70 (1.02)
42.09 78.60 34.86 73.33 68.91
T2: Rotational herbicide – Alachlor
2.75 (1.78)
5.82 (2.31)
1.95 (1.57)
3.89 (2.09)
3.60 (1.98)
0.90 (1.11)
5.62 (2.41)
0.88 (1.17)
3.25 (1.92)
2.66 (1.65)
36.52 47.69 13.45 44.00 42.41
T3: Weed free check
0.00 (1.71)
0.09 (0.77)
0.70 (0.93)
0.40 (0.95)
0.30 (0.88)
0.00 (0.71)
0.53 (1.01)
0.23 (0.84)
0.38 (0.92)
0.29 (0.87)
100 97.13 71.56 93.88 94.57
T4: Weedy check 2.78
(1.80) 8.86
(3.01) 2.22
(1.65) 5.54
(2.45) 4.85
(2.23) 2.97
(1.79) 13.01 (3.71)
1.05 (1.24)
7.03 (2.69)
6.02 (2.32)
- - -
Sem ± -
(0.08) -
(0.14) -
(0.10) -
(0.07) -
(0.04) -
(0.17) -
(0.32) -
(0.11) -
(0.15) -
(0.10) - - - - -
LSD (P=0.05) -
(0.24) -
(0.43) -
(0.30) -
(0.23) -
(0.13) -
(0.51) -
(0.97) -
(0.34) -
(0.45) -
(0.32) - - - - -
Interaction effects
Sem ± -
(0.11) -
(0.20) -
(0.14) -
(0.11) -
(0.06) -
(0.24) -
(0.45) -
(0.15) -
(0.21)
(0.14) - - - - -
LSD (P=0.05) -
(N.S.) -
(N.S.) -
(N.S) -
(N.S.) -
(N.S.) -
(N.S.) -
(N.S.) -
(N.S.) -
(N.S.) -
(N.S.) - - - - -
Figures in parentheses indicate square root transformations √x + 0.5

39
II) Effects on weed growth in rabi groundnut a) Effects of green manuaring:- Incorporation of green manuaring during Kharif rice, the weed growth of monocots and BLWs in rabi groundnut was not influenced significantly due to green manuaring at any stage of observation during all the years and in pooled results. b) Effects of weed control measures:- Data presented in Table 8 revealed that weed free check (2HW) at 30 DAS was found to be the most effective and significantly superior in reducing weed growth of monocots over all other weed control measures during individual years and in pooled results followed by fixed herbicide which was at par with rotational herbicide. Weed growth of BLWs at 30 DAS was also reduced significantly due to weed free check as compared weedy check during the year 2014. However, weed free check reduced significantly the growth of BLWs over weedy check and rotational herbicide during the year 2015 and in pooled results. At 50 DAS, weed free check was found significantly superior in reducing weed growth of monocots than rest of the weed control measures tried during individual year and in pooled analysis followed by fixed herbicide, which was at par with rotational herbicide (Table 9). Weed free check at 50 DAS reduced significantly the weed growth of BLWs during individual years and in pooled results over weedy check and remained at par with fixed and rotational herbicide for the year 2012, while, during the year 2013, 2014, 2015 and in pooled results weed free check remained at par with fixed herbicide and recorded significantly lowest weed growth as compared to weedy check and rotational herbicide. c) Interaction effect:- Interaction effects of both green manuring and weed control measures on weed growth was found to be non significant.

40
Table WS 3.7.10 : Effects of green manuaring and weed control measures on yield (q/ha) of Groundnut
Treatments Dry pod yield q/ha Haulm yield q/ha WI%
2012 2013 2014 2015 Pooled 2012 2013 2014 2015 Pooled 2012 2013 2014 2015 Pooled
Main plot treatment : Green manuaring
M1: Green manuaring
36.12 31.87 29.83 30.84 32.15 46.66 49.22 39.84 44.55 45.07 - - - - -
M2: without green manuaring
34.03 31.19 29.56 30.38 31.29 42.14 49.70 39.88 44.65 44.09 - - - - -
Sem ± 1.79 1.39 0.22 0.49 0.65 1.39 2.64 0.36 0.87 1.18 - - - - -
LSD (P=0.05) N.S N.S N.S N.S. N.S N.S N.S N.S N.S. N.S. - - - - -
Sub plot: Weed control measures
T1:Fixed.herbicide – Pendimethalin(PE)
36.81 33.04 30.92 31.97 33.18 45.73 54.02 40.90 47.49 47.03 5.40 8.58 9.38 5.90 7.32
T2: Rotational herbicide – Alachlor
31.25 32.27 29.49 30.86 30.97 38.76 50.33 37.42 43.87 42.59 19.69 10.71 15.57 11.50 14.37
T3: Weed free check
38.91 36.14 33.90 35.02 35.99 48.89 53.36 45.35 49.42 49.28 - - - - -
T4: Weedy check 33.33 24.66 24.47 24.58 26.76 44.13 40.12 35.78 37.62 39.41 14.34 31.76 23.97 26.34 24.10
Sem ± 1.87 1.56 0.48 1.57 0.90 2.71 1.41 0.90 1.79 0.86 - - - - -
LSD (P=0.05) 5.76 4.82 1.26 4.83 2.77 N.S 4.34 2.76 5.52 2.64 N.S - - - -
Interaction effects
Sem ± 2.64 2.21 0.60 2.22 1.27 3.83 1.99 1.27 2.53 1.21 - - - - -
LSD (P=0.05) N.S. N.S N.S N.S. N.S N.S. N.S N.S N.S. N.S. - - - - -

41
III) Effects on Dry pod yield and haulm yield of rabi groundnut a) Effect of green manuaring:- Incorporation of green manures (Sesbania rostrata) in Kharif rice did not influence the dry pod and haulm yield of groundnut to a significant level during individual years as well as in pooled result. b) Effect of weed control measures:-
Data presented in table (Table 10) revealed that various weed control measures tried produced significantly higher dry pod and haulm yield q/ha over weedy check during individual and in pooled analysis. The treatment weed free check (2HW at 20 and 40 DAS) was found significantly superior in producing dry pod yield followed by, fixed and rotational herbicide during the year 2014 and pooled analysis while, weed free check treatment remain at par with fixed and rotational herbicide during the year 2013 and 2015. Among the herbicide tried, fixed herbicide produce significantly higher dry pod yield as compared to rotational herbicide during the year 2012, 2014 and in pooled result. Weed free check (2HW) produce significantly higher haulm yield as compared to rotational herbicide and weedy check during the year 2015 and in pooled result while, it was at par with fixed and rotational herbicide during the year 2013. However, weed free check was found significantly superior in producing haulm yield followed by fixed and rotational herbicide during the year 2015. Pooled data revealed that thus compared to best treatment of weed free check the percent reduction in pod yield (WCI) was found to be least in case of use of fixed herbicide (Pendimethalin) (7.81%) followed by rotational herbicide. c) Interaction effect Interaction effects between green manuaring and weed control measures were found to be non significant. Summary
Pooled results revealed that green manuaring to kharif rice did not influenced the weed density and growth of monocots and BLWs in rabi groundnut. While the various weed control measures significantly influenced the weed density & weed growth at 30 and 50 DAS. The fixed and rotational herbicides reduced weed density and weed growth resulted in increased dry pod yield of groundnut (33.18 & 30.97 qha-1 respectively) over weedy check (26.76 qha-1 )

42
Table WS 3.7.11: Effects of green manuaring and weed control measures on REY of groundnut and total REY of rice-groundnut cropping system (q/ha).
Treatments REY of Groundnut Total REY of system
2011 2012 2013 2014 Pooled 2011 2012 2013 2014 Pooled
Main plot treatment : Green manuaring
M1: Green manuring 167.20 150.78 141.00 136.48 134.66 208.72 206.84 176.65 178.05 178.44
M2: without green manuring 157.34 147.81 139.81 134.53 131.04 183.85 189.95 173.66 174.54 166.65
Sem ± 8.20 6.42 1.07 2.17 2.77 7.40 5.54 0.94 2.05 2.35
LSD (P=0.05) N.S. N.S. N.S. N.S. N.S. N.S. N.S. N.S. N.S. N.S.
Sub plot: Weed control measures
T1:Fixed.herbicide – Pendimethalin(PE)
170.22 156.80 146.11 141.64 139.01 205.06 205.51 178.82 181.94 178.20
T2: Rotational herbicide – Alachlor 144.48 152.75 139.16 136.46 129.54 184.36 201.21 172.63 174.25 169.52
T3: Weed free check 179.97 170.65 160.28 154.82 150.54 217.01 223.38 196.68 203.86 194.35
T4: Weedy check 154.41 116.98 116.09 109.07 112.30 178.72 163.48 152.48 145.14 148.11
Sem ± 8.62 7.10 1.96 6.73 3.66 8.56 6.92 2.79 6.89 4.11
LSD (P=0.05) N.S. 21.88 6.04 20.74 11.26 26.37 21.33 8.60 21.24 12.65
Interaction effects
Sem ± 12.18 10.04 2.77 9.52 5.17 12.10 9.79 3.95 9.75 5.81
LSD (P=0.05) N.S. N.S. N.S. N.S. N.S. N.S. N.S. N.S. N.S. N.S.

43
C) Rice equivalent yield of groundnut and total REY of the system a) Effect of green manuaring- The data presented in Table 11 and depicted in Fig. 1 and 2 revealed that rice equivalent yield of groundnut and REY of system did not influenced significantly due to green manuaring during all the years of experimentation and in pooled results. However, green manuaring recorded higher rice equivalent yield of groundnut and total REY of system than without green manuaring. b) Effect of weed control measures- As compared to weedy check all the weed control measures significantly increased the rice equivalent yield of groundnut during all the years of experimentation except during the year 2011. Among the weed control measures tried T3 (weed free check) recorded significantly highest equivalent yield of groundnut than weedy check (T4) and remain at par with treatment T1 (fixed herbicide) and T2 (rotational herbicide) during the year 2012, 2014 while it was significantly superior over rest of the treatments during 2013 and in pooled results. As regard to the total REY of system, weed free check (T3) recorded significantly higher yield over rest of the treatments during the year 2013, 2014 and in pooled results while, it was on the same level with T1 (fixed herbicide) during the year 2011 and 2012. Among the use of fixed and rotational herbicide produced significantly higher total REY of the4 system over weedy check and remained at par with each other. Pawar and Kokate (2004) recorded the similar results. Pawar et al. (2003) the result of effective weed control along with higher total REY of the system by incorporation of green manuaring to kharif rice and application of pre emergence herbicide for rice and groundnut are confirmative with the present investigation. c) Interaction Effect- The interaction effect between green manuaring and weed control measures were found to be non significant during all the years of experimentation and in pooled results.
D) Microbiological studies Table WS 3.7. 12 :- Combined effects of green manuaring and weed control measure on bacterial, fungal population and nitrogen fixers in rice – groundnut cropping system during Kharif season.
Treatments Bacteria CFU (10-6) Fungi CFU (10-4)
Nitrogen fixers CFU (10-3)
30 DAS
50 DAS
Harvest 30
DAS 50
DAS Harvest
30 DAS
50 DAS
Harvest
Main plot treatment : Green manuaring
M1: Green manuaring
39.63 36.04 32.69 26.43 22.96 19.76 28.86 24.71 22.25
M2: without green manuaring
31.85 31.49 26.67 17.32 17.10 12.97 21.23 20.34 17.16
Sem ± 0.44 0.12 0.58 0.95 0.34 0.46 0.48 0.37 0.30
LSD (P=0.05) 2.71 0.76 3.50 5.76 2.07 2.82 2.92 2.24 1.85
Sub plot: Weed control measures
T1:Fix herbicide – Pendimethalin(PE)
33.62 31.82 27.03 20.39 19.03 15.99 22.85 20.54 17.33
T2: Rotational herbicide – Alachlor
33.80 31.63 27.17 20.07 18.35 15.17 22.62 20.45 17.65
T3: Weed free check
38.98 37.72 34.38 24.92 22.64 18.27 28.94 26.64 24.15
T4: Weedy check 36.56 33.88 30.12 22.10 20.09 16.03 25.75 22.47 19.70
Sem ± 0.69 0.69 0.99 1.03 0.89 0.77 0.66 0.96 1.33
LSD (P=0.05) 2.13 2.13 3.06 NS NS NS 2.02 2.95 4.10
Interaction effects
Sem ± 0.98 0.98 1.40 1.46 1.25 1.08 0.93 1.35 1.88
LSD (P=0.05) NS NS NS NS NS NS NS NS NS

44
a) Effect of green manuaring:- The pooled data presented in table no. 13 and 14 revealed that population of all soil microbes
were significantly influenced due to green manuaring. They recorded significantly higher population in green manuaring treatment as compared to the without green manuaring at 30 DAS, 50 DAS and at harvesting stage. b) Effect of weed control measure: -
The treatment weed free check (2HW) influenced significantly population of all soil microbes except fungi which were significantly superior over fixed herbicide, rotational herbicide and weedy check at 30 DAS, 50 DAS and at harvesting stage. The bacterial population was also found significantly less in fixed herbicide and the rotational herbicide as compared to weedy check at 30DAS and at par with weedy check at 50DAS and at harvest. c) Interaction effect:-
The interaction effects of green manuaring and weed control measures were found to be non significant.
Table WS 3.7.13:- Combined effects of green manuaring and weed control measure on phosphate solubilizers, microbial biomass carbon and basal soil respiration in rice – groundnut cropping system during Kharif season.
Treatments
Phosphate solubilisers CFU (10-3)
Microbial biomass carbon ( µg/gm soil)
Basal soil respiration ( µg CO2/100 gm soil)
30 DAS
50 DAS
Harvest 30
DAS 50
DAS Harvest
30 DAS
50 DAS
Harvest
Main plot treatment : Green manuaring
M1: Green manuaring
27.87 23.57 20.78 234.74 220.29 210.48 238.74 227.54 208.63
M2: without green manuaring
19.38 18.74 15.55 199.32 204.70 192.71 209.22 205.51 194.78
Sem ± 0.37 0.22 0.40 1.67 1.04 0.11 2.07 0.20 0.69
LSD (P=0.05) 2.25 1.34 2.43 10.17 6.36 0.68 12.60 1.20 4.19
Sub plot: Weed control measures
T1:Fix herbicide – Pendimethalin(PE)
21.37 19.11 16.28 210.42 206.71 197.21 215.03 209.50 196.22
T2: Rotational herbicide – Alachlor
21.29 19.29 16.45 208.67 204.63 195.03 216.06 209.37 196.46
T3: Weed free check
28.14 26.11 22.54 230.49 225.96 213.08 238.36 231.36 212.05
T4: Weedy check 23.71 20.12 17.41 218.54 212.68 201.08 226.46 215.89 202.09
Sem ± 0.87 0.98 0.98 1.59 3.16 3.23 3.26 2.31 1.95
LSD (P=0.05) 2.67 3.00 3.01 4.90 9.73 9.96 10.05 7.12 6.00
Interaction effects
Sem ± 1.23 1.38 1.38 2.25 4.47 4.57 4.61 3.27 2.75
LSD (P=0.05) NS NS NS NS NS NS NS NS NS

45
Table WS 3.7.14:- Combined effects of green manuaring and weed control measures on soil bacterial, fungal population and nitrogen fixers in rice-groundnut cropping system during rabi season
a) Effect of green manuaring:-
Data presented in Table 15 and 16 revealed that the population of all soil microbes were influenced significantly due to green manuaring as compared to without green manuaring. They recorded significantly higher population in green manuaring treatment as compared to the without green manuaring at 30 DAS, 50 DAS and at harvesting stage in rabi groundnut. b) Effect of weed control measure: -
The treatment of hand weeding twice caused significant increase in population of all soil microbes (viz. bacteria, nitrogen fixers, phosphate solubilizers, microbial biomass, basal soil respiration) except fungi population which were significantly superior as compared to the both fixed and rotational herbicide and remain at par with weedy check at initial stage of 30 DAS. c) Interaction effect:- The interaction effects of green manuaring and weed control measures were found to be non significant.
Treatments
Bacteria CFU (10-6) Fungi CFU (10-4) Nitrogen fixers CFU
(10-3)
30 DAS
50 DAS
Harvest 30
DAS 50
DAS Harvest
30 DAS
50 DAS
Harvest
Main plot treatment : Green manuaring
M1: Green manuring
44.72 48.49 43.57 29.10 32.18 28.84 28.01 30.99 26.57
M2: without green manuring
38.87 42.16 36.54 25.09 28.41 21.64 23.56 26.59 22.53
Sem ± 0.25 0.25 0.24 0.46 0.25 0.41 0.41 0.55 0.34
LSD (P=0.05) 1.50 1.53 1.44 2.80 1.53 2.49 2.51 3.35 2.08
Sub plot: Weed control measures
T1:Fix herbicide – Pendimethalin(PE)
39.57 42.94 37.57 25.19 28.77 23.97 23.89 27.53 22.54
T2: Rotational herbicide – Alachlor
39.56 43.40 37.99 26.35 29.97 23.91 25.11 28.07 23.41
T3: Weed free check
45.88 49.09 43.91 29.03 32.15 27.02 28.06 30.98 27.00
T4: Weedy check 42.19 45.87 40.75 27.81 30.29 26.07 26.08 28.59 25.25
Sem ± 1.19 1.85 1.76 1.24 1.43 1.06 0.69 0.81 0.64
LSD (P=0.05) 3.67 NS NS NS NS NS 2.13 NS NS
Interaction effects
Sem ± 1.68 2.62 2.49 1.75 2.02 1.55 0.98 1.14 0.91
LSD (P=0.05) NS NS NS NS NS NS NS NS NS

46
Table WS 3.7.15:- Combined effects of green manuring and weed control measures on Phosphate solubilisers, Microbial biomass carbon and Basal soil respiration in rice-groundnut cropping system during rabi season.
a) Effect of Green manuaring: -
The pooled data (Table 17) revealed that the dry weight of nodules gm/plant of groundnut crop was not significantly influenced by green manuaring as compared to the without green manuaring at 50DAS. While the number of nodules per plant at 50 DAS was significantly influenced by green manuaring (24.88) as compared to without green manuaring. The significantly higher number of nodules (24.88) found in green manuaring as compared to the without green manuaring (17.85). b) Effect of weed control measures:-
The dry wt. of nodule and number of nodules per plant of groundnut did not influenced significantly due to various weed control measures tried at 50DAS. c) Interaction effect:-
The interaction effects of green manuaring treatment and weed control measures were found to be non significant.
Treatments
Phosphate solubilisers CFU (10-3)
Microbial biomass carbon ( µg/gm soil)
Basal soil respiration ( µg CO2/100 gm soil)
30 DAS
50 DAS
Harvest 30
DAS 50
DAS Harvest
30 DAS
50 DAS
Harvest
Main plot treatment : Green manuring
M1: Green manuring
27.91 29.94 26.58 245.37 265.05 244.67 236.55 259.43 238.84
M2: without green manuring
23.87 26.29 21.78 219.38 244.23 222.69 215.99 231.93 218.25
Sem ± 0.20 0.44 0.37 2.39 1.99 2.88 0.90 3.02 2.29
LSD (P=0.05) 1.23 2.69 2.24 14.56 12.12 17.54 5.49 18.37 13.95
Sub plot: Weed control measures
T1:Fix herbicide – Pendimethalin(PE)
24.17 26.52 22.64 222.46 247.66 228.10 219.52 240.52 223.80
T2: Rotational herbicide – Alachlor
24.70 27.42 22.98 224.42 251.54 229.23 221.60 241.30 224.61
T3: Weed free check
28.32 30.37 26.87 248.00 263.00 242.29 236.45 253.67 236.53
T4: Weedy check 26.38 28.14 24.23 234.62 256.36 235.12 227.51 247.23 229.23
Sem ± 0.86 0.84 0.81 2.81 4.35 3.14 2.51 2.05 2.38
LSD (P=0.05) 2.66 NS NS 8.65 NS NS 7.74 NS NS
Interaction effects
Sem ± 1.22 1.18 1.15 3.97 6.15 4.44 3.55 2.90 3.36
LSD (P=0.05) NS NS NS NS NS NS NS NS NS

47
Table WS 3.7.16:- Combined effects of green manuaring and weed control measure on number of nodule/plant (No.) and dry weight of nodule ( gm/plant ) at 50 DAT of groundnut crop. in rice –groundnut cropping system during rabi season (pooled mean) Summary
In case of Kharif rice and rabi groundnut, the total bacterial population, free living nitrogen fixers, phosphate solubilizers ,microbial biomass carbon and basal soil respiration in soil were significantly influenced by weed control measures at 30DAS. They were found significantly less in fixed herbicide, rotational herbicide as compared to the weed free treatment. The bacterial population, free living nitrogen fixers and phosphate solubilizers were at par with weedy check treatment at 30DAS.The fungal population was found to be non-significant at all the stages of the crop. Whereas the other microbial parameters were found to be non-significant at 50DAS and at harvesting stages of the crop. Conclusion
The green manuaring treatment stimulate significantly higher microbial population due to more availability of nutrient as compared to the without green manuaring treatment in both the crops. The microbial population were not badly affected by herbicides during all the stages of the groundnut crop during rabi season. The all microbial population and the associated parameters initially suppressed due to toxic effect of herbicides at initial stage (30DAT) in rice crop during Kharif season.
Table WS 3.7.17: Effects of green manuring and weed control measures on economics of rice-groundnut cropping system.
Treatment combination
Total REY of system q/ha
Gross Return (Rs/ha)
Cost of cultivation
(Rs/ha)
Net Returns (Rs/ha)
B:C Ratio
M1T1 186.76 280140 148980 131160 1.88
M1T2 175.73 263595 150110 113485 1.76
M1T3 195.09 292635 165100 127535 1.77
M1T4 156.16 234240 143100 91140 1.64
M2T1 169.63 254445 148180 106265 1.72
M2T2 163.30 244950 149310 95640 1.64
M2T3 193.62 290430 164300 126130 1.77
M2T4 140.05 210075 142300 67775 1.48
Sealing rate per quintal: 1) Rice : 1500/- 2) Paddy straw : 200/- 3) Gr.nut Pod : 6000/- 4)Haulm : 200/-
Treatments Dry wt of nodule ( gm/plant ) at 50
DAS Number of nodule/plant (No.) at 50
DAS (2011) (2012) (2013) (2014) (Pooled) (2011) (2012) (2013) (2014) (Pooled)
Main plot treatment : Green manuring
M1: Green manuring
0.07 0.07 0.08 0.08 0.07 25.67 22.83 24.83 26.17 24.88
M2: without green manuring
0.06 0.06 0.07 0.06 0.06 18.92 17.75 18.92 15.83 17.85
Sem ± NS 0.01 0.01 0.01 0.00 2.58 1.09 0.68 1.03 0.66
LSD (P=0.05) 0.04 NS NS NS NS NS NS 4.13 6.25 3.99
Sub plot: Weed control measures
T1:Fix herbicide – Pendimethalin(PE)
0.06 0.06 0.06 0.06 0.06 20.00 16.33 18.83 18.33 18.38
T2: Rotational herbicide – Alachlor
0.06 0.07 0.07 0.07 0.07 19.83 18.83 20.67 20.17 19.88
T3: Weed free check
0.08 0.08 0.08 0.08 0.08 26.33 25.50 26.00 23.83 25.42
T4: Weedy check 0.06 0.07 0.08 0.07 0.07 23.00 20.50 22.00 21.67 21.79
Sem ± 0.01 0.01 0.01 0.01 0.00 2.42 2.08 2.48 2.05 1.59
LSD (P=0.05) NS NS NS NS NS NS NS NS NS NS
Interaction effects
Sem ± 0.01 0.01 0.02 0.01 0.01 3.42 2.95 3.51 2.90 2.25
LSD (P=0.05) NS NS NS NS NS NS NS NS NS NS

48
Economics of different treatment combination:- The data presented in Table 17 revealed that the economics of the different treatment combinations, M1T1 (Green manuring to Kharif rice and application of fixed herbicide) recorded higher net returns (Rs. 1,31,160) with B:C ratio 1.88 followed by M1T3 (Green manuring to Kharif rice and weed free check) treatment combination with net returns of Rs. 1,27,535/- and B:C ratio 1.77. Conclusion:-
From four years study it can be concluded that, incorporation of Green manures and application of fixed herbicide pretilachlor for kharif rice and pendimethalin for rabi groundnut reduced weed growth with increase in total REY (186.76 q/ha) of the rice groundnut cropping system under Konkan region of Maharashtra . Recommendation: In the Konkan region, of Maharashtra for obtaining higher yield, net returns and effective weed control in the rice- groundnut cropping system, incorporation of green manure (Sesbania rostrata) and application of fixed herbicide pretilachlor (PE) 0.75 kg/ha 3 to 7 DAT to kharif rice and pendimethalin (PE) 1.00 kg/ha 2 to 3 DAS to groundnut be recommended. f'kQkjl%
egkjk”VªkP;k dksd.k foHkkxkrhy Hkkr&HkqbZeqx ihd i/n~rhe/khy
r.kkaP;k izHkkoh fu;a=.k vkf.k vkf/kd mRiknu o uQk feGo.;klkBh [kjhi
gaxkeke/;s fgjoGhps ¼lslckuh;k jksLVªkVk½ ihd fp[kyuhP;k osGh tehuhr
xkMwu Hkkr ykxoMh uarj izsVhY;kDyksj 0-75 fd-xzW-@gs- 3 rs 7 fnolkauh
HkkrklkBh vkf.k isaMhfeFkWyhu ¼mxo.khiqoZ½ 1-00 fd-xzW-@gs- jCch
HkqbZeqxklkBh okijkos-

49
W.S. 4:- Management of problematic weeds
WS 4.3 Project :- Biological control of water hyacinth by Neochetina bruchi Objective :- To find out effect of Neochetina bruchito control the water hyacinth. Methodology :- :-
A field experiment was conducted in a pond which is recently infested with water hyacinth in patches. The insect Neochetina bruchi has been released on 7th August 2015. However, so far no population of Neochetina bruchihas been buildup and no any symptoms appeared to distruct the water hyacinth by same insects. Hence it was not possible to record any of observations as per suggestion. Therefore fresh demand of Neochetina bruchi will be made in future in a favorable conditions for its multiplication during ensuing monsoon season

50
WS. 6.1:- On farm research & impact assessment
WS.6.1.a Kharif 2015-16: Weed control in Kahrif Rice with pre – emergence application of Oxadiargyl.
Item Farmer – I Farmer – 2 Farmer – 3 Farmer – 4
Name of the farmer Mr. Ganpat S. Matal
Mr. Jysingrao Salunkhe
Shri. Dipak Ramesh Gopale
Shri. Suresh Sitaram
Dhabholkar
Location of OFT Poonas, Tal. Lanja,
Dist. Ratnagiri
Kolre, Tal. Lanja, Dist. Ratnagiri
Gawaliwadi, Tal. Lanja, Dist. Ratnagiri
Gawane, Tal. Lanja, Dist. Ratnagiri
Area of the land (ha) 0.1 0.1 0.1 0.1
Irrigated/rainfed Rainfed Rainfed Rainfed Rainfed
Cropping system Rice-Field bean Rice-Field bean Rice - Groundnut
Rice – Groundnut
Soil type Lateritic Lateritic Lateritic Lateritic
Transplanting time July July July July
Crop and variety Ratnagiri-1 Ratnagiri-1 Ratnagiri-12 Ratnagiri-12
Fertilizer applied Recommended Recommended Recommended Recommended
Harvesting time October October October October
Perticular
Observation on weeds
(No./0.25m2)
Oxadiargyl 80 [email protected]/ha
39 44 37 35
Hand weeding 43 47 39 36
Weedy check 78 87 81 68
Yield of grain and
Straw (q/ha)
Oxadiargyl 80 [email protected]/ha
28.50 + 35.60 29.40 + 35.45 28.90 + 36.00 28.40 + 34.20
Hand weeding 31.70 + 36.20 31.20 + 34.60 32.10 + 37.50 31.30 + 35.50
Weedy check 19.50 + 25.90 19.20 + 23.70 20.60 + 24.70 21.10 + 23.80
Gross returns
Oxadiargyl 80 [email protected]/ha 49870 51190 50550 49440
Hand weeding 54040 53720 55650 54050
Weedy check 33980 33540 35840 36410
Cost of cultivation
Oxadiargyl 80 [email protected]/ha
48000 48000 48000 48000
Hand weeding 53400 53400 53400 53400
Weedy check 38000 38000 38000 38000
Net returns Oxadiargyl 80 [email protected]/ha 1870.00 3190.00 2550.00 1440.00
Hand weeding 640.00 320.00 2250.00 650.00
Weedy check -4020.00 -4460.00 -2160.00 -1590.00
B:C Ratio Oxadiargyl 80 [email protected]/ha 1.01 1.07 1.05 1.03
Hand weeding 1.00 1.01 1.04 1.01
Weedy check 0.93 0.88 0.94 0.96

51
WS.6.1.b Kharif 2015-16: Weed control in Kahrif Groundnut with pre – emergence application of Pendimethalin.
Item Farmer – I Farmer – 2 Farmer – 3 Farmer – 4
Name of the farmer Mr. Vikas Sonu Mandavkar
Mr. Dinkar Sakharam Mandavkar
Mr. Hari Shankar Sapre
Mr. Dilip Ganpat Narkar
Location of OFT Asage, Tal. Lanja,
Dist. Ratnagiri
Asage, Tal. Lanja, Dist. Ratnagiri
At. / Tal. Lanja,
Dist. Ratnagiri
Asage, Tal. Lanja, Dist. Ratnagiri
Area of the land (ha) 0.15 0.15 0.15 0.15
Irrigated/rainfed Rainfed Rainfed Rainfed Rainfed
Cropping system Groundnut – Vegetables
Groundnut - Vegetables
Groundnut - Vegetables
Groundnut – Vegetables
Soil type Lateritic Lateritic Lateritic Lateritic
Sowing time June June June June
Crop and variety Konkan Tapora
Konkan Tapora
Konkan Gaurav
Konkan Gaurav
Fertilizer applied Recommended
Recommended Recommended
Recommended
Harvesting time October October October October
Perticular
Observation on weeds (No./0.25m2
)
Pendimethalin [email protected] kg/ha PE
35 41 29 37
Hand weeding 47 49 33 41
Weedy check 137 143 119 123
Yield of pod and haulm (q/ha)
Pendimethalin [email protected] kg/ha PE
21.74 + 26.57 20.19 + 23.45 22.48 + 26.88 21.23 + 25.44
Hand weeding 19.80 + 21.22 18.85 + 22.23 20.78 + 22.87 20.11 + 22.78
Weedy check 12.45 + 14.20 11.87 + 13.49 13.28 + 15.56 12.43 + 14.88
Gross returns
Pendimethalin [email protected] kg/ha PE 135754 125830 140256 132468 Hand weeding 123044 117546 129254 125216 Weedy check 77540 73918 82792 77556
Cost of cultivation
Pendimethalin [email protected] kg/ha PE
79,000/- 79000/- 79000/- 79,000/-
Hand weeding 85000 85000 85000 85000
Weedy check 65500 65500 65500 65500
Net returns Pendimethalin [email protected] kg/ha PE 56754.00 46830.00 61256.00 53468.00 Hand weeding 38044.00 32546.00 44254.00 40216.00 Weedy check 12040.00 8418.00 17292.00 12056.00
B:C Ratio Pendimethalin [email protected] kg/ha PE 1.72 1.59 1.78 1.68 Hand weeding 1.45 1.38 1.52 1.47 Weedy check 1.18 1.13 1.26 1.18

52
WS 6.2.1.a: Front Line Demonstration (FLD) on Rice
Item Farmer – I Farmer – 2 Farmer – 3 Farmer – 4
Name of the farmer Vikas Janardan Bamugade
Prataprao Deshmukh
Mangesh Daji Sonawane
Tukaram Shankar Deshmukh
Location of FLD Killa Tal. Roha Dist. Raigad
Shenavali Tal. Roha Dist. Raigad
Indapur Tal. Mangaon Dist. Raigad
Nadgaon Tal. Mahad Dist. Raigad
Area of the land (ha) 0.2 0.2 0.2 0.2
Irrigated/rainfed Rainfed Rainfed Rainfed Rainfed
Cropping system Rice-Field bean
Rice-Field bean
Rice - Groundnut
Rice – Groundnut
Soil type Lateritic Lateritic Lateritic Lateritic
Transplanting time July July July July
Crop and variety Ratnagiri-1 Ratnagiri-1 Karjat - 7 Karjat – 7
Fertilizer applied Recommended Recommended Recommended Recommended
Harvesting time October October October October
Perticular
Observation on weeds (No./m2)
Oxadiargyl 80 [email protected]/ha
39 44 37 35
Hand weeding 43 47 39 36
Weedy check 78 87 81 68
Yield of grain and Stover (q/ha)
Oxadiargyl 80 [email protected]/ha
30.50 + 37.60 29.40 + 35.45 33.90 + 40.00 35.40 + 42.20
Hand weeding 31.70 + 36.20 31.20 + 34.60 32.10 + 37.50 34.30 + 37.50
Weedy check 19.50 + 25.90 19.20 + 23.70 22.60 + 26.70 24.10 + 26.80
Gross returns
Oxadiargyl 80 [email protected]/ha 53270 51190 58850 61540 Hand weeding 54790 53720 55650 58950 Weedy check 34430 33540 39240 41510
Cost of cultivation
Oxadiargyl 80 [email protected]/ha
48000 48000 48000 48000
Hand weeding 53400 53400 53400 53400
Weedy check 38000 38000 38000 38000
Net returns Oxadiargyl 80 [email protected]/ha 5270.00 3190.00 10850.00 13540.00 Hand weeding 1390.00 320.00 2250.00 5550.00 Weedy check -3570.00 -4460.00 1240.00 3510.00
B:C Ratio Oxadiargyl 80 [email protected]/ha 1.11 1.07 1.23 1.28 Hand weeding 1.03 1.01 1.04 1.10 Weedy check 0.91 0.88 1.03 1.09

53
WS 6.2.1.b: Front Line Demonstration (FLD) on Rice and Grounnut at Awashi
Item Farmer – I Farmer – 2 Farmer – 3 Farmer – 4
Name of the farmer
Location of FLD
Area of the land (ha) 0.2 0.2 0.2 0.2
Irrigated/rainfed Rainfed Rainfed Rainfed Rainfed
Cropping system Rice-Field bean
Rice-Field bean
Rice - Groundnut
Rice – Groundnut
Soil type Lateritic Lateritic Lateritic Lateritic
Transplanting time July July June June
Crop and variety Karjat – 7 Karjat – 7 Konkan Tapora
Konkan Tapora
Fertilizer applied Recommended Recommended Recommended Recommended
Harvesting time October October October October
Perticular Oxadiargyl 80 [email protected]/ha Pendimethalin [email protected] kg/ha PE
Observation on weeds (No./m2)
Hebicide 35 37 33 42
Hand weeding 39 43 44 51
Weedy check 88 76 132 138
Yield of grain and Stover (q/ha)
Hebicide 34.90 + 41.00 36.40 + 43.50 22.78 + 27.67 21.29 + 25.65
Hand weeding 33.20 + 36.40 35.20 + 37.90 20.80 + 22.29 19.85 + 23.29
Weedy check 23.40 + 27.60 25.10 + 28.30 13.55 + 16.20 12.89 + 15.59
Gross returns
Hebicide 60550 63300 142214 132870 Hand weeding 57080 60380 129258 123758 Weedy check 40620 43310 84540 80458
Cost of cultivation
Hebicide 48000 48000 79000 79000
Hand weeding 53400 53400 85000 85000
Weedy check 38000 38000 65500 65500
Net returns Hebicide 12550.00 15300.00 63214.00 53870.00 Hand weeding 3680.00 6980.00 44258.00 38758.00 Weedy check 2620.00 5310.00 19040.00 14958.00
B:C Ratio Hebicide 1.26 1.32 1.80 1.68 Hand weeding 1.07 1.13 1.52 1.46 Weedy check 1.07 1.14 1.29 1.23

54
VII. TSP Programme
Tribal Sub Plan Programme The Tribal Sub-Plan programme was implemented in two villages in Sakri Tahsil of Dhule district in Maharashtra by selecting 120 farmers beneficiaries. The awareness programme regarding the use of pre-emergence and post-emergence herbicides, along with application, time of application, calibration of sprayer, maintenance of spraypumps etc. was conducted. As a part of weed management in different crops the demonstrations with the use of different hand tools, implements like weeders, weeding hooks, toothed spades and spray pumps were organized on farm. Along with farmers beneficiaries Gramsevak and Sarpanch and progressive farmers from village Rohod and Tembhe Pawasi in Sakri tahasils were actively participated in the programme. In all about 250 farmers farm two villages were participated for one day awareness programme on weed management. Implements, hand tools and herbicides are distributed to the tribal farmers in Sakri Tashil of Dhule district in Maharashtra as follows-
Sr. No.
Particular Total Number
1. Weeder 40
2. Toothed spade 240
3. Weeding hook 360
4. Spray pump 30
5. Herbicides- Oxadiargyl, Oxyflurfen and pendamethalin
Oxadiargyl- 60 packets of 22.00 gm. Each, Oxyflurfen 10 - lits and pendamethalin – 20 lits
VIII. List of publications(research, abstract of seminar/symposia/conference, technical/extension bulletin, popular articles, books/books chapter, radio/TV talks etc. A. List of Research publications
Sr. No Title ofResearch Article
1.
A.V. Dahiphale*, S.B. Bhagat, S.B. Gangawane, P.S. Shinde, Y.R. Govekar and U.V. Mahadkar (2015) Effect of post-emergence herbicide on yield and yield contributing character of transplanted rice in north Konkan region. 25 th Asian-Pacific Weed Science Society Conference on “Weed Science for Sustainable Agriculture, Environment and Biodiversity”, Hyderabad, India during 13-16 October, 2015. Page- 56
2.
U.V. Mahadkar, A.V. Dahiphale, S.B. Gangawane*, P.S. Shinde and V.M. Kanade (2015) Effect of method of sowing and weed control on the performance direct-seeded rice in Konkan region. 25 th Asian-Pacific Weed Science Society Conference on “Weed Science for Sustainable Agriculture, Environment and Biodiversity”, Hyderabad, India during 13-16 October, 2015. Page- 57
3.
(2015) Effect of weed control on growth and yield of upland drilled rice under the lateritic condition of Konkan. 25 th Asian-Pacific Weed Science Society Conference on “Weed Science for Sustainable Agriculture, Environment and Biodiversity”, Hyderabad, India during 13-16 October, 2015. Page-58
4.
S.S. Pinjari*, P.P. Pawar, P.S. Bodake and S.C. Wadile (2015) Efficacy of herbicides on quality, yield and economics of sweet corn. 25 th Asian-Pacific Weed Science Society Conference on “Weed Science for Sustainable Agriculture, Environment and Biodiversity”, Hyderabad, India during 13-16 October, 2015. Page - 271
5.
S.B. Gangawane*, M.S. Jadhav, A.V. Dahiphale, S.B. Bhagat, V.A. Rajemahadik and U.V. Mahadkar (2015) Effect of integrated weed management in spring-planted sugarcane under Konkan condition. 25 th Asian-Pacific Weed Science Society Conference on “Weed Science for Sustainable Agriculture, Environment and Biodiversity”, Hyderabad, India during 13-16 October, 2015. Page – 299
6. Y.R. Govekar, U.V. Mahadkar, A.V. Dahiphale, L.G. Pawar, V.B. Nevase, M.J. Mane and S.P. Gosavi (2015) Long term effect of diiferent tillage systems and herbicides on soil microflora of ricerhizosphere. Pestology journal page - 19

55
B. Participation in Conference, Seminar, workshop etc. Sr. No Nature of programme Name of the scientist
1. 25th Asian – Pacific weed science society conference held at Hyderabad 13 – 18 October 2015
S.B. Gangawane, S.S. Pinjari
2. National symposium – Dapoli chapter of Indian society of soil science
S.B. Gangawane
3. Workshop :- Extension education institute, Anand Agri. University
S.B. Gangawane
IX. List of trainings/awareness campaign Sr. No Title Name of the scientist
1.
Awareness programme on weed management, with the use of implements/equipments and herbicides along with demonstrations, organized under Tribal Sub Plan in two villages in Sakari Tahsil of Dhule district of Maharashtra
S.B. Gangawane, S.S. Pinjari
X. Awards/recognitions/students guided/courses taught A. courses taught
Sr. No Course No. & Title of course Name of the scientist
1. Agro.4712 – RAWE S.B. Gangawane
2. H/Agro.243- Organic Farming S.B. Gangawane
3. Agro.247- Field Crops II (Rabi crops) S.B. Gangawane
4. PGS.505 – Agricultural research ethics and rural development S.B. Gangawane
5. Agro.512- Dryland farming and watershed management S.B. Gangawane
6. Agro.113- Introductory Agriculture S.B. Gangawane
7. Agron.602- Crop Ecology S.B. Gangawane
8. Agron.608 – soil conservation and watershed management S.B. Gangawane
9. Agro.235 - Field Crops I (Khaif crops) S.S. Pinjari
10. Agro.247- Field Crops II (Rabi crops) S.S. Pinjari
b. PG students guided/guiding as Major Advisor
Class No. of students Name of teacher
M sc 3 S.B. Gangawane
XI. Linkages and collaboration:- Nil XII. Miscellaneous Sr. No Activity Name of the scientist
1. Worked as evaluator and moderator for different undergraduate courses in Agronomy.
S.B. Gangawane
2. Worked as a pepper setter for semester end theory examination in different courses.
S.B. Gangawane, S.S.Pinjari
3. Sr. Supervision- All 5 colleges of Sangulwdi S.S.Pinjari

56
Action taken on Recommendations & suggestions made in ARM meeting held on 17th-18th October, 2015
Sr. No. Recommendations and suggestions made
Action taken
1.
Generation of quality research data from different
experiments
For generation of quality research data, all necessary efforts have been taken by this center and accordingly it will be presented in the forth coming meeting.
2. Publication of research articles on the conducted field experiment
Five research papers had been presented through poster presentation in the APWSS conference held on 13th to 16th October 2015 at Hyderabad and the research articles related with the outcoming results will be published within short time.
General comments
1. The results on Orobanche control should be reviewed and reported properly.
Not applicable.
2. The economics of conservation agriculture should also be worked out.
Noted, accordingly the economics will be drawn for the total cropping system.
3.
Basic studies on herbicide residue on microflora, chemical properties of soil etc. should be taken up and development of prediction models would help to predict the herbicide residues.
For development of prediction models on herbicides residues in predication of herbicide residues, basic studies on chemical properties of soil is already undergone by this center but the studies on herbicide residues on micro flora will be undertaken, if the laboratory facilities and post of junior microbiologist is available in the respective department.
4. Studies on effect of climate change on weed shift
should be encouraged.
Noted, climate change on weed shift within the season in crops will be observed.
5. Develop specific recommendation for weed control in aerobic rice.
Two recommendations for control of weeds in aerobic rice had been already given by this center to the farming community of Konkan region.
6. Emphasis should be given on developing weed flora maps also.
Noted, action will be taken accordingly.

57
7. Phytoremediation studies using aquatic weed should be included in the technical program.
8. Possibilities of sand mix application of herbicides in dryland areas should be explored.
Since this region is coming under heavy rainfall zone hence sand mix application of herbicide will not be suitable during kharif
9. Compatibility of different agrochemical
inputs should be studied.
Noted, accordingly it will be formulated.
10. There should be alternate option for Zygogramma for Parthenium control as it is not working effectively in many places.
Konkan being a high rainfall region there is no incidences of parthenium. If any incidence will observed in future Zygogramma will be tested.
11. Uniformity should be observed in reporting
the results. Noted.
Recommendations
1.
It was realized that specific recommendations for some individual centers and most of the general recommendations made in the earlier review meetings in 2012, 2013 and 2014 have not been fully acted upon. Therefore, all such points should be duly considered and a convincing ATR should be presented in the next meeting in 2016.
Noted,
2.
Publication record of most centers has not shown any improvement over the last 5 years despite repeated emphasis and recommendations by the QRT. This issue will also be thoroughly discussed in the next meeting.
In last five years two articles and twenty popular articles published by this center
3.
Long-term trials on tillage and herbicides have been conducted for 15-20 years or even more at some centres, which have yielded a vast volume of data. An article on each experiment as per the guidelines should be prepared by each centre and submitted by 31stDecember, 2015.
Submitted two articles on long term experiments to the council dated on 31st December 2015 from this center.
4.
An article on herbicide residues data generated over the years has been submitted by most centers but it is not in the required format / shape. A thoroughly revised version should be submitted by 15 November, 2015 so that this publication can be released at the next ARM in April, 2016.
Residue Chemist is not available at this center therefore studies on herbicide residues were not carried out.

58
5.
Long-term experiments which have been conducted for more than 10 years should be terminated. Based on the information generated, new experiments should be proposed and presented at the next meeting. Such experiments should include the latest available herbicide molecules / mixtures for a given crop / situation.
Noted. Accordingly the experiment will be proposed and presented in next ARM.
6.
Data recording, analysis and presentation needs considerable improvement. PIs should check / verify the data carefully and should be clear about the reported results.
Noted, accordingly it will be presented.
7.
Annual report must be presented as per the guidelines uniformly. Nodal officers should go through the reports critically and present their observations in the meeting.
Noted
8.
A farm pond infested with aquatic weeds like water hyacinth should be selected in the city or in the village, and a success story on weed eradication should be developed and widely publicized. Similarly, Parthenium eradication programme must be undertaken in the campus. Such centers showing visible impact of weed control technology will be suitably recognized at the ARM and provided additional grants for infrastructure development.
A field experiment was conducted in a pond which was infested with water hyacinth in patches. The insect Necochetina bruchi was released on it. However, no population of Neochetina burchi has buildup and no any symptoms appeared to distruct the water hyacinth. Similarly in future the water hyacinth infested ponds in cities or villages will be selected for eradication programme.
9.
An exercise should be initiated by each centre from now onwards to plan the Technical Programme for the next biennium 2015-16 and 2016-17). This should be based on the results obtained previously, resources / manpower available, collaboration with other AICRPs, emerging weed problems and farm-oriented problem-solving research. Emphasis should be on fewer experiments but on generation of quality data with visible outputs.
Noted, accordingly it will be followed.
10.
Economic analysis has still not been standardized despite development of a common protocol. Dr. P.K. Singh and Dr. Yogita Gharde should develop an MS EXCEL sheet for economic analysis, which must be uniformly followed by all centres from the current year. Dr. Yogita Gharde will finalize the Information System for data acquisition/ analysis of the AICRP trials before the next meeting.
Not applicable
11.
Work on herbicide residues is missing from most presentations. This should be adequately highlighted during discussion / presentation, annual report as well as in publications.
Junior residue chemist and laboratory facilities are not available with this center.

59
12.
Studies on herbicide residues must be conducted in high-value crops, vegetables, spices and fodder crops; and must specify the soil depth, moisture, minimum detectable limits / limit of detection.
Studies are not possible due to unavailability of residue chemist.
13.
Formulation of Alternaria alternata should be tested at all centres for the control of water hyacinth. Shelf-life of the product should be tested.
Efforts will be made for testing of Alternaria alternata
14.
Studies on weed management in organic farming may be conducted at the centers located in hilly regions such as Jammu & Kashmir, Himachal Pradesh and Uttarakhand. Extract of weeds/plants can be used to control weeds.
Not applicable.
15
Technology on Orobanche management developed at HAU centre should be demonstrated on a large scale at all other centres including Gwalior, Udaipur and others, for which additional funding support can be provided from the HQ.
Not applicable.
16.
Directorate will process the specific cases received from the centers, which are related to herbicide recommendations not included in the label claim, and submit to the DPPQS /CIRBC for consideration.
In the experimentation studies this center uses only lable claimed herbicides.
17.
Center which still do not have adequate facilities for estimation of herbicide residues can continue with herbicide/enzyme bioassay studies to generate practical information on residual effect of herbicides.
Adequate facilities for estimation of herbicide residue are not available with this center
18.
Preliminary studies on weed biology / ecology for which the results are well established need not be conducted. It is essential that only meaningful studies on problem weeds of the area are conducted on a scientific basis.
Noted, accordingly it will be followed.
19.
Some centers have not shown any progress in herbicide residue research over the last many years despite the availability of good facilities and posting of a residue chemist. The post of residue chemist will be withdrawn from such centers.
There is no sanction post of residue chemist in this center, which should be immediately sanction for conducting indepth studies on this aspect.
20.
TSP funds still left unutilized at some of the centers should be spent only for the specified purpose in the identified districts, preferably for development of permanent assets in the area. No revalidation of such funds is required from the HQ.
Noted.
21.
Work on crop modelling should be taken up at centers which have the requisite expertise, e.g. Hyderabad under the guidance of Dr. D. Raji Reddy, Director of Research and an expert in this field.
Not applicable.
22.
Fund availability in the AICRP has been curtailed by the ICAR in the XII Plan, but the better performing centers will be given special consideration under resource constraints.
Not applicable

60
23
Centers graded as „Average‟ and „Below average‟ must improve their performance as per the criteria / guidelines issued earlier, failing which the QRT may recommend closure / shifting of these centers in the next plan as done during this plan.
The efforts will be made to improve the performance of this center in future.
24
Project proposals for external funding in the identified priority area like herbicide residues, aquatic weeds, conservation agriculture, climate change should be submitted by the centres for funding under the NICRA, NASF, Extra-Mural programme of the ICAR and others.
Noted, accordingly it will be followed.
25
It should be attempted not to hold the ARM and the ISWS Conference together, rather these should be held in the early and later part the given year, respectively. The next ARM will be held at the Jain Irrigation Systems, Jalgaon or at AAU, Jorhat during April, 2016.
Not applicable

61
Weekly Weather Data Dapoli Centere Year 2015
Period MW Tmax Tmin RH-I RH-II
Wind speed
Rain RD BSS Epan
(oC) (oC) (%) (%) (Kmph) (mm) day (hrs.) (mm)
01.01 - 07.01 1 29.1 15.0 84 51 2.6 0.0 0 6.6 3.1
08.01 - 14.01 2 30.4 9.6 83 44 2.6 0.0 0 8.3 4.1
15.01 - 21.01 3 30.5 11.7 87 55 2.5 0.0 0 7.9 3.9
22.01 - 28.01 4 29.4 14.5 90 66 3.4 0.0 0 8.0 4.2
29.01 - 04.02 5 32.4 14.1 89 52 3.1 0.0 0 7.9 4.1
05.02 - 11.02 6 32.0 12.7 91 41 3.1 0.0 0 8.1 4.4
12.02 - 18.02 7 33.0 12.0 87 44 3.2 0.0 0 8.6 4.2
19.02 - 25.02 8 33.4 14.0 88 43 3.3 0.0 0 8.8 5.0
26.02 - 04.03 9 28.8 14.5 90 64 4.5 60.4 2 6.7 4.7
05.03 - 11.03 10 31.4 15.1 87 58 4.0 0.0 0 8.5 4.9
12.03 - 18.03 11 33.2 17.8 85 48 4.6 0.0 0 8.2 4.9
19.03 - 25.03 12 33.9 19.5 90 61 3.9 0.0 0 8.0 4.7
26.03 - 01.04 13 34.6 21.9 88 58 5.0 0.0 0 6.7 4.8
02.04 - 08.04 14 33.7 18.2 86 53 5.8 0.0 0 7.8 6.5
09.04 - 15.04 15 31.5 22.8 88 59 5.2 0.0 0 7.5 5.3
16.04 - 22.04 16 33.5 23.8 89 61 5.4 1.0 0 7.7 5.8
23.04 - 29.04 17 33.0 21.5 86 63 5.1 0.0 0 8.7 6.1
30.04 - 06.05 18 33.1 22.7 84 59 5.1 0.0 0 9.3 6.5
07.05 - 13.05 19 34.6 23.1 87 60 6.5 0.0 0 9.5 6.8
14.05 - 20.05 20 34.1 24.8 85 58 5.3 0.2 0 7.1 5.5
21.05 - 27.05 21 34.0 24.2 86 59 6.2 0.0 0 9.3 6.5
28.05 - 03.06 22 33.8 24.9 86 56 6.0 0.0 0 6.6 6.6
04.06 - 10.06 23 34.3 23.9 82 60 7.9 22.0 2 7.5 5.3
11.06 - 17.06 24 29.5 23.2 92 84 5.4 190.4 6 3.2 2.7
18.06 - 24.06 25 26.1 22.7 97 96 12.7 902.0 7 0.3 1.2
25.06 - 01.07 26 29.2 25.5 89 79 10.1 38.8 4 3.0 2.9
02.07 - 08.07 27 29.9 25.5 90 77 8.7 17.2 2 6.2 4.8
09.07 - 15.07 28 30.1 25.3 90 80 8.9 28.2 4 5.9 4.4
16.07 - 22.07 29 29.0 24.7 86 74 12.0 94.0 7 3.3 4.4
23.07 - 29.07 30 29.0 23.8 91 86 10.1 153.8 7 1.7 3.8
30.07 - 05.08 31 28.7 24.0 89 85 8.0 129.9 7 3.6 3.9
06.08 - 12.08 32 28.2 23.7 96 85 7.5 126.8 7 2.0 3.3
13.08 - 19.08 33 28.6 23.7 93 81 4.5 70.8 6 4.5 2.6
20.08 - 26.08 34 29.3 23.7 94 84 5.8 88.0 4 6.4 4.8
27.08 - 02.09 35 29.1 22.9 96 79 3.9 89.2 7 5.3 3.9
03.09 - 09.09 36 29.8 22.4 93 76 3.3 0.0 0 7.6 4.2
10.09 - 16.09 37 29.6 23.3 93 76 3.1 71.2 6 2.9 3.7
17.09 - 23.09 38 28.9 23.7 93 89 5.1 139.2 6 2.9 3.1
24.09 - 30.09 39 30.9 21.8 90 73 3.1 0.0 0 7.6 4.0
01.10 - 07.10 40 32.0 23.2 96 82 2.8 95.2 5 5.5 4.2
08.10 - 14.10 41 32.0 22.9 91 68 3.2 0.0 0 6.6 3.6
15.10 - 21.10 42 34.7 22.6 93 63 1.9 12.4 1 6.9 3.9
22.10 – 28.10 43 34.4 22.7 94 64 2.1 0.0 0 7.1 3.6

62
29.10 – 04.11 44 34.3 21.6 92 62 2.7 0.0 0 7.7 4.0
05.11 – 11.11 45 33.8 20.3 91 52 2.6 0.0 0 6.9 4.2
12.11 – 18.11 46 34.2 17.3 93 42 2.5 0.0 0 8.2 3.9
19.11 – 25.11 47 32.9 20.6 90 52 3.2 0.0 0 6.0 3.5
26.11 – 02.12 48 33.4 19.2 93.7 47.1 2.6 0.0 0.0 6.9 3.2
03.12 – 09.12 49 34.0 16.9 94 41 3.0 0.0 0 7.6 3.8
10.12 – 16.12 50 32.7 17.1 95 50 2.7 0.0 0 8.1 3.4
17.12 – 23.12 51 31.8 15.6 94 49 3.0 0.0 0 7.9 3.5
24.12 – 31.12 52 32.1 11.4 84 29 3.0 0.0 0 8.4 3.8
2330.7 90


