a peoples’ budget - urban justice center · 2017-03-02 · a peoples’ budget: a research and...
TRANSCRIPT
P B N Y
P B N CY
P B N CY
P B N CY
By the Community Development Project at the Urban Justice Center with the PBNYC Research Team
A People’s Budget:Year 2
A Research and Evaluation Report on Participatory Budgeting in New York City
Research Advisory Board
Andreas HernandezMarymount Manhattan College
Ayse YonderPratt Institute
Celina SuCity University of New York
Michelle RondaMarymount Manhattan College
Josh LernerParticipatory Budgeting Project
Rachel SwanerNew York University,Wagner School of Public Service
Ron HaydukQueens College
Santa SorianoCommunity Service Society
Report Authors
Alexa KasdanDirector of Research and Policy Community Development Project at the Urban Justice Center
Lindsay CattellResearch and Policy Associate (former)Community Development Project at the Urban Justice Center
Pat ConveyResearch and Policy AssociateCommunity Development Project at the Urban Justice Center
Acknowledgements
The authors would like to acknowledge the contributions of many people in developing this report. We’d like to thank the thousands of community residents who volunteered their time in this year’s participatory budgeting process. This report would not have been possible without their contribution to the research.
Additionally, we would like to thank the participating Council Members; Melissa Mark-Viverito, Brad Lander, Jumaane D. Williams, Eric Ulrich, Daniel Halloran, David Greenfield, Stephen Levin and Mark Weprin; their staff, particularly Alex Moore, Rachel Goodman, Michael Freedman-Schnapp, Joe Taranto, Andrew King, Ari Gershman, Rudy Guliani, Lisa Bloodgood, Ashley Thompson, Jake Adler, Stefen Ringel, Monique Waterman and Erica Goldstein.
Many thanks to members of the Research Advisory Board (see full list to the left) for their thoughtful feedback on research design, implementation and analysis. Thank you also to the committed students that helped with this project, particularly those from Queens College, Marymount Manhattan College and NYU’s Wagner school.
Thank you to all the interns and volunteers that contributed to this research, particularly Tina Mann and Fredrick (Fritz) Tucker.
Thanks to all who took time to review the report including Josh Lerner, Isaac Jabola-Carolus, Pam Jennings, Sondra Youdelman, Erin Markman and Celina Su.
Finally, thank you to MTWTF for the design of this report.
This research was made possible through the generous support of the following: New York Foundation, Scherman Foundation, New York Community Trust, Robert Sterling Clark Foundation and New York Women’s Foundation.

Table of Contents 5 Introduction 7 Background 10 Research Methodology 14 Citywide Findings 38 Conclusion 42 Participating Council Districts 52 Citywide & District Demographic Tables 61 Endnotes
3

P B N CY
The PB Steering Committee meets to discuss issues around Year 2 of the PB process.
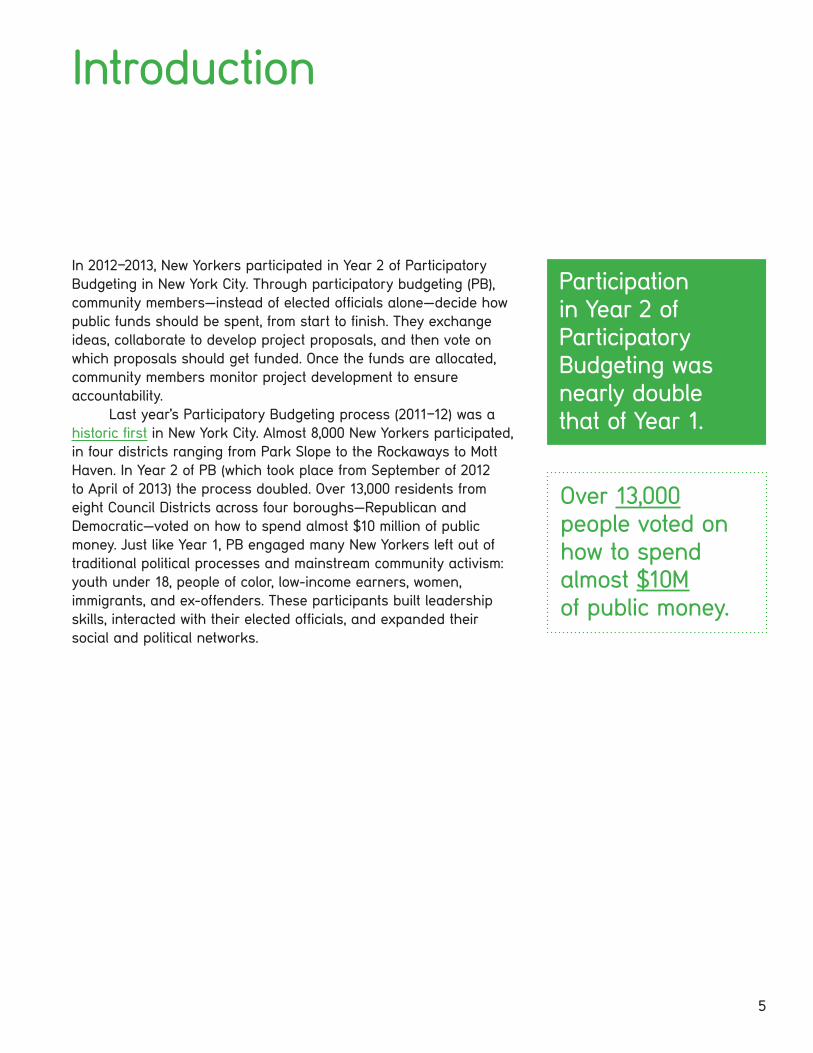
In 2012–2013, New Yorkers participated in Year 2 of Participatory Budgeting in New York City. Through participatory budgeting (PB), community members—instead of elected officials alone—decide how public funds should be spent, from start to finish. They exchange ideas, collaborate to develop project proposals, and then vote on which proposals should get funded. Once the funds are allocated, community members monitor project development to ensure accountability.
Last year’s Participatory Budgeting process (2011–12) was a historic first in New York City. Almost 8,000 New Yorkers participated, in four districts ranging from Park Slope to the Rockaways to Mott Haven. In Year 2 of PB (which took place from September of 2012 to April of 2013) the process doubled. Over 13,000 residents from eight Council Districts across four boroughs—Republican and Democratic—voted on how to spend almost $10 million of public money. Just like Year 1, PB engaged many New Yorkers left out of traditional political processes and mainstream community activism: youth under 18, people of color, low-income earners, women, immigrants, and ex-offenders. These participants built leadership skills, interacted with their elected officials, and expanded their social and political networks.
Over 13,000 people voted on how to spend almost $10M of public money.
Introduction
Participation in Year 2 of Participatory Budgeting was nearly double that of Year 1.
5

Participants brainstorm ideas for how to improve their neighborhood during a neighborhood assembly in East Harlem.
How the NYC Budget Works
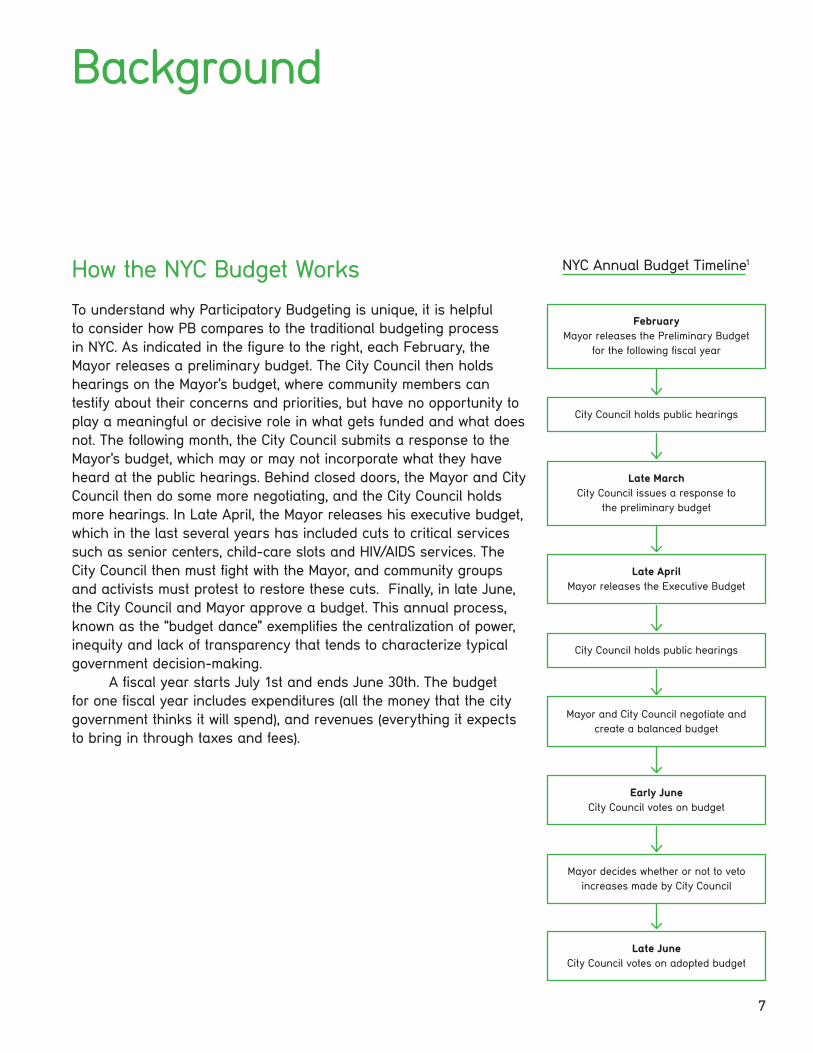
To understand why Participatory Budgeting is unique, it is helpful to consider how PB compares to the traditional budgeting process in NYC. As indicated in the figure to the right, each February, the Mayor releases a preliminary budget. The City Council then holds hearings on the Mayor’s budget, where community members can testify about their concerns and priorities, but have no opportunity to play a meaningful or decisive role in what gets funded and what does not. The following month, the City Council submits a response to the Mayor’s budget, which may or may not incorporate what they have heard at the public hearings. Behind closed doors, the Mayor and City Council then do some more negotiating, and the City Council holds more hearings. In Late April, the Mayor releases his executive budget, which in the last several years has included cuts to critical services such as senior centers, child-care slots and HIV/AIDS services. The City Council then must fight with the Mayor, and community groups and activists must protest to restore these cuts. Finally, in late June, the City Council and Mayor approve a budget. This annual process, known as the “budget dance” exemplifies the centralization of power, inequity and lack of transparency that tends to characterize typical government decision-making.
A fiscal year starts July 1st and ends June 30th. The budget for one fiscal year includes expenditures (all the money that the city government thinks it will spend), and revenues (everything it expects to bring in through taxes and fees).
February Mayor releases the Preliminary Budget
for the following fiscal year
City Council holds public hearings
Late March City Council issues a response to
the preliminary budget
Mayor and City Council negotiate and create a balanced budget
Late April Mayor releases the Executive Budget
City Council holds public hearings
Early June City Council votes on budget
Mayor decides whether or not to veto increases made by City Council
Late June City Council votes on adopted budget
NYC Annual Budget Timeline1
Background
7

How Participatory Budgeting Works
Annual PB Cycle
Neighborhood AssembliesSeptember–November
At public meetings in each district, the Council Members present information on the budget funds; residents brainstorm project ideas and select budget delegates.
1,500 people participated in 41 assemblies.
P B N CY
Delegate MeetingsNovember–March
Delegates meet in committees to transform the community’s initial project ideas into full proposals, with support from Council Member staff and other experts.
Project ExposMarch
Delegates return to the community in another round of meetings to present draft project proposals and get feedback.
VotingApril
Delegates present the final project proposals and residents vote on which projects to fund.
13,000 people voted citywide.
Evaluation, Implementation & MonitoringApril & onwards
Delegates and other participants evaluate the process, then continue to meet and oversee the implementation of projects.
Delegate OrientationsNovember
Delegates selected at the assemblies learn about the budget process, project development, and key spending areas, then form committees.
8
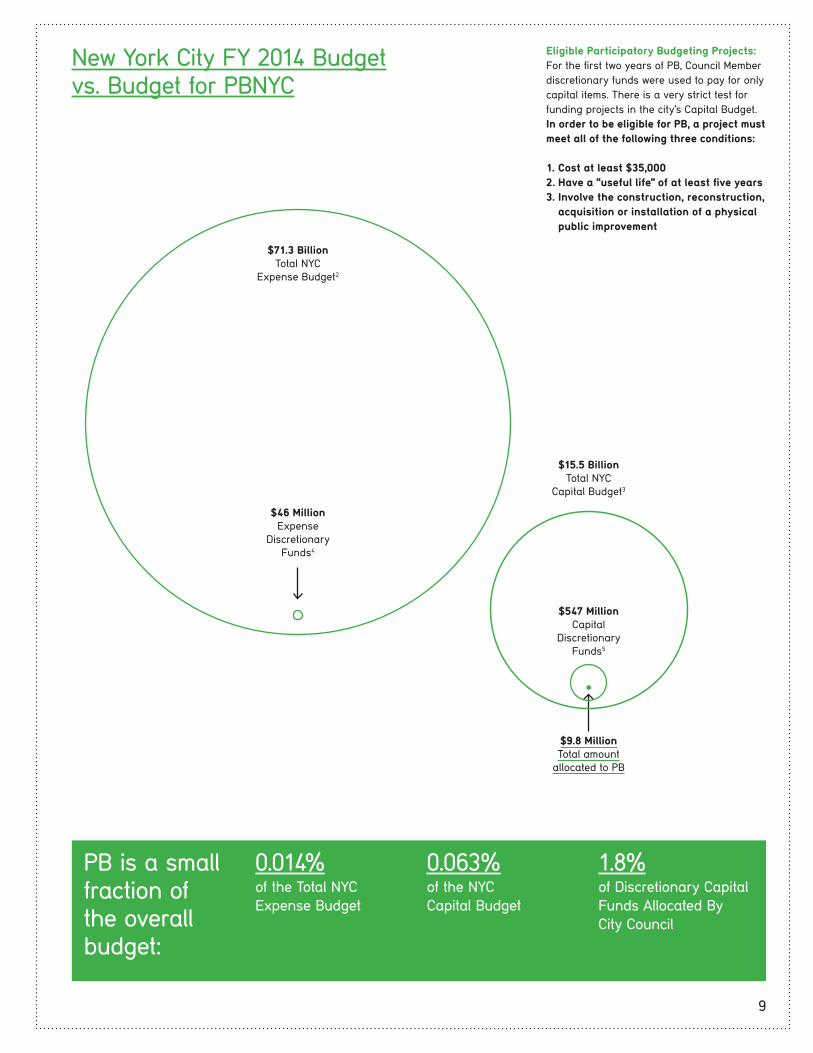
New York City FY 2014 Budgetvs. Budget for PBNYC
$547 Million Capital
Discretionary Funds5
$15.5 Billion Total NYC
Capital Budget3
$9.8 Million Total amount
allocated to PB
$71.3 Billion Total NYC
Expense Budget2
$46 Million Expense
Discretionary Funds4
PB is a small fraction of the overall budget:
0.014% of the Total NYC Expense Budget
0.063% of the NYC Capital Budget
1.8% of Discretionary CapitalFunds Allocated By City Council
Eligible Participatory Budgeting Projects:For the first two years of PB, Council Member discretionary funds were used to pay for only capital items. There is a very strict test for funding projects in the city’s Capital Budget. In order to be eligible for PB, a project must meet all of the following three conditions:
1. Cost at least $35,0002. Have a “useful life” of at least five years 3. Involve the construction, reconstruction, acquisition or installation of a physical public improvement
9

Throughout the PB Process, the PB-NYC Research Team, led by the Community Development Project at the Urban Justice Center, conducted over 8,200 surveys, 30 observations and 63 in-depth interviews in the eight participating City Council districts. We collect-ed quantitative and qualitative data to examine participation at key points in the PB process, to examine the impact PB has on civic engagement and governance and to conduct ongoing evaluation of the process. Specifically, data was collected at neighborhood assemblies and the vote. Researchers also conducted interviews throughout the cycle.
Methods
Background and Secondary Research
Researchers collected data on the NYC budget, population demo-graphics and voting patterns in the participating districts to explore how PB impacts government spending and operations, and to conduct a comparative analysis of participation in PB. Data sources include census data, the General Social Survey and 2009 voter data from the Voter Activation Network and Catalist.
Surveys and Evaluation Forms
Over 8,200 surveys were collected to examine who participated in PB, how they learned and changed from the process and what outreach methods were most effective. Survey respondents included:
• Neighborhood Assembly participants: 924• Voters: 7,300
Over 8,200 surveys, 30 observations,and 63 in-depth interviews
Research Methodology
10
In-depth Interviews
Researchers conducted 63 in-depth interviews with past and current budget delegates to examine how and why people participated in PB, what participants learned from PB, how they changed from the process, and how it affected relationships between city officials, city staff and community members. Researchers also conducted 15 interviews with organizations that work with immigrant, youth or formerly incarcerated populations and collected 82 exit interviews with PB voters.
Observations
Researchers collected 30 observations of PB meetings and events to examine the dynamics of participation in PB.
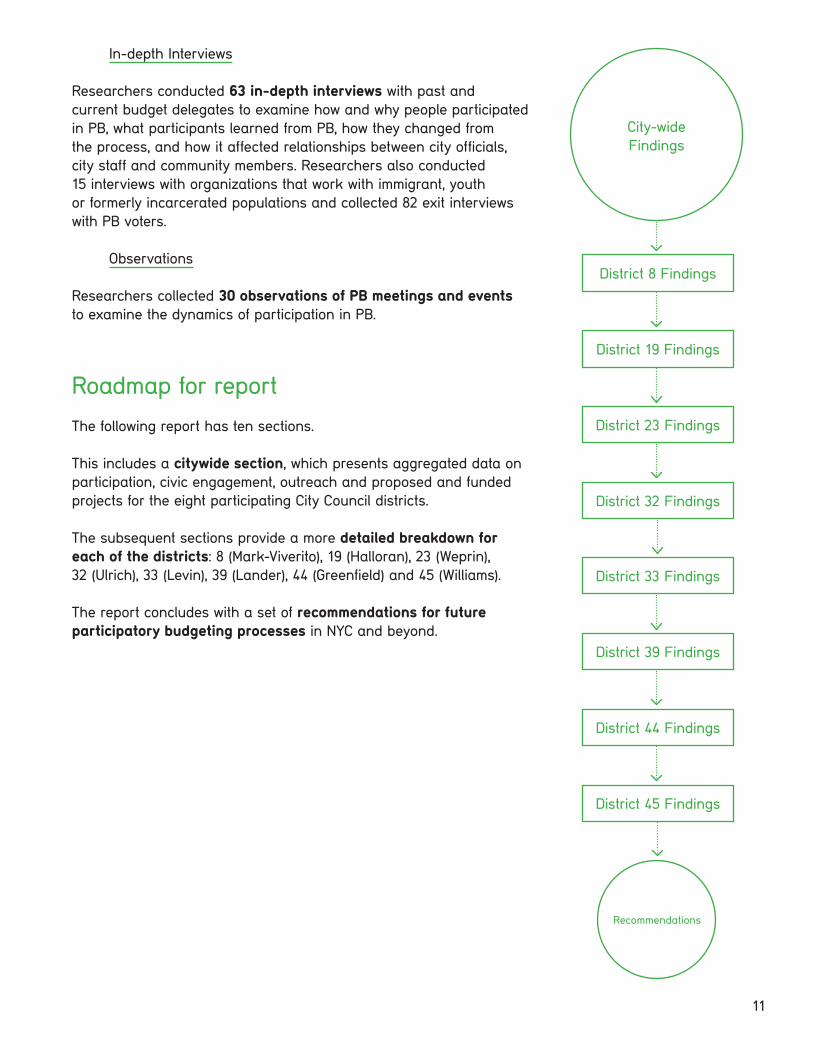
Roadmap for report
The following report has ten sections.
This includes a citywide section, which presents aggregated data on participation, civic engagement, outreach and proposed and funded projects for the eight participating City Council districts.
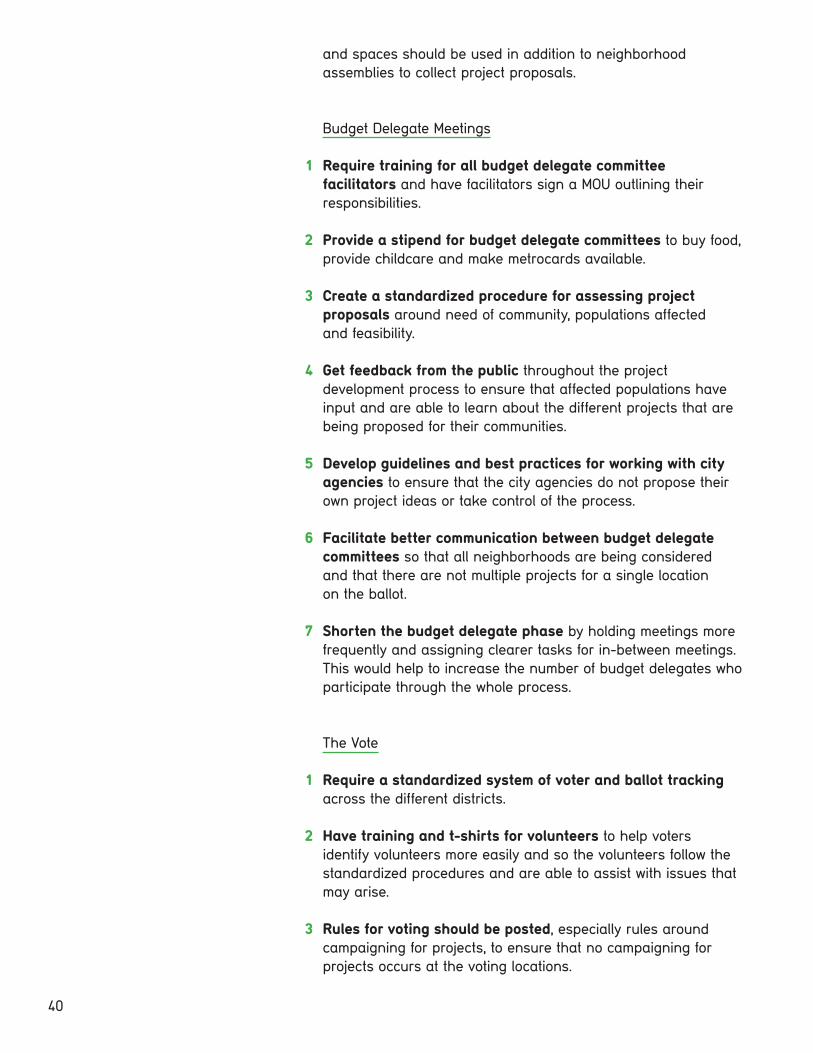
The subsequent sections provide a more detailed breakdown for each of the districts: 8 (Mark-Viverito), 19 (Halloran), 23 (Weprin), 32 (Ulrich), 33 (Levin), 39 (Lander), 44 (Greenfield) and 45 (Williams).
The report concludes with a set of recommendations for future participatory budgeting processes in NYC and beyond.
City-wide Findings
District 33 Findings
District 8 Findings
District 39 Findings
District 19 Findings
District 44 Findings
District 23 Findings
District 45 Findings
District 32 Findings
Recommendations
11

Council Member District Neighborhoods Total PBParticipants
Amount Allocated
Key Demographics Unique Characteristics
Melissa Mark-Viverito* (Democrat)
8thManBnx
Manhattan ValleyEl Barrio/East HarlemMott Haven
2,063 $1,903,000to 6 winningprojects
50% of the district’s population identifies as Hispanic/Latino/a, 23% as Black/African American, and 19% as White6
40% of residents are lower income (less than $25,000)7
The district encompasses Central Park and Randall’s Island
Neighborhoods span from the Upper West Side to the East Harlem/El Barrio to the South Bronx
High concentration of public housing
Dan Halloran (Republican)
19th Qns
College PointAuburndale- Flushing BaysideWhitestoneBay TerraceDouglastonLittle Neck
1,191 $995,000 to 7 winning projects
53% of the district’s population identifies as White, 28% as Asian and 15% as Hispanic or Latino/a8
50% of the district has a household income over $75,0009
17% of the district’s population is 65 years and older10
The district has no subway stations
District borders Nassau County
Mark Weprin(Democrat)
23rd Qns
Hollis HillsQueens VillageLittle NeckDouglastonBaysideBelleroseFloral ParkGlen OaksNew Hyde ParkHollisHollis Park GdnsHolliswoodFresh MeadowsOakland Gardens
1,273 $979,000 to 6 winning projects
37% of the district’s population identifies as Asian and 31% as White11
58% of the district has a household income over $75,00012
52% of residents primarily speak a language other than English13
The district has no subway stations
District is largely comprised of residential neighborhoods in eastern Queens
Has the second highest concentration of Asians in NYC
Eric Ulrich*(Republican)
32nd Qns
Belle HarborBreezy PointBroad ChannelRockaway ParkRockaway Beach
1,010 $1,442,500 to 7 winning projects
68% of the district identifies as White, 14% Latino/a, 14% African American14
40% of the district is middle income ($25,000- 75,000)15
Most of the district is located on a peninsula known for its beaches and parks
Only a portion of the district participated in PB
District was greatly impacted by Hurricane Sandy
Participating NYC Council Districts: 8, 19, 23 and 32
12

Council Member District Neighborhoods Total PBParticipants
Amount Allocated
Key Demographics Unique Characteristics
Stephen Levin(Democrat)
33rdBkln
Brooklyn HeightsDUMBOGreenpointParts of Williamsburg,Park Slope andBoerum Hill
2,632 $1,058,000 to 5 winning projects
74% of the district’s population identifies as White16
65% of residents have a college education17
The district spans the waterfront from Greenpoint down to Boerum Hill and includes downtown Brooklyn
There is a large amount of public housing is this district
Large Orthodox Jewish population
Brad Lander*(Democrat)
39thBkln
Cobble HillCarroll GardensColumbia Waterfront GowanusPark SlopeWindsor TerraceBorough ParkKensington
3,107 $950,000 to 6 winning projects
Large Bangladeshi population in Kensington
66% of the district’s population identifies as White, 14% Hispanic and 13% Asian18
57% of residents have a college education19
The district is intersected by the Gowanus Canal and contains several parks and cemeteries. These geographical characteristics create distinct neighborhoods including higher-income Park Slope, Kensington with its large Bangladeshi population and finally Borough Park, a Jewish enclave.20
David Greenfield(Democrat)
44thBkln
Borough ParkMidwoodBensonhurst
1,719 $1,000,000 to 5 winning projects
71% of the district’s population identifies as White21
68% primarily speak a language other than English22
41% of the district’s population is under the age of 2523
The Borough Park neighborhood is home to one of the largest Orthodox Jewish communities in the city
Jumaane D. Williams*(Democrat)
45th Bkln
FlatbushEast FlatbushFlatlandsParts of Midwood and Canarsie
1,035 $1,480,000 to 4 winning projects
76% of the district’s population identifies as Black/African-American24
45% of residents have a college education25
Has the largest foreign-born population in Brooklyn, made up of immigrants from Jamaica, Haiti, Trinidad and Tobago26
Participating NYC Council Districts: 33, 39, 44 and 45
* Indicates that Council Member participated in 2011-12 and 2012-13 cycles of Participatory Budgeting
13
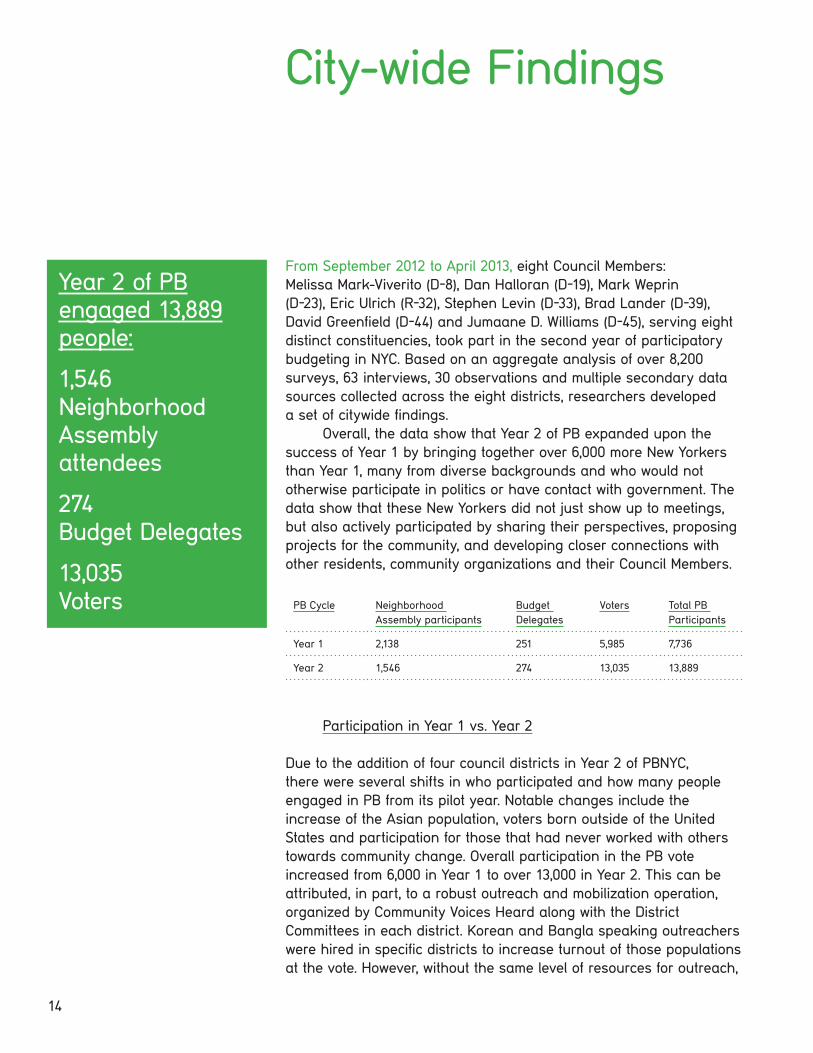
Year 2 of PB engaged 13,889 people:
1,546Neighborhood Assembly attendees
274Budget Delegates
13,035Voters
From September 2012 to April 2013, eight Council Members: Melissa Mark-Viverito (D-8), Dan Halloran (D-19), Mark Weprin (D-23), Eric Ulrich (R-32), Stephen Levin (D-33), Brad Lander (D-39), David Greenfield (D-44) and Jumaane D. Williams (D-45), serving eight distinct constituencies, took part in the second year of participatory budgeting in NYC. Based on an aggregate analysis of over 8,200 surveys, 63 interviews, 30 observations and multiple secondary data sources collected across the eight districts, researchers developed a set of citywide findings.
Overall, the data show that Year 2 of PB expanded upon the success of Year 1 by bringing together over 6,000 more New Yorkers than Year 1, many from diverse backgrounds and who would not otherwise participate in politics or have contact with government. The data show that these New Yorkers did not just show up to meetings, but also actively participated by sharing their perspectives, proposing projects for the community, and developing closer connections with other residents, community organizations and their Council Members.
PB Cycle Neighborhood Assembly participants
Budget Delegates
Voters Total PB Participants
Year 1 2,138 251 5,985 7,736
Year 2 1,546 274 13,035 13,889
Participation in Year 1 vs. Year 2
Due to the addition of four council districts in Year 2 of PBNYC, there were several shifts in who participated and how many people engaged in PB from its pilot year. Notable changes include the increase of the Asian population, voters born outside of the United States and participation for those that had never worked with others towards community change. Overall participation in the PB vote increased from 6,000 in Year 1 to over 13,000 in Year 2. This can be attributed, in part, to a robust outreach and mobilization operation, organized by Community Voices Heard along with the District Committees in each district. Korean and Bangla speaking outreachers were hired in specific districts to increase turnout of those populations at the vote. However, without the same level of resources for outreach,
City-wide Findings
14

Residents of District 39 attend a project expo to learn about the different projects that will be on the participatory budgeting ballot.
neighborhood assembly attendance dropped from Year 1 to Year 2, despite the addition of four districts. Aside from lack of outreach, other possible explanations for the drop in attendance include a lack of civic infrastructure in several of the new participating districts. Additionally, some districts focused more on setting up many neighborhood assemblies in each district rather than making sure all the assemblies had high turnout. Finally, a large portion of those that participated in Year 1 of PB, did not return for Year 2. This could be due to the fact that some of the winning projects from Year 1 have yet to be implemented, causing disillusionment or frustration among participants. For subsequent years, it will be important to ensure ongoing monitoring of projects and targeted outreach to past participants to ensure the sustainability of civic engagement for PB participants.
15

Who Participated in PBNYC?
In Year 2, PB Engaged 13,889 people, including: 1,546 neighborhood assembly participants, 274 Budget Delegates and 13,035 voters. In addition, hundreds more joined the process as volunteer members of the Steering and District Committees. Demographic information collected at key points during the process points towards several trends in participation, with many similarities and select differences from Year 1, including the following:
PB mobilized long-term residents, many of whom had NOT previously worked for community change.
• 77% of neighborhood assembly participants and 68% of PB voters have lived in their present neighborhood for 8 or more years; a slight change from Year 1 where 75% of neighborhood assembly participants and 78% of PB voters had lived in their neighborhood for 8 or more years.
• 38% of neighborhood assembly participants and 50% of PB voters had never worked with others in their community to solve a problem before PB; an increase from Year 1 where a third of neighborhood assembly participants and 44% of PB voters had never worked with others in their community to solve a problem before PB.
PB mobilized a diverse cross-section of New Yorkers.
“All kinds of people, White, Black, Asian, Hispanic, everything was there. And that made me feel good… It was nice seeing so many people giving ideas, and giving their opinions about the neighborhood and it’s good because they live here and they should have a voice.”
— Budget Delegate Interviewee #61, District 8
• 14% of PB voters identified as Latino/a; 12% as Black; 8% as Asian and 4% as ‘Other.’
• A higher percentage of African Americans participated in neighborhood assemblies (30%), compared to the full population in the eight districts (17%).
• Asians made up a greater share of PB voters in Year 2 (8%) than in Year 1 (2%).
• Women were 66% of neighborhood assembly participants, 60% of budget delegates and 62% of voters in the PB process, which is about the same as Year 1.
Percentage of PB voters who had never worked with others in their community
to solve a problem
50%
PB voters identified as:
14% Hispanic or Latino/a12% Black8% Asian4% Other
16

Women comprised at least 60% of the participants in each stage of the process
• A higher percentage of people with low-incomes (under $35,000) voted in PB (40%), compared to the full population in the eight districts (34%) and in the 2009 local elections (29%).27
Women, people of color and non-English speakers actively participated in PB meetings and discussions.
• 92% of women spoke during the small group discussions at neighborhood assemblies.
• 90% of participants who identified as Black or African American, 89% of Hispanics or Latinos and 88% of Asians spoke during small group discussions at neighborhood assemblies.
• 92% of Spanish speaking participants spoke during the small group discussion at neighborhood assemblies and 82% made specific budget proposals.
• Participants that identified as Black or African American were the most likely to volunteer to be budget delegates.
• 55% of Spanish speaking participants volunteered to be budget delegates, compared to 46% of English speaking participants; an increase from Year 1 where 42% of Spanish speaking participants volunteered to be budget delegates.
People of color and low-income people were more likely to participate in the neighborhood assemblies than vote in PB.
• 30% of neighborhood assembly participants identified as African American or Black compared to only 12% of PB voters.
• 18% of neighborhood assembly participants identified as Hispanic or Latino/a compared to only 14% of PB voters.
• People with incomes below $35,000 made up a much larger share of neighborhood assembly participants than PB voters.
People with higher levels of education are more likely to participate in PB than people with lower levels of education.
• People with college or graduate degrees made up 55% of neighborhood assembly participants and 67% of PB voters.
• People with a high school diploma or less made up a smaller share of neighborhood assembly participants (19%) and PB voters (19%) compared to the full population in the eight districts (42%).
92% of Spanish speakers spoke at neighborhood assemblies
17

Non-English speakers and immigrants were more likely to vote in Year 2 of PB than Year 1, but these populations were still underrepresented compared to the overall district populations.
• 24% of Year 2 PB voters were born outside of the United States compared to 19% in Year 1 and 35% of the overall population in the eight districts.
• 14% of Year 2 PB voters reported that they primarily speak a language other than English compared to 50% of the overall population in the eight districts.
Residents attending a neighborhood assembly in District 8.
24% of PB Voters in Year 2 were born outside of the USA compared to 19% in Year 1
18

Opportunities and Challenges of InvolvingSchools in PB
In Year 2 of PBNYC, 10% of people surveyed at neighborhood assemblies and 6% of people surveyed at the vote learned about PB through a school. Citywide, PB voters decided that 12 of 45 winning projects (26%), and $2.4 million of $9.8 million (24%) would be directed towards school improvements. Schools are a proven way to engage people in PB, and school-related projects are often popular at the polls. A deeper look reveals the specific benefits and challenges of school participation in PB.
Schools engage youth and immigrants in PB
Local public schools are core community institutions that are uniquely positioned to engage certain populations in participatory budgeting. First, schools are a major point of outreach for youth participation in PB. Schools not only inform youth about PB but also help to foster interest in civic and political issues, which in turn has been shown to correlate with a higher GPA and desire to learn.28 For example, one civics class at City-as-School in Manhattan integrated PB into their curriculum by requiring students to attend neighborhood assemblies. PB gives youth real-life examples of the political process, working in communities, building consensus and understanding the budget process.
“…if it wasn’t for this class I would have not known [about PB]. Cause I thought I didn’t care about politics.”
— Student #9
Once students are engaged, schools can then reach another key demographic through schools: immigrant parents who may have limited community connections. This is especially true for undocumented immigrant families where parents may have little community involvement due to fear, long work hours or language barriers but are very involved in their children’s education. In these cases, schools act as a point of entry for community participation for immigrant parents.29
Schools can have disproportionate influence on the PB process
However, there are some challenges to school involvement in PB, since schools have significant institutional power and can end up having a strong impact on the process. Many parents get involved in PB, and then volunteer for the education or schools committee, which tend to be very popular. Interviews with budget delegates reveal that
19

many delegates push for a particular project in their child’s school, instead of focusing on the larger good of the community. This can also pit schools against each other as they each vie for limited PB funds.
Once a project for a school is on the ballot, schools have a significant advantage over many of the other PB projects since through an extensive network of parents, they often have relatively large and easily mobilized constituencies. This effect is amplified if the school also serves as a voting location. As one budget delegate explained:
“Schools already have a formidable ability to organize and motivate people, particularly parents, through pre-existing things like sports teams and Parent-Teacher Associations. If a school has a stake in participatory budgeting, they can get more of a turnout with a single mimeographed letter to parents… As such, schools walk away with the lion’s share of money.”
— Budget Delegate email comment
These challenges can be mitigated by active city council staff and facilitator support.
Best practices include:
• Encouraging education committees to bundle projects, meaning that a committee will combine several projects into one item on the ballot, so several schools each get some money. This helps to ensure that schools (and delegates) work together to get funding and more clearly distribute the funding among several schools. As PB progresses, this could also mean that every school in the district could expect to get funding every few years.
• Actively encouraging voters to review all the projects on the ballot and cast all of their votes.
• Prominently displaying project posters and info sheet binders at voting sites, to highlight other projects on the ballot.
• Hold voting locations at or near all projects on the ballot, not just schools.
20

PB connected people that otherwise would not have engaged with one another
“Everyone has a lot of respect for each other and helped flesh out ideas. We worked collectively even though we each have our own projects. We met interesting people of different backgrounds, we wouldn’t have met otherwise.”
— Budget Delegate Interviewee #14, District 33
“Neighborhood assemblies were great. Now in daily life, especially with social media, we find ourselves increasingly bubbled in. We don’t talk to people who don’t necessarily agree with us. These people are citizens exactly like me, and even though I think they’re dead wrong, they have just as much power in the citizenry as I do, and they have to be dealt with in some way. In our normal everyday lives, we don’t often have to deal with that.”
— Budget Delegate Interviewee #3, District 39
“People from all over the district were represented in PB and this is one of the things that I cherished the most. I got to meet people that under any other circumstances I would not have met.”
— Budget Delegate Interviewee #50, District 8
Mobile voting site in District 8
21

How did Participatory Budgeting compare to previous patterns of civic engagement?
One of the most striking findings about who participated in PB is how the data compares to other types of civic engagement, particularly voting patterns in local NYC elections. Similar to Year 1, Year 2 of PB engaged specific communities that have traditionally been uninspired by and skeptical of politics. People of color, low-income people and some immigrant groups turned out at higher rates than in previous elections.
PB mobilized many people who do not traditionally participate in the political process and some who tend to be skeptical of the NYC government.
• 52% of PB voters disapprove of the way government business is conducted in the New York City government.
• 46% of neighborhood assembly participants and 34% of PB voters are unlikely voters30 in regular elections.
• 50% of neighborhood assembly participants think that government needs a lot of changes or that it needs to be completely changed.
• 62% of neighborhood assembly participants agreed with the statement that the public has little control over what politicians do in office.
• 50% of Year 2 PB voters had never worked with others in their community to solve a problem before PB, compared to 44% of Year 1 PB voters.
People of color and low-income people participated in PB at higher rates than traditional electoral politics.
Melissa Mark-Viverito, District 8
• Hispanics or Latino/as were 39% of voters in the 2009 City Council elections.31 However, 54% of PB voters identified as Hispanic or Latino/a.
• 21% of PB voters had a household income less than $10,000 compared to 4% of the district’s voters in the 2009 City Council election.32
Attitudes about politics among PB participants
PB voters that disagree with the way government
business is conducted in NYC
PB voters who are unlikely to vote in regular elections
Neighborhod assembly partici-pants that think government need drastic changes
PB voters who never worked with their
community to solve a problem before PB
50%52%
50%34%
22

Dan Halloran, District 19
• 13% of PB voters had a household income less than $35,000 compared to 1% of the district’s voters in the 2009 City Council election.33
Mark Weprin, District 23
• Asians were 15% of voters in the 2009 City Council elections.34 However, 22% of the district’s PB voters identified as Asian.
• 18% of PB voters had a household income less than $35,000 compared to 5% of the district’s voters in the 2009 City Council election.35
Eric Ulrich, District 32
• Black or African Americans were 6% of the voters in the 2009 City Council elections.36 However, 13% of the district’s PB voters identified as Black or African American.
• 45% of PB voters had a household income less than $35,000 compared to 10% of the district’s voters in the 2009 City Council election.37
David Greenfield, District 44
• 12% of PB voters had a household income less than $15,000 compared to 1% of the district’s voters in the 2009 City Council election.38
Jumaane Williams, District 45
• 89% of PB voters identified as Black or African American compared to 79% of the district’s voters in the 2009 City Council election.39
• 28% of PB voters had a household income less than $25,000 compared to 6% of the district’s voters in the 2009 election.40
39% 54% 4% 21%
Latino/as Voters with income less than $10,000
District 8
79% 89% 6% 28%
African Americans
District 45
Voters with income less than $25,000
Voters in 2009 City Council Elections
PB Voters
Demographics of PB Voters compared toVoters in 2009 City Council Elections
23

Engaging Disenfranchised Populations: Immigrants, Youth and the Formerly Incarcerated
By reducing the barriers to participation, and encouraging inclusion, PB gives a voice to populations that are usually marginalized in political discussions. Three populations in particular are barred from voting in general elections but can participate and vote in participatory budgeting: immigrants who are not U.S. citizens, youth under the age of 18, and formerly incarcerated individuals on parole with a felony conviction. While PB opens doors to political participation, there remain distinct challenges to engaging each of these groups in PB. Below are research findings and best practices from a series of observations and interviews.
Immigrants
In the second year of PB, 5% of voters surveyed identified as immigrants who are not U.S. citizens. It is estimated that 9% of New Yorkers are undocumented immigrants.41 While this is almost certainly an underestimate (due to fear of reporting immigrant status and deportation), it indicates that more can be done to engage the immigrant community. PB materials were translated into various languages and interpretation was available at some meetings, but this was not always available. In addition, while some districts held specific meetings and assemblies for targeted languages, not all of the districts did so. Interviews with PB participants and representatives from various immigrant organizations reveal the following:
The major barriers to participation for immigrants in PB are language access, lack of time, fear and lack of knowledge about the process.
“…people are afraid of participating in any kind of community or government based program because of the fear their immigration status creates.”
— Organization #3
Schools can be a central space to facilitate and encourage civic engagement amongst immigrants.
“…I think it can start with the youth, to share with their parents what goes on and maybe bringing them to meetings…”
— Organization #3
24
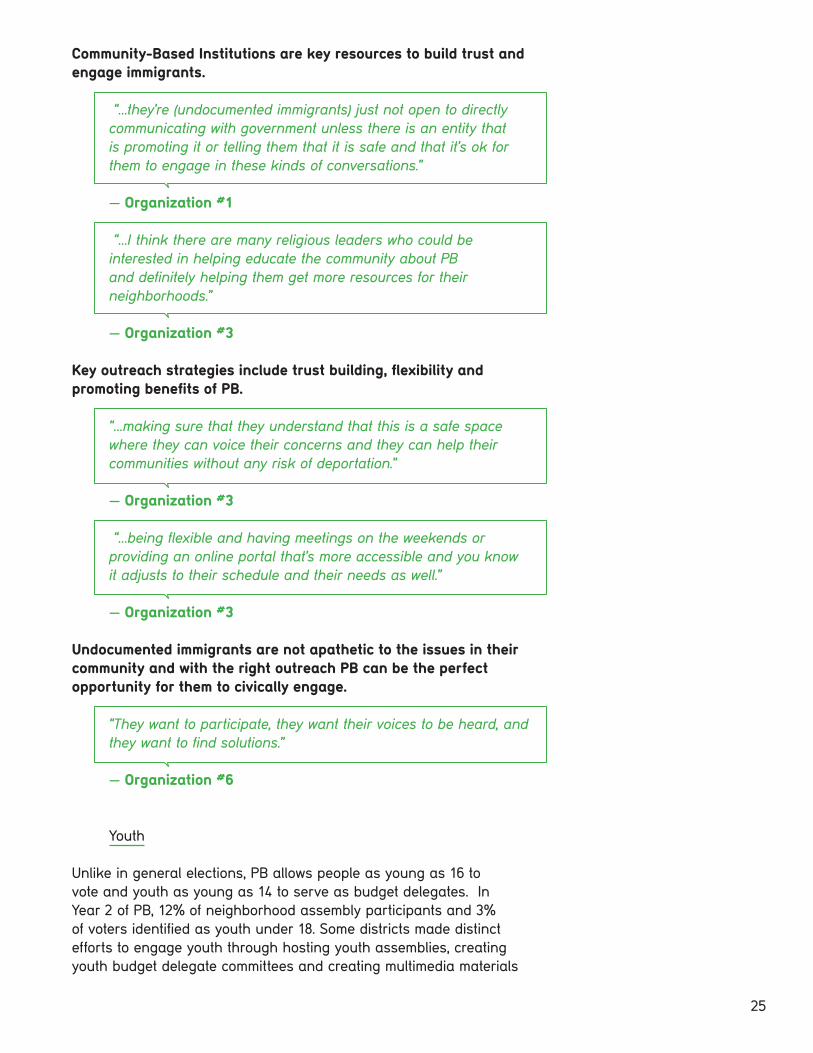
Community-Based Institutions are key resources to build trust and engage immigrants.
“…they’re (undocumented immigrants) just not open to directly communicating with government unless there is an entity that is promoting it or telling them that it is safe and that it’s ok for them to engage in these kinds of conversations.”
— Organization #1
“…I think there are many religious leaders who could be interested in helping educate the community about PB and definitely helping them get more resources for their neighborhoods.”
— Organization #3
Key outreach strategies include trust building, flexibility and promoting benefits of PB.
“…making sure that they understand that this is a safe space where they can voice their concerns and they can help their communities without any risk of deportation.”
— Organization #3
“…being flexible and having meetings on the weekends or providing an online portal that’s more accessible and you know it adjusts to their schedule and their needs as well.”
— Organization #3
Undocumented immigrants are not apathetic to the issues in their community and with the right outreach PB can be the perfect opportunity for them to civically engage.
“They want to participate, they want their voices to be heard, and they want to find solutions.”
— Organization #6
Youth
Unlike in general elections, PB allows people as young as 16 to vote and youth as young as 14 to serve as budget delegates. In Year 2 of PB, 12% of neighborhood assembly participants and 3% of voters identified as youth under 18. Some districts made distinct efforts to engage youth through hosting youth assemblies, creating youth budget delegate committees and creating multimedia materials
25

Youth in District 23 exercise their right to vote in participatory budgeting.
such as a rap video to attract youth. Some districts also created partnerships with specific principals and teachers to incorporate PB directly into student’s curriculum. Interviews with PB participants and youth and teachers from various schools that participated in PB indicate the following findings:
Youth lack awareness of Participatory Budgeting (PB).
“…a lot of people don’t know that these things are going on, especially teenagers…if I hadn’t taken this class I probably would never have known…if this was brought up more often, more classes like this did happen a lot of people would be interested in going.”
— Student #1
Youth should conduct outreach to their peers.
“If there are youth already going to that district…speak about it. Because the adults that we know, they can say as much as they want about it, but coming from a fellow youth…a perspective that is similar to ours [helps].”
— Student #7
26

Schools are a key institution to engage young people about PB.
A large majority of the students interviewed did not know about PB prior to their involvement in their government class at school. The school was a major point of outreach for these youth and many cited ways that schools could get more youth involved. Civic engagement in turn can positively impact student’s education as civic involvement has been shown to correlate with higher GPA and desire to learn.42
Media can play an important role in engaging youth in civic participation.
Students felt that social media and other forms of media, such as videos, could play an integral role in attracting youth. For example, students at ICHS, a high school for new immigrants, created innovative videos about PB with the assistance of the Center for Urban Pedagogy. In addition, a video explaining the PB process through a rap song was created by one of the council districts and some students thought it was a good way to attract youth:
“…the rap video, that was interesting…things like that would work…people in my class really liked it and I know a couple of people are still participating in it because of things like that…”
— Student #4
Formerly Incarcerated
Those individuals who are released from prison but remain under supervision by the state through parole or probation are not allowed to vote. PB breaks down this barrier by allowing these individuals to participate. However, there are still various challenges to civic engagement for the formerly incarcerated that impact their participation in PB. Interviews with PB participants and organizations that work with the formerly incarcerated led to the following findings:
Institutional and legal restrictions are barriers to civic engagement.
Upon reentry from prison, individuals are faced with political disen-franchisement, lack of Federal benefits and restrictions on their ability to access employment and educational opportunities.43 All of these barriers create a sense of stigma, which in turn contributes to a reluc-tance on the part of the formerly incarcerated to engage in civic life.
“…some of them don’t want people to know that they are formerly incarcerated because they’re afraid…they may not be able to continue getting the services they get if they announce that they’re incarcerated.”
— Organization # 3
27
Financial instability and lack of education are barriers to civic participation.
Upon release from prison many formerly incarcerated individuals have limited financial means and return to impoverished neighborhoods. As mentioned above, they face employment barriers that restrict their ability to find meaningful work as many employers will not hire them. Engaging the formerly incarcerated community in civic engagement is virtually impossible if their basic needs of food and shelter are not being met.
“…a lot of our participants are the guys on the other side of the table, they’re in the shelter system, going to the food pantries…it’s really difficult to find someone with good intentions, some measure of financial stability and home and life stability to find time and motivation to be civically engaged.”
— Organization #1
Community-based Institutions are key resources to build trust and engage the formerly incarcerated in civic participation.
Association with a community organization can create a more positive image of the formerly incarcerated to the overall community which in turn allows for greater community participation.44 Through their work CBO’s form trusted relationships with individuals and can act as a source of outreach for the PB process. Examples of organizations that can be key sources for PB are GOSO (Getting Out, Staying Out) and WORTH (Women on the rise telling her story).
PB can be utilized for skills development and job-readiness training.
PB can be a great resource to build on key skills needed in the workforce, like communication and public speaking, as well as being a great addition to a resume. A PB participant speaks of the ability of PB to improve the skills he already has as well as develop those that he lacks:
“…it helps us, it sharpens some of the skills that we have…with the social skills and communication [skills] on a daily basis…”
— Interviewee #3
28

PB can also be a networking tool to link individuals to other opportunities, organizations and programs:
“…the first interaction that a lot of my participants have had with our city council office is through PB and they can be told about other programs that they might not have ever heard of or didn’t know existed.”
— Organization #1
A sign advertises the PB vote.
29

Interestingly, people found out about the neighborhood assemblies and the PB vote through different channels, a significant change from Year 1 where participants heard about neighborhood assemblies and the vote through the same channels. While there was variation across districts, overall, participants were most likely to hear about the neighborhood assemblies through social networks, community organizations, their Council Member and by email, which was similar to Year 1. However, word of mouth, family and friends and flyers were the most common ways that people heard about the vote. In addition:
African American and Latino/as heard about PB through their social networks (i.e. friends/family, community groups and word of mouth).
• 44% of Black or African American neighborhood assembly participants and 43% of Hispanic or Latino/as heard about PB through a community group.
• 35% of Black or African American neighborhood assembly participants and 34% of Hispanic or Latino/as heard about PB from friends and/or family.
• 29% of Black or African American PB voters heard about PB through Word of Mouth.
How did people find out about participatory budgeting and what motivated them participate?
City Council Member
Word of mouth
37% 26%
Flyer/poster Email22% 13%
Community group
13%
EmailCity Council
Member33% 18%
Friend, family or neighbor
Flyer/poster26% 19%
Community group
Friend, family or neighbor
32% 19%
How People Learned About Neighborhood Assemblies
How People Learned About The PB Vote
30

Youth and Immigrants heard about PB through word of mouth and from family and friends.
• 42% of PB voters under the age of 18 heard about the vote from family and/or friends compared to 18% of voters over age 18.
• Voters who were immigrants were most likely to have heard about the vote via word of mouth (23%) and family or friends (19%).
Community groups helped to bring people with lower incomes into the PB process.
• 47% of neighborhood assembly participants with a household income below $35,000 heard about PB from a community group compared to 29% for participants with a household income above $35,000.
• 16% of PB voters with a household income below $35,000 heard about PB from a community group compared to 12% for PB voters with a household income above $35,000.
White and higher income people were likely to hear about PB through their Council Member and e-mail.
• 37% of PB voters with incomes greater than $75,000 heard about PB through the internet or an e-mail and 21% through their City Council Member.
• 37% of White PB voters heard about PB through the internet or email.
People participated in PB because they wanted to be involved in their community and have a say in community decisions.
“I came to vote because I like to have a say in my community. This gives an opportunity to make your voice heard.”
— Voter Exit Interview #83, District 19
“The opportunity to help community decide 1 million dollars. I liked the opportunity to be involved.”
— Voter Exit Interview #8, District 45
“I think it is an important thing. It’s important that we have a say in projects that matter for the community.”
— Voter Exit Interview #76, District 44
31

How did City Council Members benefit from Participatory Budgeting?
In addition to the benefits PB brings to participants such as skill building, enhanced civic engagement and leadership development, elected officials make considerable gains from the process. These include: heightened visibility in the media, deeper connections to constituents and increased awareness of the issues and concerns of their constituents.
PB increased the amount of media coverage that the Council Members received over the course of the year.
Council Member Press Coverage Increase Due to PB
Press Coverage Mentioning Council Member
Press Coverage Mentioning Council Member + Participatory Budgeting
Melissa Mark-Viverito
District 8
Dan HalloranDistrict 19
Mark WeprinDistrict 23
Eric UlrichDistrict 32
Stephen LevinDistrict 33
Brad LanderDistrict 39
David GreenfieldDistrict 44
Jumaane D. WilliamsDistrict 45
84
240
44
39
56
35
158
37
132
64
164
82
141
36
152
31
32

Participants valued the Council Members’ involvement in the process and felt it brought the Council Member closer to the community.
“Feeling of more positivity about the Councilmember; communication was great, his office would call, email, provided donuts and coffee – when they did the presentation for the project expo the Councilmember’s office was very helpful. Gives the Councilmember a great boost -- he didn’t have to do this, and he did, and that’s meaningful.”
— Budget Delegate Interviewee #22, District 23
“Well I always saw him (Council member) really positively, but this made me feel more confident because he is doing pretty good work. I will get involved with PB and with lots of other things too, definitely.”
— Budget Delegate Interviewee #32, District 45
“I think this process has really given me a deeper appreciation to the work that the Council Member does by her just giving this power back to the people.”
— Budget Delegate Interviewee #60, District 8
Council Member Stephen Levin speaks during a neighborhood assembly in District 33.
33

What changes did PB participants want for their communities?
In previous years, the eight Council Members each focused large chunks of their capital discretionary funds on school improvements and park improvements, with the individual Council Members using smaller amounts to address other needs within their districts. Projects that were proposed at neighborhood assemblies by community members tended to be consistent with these past trends, but there were some differences. There were many projects around public health and sanitation, traffic, street repairs, lights and security cameras throughout all the districts, areas that had previously not received as much funding from the Council Members. These were the same areas of concern for PB participants in Year 1. In addition, some participants wanted projects that were ultimately ineligible for PB. In reviewing the proposed projects for all eight of the council districts, the following trends emerged [see more detailed breakdown in the district sections]:
• The average number of project proposals per district was 234, down from 489 in the first year.
• School improvements and park improvements were in the top five projects for seven of the eight districts.
• Street lights and security cameras were in the top five projects for five of the districts.
• 49% of project proposals were ineligible in Year 2 compared to 17% in Year 1, as they were too expensive or too cheap, outside of district boundaries, not capital projects, or covered by other funding streams.
• The most common types of ineligible projects were related to street cleanliness and sanitation and programs for community centers.
What projects were ineligible?
Total ineligible projects proposed city-wide: 800 (49%)
Top ineligible categories:Public Health and Sanitation (101)Community Centers/Programs (100)Public Access Institutions (95)Parks, Playgrounds, Public Space Improvements (80)Transportation Improvements (77)
What projects made it on the ballot?
Total projects that were voted on city-wide: 122
Average cost of projects city-wide: $277,717
Most expensive project: $675,000 (E-tech support for schools in District 45)
Least expensive project: $30,000 (Park Department beach vehicle in District 32)
Top categories:Schools & Libraries (34)Parks & Recreation (24)Transportation (17)
What projects were proposed?
Total projects proposed city-wide: 1,641
Top categories:Parks, Playgrounds, Public Space Improvements (260)Public Access Institutions (237)Public Health and Sanitation (163Transportation Improvements (156)Security (150)
34

Winning Projects City-wide
Lowest cost project: $35,000
(D19 Police cameras and D23 Roof Repair – Queens County Farm Museum
Highest cost project:
$500,000(D8 Installation of security cameras)
Average cost of a project: $213,206
Number of Projects:
46
Total overall funds allocated to all winning
projects: $9,807,500
Winning Projects by Type
Table 1
Additional Funded Projects
Project District Cost
Fort Totten Park Sidewalk Improvements 19th $100,000
Bird Watching Platform at Osprey Landing and Beautification of Parson’s Beach
19th $100,000
Upgrade Bayside Historical Society “Officer’s Club” 19th $150,000
Mobile Computer Cart PS 31/32/41/79/159 19th $175,000
Wi-Fi Classroom PS 98/130/184/193/Bell Academy 19th $350,000
Installation of Fitness Equipment 32nd $75,000
Parks Department Beach Vehicle 32nd $30,000
Gowanus Community Center Upgrades 33rd $150,000
Upgrades to Wyckoff Community Center 33rd $425,000
Tree Guards as Part of Neighborhood Reclamation 33rd $35,000
Projector for Celebrate Brooklyn & BRIC Art Center 39th $40,000
Safe Auditorium Upgrade for Performing Arts PS 131 39th $100,000
John Jay High School Media & Filmmaking Lab 39th $100,000
Total $1,830,000
Schools & Libraries: 12
Parks & Recreation: 10
Public Safety: 8
Community Facilities: 7
Health &Sanitation: 4
Transpor-tation: 3
Housing: 1
Youth: 1
35
City-wide Summary
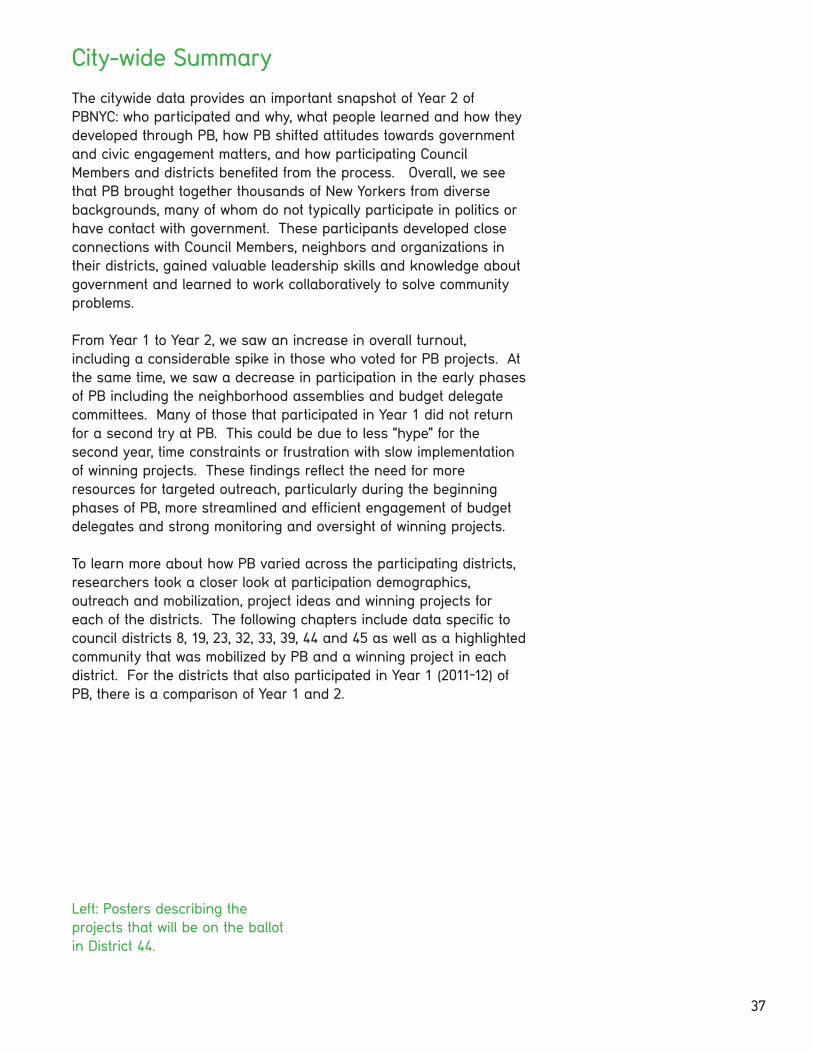
The citywide data provides an important snapshot of Year 2 of PBNYC: who participated and why, what people learned and how they developed through PB, how PB shifted attitudes towards government and civic engagement matters, and how participating Council Members and districts benefited from the process. Overall, we see that PB brought together thousands of New Yorkers from diverse backgrounds, many of whom do not typically participate in politics or have contact with government. These participants developed close connections with Council Members, neighbors and organizations in their districts, gained valuable leadership skills and knowledge about government and learned to work collaboratively to solve community problems.
From Year 1 to Year 2, we saw an increase in overall turnout, including a considerable spike in those who voted for PB projects. At the same time, we saw a decrease in participation in the early phases of PB including the neighborhood assemblies and budget delegate committees. Many of those that participated in Year 1 did not return for a second try at PB. This could be due to less “hype” for the second year, time constraints or frustration with slow implementation of winning projects. These findings reflect the need for more resources for targeted outreach, particularly during the beginning phases of PB, more streamlined and efficient engagement of budget delegates and strong monitoring and oversight of winning projects.
To learn more about how PB varied across the participating districts, researchers took a closer look at participation demographics, outreach and mobilization, project ideas and winning projects for each of the districts. The following chapters include data specific to council districts 8, 19, 23, 32, 33, 39, 44 and 45 as well as a highlighted community that was mobilized by PB and a winning project in each district. For the districts that also participated in Year 1 (2011-12) of PB, there is a comparison of Year 1 and 2.
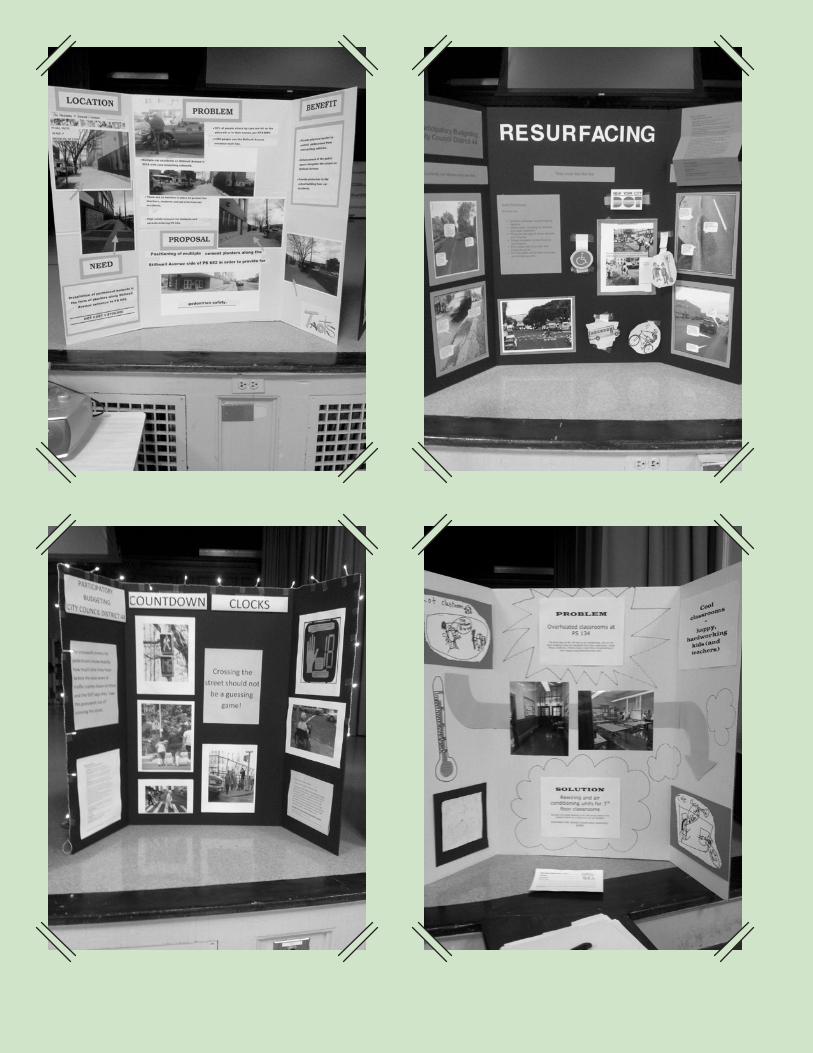
Left: Posters describing the projects that will be on the ballot in District 44.
37

Key Concepts for Successful Participatory Budgets in NYC and Beyond
While the data indicate that PB succeeded in mobilizing large portions of NYC, especially communities that are not traditionally included in the political process, it is helpful to build on past successes and identify areas for improvement. In order to strengthen the PB process in NYC and beyond, we recommend the following:
Planning
1 Expand to new pots of money, including: expense funds, the full City Council budget, the overall City budget and the budgets of city agencies such as New York City Housing Authority (NYCHA), NYC Department of Education (DOE), and Department of Youth and Community Development (DYCD).
2 Make Steering Committee meetings public so that the community has more opportunity to design and have input in the process. This will build more support and ground the process in the local community.
3 Create a standardized schedule across all of the districts for when neighborhood assemblies, budget delegate meetings and the vote take place.
4 Cooperate and share information between districts, especially between Council Member’s offices, and between districts and the citywide process, such as documents and plans for outreach, translation capabilities and meeting schedules.
5 Include more education throughout the process to give participants a better understanding of the history of PB, how the city budget works and how PB reorganizes spending priorities to make the budget more inclusive and representative of New Yorkers’ needs and interests.
Conclusion
38
Outreach
1 Increase publicity by using resources such as local media, editorial pages, and radio, TV, subway and bus ads. Other channels that should be used to get the word out include social media, community boards, schools and community groups.
2 Reach out to populations that usually are not included in the political process and other marginalized populations (e.g. low-income, youth, formerly incarcerated, undocumented immigrants, non-English speakers). This outreach should include partnering with and resourcing community groups that already work with these populations, door-knocking, social media and flyering.
3 Ensure that outreach materials are translated and provide interpretation at meetings and events into the variety of languages represented in the districts.
4 Create a local outreach committee for each district that will work during the budget delegate phase to help the Council Members’ offices with the Get Out the Vote campaigns to increase participation. There could be a sign-up sheet at neighborhood assemblies similar to the one for budget delegates.
Neighborhood Assemblies
1 Each district should hold a minimum of four neighborhood assemblies targeted at traditionally underrepresented communities (e.g. youth, Spanish speakers). Districts that held targeted neighborhood assemblies were able to engage more community members from the targeted groups.
2 Offer a varied schedule of when neighborhood assemblies are held that allows all members of the community to attend.
3 Reformat the opening presentation to be more engaging, including information about projects from past years and clearer instructions about what types of projects are eligible and the information that should be included when a project is proposed.
4 Ensure more time for small group discussion to collect project proposals and develop broad thoughts into specific ideas, which will help the budget delegates when further developing projects for the ballot.
5 Provide opportunities to submit project ideas outside of neighborhood assemblies. E-mail, civic group meetings, community events, mail-in forms, parks and other public events
39
and spaces should be used in addition to neighborhood assemblies to collect project proposals.
Budget Delegate Meetings
1 Require training for all budget delegate committee facilitators and have facilitators sign a MOU outlining their responsibilities.
2 Provide a stipend for budget delegate committees to buy food, provide childcare and make metrocards available.
3 Create a standardized procedure for assessing project proposals around need of community, populations affected and feasibility.
4 Get feedback from the public throughout the project development process to ensure that affected populations have input and are able to learn about the different projects that are being proposed for their communities.
5 Develop guidelines and best practices for working with city agencies to ensure that the city agencies do not propose their own project ideas or take control of the process.
6 Facilitate better communication between budget delegate committees so that all neighborhoods are being considered and that there are not multiple projects for a single location on the ballot.
7 Shorten the budget delegate phase by holding meetings more frequently and assigning clearer tasks for in-between meetings. This would help to increase the number of budget delegates who participate through the whole process.
The Vote
1 Require a standardized system of voter and ballot tracking across the different districts.
2 Have training and t-shirts for volunteers to help voters identify volunteers more easily and so the volunteers follow the standardized procedures and are able to assist with issues that may arise.
3 Rules for voting should be posted, especially rules around campaigning for projects, to ensure that no campaigning for projects occurs at the voting locations.
40

4 Hold at least two mobile voting sites that engage traditionally disenfranchised populations.
5 Extend voting hours and days at the Council Member offices to allow everyone a chance to vote, especially people with nontraditional schedules.
6 Put proposals that received votes from over 25% of voters on the ballot for next year.
7 Invalidate ballots with less than 5 votes.
Implementation & Monitoring
1 Provide more information about the status of funded projects.
2 Provide more information about projects that were implemented outside of the PB vote.
3 Involve District Committees more actively in monitoring of project implementation.
Funding
1 Designate City and City Council funds for implementation of PB, to create more capacity to implement the recommendations above.
41
Brooklyn
Manhattan
Queens
Bronx
District 33Stephen Levin
District 39Brad Lander
District 19Dan Halloran
District 23Mark Weprin
District 32Eric Ulrich
District 45Jumaane D. Williams
District 44David Greenfield
District 8Melissa Mark-Viverito
Participatory Budgeting in NYC 2012–2013ParticipatingCouncilDistricts
Brooklyn
Manhattan
Queens
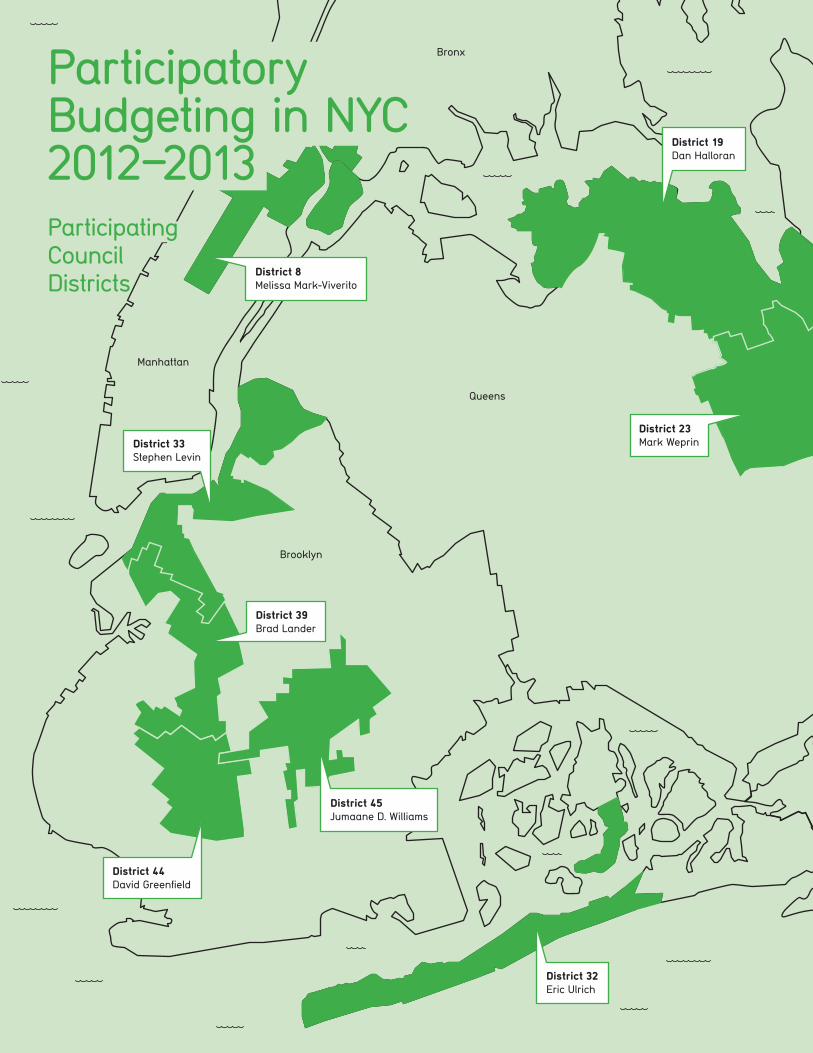
Bronx
Laptops for District 8 Schools: $450,000
Installation of Security Cameras at Johnson, East River, Douglass and Millbrook Houses: $500,000
Technology Centers at YouthBuild and Carver Senior Center:$100,000
SMART’s Mobile Cooking Classroom: $180,000
Solar-powered Greenhouse at Millbrook Houses: $300,000
Basketball Court Renovations at Thomas Jefferson Park: $300,000
District 8Winning Projects
Council Member Melissa Mark-Viverito

MacNeil Park Rehabilitation: $100,000
Police Cameras: $35,000
Kayak and Canoe Launches: $150,000
SMART Boards at PS 32/129/130/159/184/193 Bell Academy: $245,000
Special Needs Playground Equipment: $150,000
Queens
Bronx
Structural Restoration ofPoppenhusen Institute: $250,000
Art Room Renovation at PS 98: $65,000
District 19Winning Projects
Council Member Dan Halloran

Queens County Farm Museum roof repair: $35,000
Glen Oaks Volunteer Ambulance Corps emergency equipment:$40,000
Martin Van Buren High School Technology Upgrade: $129,000
Cunningham Park music stage: $375,000
Portable Security Cameras: $100,000
Cunningham Park enhancement of picnic area: $375,000
Queens
District 23Winning Projects
Council Member Mark Weprin

Brooklyn
Queens
Dayton Towers Upgrades:$38,000
Technology Upgrades at PS 317 and PS 114 and Gym Safety Upgrades at Scholars Academy: $324,500
YMCA Upgrades:$300,000
Traffic Island Landscaping:$50,000
Broad Channel Library Upgrades:$250,000
Rockaway Freeway Dog Park Upgrades:$300,000
Mobi Mats – ADA Ramps for Beach Access: $180,000
District 32Winning Projects
Council Member Eric Ulrich
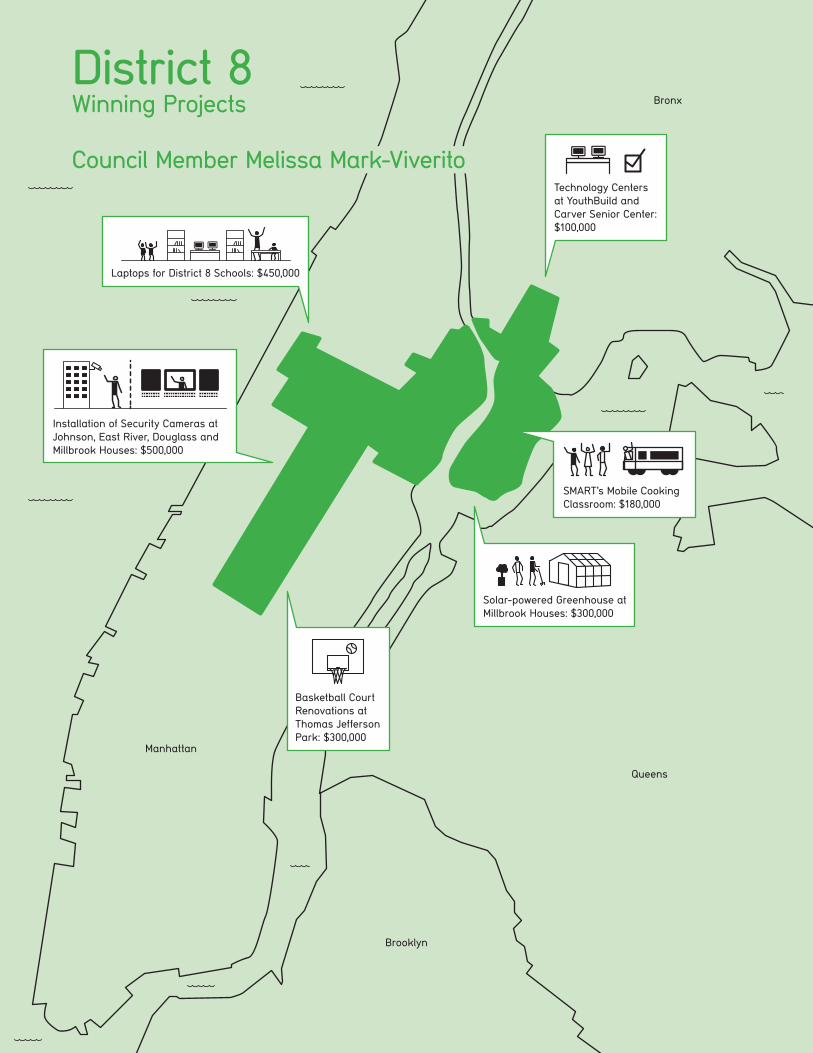
MS 8 Technology Funds:$200,000
East River State Park Dog Run: $450,000
PS 31 Technology Request: $188,000
PS 34 Playground Renovations: $120,000
Brooklyn
Manhattan
Queens
District-wide tree planting:$100,000
District 33Winning Projects
Council Member Stephen Levin

Manhattan
Brooklyn
Queens
Renovate 8 Bathrooms, PS 58, The Carroll School:$110,000
PS 230: Help Kids Connect & Learn With Technology:$180,000
Carroll Gardens/Windsor Terrace Library Computers: $75,000
Church Avenue Traffic & Pedestrian Safety Improvements: $300,000
3rd Street Green Corridor: New Trees, Less Runoff:$170,000
PS 179: Technology upgrade for underserved school: $115,000
District 39Winning Projects
Council Member Brad Lander

Countdown clocks in Borough Park: $200,000
Security cameras in Borough Park:$200,000
Security cameras in Midwood: $2000,000
Countdown clocks in Midwood: $200,000
Countdown clocks in Bensonhurst: $200,000
Brooklyn
District 44Winning Projects
Council Member David Greenfield
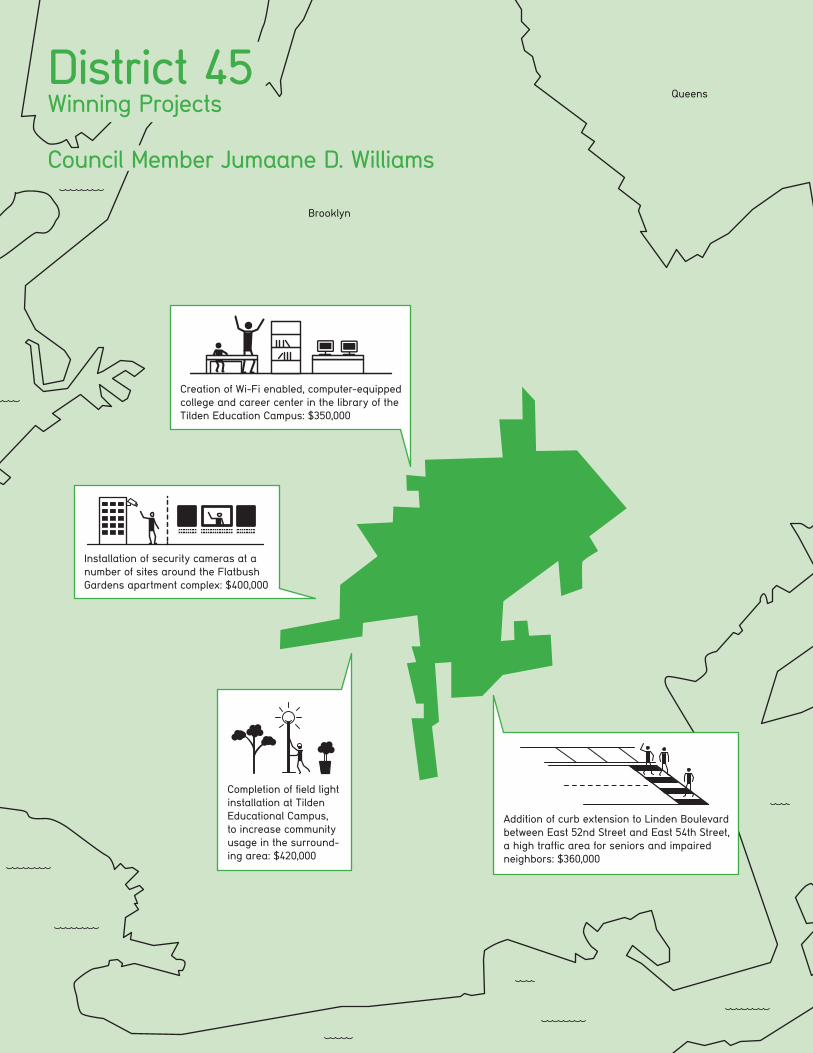
Installation of security cameras at a number of sites around the Flatbush Gardens apartment complex: $400,000
Creation of Wi-Fi enabled, computer-equipped college and career center in the library of the Tilden Education Campus: $350,000
Brooklyn
Queens
Addition of curb extension to Linden Boulevard between East 52nd Street and East 54th Street, a high traffic area for seniors and impaired neighbors: $360,000
Completion of field light installation at Tilden Educational Campus, to increase community usage in the surround-ing area: $420,000
District 45Winning Projects
Council Member Jumaane D. Williams

Appendix
51

Citywide Demographics CensusData
Neighborhood AssembliesN=924
Difference Neighborhood Assemblies Years 1 & 2
Budget DelegatesN=277
PBVoters N=7300
Diff. PB Voters Years 1 & 2
Voters in 2009 Local Elections
Difference between PB & 2009 Voters
GenderNA: N=833BD: N=272Voters: N=7182
Female 51% 66% +2% 60% 62% +0% 55% +7%
Male 49% 34% -2% 39% 38% +0% 40% -6%
Other N/A 0% -1% 1% 0% +0% N/A N/A
Race/EthnicityNA: N=808BD: N=257Voters: N=6704
Asian 15% 7% +4% 8% 8% +6% 7% +1%
Black 17% 30% -8% 27% 12% -8% 17% -5%
Latino/a 18% 18% +1% 12% 14% +0% 14% +0%
White 48% 46% +5% 49% 64% -2% 46% +18%
Other 3% 5% +0% 6% 4% +2% 1% +3%
Highest Level of EducationNA: N=462BD: N=207Voters: N=5679
Some High School or less
17% 5% +0% 6% 4% -2% N/A N/A
H.S. Diploma or GED
25% 14% +2% 12% 12% -5% N/A N/A
Associate/ Vocational Degree
6% 4% -2% 3% 1% -6% N/A N/A
Some College 15% 15% -1% 16% 12% -5% N/A N/A
Bachelor’s Degree 22% 26% -1% 27% 34% +11% N/A N/A
Graduate Degree 15% 36% +2% 36% 37% +6% N/A N/A
IncomeNA: N=692BD: N=245Voters: N=6381
Less than $10,000 9% 13% +3% 10% 6% +0% 1% +5%
$10,000-$14,999 6% 10% +4% 6% 5% +0% 5% +0%
$15,000-$24,999 10% 8% +0% 7% 5% -1% 8% -3%
$25,000-$34,999 9% 9% +0% 8% 7% -2% 15% -8%
$35,000-$49,999 12% 11% -2% 13% 9% -2% 25% -16%
$50,000-$74,999 16% 15% -3% 11% 12% -3% 39% -27%
$75,000-$99,999 12% 12% +1% 16% 13% -2% 6% +7%
$100,000-$149,000 14% 13% -3% 17% 19% +2% 1% +18%
$150,000 or more 12% 9% -1% 14% 25% +9% 0% +25%
Age NA: N=586BD: N=219Voters: N=6096
14 years or under 20% 3% -2% N/A N/A N/A N/A N/A
15 to 19 years 6% 12% +6% 1% 3% +1% N/A N/A
20 to 24 years 7% 5% +2% 2% 2% -1% N/A N/A
25 to 34 years 17% 12% +1% 12% 14% +2% 11% +3%
35 to 44 years 14% 16% -1% 20% 27% +5% N/A N/A
45 to 54 years 13% 18% -2% 18% 21% +0% N/A N/A
55 to 64 years 11% 15% -4% 22% 16% -3% N/A N/A
65+ years 12% 20% +0% 26% 19% -3% 30% -11%
LanguageNA: N=841BD: N=268Voters: N=6928
English 50% 94% +3% 86% +6% N/A N/A
Spanish 16% 8% +4% 6% -1% N/A N/A
Other 35% 3% -3% 4% +0% N/A N/A
52

8th District Demographics CensusData
Neighborhood AssembliesN=231
Difference Neighborhood Assemblies Years 1 & 2
Budget DelegatesN=62
PBVoters N=1066
Diff. PB Voters Years 1 & 2
Voters in 2009 Local Elections
Difference between PB & 2009 Voters
GenderNA: N=201BD: N=60Voters: N=1048
Female 53% 71% +2% 67% 68% +2% 60% +8%
Male 47% 29% -2% 32% 32% -2% 40% -8%
Other N/A 1% +0% 2% 0% +0% N/A N/A
Race/EthnicityNA: N=199BD: N=59Voters: N=937
Asian 6% 2% -1% 5% 3% +1% 2% +1%
Black 23% 50% +9% 42% 31% -3% 31% +0%
Latino/a 50% 39% -6% 34% 54% +4% 39% +15%
White 19% 12% -2% 17% 12% -5% 22% -10%
Other 2% 7% +2% 7% 5% +3% 0% +5%
Highest Level of EducationNA: N=97BD: N=44Voters: N=700
Some High School or less
16% 8% -2% 8% 18% +2% N/A N/A
H.S. Diploma or GED
21% 30% +10% 25% 27% +3% N/A N/A
Associate/ Vocational Degree
5% 6% -2% 2% 4% -4% N/A N/A
Some College 13% 20% +2% 27% 20% -1% N/A N/A
Bachelor’s Degree 17% 21% -2% 20% 21% +6% N/A N/A
Graduate Degree 15% 16% -5% 18% 12% -4% N/A N/A
IncomeNA: N=177BD: N=53Voters: N=912
Less than $10,000 18% 28% +5% 19% 21% -1% 4% +17%
$10,000-$14,999 9% 18% +4% 17% 20% +5% 24% -4%
$15,000-$24,999 13% 11% -2% 9% 13% +1% 14% -1%
$25,000-$34,999 9% 10% -3% 19% 14% +2% 25% -11%
$35,000-$49,999 12% 11% -2% 11% 11% -4% 11% +0%
$50,000-$74,999 13% 9% -3% 6% 9% -1% 20% -9%
$75,000-$99,999 8% 6% -1% 8% 3% -3% 1% +2%
$100,000-$149,000 8% 5% +2% 6% 6% +1% 1% +5%
$150,000 or more 9% 3% +0% 6% 3% +0% 0% +3%
Age NA: N=149BD: N=49Voters: N=857
14 years or under 20% 7% -7% N/A N/A N/A N/A N/A
15 to 19 years 7% 11% -1% 2% 7% +3% N/A N/A
20 to 24 years 8% 10% +8% 6% 5% -1% N/A N/A
25 to 34 years 19% 9% -3% 8% 17% +3% 11% +6%
35 to 44 years 14% 11% +4% 22% 21% +5% N/A N/A
45 to 54 years 12% 14% -4% 20% 16% -5% N/A N/A
55 to 64 years 10% 13% -2% 20% 15% -4% N/A N/A
65+ years 11% 25% +5% 20% 19% -2% 31% -12%
LanguageNA: N=841BD: N=59Voters: N=6928
English 47% 87% +8% 75% 62% -22% N/A N/A
Spanish 42% 19% +7% 9% 30% +17% N/A N/A
Other 11% 2% +2% 17% 8% +5% N/A N/A
53

19th District Demographics CensusData
Neighborhood AssembliesN=59
Budget DelegatesN=29
PBVoters N=682
Voters in 2009 Local Elections
Difference between PB & 2009 Voters
GenderNA: N=56BD: N=28Voters: N=670
Female 52% 75% 57% 63% 54% +9%
Male 48% 25% 36% 37% 46% -9%
Other N/A 0% 7% 0% N/A N/A
Race/EthnicityNA: N=52BD: N=26Voters: N=608
Asian 28% 31% 8% 13% 16% -3%
Black 2% 0% 0% 0% 1% -1%
Latino/a 15% 10% 8% 5% 9% -4%
White 53% 64% 69% 80% 65% +15%
Other 2% 0% 15% 2% 1% +2%
Highest Level of EducationNA: N=44BD: N=18Voters: N=541
Some High School or less
13% 0% 3% 2% N/A N/A
H.S. Diploma or GED
26% 16% 3% 17% N/A N/A
Associate/ Vocational Degree
6% 2% 0% 1% N/A N/A
Some College 16% 11% 24% 16% N/A N/A
Bachelor’s Degree 24% 34% 31% 35% N/A N/A
Graduate Degree 15% 36% 38% 30% N/A N/A
IncomeNA: N=44BD: N=25Voters: N=563
Less than $10,000 4% 2% 4% 1% 0% +1%
$10,000-$14,999 3% 2% 0% 3% 0% +3%
$15,000-$24,999 8% 5% 4% 5% 0% +5%
$25,000-$34,999 8% 11% 0% 4% 1% +3%
$35,000-$49,999 11% 18% 8% 11% 24% -13%
$50,000-$74,999 16% 14% 20% 15% 65% -50%
$75,000-$99,999 15% 11% 20% 17% 9% +8%
$100,000-$149,000 19% 25% 12% 23% 1% +22%
$150,000 or more 16% 11% 32% 23% 0% +23%
Age NA: N=47BD: N=18Voters: N=559
14 years or under 17% 2% N/A N/A N/A N/A
15 to 19 years 6% 2% 0% 1% N/A N/A
20 to 24 years 6% 2% 0% 1% N/A N/A
25 to 34 years 13% 13% 6% 5% 6% -1%
35 to 44 years 14% 28% 22% 17% N/A N/A
45 to 54 years 15% 15% 17% 18% N/A N/A
55 to 64 years 13% 15% 6% 19% N/A N/A
65+ years 17% 23% 50% 88% 39% +0%
LanguageNA: N=54BD: N=29Voters: N=661
English 46% 93% 97% 86% N/A N/A
Spanish 13% 0% 3% 2% N/A N/A
Other 42% 9% 0% 5% N/A N/A
54

23rd District Demographics CensusData
Neighborhood AssembliesN=108
Budget DelegatesN=52
PBVoters N=614
Voters in 2009 Local Elections
Difference between PB & 2009 Voters
GenderNA: N=95BD: N=52Voters: N=854
Female 49% 50% 48% 64% 54% +10%
Male 51% 51% 52% 36% 46% -10%
Other N/A 0% 0% 0% N/A N/A
Race/EthnicityNA: N=89BD: N=48Voters: N=799
Asian 37% 15% 21% 22% 15% +7%
Black 12% 10% 15% 8% 12% -4%
Latino/a 14% 8% 2% 6% 11% -5%
White 31% 61% 58% 61% 47% +14%
Other 6% 8% 6% 4% 1% +3%
Highest Level of EducationNA: N=57BD: N=38Voters: N=666
Some High School or less
11% 2% 0% 1% N/A N/A
H.S. Diploma or GED
26% 12% 10% 13% N/A N/A
Associate/ Vocational Degree
7% 0% 4% 1% N/A N/A
Some College 16% 16% 18% 18% N/A N/A
Bachelor’s Degree 25% 28% 29% 32% N/A N/A
Graduate Degree 15% 42% 39% 34% N/A N/A
IncomeNA: N=74BD: N=48Voters: N=719
Less than $10,000 4% 5% 4% 3% 1% +2%
$10,000-$14,999 3% 4% 2% 3% 0% +3%
$15,000-$24,999 8% 8% 8% 6% 0% +6%
$25,000-$34,999 9% 4% 2% 6% 4% +2%
$35,000-$49,999 10% 10% 10% 13% 18% -5%
$50,000-$74,999 18% 20% 19% 19% 68% -49%
$75,000-$99,999 15% 14% 19% 16% 7% +9%
$100,000-$149,000 20% 22% 25% 19% 2% +17%
$150,000 or more 13% 14% 10% 15% 0% +15%
Age NA: N=61BD: N=39Voters: N=727
14 years or under 16% 0% N/A N/A N/A N/A
15 to 19 years 6% 5% 0% 5% N/A N/A
20 to 24 years 6% 0% 0% 2% N/A N/A
25 to 34 years 14% 3% 5% 5% 7% -2%
35 to 44 years 14% 10% 3% 13% N/A N/A
45 to 54 years 16% 21% 23% 18% N/A N/A
55 to 64 years 13% 26% 26% 22% N/A N/A
65+ years 15% 34% 44% 36% 37% -1%
LanguageNA: N=94BD: N=48Voters: N=797
English 48% 97% 96% 89% N/A N/A
Spanish 12% 2% 0% 1% N/A N/A
Other 41% 7% 4% 11% N/A N/A
55
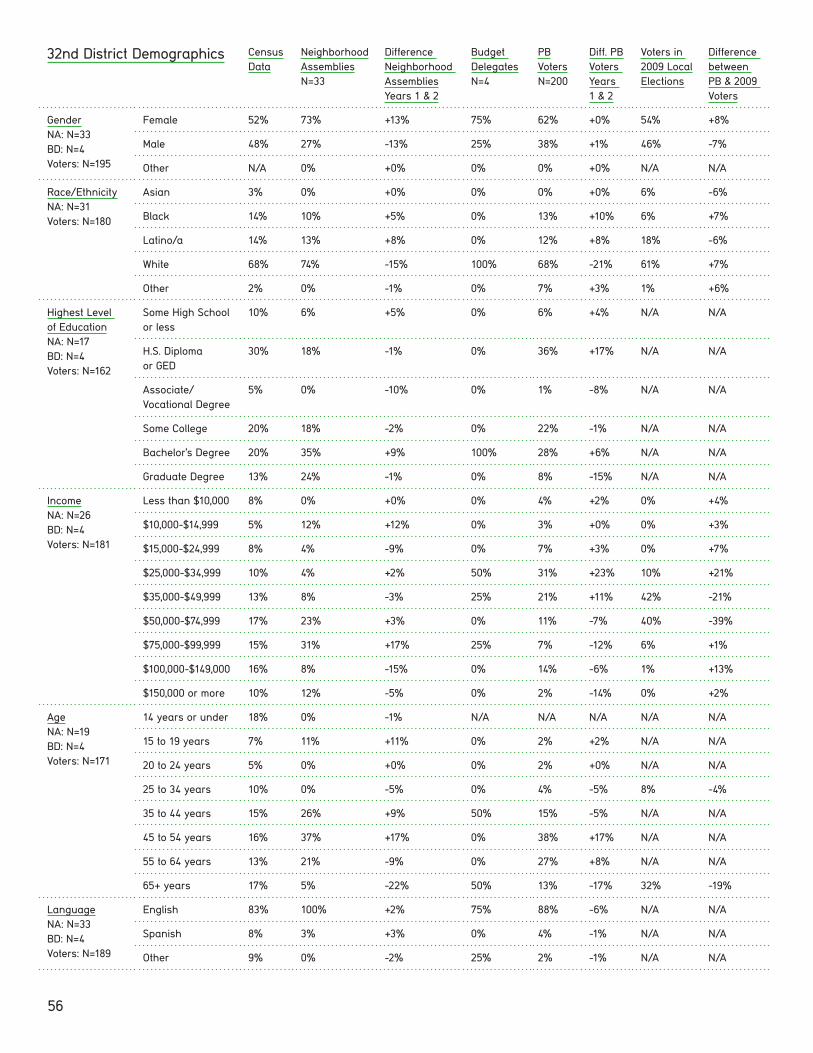
32nd District Demographics CensusData
Neighborhood AssembliesN=33
Difference Neighborhood Assemblies Years 1 & 2
Budget DelegatesN=4
PBVoters N=200
Diff. PB Voters Years 1 & 2
Voters in 2009 Local Elections
Difference between PB & 2009 Voters
GenderNA: N=33BD: N=4Voters: N=195
Female 52% 73% +13% 75% 62% +0% 54% +8%
Male 48% 27% -13% 25% 38% +1% 46% -7%
Other N/A 0% +0% 0% 0% +0% N/A N/A
Race/EthnicityNA: N=31Voters: N=180
Asian 3% 0% +0% 0% 0% +0% 6% -6%
Black 14% 10% +5% 0% 13% +10% 6% +7%
Latino/a 14% 13% +8% 0% 12% +8% 18% -6%
White 68% 74% -15% 100% 68% -21% 61% +7%
Other 2% 0% -1% 0% 7% +3% 1% +6%
Highest Level of EducationNA: N=17BD: N=4Voters: N=162
Some High School or less
10% 6% +5% 0% 6% +4% N/A N/A
H.S. Diploma or GED
30% 18% -1% 0% 36% +17% N/A N/A
Associate/ Vocational Degree
5% 0% -10% 0% 1% -8% N/A N/A
Some College 20% 18% -2% 0% 22% -1% N/A N/A
Bachelor’s Degree 20% 35% +9% 100% 28% +6% N/A N/A
Graduate Degree 13% 24% -1% 0% 8% -15% N/A N/A
IncomeNA: N=26BD: N=4Voters: N=181
Less than $10,000 8% 0% +0% 0% 4% +2% 0% +4%
$10,000-$14,999 5% 12% +12% 0% 3% +0% 0% +3%
$15,000-$24,999 8% 4% -9% 0% 7% +3% 0% +7%
$25,000-$34,999 10% 4% +2% 50% 31% +23% 10% +21%
$35,000-$49,999 13% 8% -3% 25% 21% +11% 42% -21%
$50,000-$74,999 17% 23% +3% 0% 11% -7% 40% -39%
$75,000-$99,999 15% 31% +17% 25% 7% -12% 6% +1%
$100,000-$149,000 16% 8% -15% 0% 14% -6% 1% +13%
$150,000 or more 10% 12% -5% 0% 2% -14% 0% +2%
Age NA: N=19BD: N=4Voters: N=171
14 years or under 18% 0% -1% N/A N/A N/A N/A N/A
15 to 19 years 7% 11% +11% 0% 2% +2% N/A N/A
20 to 24 years 5% 0% +0% 0% 2% +0% N/A N/A
25 to 34 years 10% 0% -5% 0% 4% -5% 8% -4%
35 to 44 years 15% 26% +9% 50% 15% -5% N/A N/A
45 to 54 years 16% 37% +17% 0% 38% +17% N/A N/A
55 to 64 years 13% 21% -9% 0% 27% +8% N/A N/A
65+ years 17% 5% -22% 50% 13% -17% 32% -19%
LanguageNA: N=33BD: N=4Voters: N=189
English 83% 100% +2% 75% 88% -6% N/A N/A
Spanish 8% 3% +3% 0% 4% -1% N/A N/A
Other 9% 0% -2% 25% 2% -1% N/A N/A
56
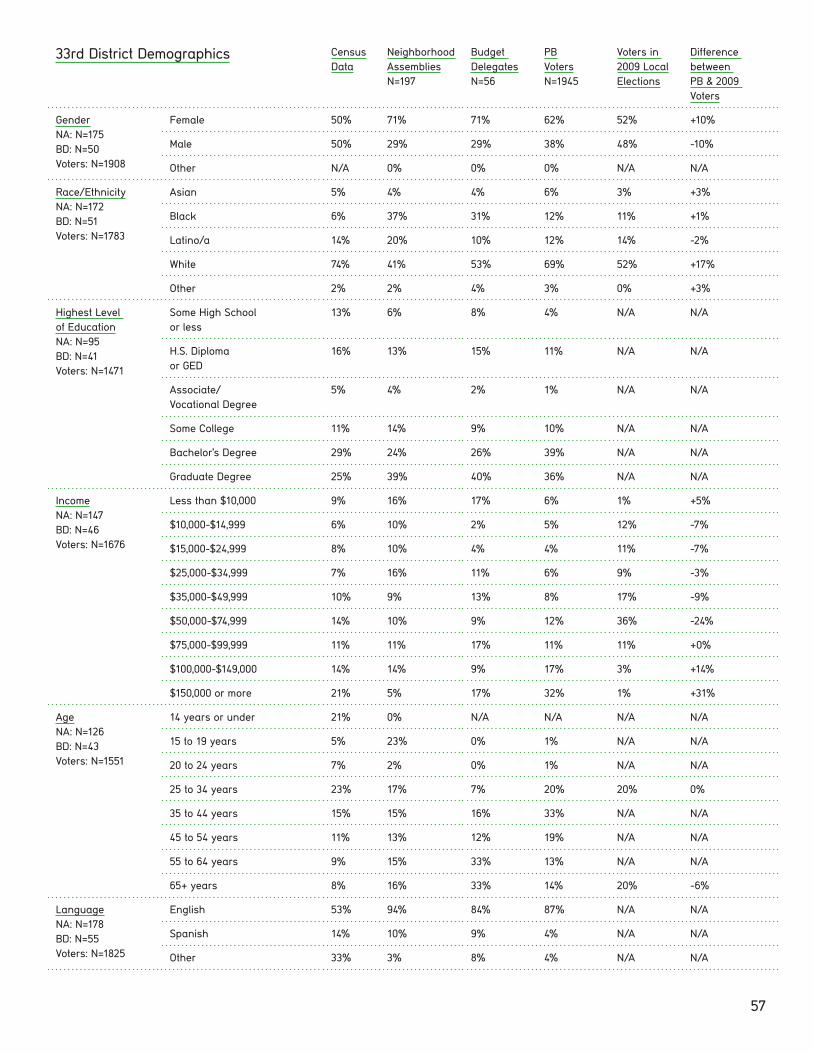
33rd District Demographics CensusData
Neighborhood AssembliesN=197
Budget DelegatesN=56
PBVoters N=1945
Voters in 2009 Local Elections
Difference between PB & 2009 Voters
GenderNA: N=175BD: N=50Voters: N=1908
Female 50% 71% 71% 62% 52% +10%
Male 50% 29% 29% 38% 48% -10%
Other N/A 0% 0% 0% N/A N/A
Race/EthnicityNA: N=172BD: N=51Voters: N=1783
Asian 5% 4% 4% 6% 3% +3%
Black 6% 37% 31% 12% 11% +1%
Latino/a 14% 20% 10% 12% 14% -2%
White 74% 41% 53% 69% 52% +17%
Other 2% 2% 4% 3% 0% +3%
Highest Level of EducationNA: N=95BD: N=41Voters: N=1471
Some High School or less
13% 6% 8% 4% N/A N/A
H.S. Diploma or GED
16% 13% 15% 11% N/A N/A
Associate/ Vocational Degree
5% 4% 2% 1% N/A N/A
Some College 11% 14% 9% 10% N/A N/A
Bachelor’s Degree 29% 24% 26% 39% N/A N/A
Graduate Degree 25% 39% 40% 36% N/A N/A
IncomeNA: N=147BD: N=46Voters: N=1676
Less than $10,000 9% 16% 17% 6% 1% +5%
$10,000-$14,999 6% 10% 2% 5% 12% -7%
$15,000-$24,999 8% 10% 4% 4% 11% -7%
$25,000-$34,999 7% 16% 11% 6% 9% -3%
$35,000-$49,999 10% 9% 13% 8% 17% -9%
$50,000-$74,999 14% 10% 9% 12% 36% -24%
$75,000-$99,999 11% 11% 17% 11% 11% +0%
$100,000-$149,000 14% 14% 9% 17% 3% +14%
$150,000 or more 21% 5% 17% 32% 1% +31%
Age NA: N=126BD: N=43Voters: N=1551
14 years or under 21% 0% N/A N/A N/A N/A
15 to 19 years 5% 23% 0% 1% N/A N/A
20 to 24 years 7% 2% 0% 1% N/A N/A
25 to 34 years 23% 17% 7% 20% 20% 0%
35 to 44 years 15% 15% 16% 33% N/A N/A
45 to 54 years 11% 13% 12% 19% N/A N/A
55 to 64 years 9% 15% 33% 13% N/A N/A
65+ years 8% 16% 33% 14% 20% -6%
LanguageNA: N=178BD: N=55Voters: N=1825
English 53% 94% 84% 87% N/A N/A
Spanish 14% 10% 9% 4% N/A N/A
Other 33% 3% 8% 4% N/A N/A
57

39th District Demographics CensusData
Neighborhood AssembliesN=161
Difference Neighborhood Assemblies Years 1 & 2
Budget DelegatesN=51
PBVoters N=2281
Diff. PB Voters Years 1 & 2
Voters in 2009 Local Elections
Difference between PB & 2009 Voters
GenderNA: N=152BD: N=50Voters: N=2255
Female 51% 59% -6% 46% 60% +0% 53% +7%
Male 49% 41% +6% 54% 40% +0% 47% -7%
Other N/A 0% +0% 0% 0% +0% N/A N/A
Race/EthnicityNA: N=150BD: N=49Voters: N=2165
Asian 13% 5% -2% 6% 6% +1% 4% +2%
Black 4% 5% +1% 8% 2% -1% 8% -6%
Latino/a 14% 5% -1% 8% 4% -2% 11% -7%
White 66% 81% +0% 78% 86% -1% 55% +31%
Other 3% 6% +0% 4% 3% -2% 0% +3%
Highest Level of EducationNA: N=88BD: N=45Voters: N=1978
Some High School or less
8% 1% -1% 0% 1% +0% N/A N/A
H.S. Diploma or GED
22% 1% -4% 2% 3% -1% N/A N/A
Associate/ Vocational Degree
5% 2% +0% 2% 1% +0% N/A N/A
Some College 13% 5% -1% 10% 6% +0% N/A N/A
Bachelor’s Degree 25% 25% -8% 28% 37% +7% N/A N/A
Graduate Degree 19% 66% +13% 59% 53% -5% N/A N/A
IncomeNA: N=121BD: N=47Voters: N=2112
Less than $10,000 8% 2% +0% 0% 2% +1% 0% +2%
$10,000-$14,999 6% 1% -1% 6% 1% +0% 0% +1%
$15,000-$24,999 10% 3% -1% 4% 2% +0% 13% -11%
$25,000-$34,999 8% 6% +1% 2% 3% -1% 18% -15%
$35,000-$49,999 12% 11% +1% 13% 6% +0% 23% -17%
$50,000-$74,999 15% 17% -4% 9% 10% -4% 37% -27%
$75,000-$99,999 12% 18% +4% 17% 17% +1% 8% +0%
$100,000-$149,000 15% 21% -5% 32% 25% -3% 0% +25%
$150,000 or more 15% 22% +4% 17% 36% +6% 0% +36%
Age NA: N=107BD: N=46Voters: N=2047
14 years or under 22% 2% +2% N/A N/A N/A N/A N/A
15 to 19 years 6% 10% +9% 0% 1% +1% N/A N/A
20 to 24 years 6% 4% +3% 2% 1% +0% N/A N/A
25 to 34 years 19% 18% +4% 24% 14% -1% 17% -3%
35 to 44 years 15% 19% -6% 35% 35% +4% N/A N/A
45 to 54 years 13% 22% +0% 20% 24% +1% N/A N/A
55 to 64 years 9% 14% -7% 15% 14% -4% N/A N/A
65+ years 10% 12% -4% 4% 11% -1% 19% -8%
LanguageNA: N=153BD: N=50Voters: N=2216
English 49% 99% +3% 96% 94% +1% N/A N/A
Spanish 13% 2% +2% 0% 1% -3% N/A N/A
Other 38% 9% -2% 4% 3% -2% N/A N/A
58

44th District Demographics CensusData
Neighborhood AssembliesN=44
Budget DelegatesN=1
PBVoters N=37
Voters in 2009 Local Elections
Difference between PB & 2009 Voters
GenderNA: N=40BD: N=1Voters: N=36
Female 50% 70% 100% 50% 52% -2%
Male 50% 30% 0% 50% 48% +2%
Other N/A 0% 0% 0% N/A N/A
Race/EthnicityNA: N=38BD: N=0Voters: N=31
Asian 17% 8% N/A 0% 7% -7%
Black 1% 3% N/A 0% 1% -1%
Latino/a 10% 3% N/A 3% 6% -3%
White 71% 76% N/A 94% 43% +51%
Other 1% 8% N/A 7% 1% +6%
Highest Level of EducationNA: N=19BD: N=1Voters: N=23
Some High School or less
24% 5% 0% 13% N/A N/A
H.S. Diploma or GED
32% 5% 0% 35% N/A N/A
Associate/ Vocational Degree
6% 16% 0% 0% N/A N/A
Some College 13% 16% 0% 9% N/A N/A
Bachelor’s Degree 16% 37% 100% 22% N/A N/A
Graduate Degree 10% 21% 0% 22% N/A N/A
IncomeNA: N=31BD: N=1Voters: N=26
Less than $10,000 10% 10% 0% 8% 0% +8%
$10,000-$14,999 8% 0% 0% 4% 1% +3%
$15,000-$24,999 14% 10% 0% 23% 25% -2%
$25,000-$34,999 12% 13% 0% 0% 39% -39%
$35,000-$49,999 13% 19% 0% 8% 28% -20%
$50,000-$74,999 18% 13% 0% 15% 5% +10%
$75,000-$99,999 10% 7% 0% 8% 0% +8%
$100,000-$149,000 10% 16% 100% 23% 1% +22%
$150,000 or more 6% 13% 0% 12% 0% +12%
Age NA: N=23BD: N=1Voters: N=28
14 years or under 25% 0% N/A N/A N/A N/A
15 to 19 years 8% 4% 0% 7% N/A N/A
20 to 24 years 8% 9% 0% 11% N/A N/A
25 to 34 years 14% 4% 0% 29% 15% +14%
35 to 44 years 11% 30% 100% 11% N/A N/A
45 to 54 years 11% 17% 0% 11% N/A N/A
55 to 64 years 10% 13% 0% 14% N/A N/A
65+ years 13% 22% 0% 18% 29% -11%
LanguageNA: N=41BD: N=1Voters: N=31
English 32% 98% 100% 79% N/A N/A
Spanish 9% 0% 0% 0% N/A N/A
Other 59% 17% 0% 21% N/A N/A
59

45th District Demographics CensusData
Neighborhood AssembliesN=91
Difference Neighborhood Assemblies Years 1 & 2
Budget DelegatesN=22
PBVoters N=222
Diff. PB Voters Years 1 & 2
Voters in 2009 Local Elections
Difference between PB & 2009 Voters
GenderNA: N=81BD: N=22Voters: N=218
Female 50% 64% +3% 68% 63% -1% 60% +3%
Male 50% 36% -3% 32% 37% +1% 40% -3%
Other N/A 0% +0% 0% 0% +0% N/A N/A
Race/EthnicityNA: N=77BD: N=20Voters: N=201
Asian 3% 1% +0% 0% 1% +0% 1% +0%
Black 76% 69% -14% 90% 89% +2% 79% +10%
Latino/a 8% 13% +9% 0% 4% -2% 4% +0%
White 11% 17% +10% 10% 4% -3% 11% -7%
Other 2% 9% +3% 0% 6% 0% 1% +5%
Highest Level of EducationNA: N=43BD: N=16Voters: N=138
Some High School or less
10% 12% +5% 13% 11% +2% N/A N/A
H.S. Diploma or GED
32% 14% +3% 19% 14% -7% N/A N/A
Associate/ Vocational Degree
9% 7% +0% 13% 4% -7% N/A N/A
Some College 20% 23% +0% 6% 21% +2% N/A N/A
Bachelor’s Degree 16% 28% +3% 25% 33% +13% N/A N/A
Graduate Degree 8% 16% -12% 25% 18% -1% N/A N/A
IncomeNA: N=72BD: N=21Voters: N=192
Less than $10,000 9% 11% +0% 10% 9% +1% 0% +9%
$10,000-$14,999 5% 15% +11% 5% 7% +2% 2% +5%
$15,000-$24,999 11% 7% +2% 14% 12% +4% 4% +8%
$25,000-$34,999 11% 4% -8% 5% 12% -2% 19% -7%
$35,000-$49,999 14% 15% -1% 24% 22% +4% 46% -24%
$50,000-$74,999 19% 26% +5% 10% 21% +1% 28% -7%
$75,000-$99,999 12% 11% -1% 14% 7% -7% 1% +6%
$100,000-$149,000 13% 6% -8% 14% 8% +2% 0% +8%
$150,000 or more 7% 4% -2% 5% 3% -4% 0% +3%
Age NA: N=54BD: N=19Voters: N=156
14 years or under 21% 0% -2% N/A N/A N/A N/A N/A
15 to 19 years 7% 11% +4% 11% 6% +2% N/A N/A
20 to 24 years 6% 7% +2% 0% 5% +1% N/A N/A
25 to 34 years 16% 15% +4% 26% 21% +7% 10% +11%
35 to 44 years 13% 13% -4% 11% 18% +4% N/A N/A
45 to 54 years 15% 24% +3% 16% 17% -4% N/A N/A
55 to 64 years 11% 11% -6% 26% 15% -6% N/A N/A
65+ years 11% 19% -2% 11% 17% -6% 29% -12%
LanguageNA: N=82BD: N=22Voters: N=215
English 70% 99% +5% 91% 91% -2% N/A N/A
Spanish 7% 2% +2% 0% 2% -4% N/A N/A
Other 23% 7% -5% 10% 6% -1% N/A N/A
60

1 . “About the City Council: Budget Process and Calendar.” The New York City Council. http://council.nyc.gov/html/about/budget.shtml
2. “City Council Changes as Adopted: Schedules A and B to the Fiscal Year 2014 Expense and Contract Budget Resolutions.” The New York City Council, http://www.nyc.gov/html/omb/downloads/pdf/adopt13_expreso.pdf
3. “Fiscal Year 2014 Changes to the Executive Capital Budget Adopted by the City Council.” The New York City Council, http://www.nyc.gov/html/omb/downloads/pdf/ adopt13_capreso.pdf
4. Soria, Chester. “The Guide to City Pork 2013.” Gotham Gazette, July 2, 2013. http://www.gothamgazette.com/index.php/government/4298-the-guide-to-city-pork-2013
5. “Supporting Detail for Fiscal Year 2014: Changes to the Executive Capital Budget Adopted by the City Council Pursuant to Section 254 of the City Charter.” The New York City Council. http://www.nyc.gov/html/omb/downloads/pdf/adopt13_capresowork.pdf
6. “American Community Survey 2005-2009-5 Year Estimates.” American Factfinder. http://factfinder2.census.gov/faces/nav/jsf/pages/index.xhtml
7. Ibid.8. “Decennial Census 2010.” American Factfinder. http://factfinder2.census.gov/faces/nav/jsf/
pages/index.xhtml9. “American Community Survey 2007-2011-5 Year Estimates.” American Factfinder.
http://factfinder2.census.gov/faces/nav/jsf/pages/index.xhtml10. “American Community Survey 2007-2011-5 Year Estimates.” American Factfinder.
http://factfinder2.census.gov/faces/nav/jsf/pages/index.xhtml11. “Decennial Census 2010.” American Factfinder. http://factfinder2.census.gov/faces/nav/jsf/
pages/index.xhtml12. “American Community Survey 2007-2011-5 Year Estimates.” American Factfinder.
http://factfinder2.census.gov/faces/nav/jsf/pages/index.xhtml13. “American Community Survey 2007-2011-5 Year Estimates.” American Factfinder.
http://factfinder2.census.gov/faces/nav/jsf/pages/index.xhtml14. “Decennial Census 2010.” American Factfinder. http://factfinder2.census.gov/faces/nav/jsf/
pages/index.xhtml15. “American Community Survey 2005-2009-5 Year Estimates.” American Factfinder.
http://factfinder2.census.gov/faces/nav/jsf/pages/index.xhtml16. “Decennial Census 2010.” American Factfinder. http://factfinder2.census.gov/faces/nav/jsf/
pages/index.xhtml17. “American Community Survey 2007-2011-5 Year Estimates.” American Factfinder.
http://factfinder2.census.gov/faces/nav/jsf/pages/index.xhtml.18. “American Community Survey 2005-2009-5 Year Estimates.” American Factfinder.
http://factfinder2.census.gov/faces/nav/jsf/pages/index.xhtml19. Ibid.20. Beyer, Gregory. “Borough Park, Brooklyn.” The New York Times, October 8, 2010.
http://www.nytimes.com/2010/10/10/realestate/10living.html?pagewanted=all 21. “Decennial Census 2010.” American Factfinder. http://factfinder2.census.gov/faces/nav/jsf/
pages/index.xhtml22. “American Community Survey 2007-2011-5 Year Estimates.” American Factfinder.
http://factfinder2.census.gov/faces/nav/jsf/pages/index.xhtml23. “American Community Survey 2007-2011-5 Year Estimates.” American Factfinder.
http://factfinder2.census.gov/faces/nav/jsf/pages/index.xhtml24. “American Community Survey 2005-2009-5 Year Estimates.” American Factfinder.
http://factfinder2.census.gov/faces/nav/jsf/pages/index.xhtml25. Ibid.
Endnotes
61
26. Wilkins, Jeff. “Keeping the Dream Alive: Immigrant Biz Owners Find Success in Niche Markets.” New York Daily News. January 26, 2010. http://www.nydailynews.com/new-york/bronx/keeping-dream-alive-immigrant-biz-owners-find-success-niche-markets-article-1.462915
27, Voter Activation Network, The New York State Engagement Table, 2009 City Council Election.28. W. Perez et al. “Civic Engagement Patterns of Undocumented Mexican Students, JHHE 9
(2010): 3 29. J. Rogers, “Civic Lessons: Public Schools and the Civic Development of Undocumented
Students and Parents,” Paper prepared for: “The Education of All of Our Children: The 25th Anniversary of Plyer v. Doe” at A Symposium at the Warren Institute, University of California, Berkeley.
30. Marked sometimes miss, rarely vote or never vote on the survey.31. Voter Activation Network, The New York State Engagement Table, 2009 City Council Election.31. Voter Activation Network, The New York State Engagement Table, 2009 City Council Election.33. Voter Activation Network, The New York State Engagement Table, 2009 City Council Election.34. Voter Activation Network, The New York State Engagement Table, 2009 City Council Election.35. Voter Activation Network, The New York State Engagement Table, 2009 City Council Election.36. Voter Activation Network, The New York State Engagement Table, 2009 City Council Election.37. Voter Activation Network, The New York State Engagement Table, 2009 City Council Election.38. Voter Activation Network, The New York State Engagement Table, 2009 City Council Election.39. Voter Activation Network, The New York State Engagement Table, 2009 City Council Election.40. Voter Activation Network, The New York State Engagement Table, 2009 City Council Election.41. Roberts, Sam. “Fewer Illegal Immigrants in New York, Study Finds.” The New York Times,
February 15, 2013. http://cityroom.blogs.nytimes.com/2013/02/15/immigration/42. W. Perez et al. “Civic Engagement Patterns of Undocumented Mexican Students, JHHE 9
(2010): 3 43. G.K. Ward & M. Marable, “Toward a New Civic Leadership: The Africana Criminal Justice
Project. SJ 20 (2003): 244. K.J. Fox, “Second Chances: A Comparison of Civic Engagement in Offender Reentry
Programs. CJR 35 (2010)
62

2012-13 PBNYC Steering Committee
Resource Organizations and ProfessorsCommunity Voices HeardThe Participatory Budgeting ProjectArts & Democracy ProjectCenter for Urban PedagogyCommunity Development Project of the Urban Justice CenterDemosFifth Avenue CommitteeFlatbush Development CorporationGetting Out & Staying OutNew York CivicNew York Immigration CoalitionNew Yorkers for ParksOrganizing Brooklyn CommunitiesPeople’s Production HousePratt Center for Community DevelopmentPratt Institute Programs for Sustainable Planning & DevelopmentProject for Public SpacesRight to the City AllianceMimi Abramovitz, CUNY, Hunter CollegeAndreas Hernandez, Marymount Manhattan CollegeCelina Su, CUNY, Brooklyn College
District RepresentativesMel Wymore, District 8David L Giordano, Children’s Aid Society, District 8Henry Euler, District 19Rhea O’Gorman, District 19Mary Boyd-Foy, District 23Eric Contreras, District 23John Cori, District 32Beverly Corbin, Families United for Racial and Economic Equality (FUREE), District 33Mamnun Haq, District 39Joni Kletter, District 39Joan Bakiriddin, District 45Hazel Martinez, District 45
City Council MembersCouncil Member David G. Greenfield, District 44Council Member Dan J. Halloran, District 19Council Member Brad Lander, District 39Council Member Stephen Levin, District 33Council Member Melissa Mark-Viverito, District 8Council Member Eric Ulrich, District 32Council Member Mark S. Weprin, District 23Council Member Jumaane D. Williams, District 45

About the Authors
The Community Development Project (CDP) at the Urban Justice Center strengthens the impact of grassroots organizations in New York City’s low-income and other excluded communities. We partner with community organizations to win legal cases, publish community-driven reports, assist with the formation of new organizations and cooperatives, and provide technical and transactional assistance. CDP’s Research and Policy Initiative partners with and provides strategic support to grassroots community organizations to build the power of their organizing and advocacy work.
For more information about CDP please visit: www.cdp-ny.org www.researchfororganizing.org
About the Designers
MTWTF is a graphic design studio specializing in publications, exhibitions, environmental graphics, and interactive work with clients in other disciplines such as art, architecture, and urban planning.