a perfromance-graded binder specification for surface
TRANSCRIPT

1. Report No.
FHWA/TX-02/1710-1
2. Government Accession No.
3. Recipient's Catalog No.
5. Report Date
October 2001
4. Title and Subtitle
A PERFORMANCE-GRADED BINDER SPECIFICATION FOR SURFACE TREATMENTS
6. Performing Organization Code
7. Author(s)
Amy L. Epps, Charles J. Glover, and Roberto Barcena
8. Performing Organization Report No. Report 1710-1
10. Work Unit No. (TRAIS)
9. Performing Organization Name and Address Texas Transportation Institute The Texas A&M University System College Station, Texas 77843-3135
11. Contract or Grant No. Project No. 0-1710 13. Type of Report and Period Covered
Research: August 1999-August 2001
12. Sponsoring Agency Name and Address
Texas Department of Transportation Research and Technology Implementation Office P. O. Box 5080 Austin Texas 78763-5080
14. Sponsoring Agency Code
15. Supplementary Notes Research performed in cooperation with the Texas Department of Transportation and the U.S. Department of Transportation, Federal Highway Administration. Research Project Title: Superpave Binder Tests for Surface Treatment Binders 16. Abstract
Many government agencies have used surface treatments as part of their maintenance and rehabilitation programs to improve surface quality and extend the service life of pavements. Traditional specifications for asphalt binders failed to characterize materials across the entire spectrum of temperatures experienced during production and construction and in-service and required properties that were not directly related to performance. As part of the Strategic Highway Research Program (SHRP) previous researchers developed the Superior Performing Asphalt Pavements (Superpave) or performance-graded (PG) asphalt binder specification in the 1990s to measure binder properties directly related to hot mix asphalt concrete (HMAC) performance and included material characterization at low, intermediate, and high temperatures. Direct application of the PG binder specification to binders used in surface treatments is not appropriate due to differences between surface treatments and HMAC in terms of distress types, construction methods, and exposure to environmental conditions. The objective of this study conducted for the Texas Department of Transportation was to develop a performance-based specification system for surface treatment binders that maximizes the use of existing equipment required in the PG system for HMAC binders. This new surface performance grading (SPG) specification assumes appropriate design and construction practices and considers only binder properties after construction. Researchers developed the SPG based on the identification of common distresses and analysis of physical properties of surface treatment binders measured at multiple temperatures and corresponding performance in specific environmental conditions. The final SPG includes suggested limiting values for high and low surface pavement design temperatures. Researchers recommend implementation of the new SPG after results from the suggested validation experiment are obtained. 17. Key Words
Binder, Specification, Surface Treatment, Chip Seal, Superpave
18. Distribution Statement
No restrictions. This document is available to the public through NTIS: National Technical Information Service 5285 Port Royal Road Springfield, Virginia 22161
19. Security Classif.(of this report)
Unclassified
20. Security Classif.(of this page)
Unclassified
21. No. of Pages
74
22. Price
Form DOT F 1700.7 (8-72) Reproduction of completed page authorized


A PERFORMANCE-GRADED BINDER SPECIFICATION
FOR SURFACE TREATMENTS
by
Amy L. Epps
Assistant Research Scientist Texas Transportation Institute
Charles J. Glover Research Engineer
Texas Transportation Institute
and
Roberto Barcena Graduate Assistant Researcher Texas Transportation Institute
Report 1710-1
Project Number 0-1710 Research Project Title: Superpave Binder Tests for Surface Treatment Binders
Sponsored by the Texas Department of Transportation
In Cooperation with the U. S. Department of Transportation
Federal Highway Administration
October 2001
TEXAS TRANSPORTATION INSTITUTE The Texas A&M University System College Station, Texas 77843-3135

v
DISCLAIMER
The contents of this report reflect the views of the authors, who are responsible for the
facts and the accuracy of the data presented herein. The contents do not necessarily reflect the
official view or policies of the Federal Highway Administration or the Texas Department of
Transportation. This report does not constitute a standard, specification, or regulation, nor it is
intended for construction, bidding, or permit purposes. Trade names were used solely for
information and not for product endorsement. The engineer in charge of this project was Charles
J. Glover, P.E. (Texas No. 48732).

vi
ACKNOWLEDGMENTS
The authors thank the Texas Department of Transportation (TxDOT) and the Federal
Highway Administration (FHWA) for their support in funding this research project. Special
thanks goes to Darren Hazlett of TxDOT for his effort in providing technical guidance, support,
and direction. Thanks also go to Geoff Rowe from Abatech for his guidance in analyzing some
of the laboratory testing data. Finally, thanks to Jacob Bell from the Texas Transportation
Institute (TTI) for his ongoing help in collecting field samples and conducting laboratory tests.
vii
TABLE OF CONTENTS
LIST OF FIGURES........................................................................................................................ ix
LIST OF TABLES .......................................................................................................................... x
CHAPTER 1. INTRODUCTION ................................................................................................... 1
CHAPTER 2. INFORMATION SEARCH..................................................................................... 5
LITERATURE REVIEW............................................................................................................. 5
Purpose and Benefits ................................................................................................................. 5
Distress ...................................................................................................................................... 6
Design........................................................................................................................................ 6
Aggregates................................................................................................................................. 7
Binders ...................................................................................................................................... 7
Desired Properties ..................................................................................................................... 8
EVALUATION SURVEY........................................................................................................... 9
CHAPTER 3. EXPERIMENTAL DESIGN ................................................................................. 11
MATERIAL SELECTION ........................................................................................................ 11
Binders .................................................................................................................................... 11
Aggregates............................................................................................................................... 11
LABORATORY TESTING....................................................................................................... 12
Recovery Process .................................................................................................................... 12
Effect of Emulsifying Agent on Aging ................................................................................... 15
PG Testing............................................................................................................................... 17
Adhesion Tests ........................................................................................................................ 18
PAVEMENT SURFACE TEMPERATURE ANALYSIS ........................................................ 18
High-Temperature Analysis .................................................................................................... 19
Low-Temperature Analysis..................................................................................................... 20
STANDARD PG TESTING AND GRADING ......................................................................... 23
MODIFIED PG TESTING AND GRADING ........................................................................... 23
Pavement Design Temperatures.............................................................................................. 23
High Pavement Design Temperature ................................................................................... 24
Low Pavement Design Temperature .................................................................................... 24
Temperature Increments....................................................................................................... 24
viii
Testing Procedures .................................................................................................................. 24
Aging States ......................................................................................................................... 25
Application Properties.......................................................................................................... 25
High-Temperature Testing ................................................................................................... 25
Intermediate-Temperature Testing....................................................................................... 26
Low-Temperature Testing.................................................................................................... 26
UPPER BOUND THEOREM.................................................................................................... 26
CHAPTER 4. SPG ANALYSIS AND RESULTS ....................................................................... 29
SPG SPRAYING ....................................................................................................................... 29
SPG HIGH TEMPERATURE ................................................................................................... 30
SPG INTERMEDIATE TEMPERATURE................................................................................ 32
SPG LOW TEMPERATURE .................................................................................................... 33
CHAPTER 5. SURFACE PERFORMANCE GRADING SPECIFICATION ............................. 41
GRADING RESULTS ............................................................................................................... 41
GRADE SELECTION PROCESS............................................................................................. 43
CHAPTER 6. FIELD VALIDATION EXPERIMENT ................................................................ 45
PROJECT IDENTIFICATION.................................................................................................. 45
MONITORING PROGRAM ..................................................................................................... 47
Sample Selection ..................................................................................................................... 47
Distress Measurement ............................................................................................................. 47
SCI Calculation ....................................................................................................................... 48
General Evaluation.................................................................................................................. 48
CHAPTER 7. CONCLUSIONS AND RECOMMENDATIONS ................................................ 51
REFERENCES.............................................................................................................................. 53
APPENDIX A EVALUATION SURVEYS................................................................................. 57
APPENDIX B EVALUATION SURVEY RESULTS ................................................................. 63
ix
LIST OF FIGURES
Figure Page
1 Overall Performance Ratings for Commonly Used Binders ........................10
2 Effect of Emulsifying Agent on Carbonyl Area ...........................................16
3 Effect of Emulsifying Agent on Viscosity ...................................................16
4 Effect of Emulsifying Agent on Hardening Susceptibility...........................17
5 Pavement Surface Temperatures in Texas ...................................................21
6 Failure Mechanism Analysis and Dimensionless Equation .........................28
7 Rotational Viscometer Results for Selected Asphalt Cements ....................30
8 DSR Results and Proposed Limiting Value .................................................32
9 CRS2P Aging on Route 255 Versus PAV Aging.........................................34
10 CRS2P Aging on Route 287 Versus PAV Aging.........................................35
11 CRS2P Aging in Environmental Room Versus PAV Aging .......................35
12 AC15-5TR Aging on Route 77 Versus PAV Aging ....................................36
13 AC15-5TR Aging on Route 183 Versus PAV Aging ..................................36
14 Flexural Stiffness Results and Proposed Limiting Value.............................37
15 m-value Results and Proposed Limiting Value............................................38
16 G* Results and Proposed Limiting Value ....................................................39
17 Flexural Stiffness and G* Relationship at Low Temperatures.....................40
18 CRS2 E and CRS2P E DSR Results ............................................................43

x
LIST OF TABLES
Table Page
1 Variables Included in Design Methodologies .............................................. 6
2 Kinematic Viscosities for a Successful Surface Treatment.......................... 8
3 Categories in Evaluation Survey .................................................................. 9
4 Selected Binders ...........................................................................................12
5 Evaluation of Emulsion Recovery Methods.................................................14
6 Performance Ratings for Surface Treatment Binders in Texas ....................22
7 UBT Results for High-Temperature Analysis ..............................................32
8 UBT Results for Intermediate-Temperature Analysis..................................33
9 Recommended Surface Performance Grading .............................................41
10 Standard PG and SPG Grades ......................................................................42
11 Example of the SPG Grade Selection Process .............................................44
12 Experimental Design for Asphalt Cements ..................................................46
13 SCI Components and Weights .....................................................................49

1
CHAPTER 1. INTRODUCTION
All highway networks deteriorate with time, traffic, and environmental conditions.
Eventually, pavements in this type of network require some type of maintenance or
reconstruction procedure to improve surface quality and extend service life. Many government
agencies have used surface treatments in this capacity as part of their maintenance and
rehabilitation programs. These treatments are versatile, from a temporary riding surface when
constructed on top of a base to a moderate maintenance job or a quick remedy before a major
reconstruction project. When properly designed and constructed, surface treatments are practical,
efficient, and economical solutions that improve the serviceability and ride quality.
Researchers and practitioners can employ the term surface treatment as a general
designation for a treatment utilized to restore the surface quality and useful life of a pavement.
Many pavement treatments including seal coats, fog seals, sand seals, slurry seals, and
microsurfacing fall under this general classification. Although these types of treatments are very
common, there is not a well-established consensus of the meaning of the term surface treatment.
The Texas Department of Transportation (TxDOT) defines a surface treatment as a single,
double, or triple application of asphaltic material, each covered with aggregate, constructed on
existing pavement or on a prepared base course (1). For this study, researchers used the term
surface treatment throughout the report consistent with the TxDOT definition.
In the state of Texas $324 million was budgeted for routine maintenance in 2001 (2). In
past years, The Pennsylvania Department of Transportation (PennDOT) had contemplated in its
maintenance program the application of seal coats to over 5000 miles (8047 km) of roadway (3).
In the state of Washington, approximately 50 percent of the highway system has some type of
surface treatment (4). With this extensive use of surface treatment applications, quality control
through specifications is important to ensure adequate performance.
Historically, researchers and practitioners classified asphalt binders in many different
ways. Two major classification methodologies based on penetration at 25 °C (American Society
for Testing and Materials (ASTM) D 946) and viscosity at 60 °C (ASTM D 3381) have been
commonly used to specify asphalt binders for many different applications, including hot-mix
asphalt concrete (HMAC) and surface treatments (5).

2
Asphalt binders are classified as viscoelastic materials, that is, their physical behavior has
both elastic and viscous components. Physical response of these materials is also dependent on
temperature and rate of loading. Penetration and viscosity classification systems were state-of-
the-art at their inception, but these systems have presented numerous deficiencies due to the fact
that they fail to characterize binders across the entire spectrum of temperatures experienced
during production, construction, and in-service temperature ranges. These systems are primarily
based on consistency and do not take into account long-term aging of the binders. In addition,
these measurements do not fully explain viscoelastic behavior or temperature susceptibility, and
required properties are not directly related to performance.
In 1987, the Congress of the United States of America established the Strategic Highway
Research Program (SHRP) as a research program to improve the overall performance of roads in
the U.S. One of the results of this endeavor was the development of a performance-based asphalt
binder specification that relates laboratory analysis to field performance (6). SHRP researchers
called this new classification method the Superior Performing Asphalt Pavements (Superpave) or
performance-graded (PG) binder specification. The Superpave PG specification included low-,
intermediate-, and high-temperature characterization of binders.
The SHRP Superpave specification accomplished many important advances. This system
included use of the Pressure Aging Vessel (PAV) to simulate long-term aging of the binder in the
field. Secondly, SHRP researchers developed new testing equipment to measure binder
properties directly related to performance in terms of resistance to the three primary forms of
distress in HMAC: rutting, fatigue cracking, and thermal cracking. Finally, the new specification
allowed for the possibility of selecting a level of reliability in the binder selection processes. The
industry regarded these three advances as substantial progress in asphalt binder characterization,
and researchers in this study recognized that this progress should be included in future
specifications.
SHRP researchers developed the Superpave classification system based on pavement
behavior and intended for HMAC design and material selection. Consequently, direct application
of this binder classification to other purposes, such as characterization of binders used in surface
treatments, would not be appropriate due to differences between surface treatments and HMAC
in terms of distress types, construction methods, and exposure to environmental conditions. The
main objective of this research project is to develop a performance-based specification system
3
and an associated grade selection process for surface treatment binders that considers these
differences and maximizes the use of existing equipment required in the Superpave PG
specification system. This new surface performance grading (SPG) specification assumes
appropriate design and construction practices and considers only binder properties after
construction.
To develop the SPG specification, researchers completed three major tasks. First, they
identified commonly used materials and properties related to distresses in surface treatments
other than those in the existing PG system through an information search. Secondly, they
designed a comprehensive experiment based on the collected information and completed an
extensive laboratory testing program. The third and final task they completed included analysis
of testing results and development of the proposed SPG specification and associated grade
selection process. They also proposed a field validation experiment. This report describes each
task in subsequent sections followed by conclusions and recommendations.

5
CHAPTER 2. INFORMATION SEARCH
The information search included a literature review and an evaluation survey of the
TxDOT districts.
LITERATURE REVIEW
Previous researchers conducted a number of studies to illustrate primary purposes,
benefits, and uses of surface treatments. Other research projects focused on common distresses,
design procedures, materials, and desired properties of binders used in surface treatments. This
section summarizes information included in these documents.
Purpose and Benefits
According to the literature, surface treatments are placed on existing pavements to (7,8):
• seal the existing bituminous surface against the entrance of water and air,
• enrich an existing dry or raveled surface,
• provide a skid-resistant surface,
• increase pavement visibility at night,
• reduce tire noise,
• improve demarcation of traffic lanes or other geometric features,
• attain a uniform appearing surface, and
• reduce the brittleness of the underlying layer of bituminous material.
These conditions may be related to bleeding; longitudinal, transverse, and block cracking; worn
aggregate; or lack of uniformity of the existing surface.
Besides maintenance purposes, surface treatments are commonly used on pavement bases
as provisional riding surfaces or protective seals against intrusion of water or other deleterious
substances until placement of a permanent HMAC layer. Surface treatments are also frequently
used before overlays as part of the rehabilitation process.

6
Distress
The most frequently observed distresses in surface treatments are as follows (4, 9):
• aggregate loss,
• flushing,
• windshield damage,
• excessive aggregate use, and
• streaking.
Researchers and practitioners normally attribute these distresses to improper construction
practices, design, materials, or misjudgment in the use of a surface treatment when another
corrective measure should have been applied.
Design
Researchers found several design methods in the literature (7, 9, 10, 11). Although
different procedures are employed in each method, they utilize some of the same factors.
Common variables included in each procedure are presented in Table 1.
Table 1. Variables Included in Design Methodologies.
Design Method Variables Considered
Kearby • Embedment • Dry unit weight of
aggregate • Board test result
• Traffic • Surface condition • Weather correction
McLeod • Loose unit weight of aggregate
• Voids in cover aggregate • Flakiness index
• Mean aggregate size • Average least
dimension
Minnesota DOT • Average particle diameter (Spread modulus)
Pennsylvania DOT
• Condition of existing pavement
• Spread modulus of the aggregate
• Absorption capacity of the aggregate
• Average daily traffic
Voids Percentage
• Bulk specific gravity • Average least dimension • Void reduction
• Skid resistance • Volatile factors
7
Aggregates
Several types of aggregates may be used in surface treatments. These include crushed
limestone, river rock, granite, lightweight aggregate, and scoria. Normally they should be
uniform in size with an average chip size under 0.5 in (12.7 mm). The aggregate should be clean
and with a minimal amount of fines. The stones should be able to withstand crushing, abrasion,
and wearing by traffic (12).
The literature includes numerous tests to evaluate and select aggregates to assure quality
surface treatments. Pennsylvania DOT recommends performing the following tests on aggregate:
sieve analysis, hydrometer analysis (percent finer than given size expressed as percent of total
aggregate), flakiness index, Los Angeles abrasion test, crush count (percent crushed faces), bulk
specific gravity, and absorption (13). Additionally, other international agencies have proposed
polishing, soundness, wearing, fragmentation, freeze-thaw, and a boiling test to evaluate
adequacy of aggregates (14).
Binders
A variety of asphalt cements and asphalt emulsions are currently used as binding
materials in surface treatments. The application of cutback materials has been discontinued
because of environmental issues. Generally, asphalt cements used in surface treatments tend to
be softer than the asphalts used in HMAC because they have to be sprayed. Many of these
asphalt cements normally used for this type of application contain some kind of modifier to
enhance high-temperature stiffness and ensure adequate performance. Emulsions are more
practical in the sense that they do not have to be heated as much to be sprayed, but users must
consider breaking and setting times.
The basis for binder selection in the design process is not well defined. Some agencies
always use the same type of binder without accounting for special conditions and circumstances
of each project. For example, Pennsylvania DOT specifications permit only the use of RS-2 and
CRS-2 emulsified asphalts and AC 2.5 as bituminous materials in surface treatments (3).

8
Another existing criterion to select binders includes viscosity. The literature recommends
a series of kinematic viscosity values for binders used in surface treatments (Table 2) (15).
Table 2. Kinematic Viscosities for a Successful Surface Treatment.
Kinematic Viscosity (cSt)
Problem Addressed
More than 1 x 10 6 Inadequate consistency for wetting More than 1 x 10 7 Inadequate compaction
Less than 2 x 10 4 Scuffing on curves or accelerating zones
Less than 6 x 10 3 Scuffing on average traffic condition
Vickaryous and Ferguson suggest a limiting value for emulsified asphalts to control
binder-aggregate adhesion based on the apparent viscosity of the residues obtained by distillation
(16). This proposed critical value is 50,000 Pa· s. According to this criterion, the temperature at
which this value is met is the lowest temperature at which this binder will inherently adhere to
the aggregate.
Other attempts to improve material selection correlated results of different adhesion tests
to aggregate retention and surface treatment performance. Previous researchers established these
relationships for the Wet Abrasion Test, Trafficulator, Seal Coat Debonding Test, and standard
and modified Vialit tests (15, 17, 18, 19, 20). To select the appropriate binders and aggregates
for surface treatments, Walsh et al. developed a modified version of the SHRP Net Adsorption
Test (NAT) (SHRP M-001) (21). This procedure measures the affinity and sensitivity of
aggregate-binder systems to moisture. Others developed surface energy measurements and
models that consider intermolecular forces to explain the affinity between aggregate and binders
(22, 23).
Desired Properties
Shook et al. recommended the following binder characteristics required for a successful
surface treatment (24):
• fluid enough to allow uniform application,
• fluid enough to develop initial adhesion between binder and aggregate as well as
to the underlying surface,

9
• viscous enough to retain aggregate when the road opens to traffic,
• viscous enough to prevent distortion in hot weather,
• fluid enough (not brittle) in cold weather to prevent aggregate loss,
• resistant to effects of sun light, and
• resistant to the combined action of traffic and water to avoid stripping.
EVALUATION SURVEY
As part of this study, researchers designed an evaluation survey to gather information
about surface treatment practices in the state of Texas. The questionnaires were sent to all 25
TxDOT districts, two contractors, and four asphalt materials experts. Questionnaires focused on
identifying frequently used materials and determining qualitative performance ratings of these
materials in different climates. Surface treatment materials were evaluated on a 1- to 5-point
scale (1 being poor and 5 good) in the following categories: water sealing, skid resistance, tire
noise, aggregate retention, overall performance, and cost-effectiveness. Table 3 lists all
categories evaluated in the questionnaires, and Appendix A provides actual survey forms.
Table 3. Categories in Evaluation Survey.
Categories Subcategories
Binder • Supplier • Modifiers Aggregate • Aggregate type
• Shape • Gradation
Surface Treatment
• Design methodology • Condition of existing
surface
• Criteria for material selection
Traffic • Traffic level • Turning/accelerating zones
Distresses • Distresses shown • Possible causes
Evaluation • Water sealant • Skid resistance • Tire noise • Appearance
• Aggregate retention • Overall performance • Cost-effectiveness
Other • Material selection • Binder properties
• General recommendations

10
The response rate for the survey was 76 percent for the TxDOT districts and 66 percent
for the contractors and asphalt materials experts. Figure 1 presents ratings for the overall
performance of commonly used surface treatment binders. Appendix B provides ratings for the
rest of the categories included in the evaluation survey.
Overall Performance
0
1
2
3
4
5
Binder
Rat
ing
AC-5
AC-5 w/Latex
AC-10
AC-10 w/Latex
AC-15-5TR
AC-15P
AC-20
CRS-2
CRS-2P
CRS-1P
HFRS-2
HFRS-2P
Figure 1. Overall Performance Ratings for Commonly Used Binders.

11
CHAPTER 3. EXPERIMENTAL DESIGN
Based on the information gathered from the literature and the evaluation survey,
researchers developed an extensive laboratory testing program. This design included material
selection of commonly used binders in surface treatments, investigation and analysis of recovery
processes for asphalt emulsions, and standard and modified PG testing of the selected binders.
MATERIAL SELECTION
Researchers selected binders and aggregates based on the information from the TxDOT
survey responses.
Binders
Researchers assembled a list of binders commonly used in Texas in surface treatments
and their suppliers. They contacted these suppliers to check for availability of their products and
requested materials. They also obtained binder materials known to have poor performance in
Texas climatic conditions. Table 4 lists asphalt binders selected and used in this study by a
supplier code letter.
Aggregates
Researchers obtained common aggregates in Texas using the same procedure followed
with the binders. For this study they acquired crushed limestone, precoated crushed limestone,
and lightweight aggregate.
Researchers performed a sieve analysis on the aggregates to verify the size of the
material. Based on the results of this analysis, they identified two crushed limestone materials of
TxDOT grade 4 and a single size (0.375 in (9.5 mm)) lightweight aggregate (1).

12
Table 4. Selected Binders.
Binder Type Supplier CRS1P E CRS1P B CRS1P D CRS2 E CRS2P E CRS2P B HFRS2 E HFRS2P E AC1.5 C AC3 C AC5 A AC5 F AC5 C AC5 with Latex (w/L) C AC10 A AC10 C AC10 with Latex (w/L) C AC15-5TR F AC15P F AC15P E AC20 C
LABORATORY TESTING
The extensive laboratory testing program included investigation of several recovery
processes for asphalt emulsions and evaluation of physical properties of binders measured using
existing PG equipment.
Recovery Process
A number of asphalt emulsions were among the binders commonly used in surface
treatments in Texas. Since this study focused only on the properties of the binder after
construction, recovery of the emulsion residue was required. Researchers revised several
recovery processes for asphalt emulsions to identify an efficient, repeatable method to recover
the residue from both unmodified and modified emulsions while minimizing aging and ensuring
13
removal of all water. Researchers considered oxidation during recovery, water removal, viscosity
of the residue, duration, and yield in selecting the recommended recovery method.
Researchers examined five recovery procedures: hot oven, rotavap, hot plate, stirred can,
and distillation. They evaluated several characteristics for each of the methods: efficiency of
removing water from the emulsion, preventing oxidation of the emulsion residue, and preventing
deterioration of polymeric additives important to enhancing performance.
The hot oven method followed closely that of ASTM D 244-97C with the exception that
nitrogen flowed over the sample to prevent asphalt oxidation and consequent hardening of the
material. Researchers placed beakers 8.4 cm in diameter and 12.3 cm in height, each containing
50 g of asphalt emulsion, in an oven at 163 °C with nitrogen flow. After two hours, they stirred
the emulsions well with a glass rod and allowed them to dry for another hour. They then stored
the residues in ointment tins for subsequent analysis.
The rotavap method followed that of ASTM D 5404-97 as modified by Burr et al. to
provide a sample collection container that is an ointment tin measuring 5.4 cm in diameter by 3.4
cm in height (25). Researchers placed 16 g of emulsion in the tin and evaporated for 30 minutes
with the rotavap bath at 100 °C and then for another 70 minutes with the bath temperature raised
to 163 °C. They provided a vacuum and nitrogen to prevent contact with oxygen and resulting
oxidation. This method was effective but produced a small amount of recovered material
(approximately 10 g).
The hotplate method was provided by TxDOT, Construction Division, Materials and
Tests. Researchers placed ointment tins, each containing 20 g of emulsion, on a hot plate set to
180 °C. They stirred the emulsion periodically for one hour. With this method, researchers were
particularly concerned with the effectiveness of water removal and asphalt oxidation.
ASTM 244-97C documents the distillation method. Researchers placed emulsion (200 g)
into an aluminum alloy still and heated it with a ring burner. They distilled the material at 215 °C
for 45 to 60 minutes and then at 260 °C for another 15 minutes.
Researchers developed the stirred can method for this study. This method recovered the
largest amount of asphalt of any of the methods. Researchers placed emulsion (1250 g) in a
gallon can and wrapped the can in heating tape. They used an impeller to continuously stir the
emulsion. Then they bubbled nitrogen through the residue to hasten water removal as soon as
possible without inducing foaming.
14
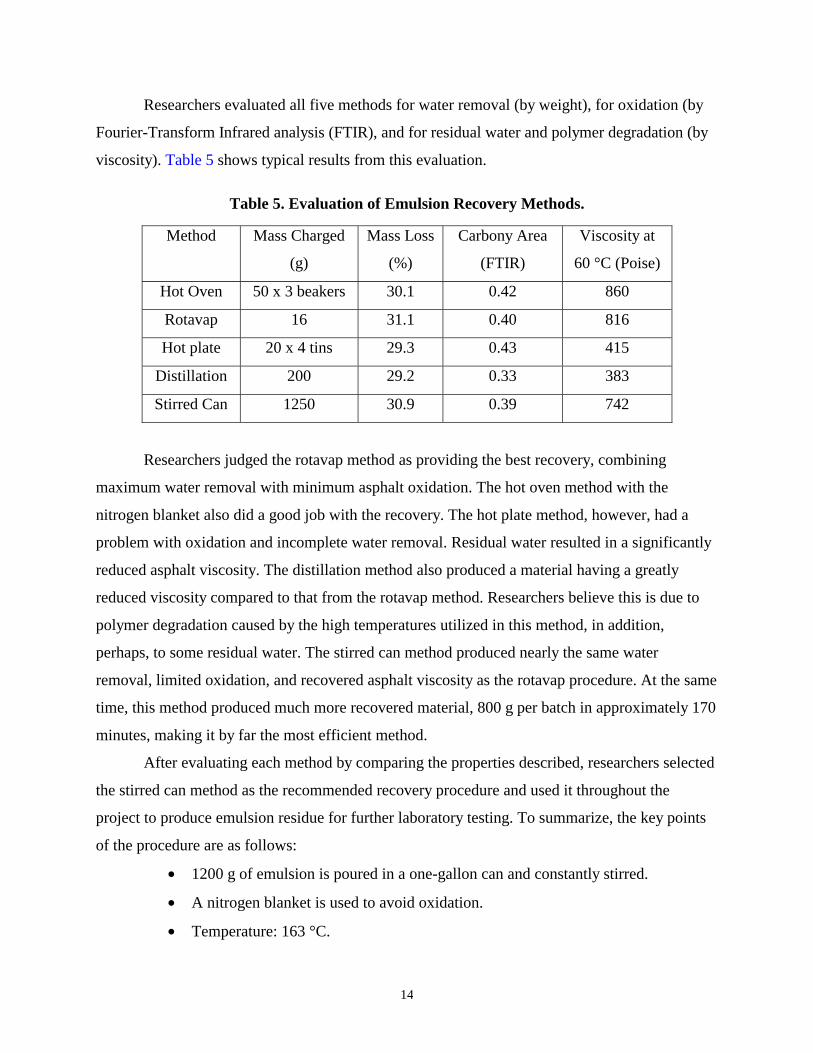
Researchers evaluated all five methods for water removal (by weight), for oxidation (by
Fourier-Transform Infrared analysis (FTIR), and for residual water and polymer degradation (by
viscosity). Table 5 shows typical results from this evaluation.
Table 5. Evaluation of Emulsion Recovery Methods.
Method Mass Charged
(g)
Mass Loss
(%)
Carbony Area
(FTIR)
Viscosity at
60 °C (Poise)
Hot Oven 50 x 3 beakers 30.1 0.42 860
Rotavap 16 31.1 0.40 816
Hot plate 20 x 4 tins 29.3 0.43 415
Distillation 200 29.2 0.33 383
Stirred Can 1250 30.9 0.39 742
Researchers judged the rotavap method as providing the best recovery, combining
maximum water removal with minimum asphalt oxidation. The hot oven method with the
nitrogen blanket also did a good job with the recovery. The hot plate method, however, had a
problem with oxidation and incomplete water removal. Residual water resulted in a significantly
reduced asphalt viscosity. The distillation method also produced a material having a greatly
reduced viscosity compared to that from the rotavap method. Researchers believe this is due to
polymer degradation caused by the high temperatures utilized in this method, in addition,
perhaps, to some residual water. The stirred can method produced nearly the same water
removal, limited oxidation, and recovered asphalt viscosity as the rotavap procedure. At the same
time, this method produced much more recovered material, 800 g per batch in approximately 170
minutes, making it by far the most efficient method.
After evaluating each method by comparing the properties described, researchers selected
the stirred can method as the recommended recovery procedure and used it throughout the
project to produce emulsion residue for further laboratory testing. To summarize, the key points
of the procedure are as follows:
• 1200 g of emulsion is poured in a one-gallon can and constantly stirred.
• A nitrogen blanket is used to avoid oxidation.
• Temperature: 163 °C.
15
• Time: 170 minutes.
• Yield: approximately 800 g.
Effect of Emulsifying Agent on Aging
Oxidative aging is a critical factor in establishing asphalt durability. As asphalts oxidize,
both their viscosity and their elastic stiffness increase, thereby leading to a more brittle material.
After extensive aging, the binder cannot sustain normal loads (due either to traffic or temperature
fluctuations) without fracture. In addition, aging produces more polar materials and this likely
leads to increased susceptibility to moisture damage.
Asphalts at the surface of a pavement are especially susceptible to aging because they are
exposed to the highest temperatures and therefore the most rapid aging rates. Furthermore, they
are subjected to the greatest concentrated loads, exerted at the edge of a vehicle’s tire. So,
researchers are especially concerned if a surface treatment binder is extraordinarily susceptible to
oxidative aging. In this regard, they are interested if emulsifying agent, or other components in
surface treatment binders not in conventional asphalts, adversely affects the aging rate and
thereby leads to premature failure.
In a brief study researchers looked for evidence to determine if emulsion residues age
differently from their base asphalts. They aged a base CRS-1P material and its corresponding
recovered emulsion residue at 60 °C for two, four, and six months and determined the extent of
oxidation (carbonyl area) and hardening (η*) for each aging time. They measured dynamic
viscosity data over a range of frequencies and temperatures and determined a 60 °C master
curve. From this curve, researchers obtained the dynamic viscosity at 60 °C and 0.1 rad/s that
represents the low shear rate limiting viscosity.
Figures 2 through 4 show the results for the base CRS-1P material and its corresponding
recovered emulsion residue. Figures 2 and 3 illustrate carbonyl area and viscosity increases with
aging time. Figure 4 shows how hardening is related to oxidation. The slopes of these plots
represent the rate of oxidation, the rate of hardening, and the hardening susceptibility,
respectively. Each of these properties is characteristic of the asphalt, and differences in aging
reactions or mechanisms caused by the emulsifier (or polymer, or other component) likely would
be evident in one or more of these plots. These plots also show data points for unaged material,

16
but these points are not included in the trendlines because it is typical for asphalts to undergo
short-term rapid aging by a different mechanism.
102
103
104
105
106
0 .0 1 .0 2.0 3 .0 4.0 5 .0 6 .0 7.0 8 .0
E R G O N C R S -1PE R G O N C R S -1P BAS E
y = 4 e+03 * e^(0 .31x) R = 0 .99
y = 3 e+03 * e^(0 .29x) R = 0 .99
η∗
, p
ois
e (
14
0oF
)
T ime , months
N O N R TFO T E M U LS IO N S
60 C
)
Figure 3. Effect of Emulsifying Agent on Viscosity.
0.0
0 .50
1.0
1.5
2.0
0.0 1.0 2.0 3.0 4.0 5.0 6.0 7.0 8.0
ER G O N C R S-1P BASEER G O N C R S-1P
y = 0 .62 + 0.062x R = 1
y = 0 .73 + 0.08x R = 0 .98
Ca
rbo
nyl
Are
a
T ime , months
N O N R TFO T EM U LSIO N S
Figure 2. Effect of Emulsifying Agent on Carbonyl Area.

17
Researchers noted that for all three of these plots, the slopes are almost equivalent for the
base material and the recovered emulsion residue. The hardening rates are virtually identical,
while the oxidation rates and hardening susceptibilities differ from their mean by approximately
10 percent.
Although this was a very limited study, researchers conclude that these results strongly
suggest that the added components in emulsions do not affect an asphalt’s oxidation mechanism
or kinetics.
PG Testing
The PG binder specification utilizes procedures and laboratory equipment that measure
fundamental physical properties related to the performance of HMAC. Researchers utilized
equipment from this specification to measure physical properties of selected surface treatment
binders to develop the SPG specification. First, they completed the standard PG testing
102
103
104
105
106
0.0 0 .50 1.0 1.5 2.0
ERG O N C R S-1P BASEERG O N C R S-1P
y = 1 .7e+02 * e ^(4.6x) R = 0 .98
y = 2 .9e+02 * e ^(3.7x) R = 0 .97
η∗
, p
ois
e (
14
0oF
)
C arbonyl Area
N O N R TFO T EM U LSIO N S
60 C
)
Figure 4. Effect of Emulsifying Agent on Hardening Susceptibility.

18
procedure for all selected binders. Then, they utilized a Modified Performance Grading testing
procedure that takes into consideration the differences between HMAC and surface treatments
for the same materials.
Adhesion Tests
Although adhesion characteristics are not directly related to the physical properties of
binders, they are important and have some influence in controlling the performance of surface
treatments.
Researchers conducted an evaluation of two adhesion tests (Vialit Test and a Wet
Abrasion Test) to determine their feasibility and applicability (17, 19, 26). They prepared binder
and aggregate samples and tested these materials combined based on the results of a chip seal
design (11). They determined properties of the aggregates as part of the design methodology.
Vialit and Wet Abrasion trial results did not provide conclusive information in terms of
distinguishing between good and poor performance between different materials. In addition, the
test results were not consistent. Because of these problems and the rather qualitative nature of
these tests, researchers decided to take a different approach to assess relevant binder properties.
PAVEMENT SURFACE TEMPERATURE ANALYSIS
The PG binder specification is based on physical properties that are directly related to
performance. The PG system has constant limiting values for all binders and specifies grades
based on the maximum and minimum test temperatures at which the binders meet these limiting
values (6). These maximum and minimum temperatures represent the range of pavement
temperatures over which the binders are expected to perform adequately. Since the PG grading
system depends on pavement temperatures, researchers completed an analysis of the climate in
Texas.
The standard PG procedure specifies that the high pavement design temperature be
determined 20 mm below the surface. The low pavement design temperature is found at the
pavement surface (6). For this analysis, researchers calculated both high and low pavement
temperatures at the pavement surface to reflect critical conditions for surface treatments.
19
High-Temperature Analysis
Researchers analyzed climate information obtained from the LTPPBind V2.1 database to
determine high and low pavement surface temperatures in Texas. They used the SHRP high-
temperature model to calculate pavement surface temperature using the high 7-day air
temperature and the latitude of the listed weather stations in Texas. This model calculates surface
pavement temperature based on the net heat flow at the pavement surface (27):
Net heat flow = [direct solar radiation] + [diffuse radiation] ± [convection] ±
[conduction] - [black-body radiation]
To compute the temperature of the hottest 7-day period, the SHRP model also takes into account
solar absorption, radiation transmission through air, atmospheric radiation, and wind speed. The
values used in the model for these variables are listed as follows (27):
• Solar absorption = 0.90.
• Transmission through air = 0.81.
• Atmospheric radiation = 0.70.
• Wind speed = 4.5 m/s.
The SHRP model then uses the following equation to calculate pavement temperature as
a function of air temperature and latitude, where temperature at the surface (Tsurf) and air
temperature (Tair) are expressed in °C and the latitude (lat) is in degrees (27):
Tsurf - Tair = -0.00618 lat2 + 0.2289 lat + 24.4 (1)
This model also considers the possibility of calculating temperatures at different levels of
reliability (Eq. 2). Tpav is the high pavement temperature at a particular reliability level (°C), Tsurf
is the high pavement surface temperature (°C), Sair is the standard deviation of the high 7-day
mean air temperature (°C), and z is the z-value of the standard normal distribution. Assuming a
normal distribution for the temperatures in Texas, researchers calculated pavement surface
temperatures for 50 and 98 percent reliability levels for all weather stations in Texas using the
following equation:
Tpav = Tsurf + z � Sair (2)
20
They then separated weather stations into TxDOT districts and determined the average high
pavement surface temperature at the corresponding level of reliability for each district.
Low-Temperature Analysis
Researchers utilized the SHRP low-temperature model for the low-temperature analysis.
This model assumes that the pavement surface temperature is equal to the minimum air
temperature as shown in the following equation (27):
Tsurf = Tair (3)
They also used the following SHRP model for low temperature described previously to
determine the average low pavement surface temperature at 50 and 98 percent reliability levels
for all TxDOT districts:
Tpav = Tair - z � Sair (4)
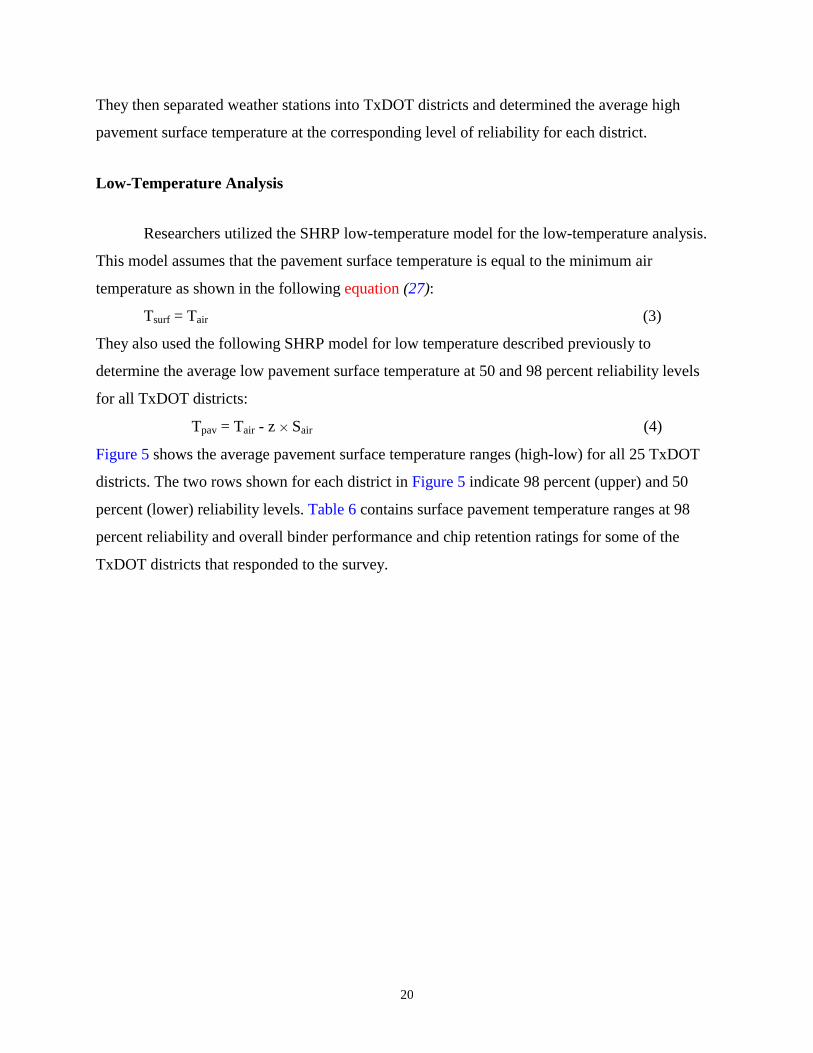
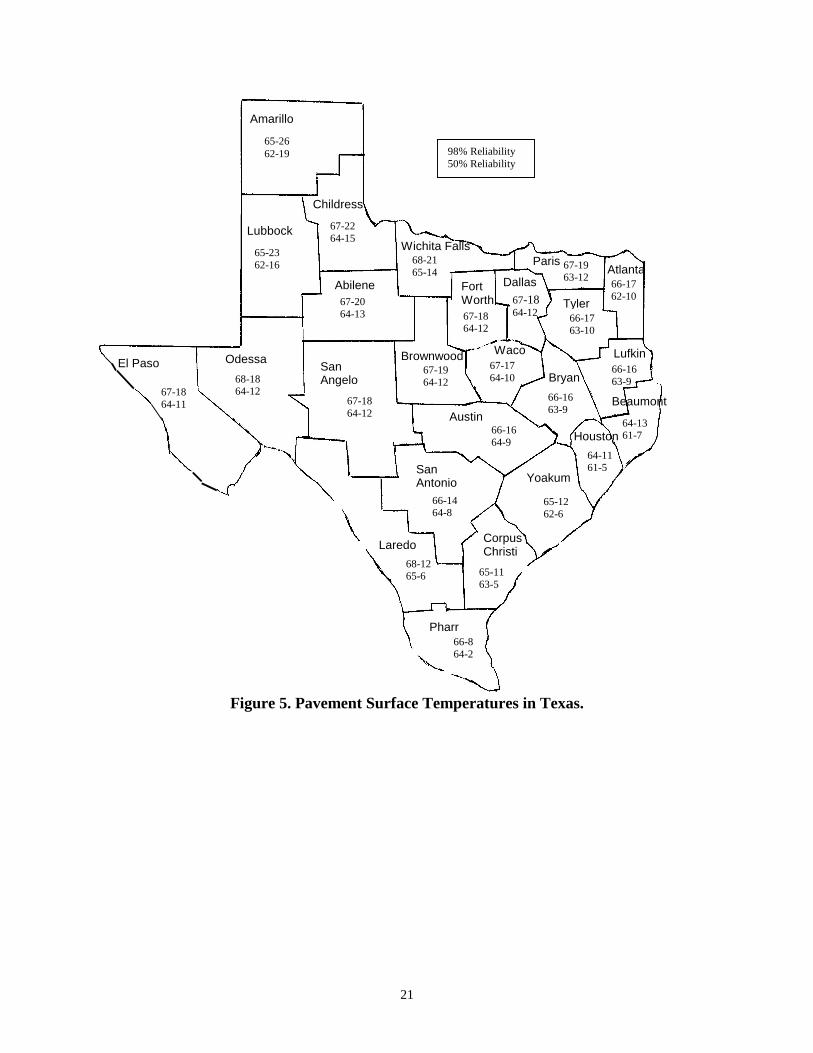
Figure 5 shows the average pavement surface temperature ranges (high-low) for all 25 TxDOT
districts. The two rows shown for each district in Figure 5 indicate 98 percent (upper) and 50
percent (lower) reliability levels. Table 6 contains surface pavement temperature ranges at 98
percent reliability and overall binder performance and chip retention ratings for some of the
TxDOT districts that responded to the survey.
21
Figure 5. Pavement Surface Temperatures in Texas.
Amarillo
65-26 62-19
Lubbock
65-23 62-16
Childress
67-22 64-15
67-18 64-11
El Paso Odessa
68-18 64-12
67-18 64-12
San Angelo
Abilene 67-20 64-13
Laredo 68-12 65-6
Pharr 66-8 64-2
Corpus Christi
65-11 63-5
San Antonio
66-14 64-8
Austin 66-16 64-9
Yoakum
65-12 62-6
Houston 64-11 61-5
Beaumont
64-13 61-7
66-16 63-9
Bryan 67-17 64-10
Waco
67-19 64-12
Brownwood
Wichita Falls 68-21 65-14
Fort Worth 67-18 64-12
Dallas 67-18 64-12
Paris 67-19 63-12
Tyler 66-17 63-10
Atlanta 66-17 62-10
Lufkin 66-16 63-9
98% Reliability 50% Reliability

22
Table 6. Performance Ratings for Surface Treatment Binders in Texas.
Binder Summary t (representative districts)
District
Surface Temperature Range
(98% reliability) °C
Binder Type-Supplier
Overall Rating
Chip Retention
Performance
AC15P F 5 5 Good AC15-5TR F 5 5 Good Laredo 68-12 AC5 F 4 4 Good AC15P F 4 4 Good
Bryan 66-16 AC15-5TR F 4 4 Good CRS2, CRS2P E 4 4 Good AC15-5TR F 5 5 Good Brownwood 67-19 AC5 F 4 4 Good AC5 w/L F 3 3 Good AC15-5TR F 5 5 Good Childress 67-22 AC5 F 4 4 Good CRS2, CRS2P E 5 5 Good AC10 w/L C 5 5 Good AC15P E 4 3 Good
Fort Worth 67-18
AC15-5TR F 5 5 - AC5 A 2 1 Fair AC10 A 2 1 Fair CRS2 E 2 2 Fair CRS2P E 3 3 Fair AC15-5TR F 4 4 Fair AC15P E 4 4 Fair
Amarillo 65-26
AC5 w/L C 3 3 Fair San Angelo 67-18 AC15P F 4 4 Good
AC5 C 2 2 Fair AC10 C 2 2 Fair AC5 w/L C 4 4 Good
Abilene 67-20
AC15-5TR F 5 5 Good CRS2P B 4 5 Good
Atlanta 67-17 AC15-5TR F 4 5 Good AC15-5TR F 5 5 Good AC15P F 5 5 Good HFRS2 E - - Fair
Austin 66-16
HFRS2P E 2 2 Fair CRS2P E 5 5 Good AC5 w/L C 4 4 Good Beaumont 64-13 AC10 C 4 4 Good
Dallas 67-18 AC5 w/L C 3 3 Fair AC15P F 4 4 Good AC15-5TR F 4 4 Fair Yoakum 65-12 CRS1P D 2 2 Poor
Note: - Information not provided

23
STANDARD PG TESTING AND GRADING
Researchers followed procedures described in American Association of State Highway
and Transportation Officials (AASHTO) MP1 to grade asphalt cements and emulsion residues
(28). They used the rotational viscometer (AASHTO TP48) at 135 °C and 20 rpm to measure
viscosity of unaged asphalt cement binders to ensure pumping and handling capabilities (28).
They performed Dynamic Shear Rheometer (DSR) tests (AASHTO TP5) on unaged and short-
term aged material from the Rolling Thin Film Oven Test (RTFOT) (ASTM D 2872) (5, 28).
The results from these DSR tests in terms of complex modulus (G*) and phase a���������
established the high-temperature grade of the binders.
Researchers long-term aged material in the PAV (AASHTO PP1) that had previously
been short-term aged in the RTFOT (ASTM D2872). They then conducted DSR tests to
determine intermediate-temperature properties (28). Flexural stiffness and m-values obtained
from Bending Beam Rheometer (BBR) testing (AASHTO TP1) of short- and long-term aged
material established the low-temperature grade (28).
MODIFIED PG TESTING AND GRADING
The Modified Performance Grading system consisted of standard PG testing as described
in AASHTO MP1 with some modifications. These modifications account for differences
between surface treatments and HMAC in terms of distress types, construction methods, and
exposure to environmental conditions. This section describes the modifications.
Pavement Design Temperatures
Pavement temperatures play a key role in the PG system because the grading process
itself is based upon these temperatures. Researchers conducted an evaluation of the PG design
temperatures to assess whether these correspond to field conditions for surface treatments.

24
High Pavement Design Temperature
As mentioned, the standard PG procedure specifies that the high pavement design
temperature be calculated 20 mm below the surface. This depth represents critical conditions to
account for rutting in the standard PG system. Based on the information search, researchers did
not consider rutting a common distress in surface treatment applications. Thus, instead of using
pavement temperatures at 20 mm, they included pavement temperatures measured at the surface
in the Modified Performance Grading system for the high pavement design temperature, since
these temperatures reflect field conditions for surface treatments.
Low Pavement Design Temperature
The standard PG procedure uses temperatures measured at the pavement surface to
establish the low pavement design temperature. This practice simulates critical field conditions
for surface treatments also; therefore researchers considered the same low pavement design
temperature appropriate for the Modified Performance Grading system.
Temperature Increments
Based on the results from the pavement temperature analysis in Texas, researchers set test
temperatures for the Modified Performance Grading system to 3 °C increments for both high and
low design temperatures, as opposed to the 6 °C increments utilized in the standard PG
specification. They selected narrower temperature ranges to discriminate performance on a finer
scale.
Testing Procedures
Researchers also altered some of the aging and testing procedures and conditions
included in the standard PG system in the Modified Performance Grading to simulate conditions
observed in surface treatments.
25
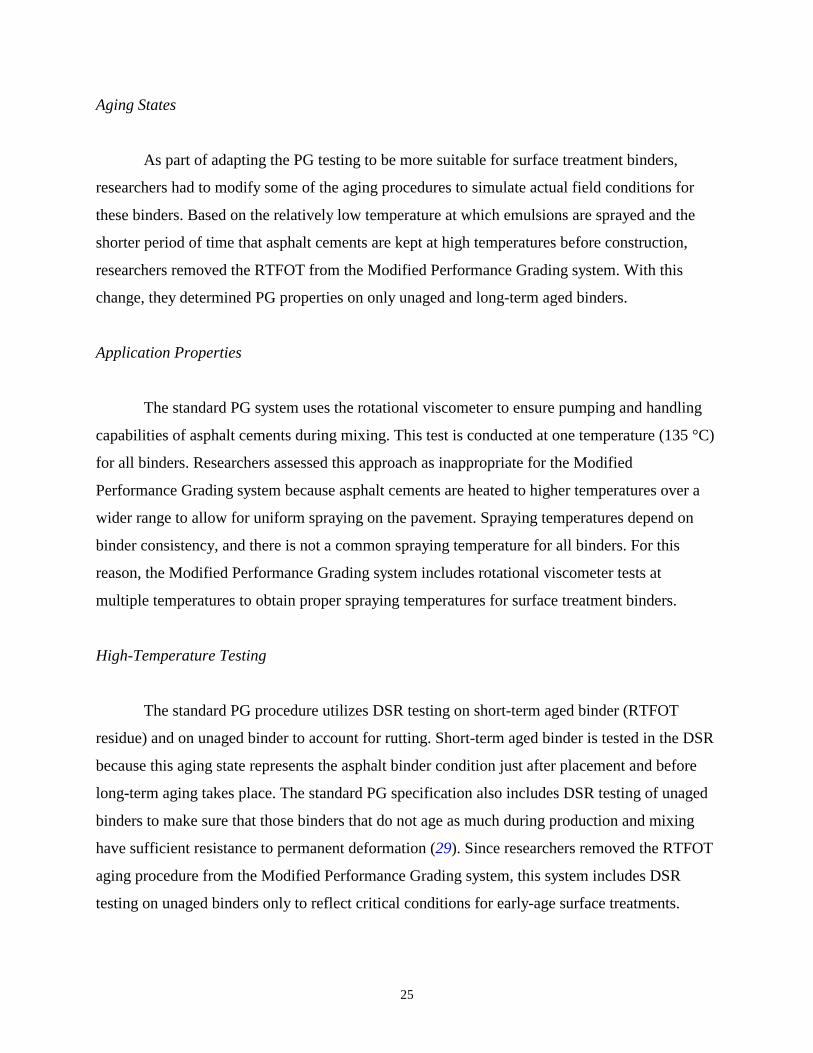
Aging States
As part of adapting the PG testing to be more suitable for surface treatment binders,
researchers had to modify some of the aging procedures to simulate actual field conditions for
these binders. Based on the relatively low temperature at which emulsions are sprayed and the
shorter period of time that asphalt cements are kept at high temperatures before construction,
researchers removed the RTFOT from the Modified Performance Grading system. With this
change, they determined PG properties on only unaged and long-term aged binders.
Application Properties
The standard PG system uses the rotational viscometer to ensure pumping and handling
capabilities of asphalt cements during mixing. This test is conducted at one temperature (135 °C)
for all binders. Researchers assessed this approach as inappropriate for the Modified
Performance Grading system because asphalt cements are heated to higher temperatures over a
wider range to allow for uniform spraying on the pavement. Spraying temperatures depend on
binder consistency, and there is not a common spraying temperature for all binders. For this
reason, the Modified Performance Grading system includes rotational viscometer tests at
multiple temperatures to obtain proper spraying temperatures for surface treatment binders.
High-Temperature Testing
The standard PG procedure utilizes DSR testing on short-term aged binder (RTFOT
residue) and on unaged binder to account for rutting. Short-term aged binder is tested in the DSR
because this aging state represents the asphalt binder condition just after placement and before
long-term aging takes place. The standard PG specification also includes DSR testing of unaged
binders to make sure that those binders that do not age as much during production and mixing
have sufficient resistance to permanent deformation (29). Since researchers removed the RTFOT
aging procedure from the Modified Performance Grading system, this system includes DSR
testing on unaged binders only to reflect critical conditions for early-age surface treatments.

26
Intermediate-Temperature Testing
Researchers implemented an additional variation to the standard PG procedure for
intermediate-temperature testing. The standard PG system requires that long-term aged binder be
tested in the DSR to address fatigue cracking of HMAC. Surface treatments are thin applications,
and they are not likely to exhibit this form of distress. Instead, aggregate loss can occur at these
temperatures. To address this type of distress in the Modified Performance Grading system,
researchers decided to perform DSR tests at intermediate temperatures on unaged binders. Again,
they selected this aging state to represent the worst case for aggregate loss at intermediate
temperatures. The standard PG system includes DSR testing at several different temperatures
within the intermediate-temperature range. For the Modified Performance Grading system,
researchers performed this test at only one temperature representative of intermediate
temperatures in Texas.
Low-Temperature Testing
Researchers also changed the determination of properties at low temperatures. The
standard PG BBR procedure determines stiffness and m-value at a loading time of 60 seconds in
a test performed at a temperature 10 ºC warmer than the expected minimum surface pavement
temperature. The basis for these testing conditions is a critical condition at a long loading time to
simulate thermal cracking of HMAC and the application of the principle of time-temperature
superposition. Since thermal cracking is not of concern in surface treatments, researchers used
the stiffness measured at the fastest loading time possible using existing BBR equipment (8
seconds) to simulate critical traffic loading conditions and the actual test temperature to
determine the low-temperature grade of binders in the Modified Performance Grading system.
They performed this testing procedure on material aged only in the PAV.
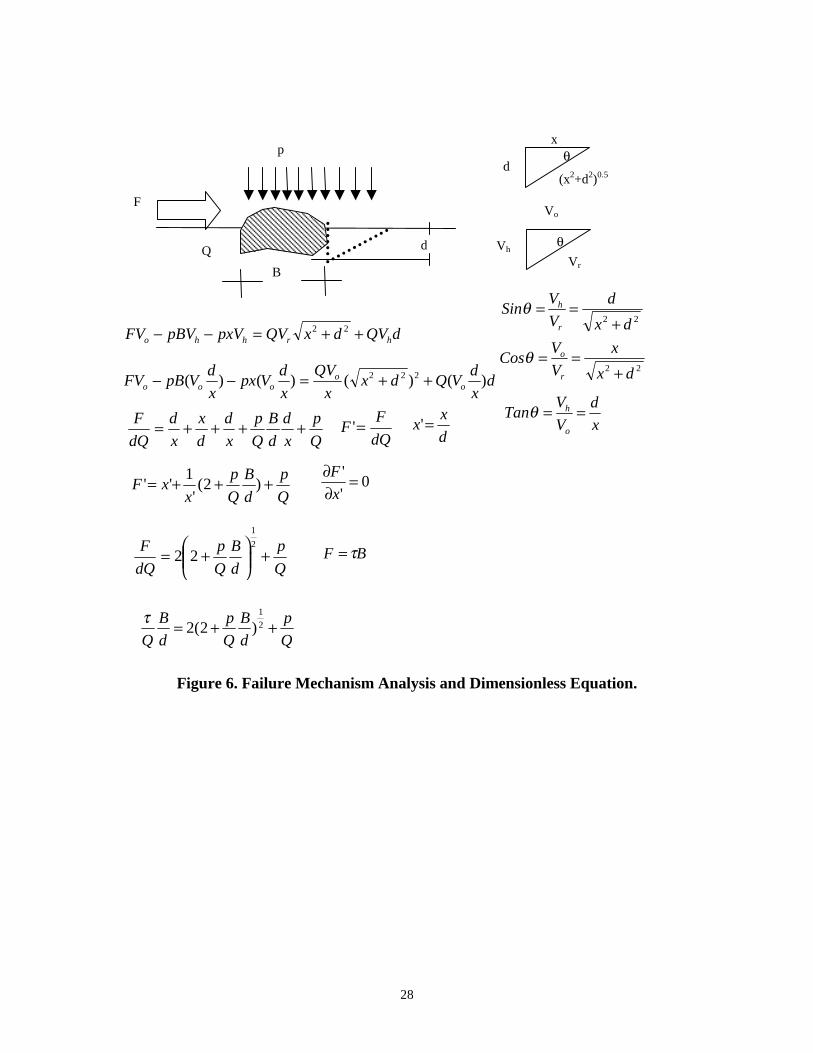
UPPER BOUND THEOREM
Plasticity theory utilizes the Upper Bound Theorem (UBT) to estimate failure conditions
(30). The UBT states that if an estimate of the plastic collapse load of a body is made by

27
equating the internal rate of dissipation of energy to the rate at which external forces do work in
a proposed deformation mechanism, the estimate will be greater than or equal to the actual value
(30).
Researchers analyzed a proposed failure mechanism for an aggregate embedded in a
surface treatment binder using the UBT approach to estimate the required shear strength to hold
the aggregate in place. Variables analyzed in the postulated mechanism included shear strength
of the binder (Q), transverse tire contact force (F), vertical tire contact stress (p), aggregate size
(B), and aggregate embedment (d). By equating the internal rate of dissipation of energy and the
work done by the external forces using virtual velocities and dissipation surfaces of the sliding
block, researchers evaluated the assumed failure mechanism. Figure 6 presents this assumed
failure mechanism, the analysis approach, and the final dimensionless equation.
The UBT was used in the SPG specification as a tool to analyze the assumed failure
mechanism to corroborate the limiting values for the parameters controlling performance.
28
Figure 6. Failure Mechanism Analysis and Dimensionless Equation.
B
F
d
p
Q
x
(x2+d2)0.5 d
θ
Vh
Vo
Vr
θ
22 dx
d
V
VSin
r
h
+==θ
22 dx
x
V
VCos
r
o
+==θ
x
d
V
VTan
o
h ==θ
BF τ=Q
p
d
B
Q
p
dQ
F +
+=
2
1
22
0'
' =∂∂
x
F
Q
p
d
B
Q
p
xxF +++= )2(
'
1''
d
xx ='
dQ
FF ='
Q
p
x
d
d
B
Q
p
x
d
d
x
x
d
dQ
F ++++=
dx
dVQdx
x
QV
x
dVpx
x
dVpBFV o
oooo )()()()( 222 ++=−−
dQVdxQVpxVpBVFV hrhho ++=−− 22
Q
p
d
B
Q
p
d
B
Q++= 2
1
)2(2τ

29
CHAPTER 4. SPG ANALYSIS AND RESULTS
Researchers identified important physical properties that control the performance of
surface treatments during the information search. They measured these properties in the
laboratory testing program and analyzed them in conjunction with the performance ratings and
corresponding surface pavement temperature ranges to form the basis of the SPG specification.
They divided the data analysis into four major sections to conclude with the development
of the SPG specification. These sections represent critical situations that surface treatment
binders undergo during construction and in-service. Based on the information gathered in the
literature review and the results of the evaluation survey, the performance of surface treatment
binders depends mainly on application (spraying of the material) and high-, intermediate-, and
low-temperature behavior of the binder.
SPG SPRAYING
Binder consistency during application is an important factor in surface treatment
performance. Binders sprayed at colder temperatures than optimum tend to be viscous and do not
allow proper embedment of the aggregate, resulting in potential aggregate loss. If sprayed too
hot, they are prone to flow, causing the same effect. Extremely high temperatures can also
increase aging and alter the binder.
Spraying is especially significant for asphalt cements due to the fact that spraying
temperatures are higher than those required for asphalt emulsions. Viscosity ranges
recommended in the literature for either type of binder vary from 0.05 to 0.20 Pa���(7, 9, 31, 32).
Researchers used the rotational viscometer (AASHTO TP48) for a representative group of
asphalt cements to obtain temperatures corresponding to these ranges (28). Figure 7 shows the
results for AC10 C, AC15-5TR F, AC15P E, and AC20 C.

30
Based on the results presented in Figure 7, researchers recommend spraying temperatures
corresponding to viscosities between 0.10 and 0.15 Pa������� �������������������� �� ������
They also set a maximum temperature of 180 �C (minimum 1/absolute temperature = 0.0022) to
prevent alteration of the binder and modifiers.
SPG HIGH TEMPERATURE
From the information gathered in the survey, researchers identified aggregate loss and
bleeding as a consequence of aggregate loss as the primary performance-related distresses
observed at high temperatures in surface treatments. These distresses arise principally when the
shear resistance of the binder is inadequate to hold the aggregate in place under traffic forces.
Researchers conducted an analysis to determine the binder property that controls this type of
distress.
����������������� �� ������������������������������-temperature parameter based on
the fact that the amount of work dissipated in a load cycle at a constant stress is inversely
0.01
0.1
1
10
0.002 0.0021 0.0022 0.0023 0.0024 0.0025 0.0026
1/Absolute Temperature (K)
Vis
cosi
ty (
Pa·
s)
AC15P EAC10 CAC20 CAC15-5TR F
Figure 7. Rotational Viscometer Results for Selected Asphalt Cements.

31
���������������������(29)��������������������������������������������������� ������������
deformation. Since aggregate loss at high temperatures in surface treatments is also a result of
binder deformation and inadequate stiffness, researchers �������� �����������������������
specification as the high-temperature property controlling this form of distress. G* represents a
��������������������� ������������������������ ���������!�������� ������� ������������� �
behavior.
For the Modified Performance Grading high-temperature testing procedure, researchers
also selected frequency (10 rad/s) and strain (10-12 percent) values used in standard PG testing
to reflect critical loading and restrain binders to behavior within the linear viscoelastic (LVE)
range. They also established that the critical aging state of the binder to determine high-
temperature properties is the unaged state.
Researchers analyzed performance ratings and corresponding Texas climate data (Table
6) in conjunction with Modified Performance Grading DSR data at multiple temperatures to set
�������������������������������"������#�������$ ������ �������������%�&'%�!�������������
binders that performed well (overall performance rating of 5) and those that did not (overall
performance rating of 1 or 2) (Table 6). They assumed that exceptions may be related to poor
performance due to construction. These exceptions also included a relatively uncommon
material (HFRS 2P). This assumption is corroborated by the fact that most exceptions met the
recommended specification but did not agree with the general performance rating.
The UBT provided a more theoretical basis for selection of this limiting parameter. First,
researchers generated a chart of complex shear modulus (G*) versus temperature for all binders.
Based on performance ratings and corresponding climate data, they selected a G* that reflected
good performance. Subsequently, typical values of inputs to the UBT equation were used to
calculate a range of required Q values (Table 7). The selected G* corresponded to a shear stress
of 0.0750 kPa (assuming 10 percent strain) that fell within the calculated range for Q, the
��������������������������� �����������%�&'%�!��������������������������������������� �����������
limiting stiffness value for the high-temperature grade based on this separate, more fundamental
criteria. Figure 8 depicts DSR results for all binders and the high-temperature limiting value for
the SPG.

32
Table 7. UBT Results for High-Temperature Analysis.
B/d Ratio Transverse Tire Stress (τ) (kPa)
Vertical Contact Stress (p) (kPa)
Required Shear Strength Range (Q) (kPa)
2.28 317.15 689.47 2.28 296.47 689.47 2.28 296.47 661.89 1.90 317.15 689.47 1.90 296.47 689.47 1.90 296.47 661.89
0-0.100
SPG INTERMEDIATE TEMPERATURE
Researchers used a methodology similar to that followed in the high-temperature analysis
to account for aggregate loss at intermediate temperatures. They selected a temperature of 25 �(�
as representative of the intermediate-temperature spectrum in Texas. A comparison of DSR test
0.00
0.50
1.00
1.50
2.00
2.50
3.00
3.50
4.00
4.50
54 55 56 57 58 59 60 61 62 63 64 65 66 67 68 69 70 71
Temperature (C)
G*
/ Sin
δ (
kPa)
AC3 CAC5 AAC5 CAC5 FAC5 w/l CAC 10 AAC10 CAC10 w/l CAC15 5TR FAC15P EAC15P FAC20 CCRS1P BCRS1P DCRS1P ECRS2 ECRS2P BCRS2P EHFRS2 EHFRS 2P E
Figure 8. DSR Results and Proposed Limiting Value.
0.750kPa
33
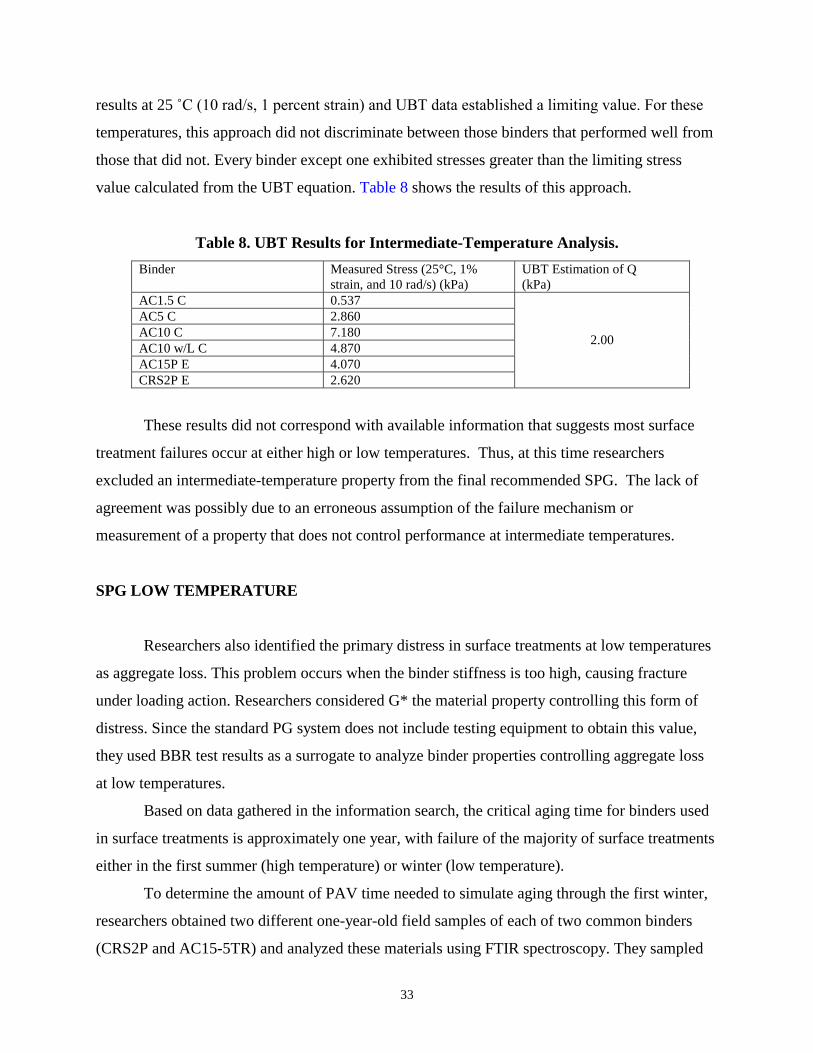
results at 25 �(��)%������ �)���� ����������������*+�������������������������������������,��������
temperatures, this approach did not discriminate between those binders that performed well from
those that did not. Every binder except one exhibited stresses greater than the limiting stress
value calculated from the UBT equation. Table 8 shows the results of this approach.
Table 8. UBT Results for Intermediate-Temperature Analysis.
Binder Measured Stress (25°C, 1% strain, and 10 rad/s) (kPa)
UBT Estimation of Q (kPa)
AC1.5 C 0.537 AC5 C 2.860 AC10 C 7.180 AC10 w/L C 4.870 AC15P E 4.070 CRS2P E 2.620
2.00
These results did not correspond with available information that suggests most surface
treatment failures occur at either high or low temperatures. Thus, at this time researchers
excluded an intermediate-temperature property from the final recommended SPG. The lack of
agreement was possibly due to an erroneous assumption of the failure mechanism or
measurement of a property that does not control performance at intermediate temperatures.
SPG LOW TEMPERATURE
Researchers also identified the primary distress in surface treatments at low temperatures
as aggregate loss. This problem occurs when the binder stiffness is too high, causing fracture
under loading action. Researchers considered G* the material property controlling this form of
distress. Since the standard PG system does not include testing equipment to obtain this value,
they used BBR test results as a surrogate to analyze binder properties controlling aggregate loss
at low temperatures.
Based on data gathered in the information search, the critical aging time for binders used
in surface treatments is approximately one year, with failure of the majority of surface treatments
either in the first summer (high temperature) or winter (low temperature).
To determine the amount of PAV time needed to simulate aging through the first winter,
researchers obtained two different one-year-old field samples of each of two common binders
(CRS2P and AC15-5TR) and analyzed these materials using FTIR spectroscopy. They sampled

34
each of the two binders from two highways: the CRS2P from Routes 287 and 255 and the AC15-
5TR from US Routes 183 and 77. They also aged the CRS2P material in a 60 °C environmental
room to determine an approximate equivalence between field, PAV, and environmental room
aging. They aged material in the environmental room in 1 mm thick films to minimize the effect
of oxygen mass transfer effects.
Researchers extracted the binder from the surface treatment samples by washing with an
85 percent toluene / 15 percent ethanol mixture in a beaker. They then performed multiple
washings of the aggregate followed by filtration and recovery in a rotavap in accordance with the
procedure of Burr et al. to produce the recovered binder (33).
By performing infrared analyses of the recovered binders and the PAV and
environmental room aged binders, researchers compared the extent of oxidation. Figures 9
through 13 show infrared spectra of the carbonyl band and adjoining aromatic band for the
various materials.
0.0
0.0050
0.0 10
0.0 15
0.0 20
0.0 25
0.0 30
15 5016 0016 5017 0017501800
KOC H C R S-2P U N AG EDR 255 M ID D LER 255 S H O U LD ERKO C H C R S -2P P AV
Ab
so
rba
nc
e
W ave N umber , cm -1
Figure 9. CRS2P Aging on Route 255 Versus PAV Aging.

35
0.0
0.0050
0.0 10
0.0 15
0.0 20
0.0 25
0.0 30
15 5016 0016 5017 0017 5018 00
6 M O N TH S4 M O N TH S2 M O N TH SU N AG E DPAV
Ab
so
rba
nc
e
W ave N umber , cm -1
KO C H C R S-2P
Figure 11. CRS2P Aging in Environmental Room Versus PAV Aging.
0.0
0.0050
0.0 10
0.0 15
0.0 20
0.0 25
0.0 30
15 5016 0016 5017 0017 5018 00
KOC H C R S-2P U N AG E DR 287 M ID D LER 287 SH O U LD E RKO C H C R S-2P P AV
Ab
so
rba
nc
e
W ave N umber , cm -1
Figure 10. CRS2P Aging on Route 287 Versus PAV Aging.

36
0.0
0.00 50
0.010
0.015
0.020
0.025
0.030
0.035
0.040
15 5016 0016 5017 0017 5018 00
AC 155 TR TF PAV
R 77 SH O U LD E R
R 77 M ID D LE
Ab
so
rba
nc
e
W ave N umber , cm -1
Figure 12. AC15-5TR Aging on Route 77 Versus PAV Aging.
0.0
0.0050
0.0 10
0.0 15
0.0 20
0.0 25
0.0 30
0.0 35
0.0 40
15 5016 0016 5017 0017 5018 00
AC 155 TR TF PAV
R 183 SH O U LD E R
R 183 M ID D LE
Ab
so
rba
nc
e
W ave N umber , cm -1
Figure 13. AC15-5TR Aging on Route 183 Versus PAV Aging.

37
Based on these figures, researchers conclude that aging of a material in the PAV is
approximately equivalent to one season of exposure in a surface treatment. They also noted that
this same amount of aging was equivalent to approximately two months in the environmental
room at 60 °C.
Thus, materials aged only in the PAV did reflect the critical aging condition, and
researchers used these materials in the laboratory testing program to represent the critical aging
state for low-temperature properties.
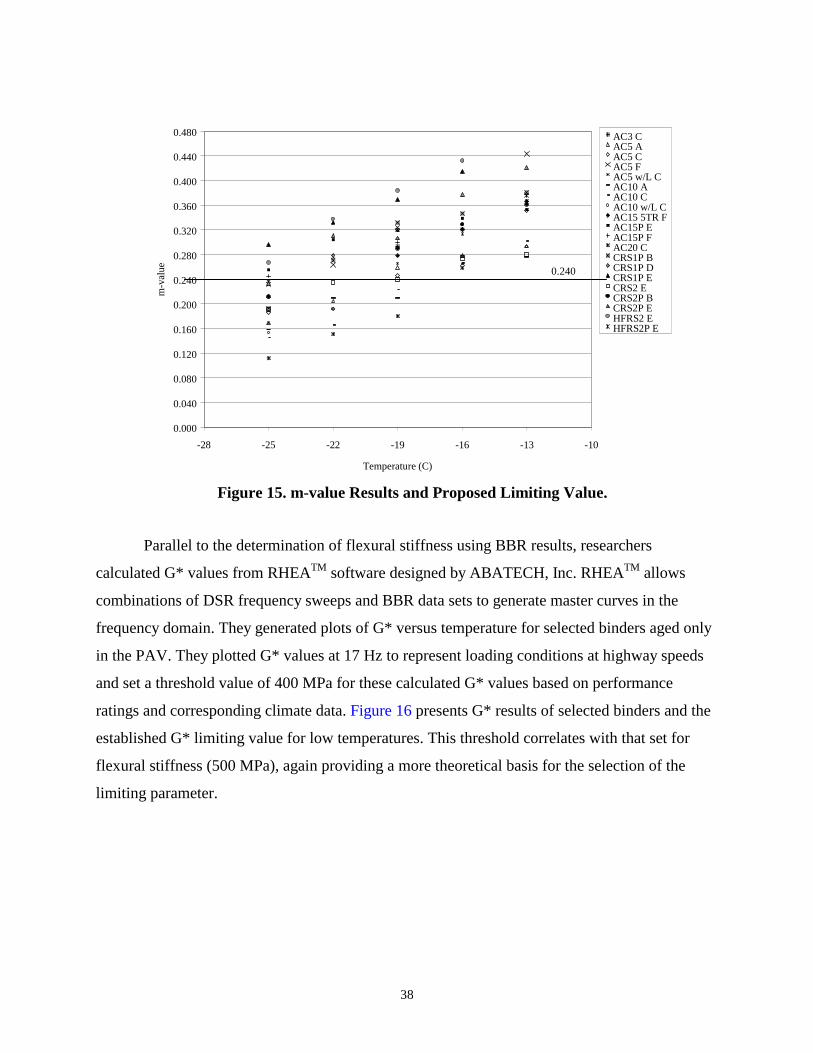
Researchers obtained flexural stiffness and m-values measured in the BBR at 8 seconds
and at representative low temperatures for material aged only in the PAV. They plotted these
values at different temperatures and compared with performance ratings as described in the
previous section. Again, they established a threshold value to separate binders that performed
well from those that did not. They noted a few exceptions for a relatively uncommon material
(HFRS2P), a material whose performance is not governed by low-temperature properties (AC3),
and a material commonly applied at low temperatures but that may have exhibited inadequate
hardening prior to exposure to high temperatures (CRS1P). All of these exceptions met the
recommended specification. The established threshold values for flexural stiffness and m-value
were 500 MPa and 0.240, respectively. BBR testing results and the corresponding limiting values
at low temperature are shown in Figures 14 and 15.
100.0
1000.0
10000.0
-26 -25 -24 -23 -22 -21 -20 -19 -18 -17 -16 -15 -14 -13 -12
Temperature (C)
Flex
ural
Stif
fnes
s (M
Pa)
AC3 CAC5 AAC5 CAC5 FAC5 w/L CAC10 AAC10 CAC10 w/L CAC15 5TR FAC15P EAC15P FAC20 CCRS1P BCRS1P DCRS1P ECRS2 ECRS2P BCRS2P EHFRS2 EHFRS2P E
Figure 14. Flexural Stiffness Results and Proposed Limiting Value.
500 MPa
38
Parallel to the determination of flexural stiffness using BBR results, researchers
calculated G* values from RHEATM software designed by ABATECH, Inc. RHEATM allows
combinations of DSR frequency sweeps and BBR data sets to generate master curves in the
frequency domain. They generated plots of G* versus temperature for selected binders aged only
in the PAV. They plotted G* values at 17 Hz to represent loading conditions at highway speeds
and set a threshold value of 400 MPa for these calculated G* values based on performance
ratings and corresponding climate data. Figure 16 presents G* results of selected binders and the
established G* limiting value for low temperatures. This threshold correlates with that set for
flexural stiffness (500 MPa), again providing a more theoretical basis for the selection of the
limiting parameter.
0.000
0.040
0.080
0.120
0.160
0.200
0.240
0.280
0.320
0.360
0.400
0.440
0.480
-28 -25 -22 -19 -16 -13 -10
Temperature (C)
m-v
alue
AC3 CAC5 AAC5 CAC5 FAC5 w/L CAC10 AAC10 CAC10 w/L CAC15 5TR FAC15P EAC15P FAC20 CCRS1P BCRS1P DCRS1P ECRS2 ECRS2P BCRS2P EHFRS2 EHFRS2P E
Figure 15. m-value Results and Proposed Limiting Value.
0.240

39
Figure 17 depicts the relationship between flexural stiffness (S) and G* values at low
temperatures obtained with RHEATM. This figure shows a logarithmic fit for all materials tested,
differentiating unmodified and modified binders. Based on this graph, unmodified binders
present less scatter than modified binders.
Researchers suggest that the equation in Figure 17 could be used as a provisional
equation to estimate G* at low temperatures from BBR results.
100
1000
10000
-26 -25 -24 -23 -22 -21 -20 -19 -18 -17 -16 -15 -14 -13 -12
Temperature (C)
G*
(MPa
)AC10 CAC15P ECRS2 ECRS2P EAC10 w/L CAC20 CCRS2P B
Figure 16. G* Results and Proposed Limiting Value.
400 MPa

40
0
100
200
300
400
500
600
700
0 100 200 300 400 500 600 700 800 900 1000 1100 1200
S (MPa)
G*
(MPa
)
FittedUnmodifiedModified
Figure 17. Flexural Stiffness and G* Relationship at Low Temperatures.
G* = 146 Ln(S) – 466.76 R2 = 0.8138

41
CHAPTER 5. SURFACE PERFORMANCE GRADING SPECIFICATION
Table 9 summarizes final recommended values for the SPG performance grading system
for surface treatment binders. This table presents only three SPG grades as an example, but the
grades are unlimited and can be extended in both directions of the temperature spectrum using
3 °C increments.
Table 9. Recommended Surface Performance Grading.
SPG 58 SPG 61 SPG 64 Performance Grade
-16 -19 -22 -25 -13 -16 -19 -22 -25 -13 -16 -19 -22 -25
Avg. 7-day Maximum Surface Pavement Design Temp., °C
<58 <61 <64
Minimum Surface Pavement Design Temp, °C
>-16 >-19 >-22 >-25 >-13 >-16 >-19 >-22 >-25 >-13 >-16 >-19 >-22 >-25
Original Binder
Viscosity ASTM D 4402 Max: 0.15; Min: 0.1 Pas Test Temp., °C
<180 <180 <180
DSR TP5 G*/Sin δ, Min: 0.750 kPa Test Temp. @ 10 rad/s, °C
58 61 64
PAV Residue (PP1)
PAV Aging Temp., °C 90 100 100
Creep Stiffness, TP1 S, Max: 500 MPa m-value, Min: 0.240 Test Temp., @ 8 s, °C
-16 -19 -22 -25 -13 -16 -19 -22 -25 -13 -16 -19 -22 -25
GRADING RESULTS
Researchers determined high and low performance temperatures based on laboratory
testing results at multiple temperatures and recommended limiting values, and they assigned
SPG grades to all selected binders based on Table 9. Table 10 summarizes standard PG grades,
PG grades based on pavement surface temperatures, and SPG grades.
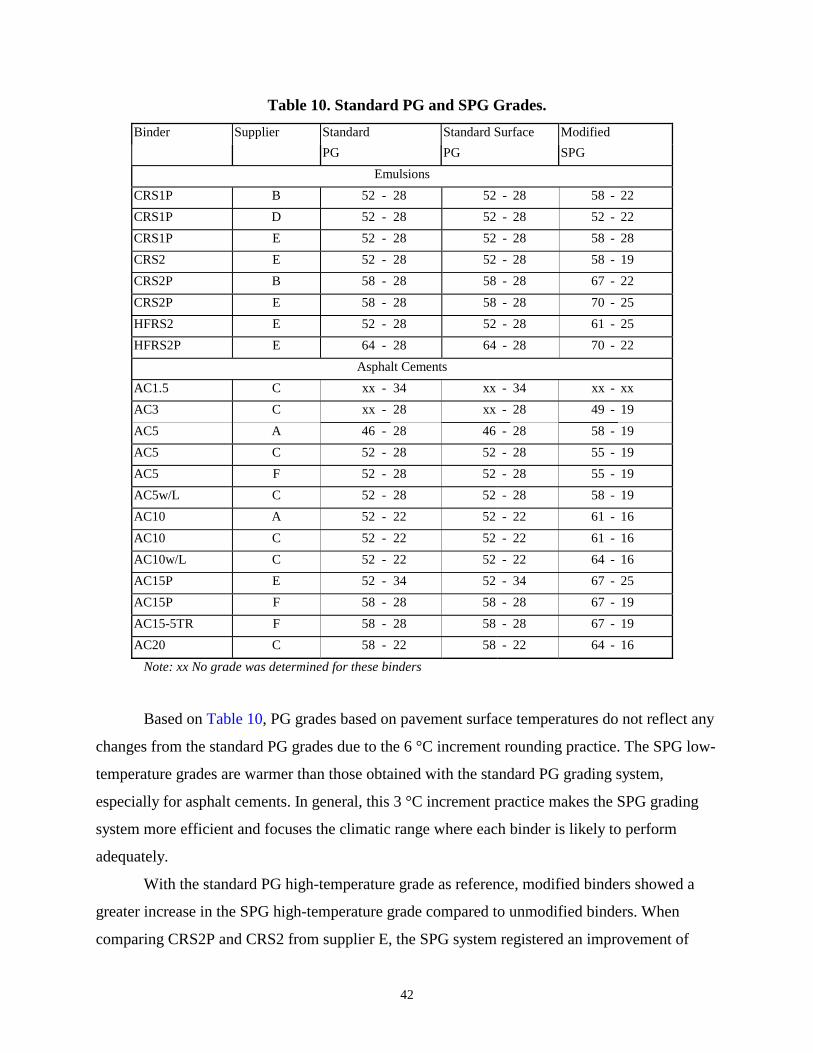
42
Table 10. Standard PG and SPG Grades.
Binder Supplier Standard Standard Surface Modified
PG PG SPG
Emulsions
CRS1P B 52 - 28 52 - 28 58 - 22
CRS1P D 52 - 28 52 - 28 52 - 22
CRS1P E 52 - 28 52 - 28 58 - 28
CRS2 E 52 - 28 52 - 28 58 - 19
CRS2P B 58 - 28 58 - 28 67 - 22
CRS2P E 58 - 28 58 - 28 70 - 25
HFRS2 E 52 - 28 52 - 28 61 - 25
HFRS2P E 64 - 28 64 - 28 70 - 22
Asphalt Cements
AC1.5 C xx - 34 xx - 34 xx - xx
AC3 C xx - 28 xx - 28 49 - 19
AC5 A 46 - 28 46 - 28 58 - 19
AC5 C 52 - 28 52 - 28 55 - 19
AC5 F 52 - 28 52 - 28 55 - 19
AC5w/L C 52 - 28 52 - 28 58 - 19
AC10 A 52 - 22 52 - 22 61 - 16
AC10 C 52 - 22 52 - 22 61 - 16
AC10w/L C 52 - 22 52 - 22 64 - 16
AC15P E 52 - 34 52 - 34 67 - 25
AC15P F 58 - 28 58 - 28 67 - 19
AC15-5TR F 58 - 28 58 - 28 67 - 19
AC20 C 58 - 22 58 - 22 64 - 16
Note: xx No grade was determined for these binders
Based on Table 10, PG grades based on pavement surface temperatures do not reflect any
changes from the standard PG grades due to the 6 °C increment rounding practice. The SPG low-
temperature grades are warmer than those obtained with the standard PG grading system,
especially for asphalt cements. In general, this 3 °C increment practice makes the SPG grading
system more efficient and focuses the climatic range where each binder is likely to perform
adequately.
With the standard PG high-temperature grade as reference, modified binders showed a
greater increase in the SPG high-temperature grade compared to unmodified binders. When
comparing CRS2P and CRS2 from supplier E, the SPG system registered an improvement of

43
four grades in the high-temperature grade and two in the low-temperature grade (Figure 18). The
effect of latex for similar base asphalt cements (AC5 and AC10 with and without latex) only
increased the high-temperature grade by one and did not have any effect on the low-temperature
grade.
GRADE SELECTION PROCESS
The climate in which the pavement is placed determines selection of the PG binder grade
(6). The same criterion applies for SPG binders. The selection of a specific SPG binder depends
on the minimum and maximum pavement surface temperatures of the zone or region where the
binder will be used.
To select a SPG binder, researchers or practitioners evaluate available climate data to
determine the hottest 7-day period and the 1-day minimum air temperature for each year. They
calculate mean and standard deviation of all the years of record to establish a level of reliability
in binder selection as described subsequently. Since the SPG design temperatures are based on
surface pavement temperatures, they utilize equations (1) and (3) for the high design temperature
0.000.250.500.751.001.251.501.752.002.252.502.753.003.253.503.754.004.254.50
54 55 56 57 58 59 60 61 62 63 64 65 66 67 68 69 70 71
Temperature (C)
G*/
Sin
δ (k
Pa)
CRS2 E
CRS2P E
Figure 18. CRS2 E and CRS2P E DSR Results.

44
and low design temperature, respectively, to transform air temperatures to surface pavement
temperatures.
Researchers designed the SPG system to assign a degree of risk to the high and low
design temperatures used in selecting the binder grade just like the Superpave PG grading system
does. Reliability is defined in this case as a percent probability in a single year that the actual
temperature (1-day low or 7-day high) will not exceed the design temperatures (6). The level of
reliability is assigned using equations (2) and (4) for high and low design temperatures,
respectively. The z-value is obtained from tables for the standard normal distribution (µ = 0 and
σ = 1). Normally, researchers or practitioners use 50 or 98 percent reliability to establish the
design temperature of a project, where 50 percent means that there is a 50 percent chance that the
air temperature will exceed the expected value and 98 percent that there is only a 2 percent
chance that this event will occur. The use of a higher reliability level for selecting binders in the
SPG system increases the probability of good surface treatment performance.
Table 11 presents an example to illustrate the SPG grade selection process assuming the
available 35-year climate data for a city registered –18 °C for the mean 1-day low temperature
and 29 °C for the mean 7-day high temperature, with standard deviations of 2.5 °C and 1.64 °C,
respectively. The city’s latitude is assumed to be 25 º. Table 11 presents the calculations for the
determination of the pavement surface temperatures and the 50 and 98 percent reliability final
SPG grade. Information presented in Table 11 also shows the effect of the 3 °C increment
rounding and the reliability level in the grade selection of a binder for a given project.
Table 11. Example of the SPG Grade Selection Process. Reliability Level (%)
High Pavement Surface Temperature (1) (°C)
Low Pavement Surface Temperature (3) (°C)
High-Low Surface Temperature (°C)
- Tsurf - Tair = -0.00618 lat2 + 0.2289 lat + 24.4 = 33.98 Tsurf = 33.98 + Tair = 33.98 + 29 = 62.98
Tsurf = Tair = -18 63-18
- High Design Temperature (2) (°C)
Low Design Temperature (4) (°C)
Final SPG Grade Selection (°C)
50 Tpav = Tsurf + z � Sair = 62.98 + 0* 1.64 = 62.98
Tpav = Tair - z � Sair = -18 – 0* 2.5 = -18
64-18
98 Tpav = Tsurf + z � Sair = 62.98 + 2.06* 1.64 = 66.35
Tpav = Tair - z � Sair = -18 – 2.06* 2.5 = - 23.15
67-25
Note: - Not Applicable

45
CHAPTER 6. FIELD VALIDATION EXPERIMENT
Researchers recognized that a field experiment must be completed to validate the
recommended SPG specification. This section presents a recommended design of the validation
experiment that includes identification of appropriate projects considering the use of common
asphalt cements and emulsions under different climate and loading conditions, performance
monitoring, and general evaluation of the SPG specification.
PROJECT IDENTIFICATION
Researchers must evaluate surface treatment projects in Texas districts to determine
whether they are suitable for inclusion in the field validation experiment. They recommend
obtaining samples of at least two asphalt cements and two emulsions for each of two aggregate
types that were used on projects placed under two different environmental conditions and under
two levels of traffic. Preferably, future researchers will select unmodified and corresponding
modified binders for each material type because modified materials may be more sensitive to the
selected factors. With these variables, current researchers suggest a full factorial design for two
separate experiments (one for asphalt cements and one for emulsions) to estimate all main effects
and two-way interactions. Table 12 presents an example of the experimental design for asphalt
cements with two suppliers and a response variable (SCI) defined subsequently.
Table 12 shows a limited number of suppliers to minimize any effects of differences in
production methods between suppliers. If future researchers introduce more suppliers, the level
of effort to complete the field validation experiment will substantially increase.
Additionally, general information about the surface treatment projects should include the
following:
• General information
o location (highway number, length of section, and milepost),
o date of construction,
o condition of the existing pavement or base course, and
o surface treatment design method.
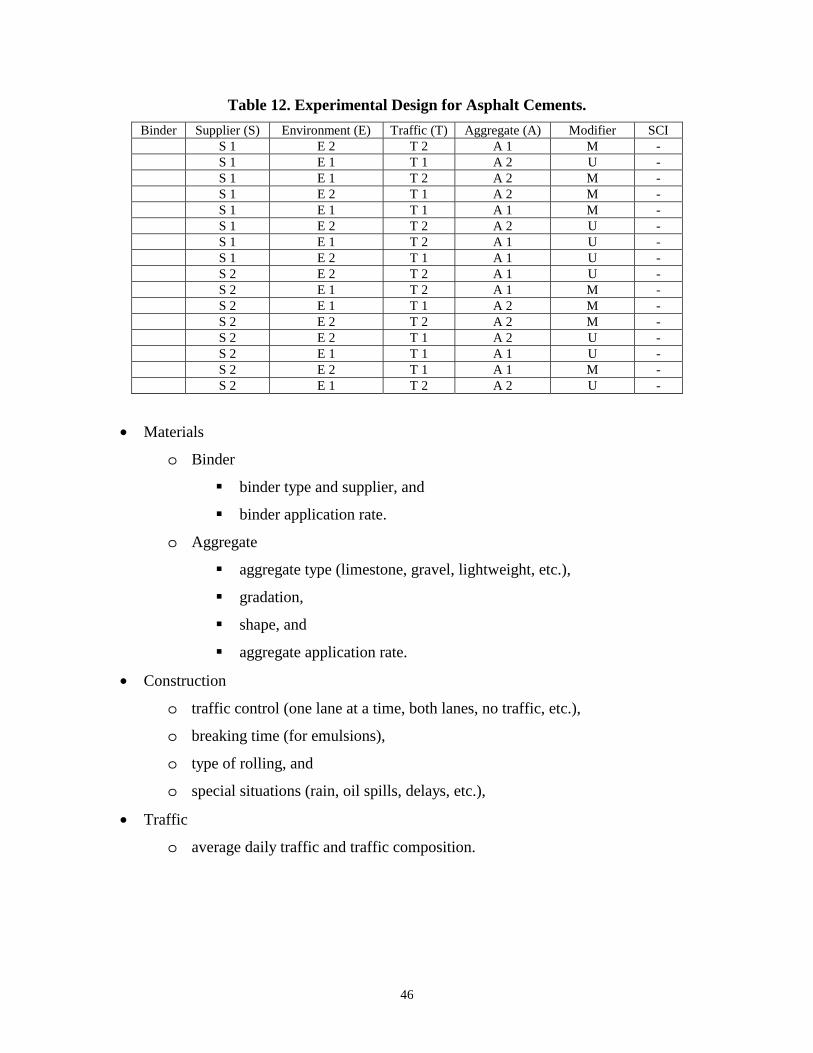
46
Table 12. Experimental Design for Asphalt Cements.
Binder Supplier (S) Environment (E) Traffic (T) Aggregate (A) Modifier SCI S 1 E 2 T 2 A 1 M - S 1 E 1 T 1 A 2 U - S 1 E 1 T 2 A 2 M - S 1 E 2 T 1 A 2 M - S 1 E 1 T 1 A 1 M - S 1 E 2 T 2 A 2 U - S 1 E 1 T 2 A 1 U - S 1 E 2 T 1 A 1 U - S 2 E 2 T 2 A 1 U - S 2 E 1 T 2 A 1 M - S 2 E 1 T 1 A 2 M - S 2 E 2 T 2 A 2 M - S 2 E 2 T 1 A 2 U - S 2 E 1 T 1 A 1 U - S 2 E 2 T 1 A 1 M - S 2 E 1 T 2 A 2 U -
• Materials
o Binder
��binder type and supplier, and
��binder application rate.
o Aggregate
��aggregate type (limestone, gravel, lightweight, etc.),
��gradation,
��shape, and
��aggregate application rate.
• Construction
o traffic control (one lane at a time, both lanes, no traffic, etc.),
o breaking time (for emulsions),
o type of rolling, and
o special situations (rain, oil spills, delays, etc.),
• Traffic
o average daily traffic and traffic composition.

47
MONITORING PROGRAM
Researchers recognize that a visual survey of the selected projects must be performed to
try to validate the results of the SPG specification. The recommended methodology presented
here is an adaptation of a procedure used in the state of Wyoming and other systems used to
evaluate surface treatments (20, 12).
The general procedure of the monitoring program for this validation experiment consists
of three main steps. First, researchers divide road sections into 2476 ft2 ± 9690 ft2 (230 ± 90 m2)
areas called units. Second, they measure and evaluate distress related only to surface treatments.
Finally, they determine a surface condition index (SCI) based on the distress observed in the
second step.
Sample Selection
It is appropriate to inspect the entire section of the project for the monitoring program.
However, this task may take too much time and effort. Instead, researchers may survey
representative units of sections. Current researchers suggest dividing projects into consecutively
numbered units (2476 ft2 ± 9690 ft2 (230 ± 90 m2) areas) and then randomly selecting the units to
be monitored (six or eight sample units per project) (12).
Distress Measurement
Distress identification, measurement, and evaluation are critical aspects for the success of
the validation of the SPG specification. Researchers recognize that it is important to distinguish
the distresses related to surface treatment performance from those related to HMAC. They
consider aggregate loss, bleeding, and longitudinal and transverse cracking the primary distresses
related to surface treatment performance, and they suggest their inclusion in the monitoring
program. An additional indicator of surface treatment performance is aggregate embedment.
Future researchers will evaluate a sample unit by marking the end points of the sample
unit on a paper and then sketching the length and severity of the distresses (12). The distress
evaluation of the surface treatment project is the summation of each distress type found in each

48
sample unit divided by the total area of the six or eight sample units randomly selected. They
will also report aggregate embedment as the average of the sample units results.
SCI Calculation
The SCI is a rating system with a scale of 100 to 0, where 100 is a perfect score. The SCI
consists of four distress types with arbitrary weights assigned to each distress. Researchers
subdivide distress categories into two parts to account for the percentage area covered by the
distress and the severity level. Currently, the same weights are shown for each subdivision. Table
13 presents the components and weights of the SCI rating system.
For this proposed SCI system, researchers recommend tentative threshold values for good
(SCI ��75), fair (55 ��SCI < 75), and poor (SCI < 55) surface treatment performance. They also
suggest revisions of the threshold values and distress weights to accurately reflect TxDOT’s
priorities.
General Evaluation
Researchers recommend five evaluations for this particular validation experiment:
immediately after construction, before and after the first winter, and during the subsequent spring
and summer seasons. After completion of the monitoring program, researchers suggest
comparing survey results and the SPG specification and design temperatures to establish the
validity of the SPG. Comparisons to identify characteristics of good performing and failing
surface treatments must also include DSR results and FTIR analysis of field samples from
surveyed projects.
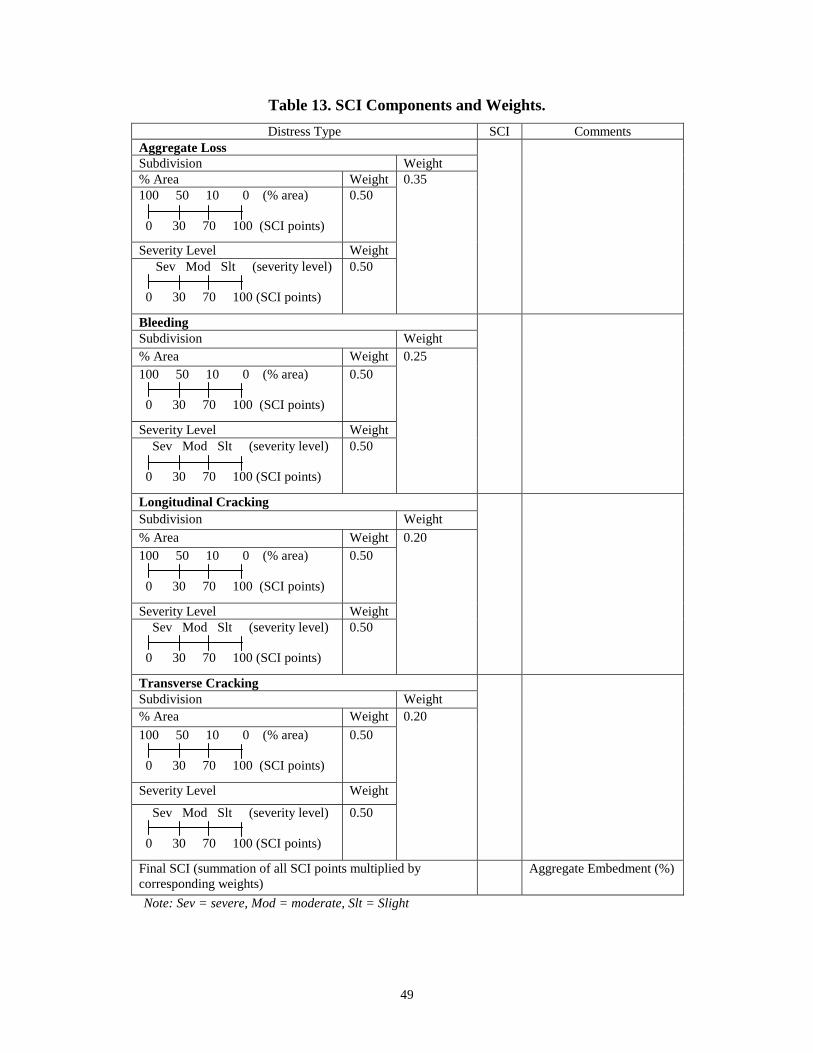
49
Table 13. SCI Components and Weights.
Distress Type SCI Comments Aggregate Loss Subdivision Weight % Area Weight 100 50 10 0 (% area) 0 30 70 100 (SCI points)
0.50
Severity Level Weight Sev Mod Slt (severity level) 0 30 70 100 (SCI points)
0.50
0.35
Bleeding Subdivision Weight % Area Weight 100 50 10 0 (% area) 0 30 70 100 (SCI points)
0.50
Severity Level Weight Sev Mod Slt (severity level) 0 30 70 100 (SCI points)
0.50
0.25
Longitudinal Cracking Subdivision Weight
% Area Weight 100 50 10 0 (% area) 0 30 70 100 (SCI points)
0.50
Severity Level Weight Sev Mod Slt (severity level) 0 30 70 100 (SCI points)
0.50
0.20
Transverse Cracking Subdivision Weight % Area Weight
100 50 10 0 (% area) 0 30 70 100 (SCI points)
0.50
Severity Level Weight
Sev Mod Slt (severity level) 0 30 70 100 (SCI points)
0.50
0.20
Final SCI (summation of all SCI points multiplied by corresponding weights)
Aggregate Embedment (%)
Note: Sev = severe, Mod = moderate, Slt = Slight
51
CHAPTER 7. CONCLUSIONS AND RECOMMENDATIONS
Researchers developed the SPG specification using existing Superpave equipment to
measure physical properties of binders that account for common distresses observed in surface
treatments. They used representative temperatures in Texas and binder performance ratings to
establish limiting values for the required properties for determination of SPG high- and low-
temperature grades. They further validated these limiting values based on more theoretical
approaches. Parameters in the SPG specification consider critical aging and loading to reflect
conditions in the field.
Researchers made the following two recommendations to ensure the success of the SPG
specification and associated grade selection process:
• Future researchers need to complement performance-based binder specification
through the development of new and simpler testing equipment and a
methodology to directly obtain G* at low temperatures.
• Future researchers should also consider evaluation of the possible adjustment of
grades in the SPG grade selection process due to traffic and loading conditions
based on a review of the recommended validation experiment results.
Since the Modified Performance Grading is based on fundamental physical properties
related to field performance, researchers expect the SPG specification will be useful in grading
and selecting surface treatment binders to assure good performance. The SPG specification is
also relatively simple and economical to implement because it is based on the widely
implemented PG equipment and grading system.

53
REFERENCES
1. Standard Specifications for Construction of Highways, Streets and Bridges. Texas
Department of Transportation, 1995.
2. Pockets Facts. Texas Department of Transportation.
(http://www.dot.state.tx.us/rtmodes/pfacts/pfacts.htm) Accessed June 29, 2001.
3. Kandal, P., and Motter, J. Criteria for Accepting Precoated Aggregates for Seal Coats and
Surface Treatments. In Transportation Research Record 1300, TRB, National Research
Council, Washington, D.C., 1991, pp. 80-89.
4. Jackson, D., Jackson, N., and Mahoney, J. Washington State Chip Seal Study. In
Transportation Research Record No. 1259, TRB, National Research Council, Washington,
D.C., 1990, pp.1-10.
5. American Society for Testing and Materials (ASTM). Annual Book of ASTM Standards, Vol.
04.03: Road and Paving Materials. American Society for Testing and Materials,
Philadelphia, 1998.
6. Binder Specification and Testing. Superpave Series SP-1. Asphalt Institute. Lexington, KY,
1997.
7. Epps, J., Gallaway, B., and Hughes, C. Field Manual on Design and Construction of Seal
Coats. Texas Transportation Institute. Research Report 214-25, College Station, TX, July
1981.
8. Gallaway, B., and Harper, W. Laboratory and Field Evaluation of Lightweight Aggregates as
Coverstone for Seal Coats and Surface Treatments. In Highway Research Record 50,
Washington, D.C., 1966, pp. 25-81.
9. McLeod, N. Dos and Don’ts of Seal Coating. Presented at The American Road Builders
Association. 11th Annual National Highway Conference for County Highway Engineers and
Officials, Gatlinburg, TN, September 15-18, 1963.
10. Janish, D. Reevaluation of Seal Coating Practices in Minnesota. In Transportation Research
Record 1507, TRB, National Research Council, Washington, D.C., 1995, pp. 30-38.
11. Marek, C., and Herrin, M. Voids Concept for Design of Seal Coats and Surface Treatments.
In Highway Research Record 361, Washington, D.C., 1971, pp. 20-36.

54
12. Boyer, S., and Ksaibati, K. Evaluating the Effectiveness of Polymer Modified Asphalts in
Surface Treatments. Report Number: FHWA-WY-99/01F. Wyoming Department of
Transportation, Cheyenne, WY, 1998.
13. Roque, R., Anderson, D., and Thompson, M. Effect of Material, Design, and Construction
Variables on Seal Coat Performance. In Transportation Research Record 1300, TRB,
National Research Council, Washington, D.C., 1991, pp. 108-115.
14. Woodside, A., and Woodward, W. Durability of Surfacing Aggregate- The Implications of
CEN Test Methods on Current British Specification Requirements. University of Leeds,
March 1994, pp. 23-35.
15. Kari, W., Coyne, L., and McCoy, P. Seal Coat Performance-Interrelation of Variables
Established by Laboratory and Field Studies. Journal of The Association of Asphalt Paving
Technologists, Vol. 31, 1962, pp. 1-34.
16. Vickaryous, I., and Ferguson, J. Some Aspects of Seal Coat Applications with Emulsified
Asphalts. Proc., of the 41st Annual Conference of Canadian Technical Asphalt Association,
Edmonton, Alberta, 1996, pp. 1-31.
17. Davis, D., Stroup-Gardiner, M., Epps, J., and Davis, K. Correlation of Laboratory Tests to
Field Performance for Chip Seals. In Transportation Research Record 1300, TRB, National
Research Council, Washington, D.C., 1991, pp. 98-107.
18. Selim, A., and Heidari, N. Measuring the Susceptibility of Emulsion Based Seal Coats to
Debonding, ASTM SPT 1016, American Society for Testing and Materials, Philadelphia,
1989, pp. 144-153.
19. Stroup-Gardiner, M., Newcomb, D., Epps, J., and Paulsen, G. Laboratory Test Methods and
Field Correlations for Predicting the Performance of Chip Seals. Asphalt Emulsions, ASTM
STP 1079, American Society for Testing and Materials, Philadelphia, 1990, pp. 2-19.
20. Shuler, S. Chip Seals for High-Traffic Volume Asphalt Concrete Pavements. Final Report
Project 14-8A. National Cooperative Highway Research Program, Washington, D.C., 1996.
21. Walsh, G., O’Mahony, M., and Jamieson, I. Net Adsorption Test for Chip-Sealing
Aggregates and Binders. In Transportation Research Record 1507, TRB, National Research
Council, Washington, D.C., 1995, pp. 1-12.
22. Thelen, E. Surface Energy and Adhesion Properties in Asphalt-Aggregate Systems. Highway
Research Board Bulletin, No. 192, 1958, pp. 63-74.
55
23. Good, J., and Van Oss, C. The Modern Theory of Contact Angles and the Hydrogen Bond
Components of Surface Energies. Modern Approach to Wettability: Theory and Applications.
(M. Schader and G. Loeb, eds.), Plenum Press, New York, 1991, pp. 1-27.
24. Shook, J., Shook, W., and Yapp, T. The Effects of Emulsion Variability on Seal Coats.
Pennsylvania Department of Transportation. Report Number: FHWA-PA-89-030+86-12,
1990.
25. Burr, B. L., Davison, R. R., Glover, C. J., and Bullin, J. A. Solvent Removal from Asphalt. In
Transportation Research Record 1269, TRB, National Research Council, Washington, D.C.,
1990, pp. 1-8.
26. Kari, W., and Coyne, L. Emulsified Asphalt Slurry Seal Coats. Journal of The Association of
Asphalt Paving Technologists, Vol. 33, 1964, pp. 502-544.
27. Huber, G. Weather Database for the Superpave Mix Design System. Report Number: SHRP-
A-648A. Strategic Highway Research Program, National Research Council, Washington,
D.C., 1993.
28. American Association of State Highway and Transportation Officials (AASHTO), AASHTO
Provisional Standards, June Edition, 1998, Washington, D.C.: American Association of State
Highway and Transportation Officials.
29. Roberts, F., Kandhal, P., Brown, R., Lee, D., and Kennedy, T. Hot Mix Asphalt Materials,
Mixture Design, and Construction. NAPA Education Foundation, Second Edition, 1996.
30. Chen, W. F. Limit Analysis and Soil Plasticity. Elsevier Scientific Publishing Co., New York,
1975.
31. Elmore, W., Solaimanian, M., McGennis, R., Kennedy, T., and Phromsorn, C. Performance-
Based Seal Coat Asphalt Specifications. Center for Transportation Research, CTR 1367-2F
Final Report, 1995.
32. Herrin, M. State of the Art: Surface Treatment Summary. Summary of Existing Literature.
Special Report No. 96, Highway Research Board, National Research Council, Washington,
D.C., 1968.
33. Burr, B. L., Glover, C. J., Davison, R. R., and Bullin, J. A. A New Apparatus and Procedure
for the Extraction and Recovery of Asphalt Binder from Pavement Mixtures. In
Transportation Research Record 1391, TRB, National Research Council, Washington, D.C.,
1993, pp. 20-29.

57
APPENDIX A EVALUATION SURVEYS
TxDOT A performance graded (PG) binder specification has been developed and implemented by TxDOT in Hot Mix Asphalt Concrete projects. These specifications are not directly valid for surface treatment binders. The purpose of this study is to develop an analogous specification system. This survey is the first task towards accomplishing the goal of this project. Please answer the following questions:
Name: ___________________________________________________ Date: _______________ Company/ District ____________________________ Title: ______________________________ Phone: _______________ Fax: ______________ e-mail: _______________________________ I. - What kind of asphalt binder/ emulsion has your district used in surface treatments? Binder: Modified? Modifier/Emulsifying Agent Performance #1. - ___________________ [] Yes [] No _______________________ [] Good [] Fair [] Bad #2. - ___________________ [] Yes [] No _______________________ [] Good [] Fair [] Bad #3. - ___________________ [] Yes [] No _______________________ [] Good [] Fair [] Bad #4. - ___________________ [] Yes [] No _______________________ [] Good [] Fair [] Bad #5. - ___________________ [] Yes [] No _______________________ [] Good [] Fair [] Bad Reasons for binder modification? _______________________________________________________________
* Suggest (either based on [] opinion or [] experience) binders that show poor performance in surface treatments. __________________________________________________________________________________________ II. – Please check box (es) and complete the following table referring to the binder number of question I. (If necessary make copies of the table below).
BINDER # ___ BINDER # ___ BINDER # ___
BIN
DE
R
Prov
ider
[] Koch Materials [] Texas Fuel [] Coastal [] Wright Asphalt []_____________
[] Fina [] Texaco [] Gulf State [] Chevron [] Exxon
[] Koch Materials [] Texas Fuel [] Coastal [] Wright Asphalt []_____________
[] Fina [] Texaco [] Gulf State [] Chevron [] Exxon
[] Koch Materials [] Texas Fuel [] Coastal [] Wright Asphalt []_____________
[] Fina [] Texaco [] Gulf State [] Chevron [] Exxon
Des
ign
Design method for the chip seal: [] Experience [] Modified Kearby [] Other ________________ Design life ____________ years Design life Versus actual life? [] Good [] Fair [] Bad
Design method for the chip seal: [] Experience [] Modified Kearby [] Other ________________ Design life ____________ years Design life Versus actual life? [] Good [] Fair [] Bad
Design method for the chip seal: [] Experience [] Modified Kearby [] Other ________________ Design life ____________ years Design life Versus actual life? [] Good [] Fair [] Bad
SUR
FA
CE
T
RE
AT
ME
NT
Exi
stin
g Pa
vem
ent
Condition of existing pavement: [] Dry or raveled surface [] Bleeding surface [] Water infiltration [] Alligator cracking [] Rutting [] Other _________________
Condition of existing pavement: [] Dry or raveled surface [] Bleeding surface [] Water infiltration [] Alligator cracking [] Rutting [] Other _________________
Condition of existing pavement: [] Dry or raveled surface [] Bleeding surface [] Water infiltration [] Alligator cracking [] Rutting [] Other _________________
TY
PE
Tx
DO
T
item
302
� Type A � Type B � Type C � Type D � Type E
� Type PA � Type PB � Type PC � Type PD � Type PE
� Type A � Type B � Type C � Type D � Type E
� Type PA � Type PB � Type PC � Type PD � Type PE
� Type A � Type B � Type C � Type D � Type E
� Type PA � Type PB � Type PC � Type PD � Type PE
SHA
PE � Cubical
� Rounded � Subrounded � Flat and elongated � Other… Which? __________
� Cubical � Rounded � Subrounded � Flat and elongated � Other… Which? __________
� Cubical � Rounded � Subrounded � Flat and elongated � Other… Which? __________
AG
GR
EG
AT
ES
GR
AD
AT
ION
T
x D
OT
item
30
2
� Grade 3 � Grade 4 � Grade 5 � One Size... ____________ � Other__________________
� Grade 3 � Grade 4 � Grade 5 � One Size... ____________ � Other__________________
� Grade 3 � Grade 4 � Grade 5 � One Size... ____________ � Other__________________

58
BINDER # __ BINDER # __ BINDER # __
BIN
DE
R
________________________________________________________________________________________________________________________________________________________
________________________________________________________________________________________________________________________________________________________
________________________________________________________________________________________________________________________________________________________
CR
ITE
RIA
FO
R M
AT
ER
IAL
SE
LE
CT
ION
AG
GR
EG
AT
E
________________________________________________________________________________________________________________________________________________________
________________________________________________________________________________________________________________________________________________________
________________________________________________________________________________________________________________________________________________________
TRAFFIC
AREAS
(Vehicles per lane per day)
� High (>4000) � Med. (2500-4000) � Low (< 2500) � Turn/Accelerating zones
Were any of these conditions considered in the design?
[] Yes [] No How? ___________________ ________________________
� High (>4000) � Med. (2500-4000) � Low (< 2500) � Turn/Accelerating zones
Were any of these conditions considered in the design?
[] Yes [] No How? ___________________ ________________________
� High (>4000) � Med. (2500-4000) � Low (< 2500) � Turn/Accelerating zones
Were any of these conditions considered in the design?
[] Yes [] No How? ___________________
MAIN DISTRESSES
SHOWN
A.- [] Bleeding B.- [] Aggregate loss C.- [] Streaking D.- [] Other______________ E.- [] Other ______________ F.- [] None Comments____________________________________________________________________________________
A.- [] Bleeding B.- [] Aggregate loss C.- [] Streaking D.- [] Other______________ E.- [] Other ______________ F.- [] None Comments____________________________________________________________________________________
A.- [] Bleeding B.- [] Aggregate loss C.- [] Streaking D.- [] Other______________ E.- [] Other ______________ F.- [] None Comments____________________________________________________________________________________
POSSIBLE
CAUSES OF
DISTRESSES
(relate to the distresses
above)
Distress: A B C D E Design [ ] [ ] [ ] [ ] [ ] [] Binder application rate [] Aggregate application rate Construction [ ] [ ] [ ] [ ] [ ] [] Pavement preparation [] Time delay binder-aggregate [] Traffic control [] Workmanship [] Equipment (spraying, rolling) Weather. [ ] [ ] [ ] [ ] [ ] [] Rainy or wet surface [] Hot temperature [] Cold temperature Mat. Selec. [ ] [ ] [ ] [ ] [ ] [] Improper binder [] Wet aggregate [] Dusty aggregate [] Aggregate size [] Binder & agg. incompatibility [] Agg. toughness & durability Other____________________
Explain _________________ ________________________

59
BINDER # __ BINDER # __ BINDER # __
EV
AL
UA
TIO
N
Water Sealing
Skid Resist.
Tire noise
Appearance
Agg. retention
Overall
performance
Cost-effective
Poor Good (0) (1) (2) (3) (4) (5)
(0) (1) (2) (3) (4) (5)
(0) (1) (2) (3) (4) (5)
(0) (1) (2) (3) (4) (5)
(0) (1) (2) (3) (4) (5)
(0) (1) (2) (3) (4) (5)
(0) (1) (2) (3) (4) (5)
Poor Good (0) (1) (2) (3) (4) (5)
(0) (1) (2) (3) (4) (5)
(0) (1) (2) (3) (4) (5)
(0) (1) (2) (3) (4) (5)
(0) (1) (2) (3) (4) (5)
(0) (1) (2) (3) (4) (5)
(0) (1) (2) (3) (4) (5)
Poor Good (0) (1) (2) (3) (4) (5)
(0) (1) (2) (3) (4) (5)
(0) (1) (2) (3) (4) (5)
(0) (1) (2) (3) (4) (5)
(0) (1) (2) (3) (4) (5)
(0) (1) (2) (3) (4) (5)
(0) (1) (2) (3) (4) (5)
Do you have a specific program to evaluate surface treatments? [] Yes [] No Surface treatment season? Start______________ End _________________ Please add any comments or recommendations with respect to improving the overall performance of surface treatments, especially with regard to binder properties and selection for surface treatment applications. ______________________________________________________________________________________
______________________________________________________________________________________
______________________________________________________________________________________
______________________________________________________________________________________
______________________________________________________________________________________
______________________________________________________________________________________
______________________________________________________________________________________
______________________________________________________________________________________
______________________________________________________________________________________
______________________________________________________________________________________
______________________________________________________________________________________
______________________________________________________________________________________
______________________________________________________________________________________
______________________________________________________________________________________
______________________________________________________________________________________
______________________________________________________________________________________
______________________________________________________________________________________
______________________________________________________________________________________
______________________________________________________________________________________
______________________________________________________________________________________
______________________________________________________________________________________
______________________________________________________________________________________
______________________________________________________________________________________
______________________________________________________________________________________
______________________________________________________________________________________
Thank you for your time and effort spent in completing this survey. We plan to use this information to develop an improved specification for
binders used in surface treatments.

60
Outside Experts & Contractors
A performance graded (PG) binder specification has been developed and implemented by TxDOT in Hot Mix Asphalt Concrete projects. These specifications are not directly valid for surface treatment binders. The purpose of this study is to develop an analogous specification system. This survey is the first task towards accomplishing the goal of this project. Please answer the following questions:
Name: ___________________________________________________ Date: _______________ Company/ District ____________________________ Title: ______________________________ Phone: _______________ Fax: ______________ e-mail: _______________________________ TxDOT definition of surface treatment: a single, double, or triple application of either hot asphalt cement materials, asphalt emulsions, or cutback asphalts, each covered with aggregate. These surface treatments are constructed on existing pavements or on a prepared base coarse. These asphalt applications are also commonly called seal coats or chip seals.
In your personal opinion, what defines good performance for a surface treatment? ______________________________________________________________________________________ ______________________________________________________________________________________ ______________________________________________________________________________________ In your experience, what asphalt binders/emulsions have performed well in surface treatments? ______________________________________________________________________________________ ______________________________________________________________________________________ ______________________________________________________________________________ In your experience, what asphalt binders/emulsions have shown poor performance in surface treatments? ______________________________________________________________________________________ ______________________________________________________________________________________ ______________________________________________________________________________________ In what situations do you recommend the use of modified binders? (e.g. weather, existing paving condition, etc.) Please mention modifier and particular situation. ______________________________________________________________________________________ ______________________________________________________________________________________ ______________________________________________________________________________________ ______________________________________________________________________________________ In your opinion, what laboratory tests might be used to predict the field performance of the binder in a surface treatment? ______________________________________________________________________________________ ______________________________________________________________________________________ ______________________________________________________________________________________
What aggregate gradation is best for surface treatments? ______________________________________________________________________________________ ______________________________________________________________________________________ ______________________________________________________________________________________ Do you recommend the use of pre-coated aggregate? If so, under what circumstances? ______________________________________________________________________________________ ______________________________________________________________________________________ ______________________________________________________________________________________
What design methods for surface treatments are you familiar with? What are the main design parameters in each method? ______________________________________________________________________________________ ______________________________________________________________________________________ ______________________________________________________________________________________ ______________________________________________________________________________________

61
In your experience with a particular design method, what were the criteria for binder selection? ______________________________________________________________________________________ ______________________________________________________________________________________ ______________________________________________________________________________________ Does each particular design method you are familiar with account for existing paving condition, traffic levels, turn/acceleration zones, etc.? How? ______________________________________________________________________________________ ______________________________________________________________________________________ ______________________________________________________________________________________ What are the advantages and disadvantages of using a hot applied asphalt cement in a surface treatment? ______________________________________________________________________________________ ______________________________________________________________________________________ ______________________________________________________________________________________ What are the advantages and disadvantages of using an emulsion in a surface treatment? ______________________________________________________________________________________ ______________________________________________________________________________________ ______________________________________________________________________________________ ______________________________________________________________________________________ When would you recommend an emulsion over a hot applied asphalt cement and vice versa? ______________________________________________________________________________________ ______________________________________________________________________________________ ______________________________________________________________________________________ What design parameter most affects the performance of the surface treatment? (e.g. binder selection, aggregate selection, binder-aggregate ratio, construction, etc.) ______________________________________________________________________________________ ______________________________________________________________________________________ ______________________________________________________________________________________ In your experience, what is the average design life for a surface treatment? ______________________________________________________________________________________ ______________________________________________________________________________________ ______________________________________________________________________________________ ______________________________________________________________________________________ ______________________________________________________________________________________
What distresses are more likely to be observed in a surface treatment? What is the main cause in your opinion? ______________________________________________________________________________________ ______________________________________________________________________________________ ______________________________________________________________________________________ How would you prevent the identified distresses? ______________________________________________________________________________________ ______________________________________________________________________________________ ______________________________________________________________________________________ ______________________________________________________________________________________ On a 1 to 3 scale (3 very common), how would you rate the following distresses. Bleeding ( ) Streaking ( ) Aggregate loss ( ) Reflection cracking ( ) Other_____________ ( ) Other_____________ ( )

62
What are the ideal weather and temperature conditions for the placement of a surface treatment? ______________________________________________________________________________________ ______________________________________________________________________________________ ______________________________________________________________________________________ On a 1 to 5 scale (5 very important), how would you rate the following regarding the effect on surface treatment performance. Pavement preparation ( ) Time delay binder-aggregate ( ) Traffic control ( ) Workmanship ( ) Spraying ( ) Rolling ( ) What is your suggested time to wait before opening a section to traffic after application of a surface treatment? ______________________________________________________________________________________ ______________________________________________________________________________________ ______________________________________________________________________________________
Please add any comments or recommendations with respect to improving the overall performance of surface treatments, especially with regard to binder properties and selection for surface treatment applications. ______________________________________________________________________________________
______________________________________________________________________________________
______________________________________________________________________________________
______________________________________________________________________________________
______________________________________________________________________________________
______________________________________________________________________________________
______________________________________________________________________________________
______________________________________________________________________________________
______________________________________________________________________________________
______________________________________________________________________________________
______________________________________________________________________________________
______________________________________________________________________________________
Thank you for your time and effort spent in completing this survey. We plan to use this information to develop an improved specification for binders used in surface treatments.

63
APPENDIX B EVALUATION SURVEY RESULTS
0
1
2
3
4
5
Water Sealing SkidResistance
Tire Noise Appearance Agg.Retention
Cost Effective
AC-5AC-5 w/latexAC-10AC-10 w/latexAC-15-5TRAC-15PAC-20
Figure B1 Asphalt Cement Evaluation Results.
0
1
2
3
4
5
Water Sealing SkidResistance
Tire Noise Appearance Agg. Retention Cost Effective
CRS-2CRS-2PCRS-1PHFRS-2P
Figure B2 Asphalt Emulsion Evaluation Results.
