a phase measurement radio positioning systemcba.mit.edu/docs/theses/99.02.reynolds.pdf · a phase...
TRANSCRIPT

A Phase Measurement Radio Positioning System
for Indoor Use
by
Matthew S. Reynolds
Submitted to the Department of Electrical Engineering and Computer Science
in Partial Fulfillment of the Requirements for the Degree of
Master of Engineering in Electrical Engineering and Computer Science
at the Massachusetts Institute of Technology
February 3, 1999
Copyright 1999 M.I.T. All rights reserved.
Author__________________________________________________________________Department of Electrical Engineering and Computer Science
December 21, 1998
Certified By______________________________________________________________Neil A. Gershenfeld
Thesis Supervisor
Accepted By_____________________________________________________________Arthur C. Smith
Chairman, Department Committee on Graduate Theses

A Phase Measurement Radio Positioning Systemfor Indoor Use
byMatthew S. Reynolds
Submitted to theDepartment of Electrical Engineering and Computer Science
February 3, 1999
In Partial Fulfillment of the Requirements for the Degree ofMaster of Engineering in Electrical Engineering and Computer Science
ABSTRACT
I present here the detailed design for a low frequency radio navigation system called the Building Positioning System (BPS). This system is designed to work indoors, where the microwave radio signals of the Global Positioning System (GPS) cannot be received. Potential applications for this system range from asset tracking, security, and human-com-puter interface, to robot navigation and the management of services as diverse as medical care and postal delivery. I first present the issues surrounding its conceptual design and then describe in detail the component level implementation of the prototype BPS system, which I have designed and built but not yet tested as a whole. I also discuss the test proce-dures which will accompany the deployment of that prototype system in its initial config-uration in its test building, as well as further research that is required to make the system scalable and manufacturable.
Thesis Supervisor: Neil GershenfeldTitle: Assistant Professor of Media Arts and Sciences

A Phase Measurement Radio Positioning System for Indoor Use Reynolds 3
Acknowledgements
I wish to thank the many people who have treated me with kindness and generosity over the past 23 years, especially my mother and father, and brother. Their contageous love of knowledge, family, friends, and our world and its people continuously renews my respect for them. They have created in me impossible dreams and unachievable aspirations which will guide me forward forever.
I must also thank my friends of all species, especially Marisa and Papua, for their trust, friendship, love, and understanding.
This document, the thoughts which it contains, and the person I am, are shaped in no small part by Neil Gershenfeld, Joe Paradiso, Susan Bottari, my wonderful labmates, and the many people who toil under, around, and beyond the vision of Nicholas Negroponte and MIT to create what constitutes for me a nearly perfect working, living, and learning envi-ronment.
Rehmi Post contributed his time, talents, and wit to the debugging of the CPU module and its software development environment.
This work is supported by the Things That Think Consortium of the MIT Media Lab. The author is the recipient of a Motorola Fellowship and wishes to thank the many Motorolans who have been so exceptionally friendly and generous with their time, knowledge, and resources.

A Phase Measurement Radio Positioning System for Indoor Use Reynolds 4
Table of Contents
Chapter 1: Introduction 6Motivation 6LORAN Revisited 7GPS Technology 7How Not To Accomplish Indoor Navigation 8Spread-Spectrum Microwave Systems 9Motion Tracking with Low Frequency Magnetics 10
Chapter 2: Design Goals for BPS 12Overview 12Broadcast Data and Mutual Interference 12Quality of Service 13
Chapter 3: Regulatory Issues 14Overview 14Certification under Part 15 of the FCC Rules 15Field Strength Estimation 15
Chapter 4: Signals and Noise 17Overview 17Frequency Dependent Signal Attenuation 17Types of Noise 18Sources of Additive White Gaussian Noise 18Thermally Dependent Noise Sources 19Atmospheric Noise 20Noise From Other Electronic Devices 21Internally Generated Digital Hash Noise 22Phase Noise 23Phase Noise in Oscillators and Frequency Synthesizers 23Jitter in Sampling Systems 24Phase Offset Errors of Environmental Origin 25
Chapter 5: Positioning by Phase Measurement 26Overview 26The Forward Problem 26The Inverse Problem 28Indoor Wave Propagation and Phase Errors 33A Special Note on the History of Radio Navigation 34
Chapter 6: BPS Signal Structure 36Overview 36Frame Alignment Method 37Framing Error Conditions 37

A Phase Measurement Radio Positioning System for Indoor Use Reynolds 5
Frame Data Interval 38Interframe Signal Processing 39
Chapter 7: Link Parameter Calculation 40Overview 40Transmitting Antenna Performance Estimation 40Receiving Antenna Performance Estimation 41Freespace Path Loss Calculation 42Link Margin and Related Factors 43
Chapter 8: The BPS DSP-based Receiver Unit 44Overview 44Receiver Front End 45Logarithmic Detection and RSSI A/D Conversion 46IF Stages and Filtering 46Signal Conditioning for A/D Conversion 48Receiver Local Oscillator 48Receiver CPU and Interface 49Receiver Real-Time Software 50DMA Transfer of Signal Samples 51Receiver User Interface 51
Chapter 9: BPS Transmitter Design 53Overview 53Transmitter Master Clock and Power Amplifier Modules 54Generation of Stable Signals 54Transmitter Station Switching 55Power Amplifier Design 56Power Supply Issues 57Transmitting Antenna Design 57Antenna Mechanical Assembly 58Antenna Tuning Methods 59
Chapter 10: Concluding Thoughts 60
List of References 61
Appendix A: System Schematics 63BPS Receiver Front End 63BPS Receiver LO and ADC 64BPS Transmitter Clock Unit 65BPS CPU Board 66

A Phase Measurement Radio Positioning System for Indoor Use Reynolds 6
ece
ica-
ipping
e to
mi-
h as
cts to
be
the
ls.
hich
on of
from
S, so
ng.
, to
n
ware
Chapter 1: Introduction
1-1: Motivation
The location of people and objects relative to their environment is a crucial pi
of information for asset tracking, security, and human-computer interface (HCI) appl
tions. These applications may be as simple as tracking the location of a valuable sh
carton or detecting the theft of a laptop computer, or as complex as helping someon
find his or her way around an unfamiliar building. Other applications include the opti
zation of services such as medical care or postal delivery. Current technologies, suc
GPS or differential GPS, can help to solve this problem as long as the people or obje
be tracked are outdoors, where the signals from the 24 orbiting GPS satellites may
received, but there is a latent demand for a similar system that works indoors, where
physics of radio propagation rules out the reception of GPS’s weak microwave signa
This document describes the design and partial implementation of a system w
is called the Building Positioning System, or BPS. This system determines the positi
a small portable receiving unit by measuring the phase of several radio signals sent
fixed positions in a building. The system uses much lower radio frequencies than GP
its signals propagate with relatively little attenuation in a typical home or office buildi
It requires only four fixed transmitting antennas, placed in the corners of the building
provide useful coverage over a very wide area inside the building.
At the time the transmitter, receiver, power amplifier, and antennas have bee
designed and tested individually. A great deal of the real-time signal processing soft

A Phase Measurement Radio Positioning System for Indoor Use Reynolds 7
e pro-
l
,
om-
did not
se of
of very
of
ause
tances
N-
e to
en
mea-
rally
d con-
atomic
has been written and tested. The remaining work consists of testing and deploying th
totype system and repairing the inevitable bugs in hardware and software, which wil
hopefully result in a functional protoype BPS unit.
1-2: LORAN Revisited
This system is similar in principle to the LORAN-A system of radio navigation
which was developed at MIT’s Radiation Laboratory in the 1940s. At that time, the c
plex signal processing techniques required for a spread spectrum system like GPS
exist; the few computers that did exist were incapable of the real-time computations
required to decode GPS signals. Also, the lack of satellite technology prohibited the u
a space-based navigation system. So the engineers of the time turned to a network
powerful fixed transmitters located strategically along the Atlantic and Pacific coasts
the US. These transmitters operated at the relatively low frequency of 2.6 MHz. Bec
of the phenomenon of ionospheric reflection, these signals could propagate great dis
at night, permitting their reception by ships at sea. The navigation officer of a LORA
equipped ship would use a special receiver equipped with a cathode-ray oscilloscop
graphically determine the relative phases of pairs of transmitted signals. He would th
refer to a printed map upon which he would overlay a transparency plot of the phase
surements he had made. This process would yield a position solution that was gene
accurate to within 10Km.
1-3: GPS Technology
Signal processing, computation technology, and space science have advance
siderably over the past 50 years. GPS depends on the use of orbiting space-based

A Phase Measurement Radio Positioning System for Indoor Use Reynolds 8
P),
tivity.
nt of
ivers
its
rs.
s at
in the
sophis-
eep
e
y by
ing
urface
-
a
ter
have
clocks, spread spectrum microwave radios, high speed digital signal processing (DS
and sophisticated mathematics including algorithms that compensate for general rela
[GPS95] The initial design and deployment of GPS for military use by the Departme
Defense in the 1980s has led to the availability of inexpensive commercial GPS rece
in the 1990s. In 1998, a consumer GPS receiver fits in the palm of a hand and costs
manufacturer less than fifty dollars to make. This receiver is capable of reporting the
user’s position to within 50m RMS accuracy at any point on the Earth’s surface.
However, GPS suffers from a fundamental limitation: it cannot be used indoo
The microwave signal from the GPS satellites is extremely weak by the time it arrive
the Earth’s surface, and the presence of the leaves of a tree or the roof of a building
GPS signal path reduce the signal strength to imperceptible levels. Even the use of
ticated cryogenically cooled receiver electronics cannot recover GPS signals when d
inside a typical reinforced concrete building; the imperceptibly weak GPS signals ar
overwhelmed by interference from other electronic equipment or more fundamentall
the blackbody radiation of the building itself. The problem is roughly equivalent to try
to see and decode morse code sent by the beam of a flashlight on Earth-- from the s
of Mars.
1-4: How Not To Accomplish Indoor Navigation
Several potential solutions to the problem of indoor navigation have been pro
posed, ranging in complexity from placing an IR-light emitting beacon equipped with
unique ID in each room, to the use of ultrasonic beacons, to giving the user a compu
vision system to identify her place in the indoor world. The first two of these systems

A Phase Measurement Radio Positioning System for Indoor Use Reynolds 9
their
ave a
ot
rom
ear
ard-
ea-
adio
tain-
lifer-
s have
ech-
FCC
ay be
da-
ding
be
etwork
.
ulti-
the disadvantage of requiring the deployment of a large number of beacon stations;
setup and maintanance would be prohibitive for more than a few rooms. They also h
problem of high granularity in that one knows only that she is in a particular room, n
where she is within that room. The third system, based on computer vision, suffers f
the typical problems of computer vision, including great complexity, the need for a cl
lines of sight around the room, and slow performance even on very fast computing h
ware. Vision based solutions are also generally prohibitive for portable systems for r
sons of cost, size, and power consumption.
1-5: Spread-Spectrum Microwave Systems
Recently, several small startup companies have begun to investigate indoor r
navigation, primarily for the location of large portable objects, like hospital beds con
ing critically ill patients or very expensive packages. They intend to leverage the pro
ation of cellular telephones and wireless networking equipment by adapting the
components used for those purposes to the problem of navigation. These companie
developed prototype systems which use direct sequence spread spectrum (DSSS) t
niques in the 2.4 GHz industrial, scientific and medical (ISM) band set aside by the
for such purposes. A good description of how DSSS may be used for radio ranging m
found in [Dix94]. While it is a step in the right direction this approach has several fun
mental limitations. First, the 2.4 GHz microwave signal is strongly attenuated by buil
materials, so a complete set of fixed station units must be replicated in each room to
served by the system. Second, the many fixed units must be connected by a data n
of some kind, leading to wiring, antenna mounting, and network management issues
Third, the FCC’s bandwidth limitations for the 2.4 GHz band, along with the strong m

A Phase Measurement Radio Positioning System for Indoor Use Reynolds 10
cision
MS
much
s than
e of
ampli-
a sin-
mall
to be
cess-
can
stem
f 15m
posi-
quite
e, it is
e
ally at
path interference caused by even small conductive objects in the room, limit the pre
with which one may make DSSS ranging calculations. These companies claim an R
error of about 3-5 meters. Finally, even though microwave electronics have become
cheaper, easier to use, and less power hungry, these issues still render DSSS a les
adequate solution for many uses, especially those relating to HCI applications.
1-6: Motion Tracking with Low Frequency Magnetics
For HCI applications, specifically the capture of human motion for the purpos
animating computer generated characters, some prior work has been done using the
tude measurement of very low frequency magnetic fields. These systems consist of
gle transmitter, an antenna made from two orthogonal coils, and a large number of s
receiving antennas which are placed on the clothing of the person whose motion is
recorded. These receiving antennas have little onboard circuitry; all of the signal pro
ing is done in a large box containing the transmitter. The attached computer system
then keep track of the motion of as many as 50 points on the person’s body.
The person being tracked is therefore wired with a rather large and unwieldy
umbilical tether which connects her to a big metal box. The maximum range of this sy
depends on the size and placement of the transmitting antenna, but typical ranges o
are claimed with a measurement precision of 5-7 cm. The system claims to provide
ton updates at rates of 30-50 measurements per second. While this performance is
sufficient for the system’s intended use in motion capture from a performer on a stag
not sufficient for many other applications in which the performer must be free to mov
over a wide distance. Also, this system, because all signal processing is done centr

A Phase Measurement Radio Positioning System for Indoor Use Reynolds 11
e
the transmitter, is not suited to spatially tiling with other such systems to cover a widoperational space.

A Phase Measurement Radio Positioning System for Indoor Use Reynolds 12
that
ded by
e,
quip-
is an
of the
rtable
sible.
stem
ng used
nless
sages
bout
ce so
stem
l inter-
Chapter 2: Design Goals for BPS
2-1: Overview
The goals of this development effort are to produce a radio navigation system
can cover large areas of space within a building, even though that space may be divi
walls, floors, or ceilings. This system should require a minimum of fixed infrastructur
including antennas, system modules, and interconnecting wiring. The transmitting e
ment must be biologically safe and must consume a minimum of bandwidth. As this
experimental device it need not be FCC compliant, but it should make sensible use
RF spectrum so that minor redesign of it or the FCC rules may permit its use. The po
receiver should be small, light, reasonably power efficient, and as low in cost as pos
The system should support a virtually unlimited number of such receivers. As the sy
may be used to track people as well as objects, the system should be capable of bei
anonymously, so that the position of a receiver is not known by any central device u
the tagged person releases that information.
2-2: Broadcast Data and Mutual Interference
The system should have a minimal data transfer capability for broadcast mes
to the receivers for the purpose of advising the receiver’s software or the end user a
the health of the system, or for broadcasting a GPS-derived system position referen
that the receiving units may calculate their position in world coordinates as well as sy
coordinates. Many systems should coexist in adjacent spaces without undue mutua

A Phase Measurement Radio Positioning System for Indoor Use Reynolds 13
eiver
ility
ere
func-
ary
ference. Finally, the position output should be available via a small display on the rec
or by a RS-232 connection to a laptop computer or logging device.
2-3: Quality of Service
The receiving device should report a position solution that has a good availab
of part-per-thousand class position solutions. This means that if the coverage area w
50m, the positional accuracy should be 5cm. The positional accuracy should have no
tional dependency on the distance from the transmitters to the receiver, but it may v
due to multipath and other artifacts of the radio propagation process.

A Phase Measurement Radio Positioning System for Indoor Use Reynolds 14
e into
it
tions
dia-
which
mber
n com-
a dif-
environ-
a
e harm
n the
CC’s
f
Chapter 3: Regulatory Issues
3-1: Overview
The designer of a commercial product which uses radio frequencies must tak
account such issues as compliance with existing FCC regulations [FCC96] which lim
transmitted frequencies, bandwidth, and power levels, as well as more recent regula
which are intended to protect people from excessive exposure to electromagnetic ra
tion. These issues are among the most nebulous faced by the designers of devices
use radio signals because even the simplest of devices must comply with a large nu
of regulations. Before it can be sold, each device must be tested to ensure that it is i
pliance with all applicable regulations. This process is described in [FCC86]. This is
ficult task, because exactly what the regulations mean is guesswork even for an
experienced RF engineer. Fortunately, as the present system is used in a research
ment, these concerns may be temporarily ignored for the purpose of demonstrating
working system, as long as the system does not harm existing radio services or caus
to nearby people.
However, it is important to consider the commercial potential that exists for an
indoor radio positioning system. It is the author’s belief that the principles employed i
design of this system are compatible with existing FCC regulations as described in
[FCC96]; a similar system could be constructed that may be sold for use under the F
allocations for Industrial, Scientific, and Medical (ISM) devices at 6.78MHz or
13.56MHz. Alternatively, the FCC has set aside spectrum near 2.0MHz for the use o

A Phase Measurement Radio Positioning System for Indoor Use Reynolds 15
for a
z is
oper-
signal
with
the
ed in
m
field
rength
cali-
ld
Hz
We
elat-
it
radio navigation devices, although it would be unusual for this spectrum to be used
nongovernmental purpose.
In the case of the prototype device, the chosen operating frequency of 1.9MH
within the spectrum allocated to the Amateur Radio Service, and as such this system
ates as an experimental beacon device under the author’s Amateur Radio license. Its
bandwidth of less than 14KHz and its transmitted power of 10W-50W are compatible
the applicable regulations for Amateur Radio stations.
3-2: Certification under Part 15 of the FCC Rules
We will briefly describe how BPS may be redesigned to fit into Part 15.223 of
FCC’s regulations, Title 47, governing unlicensed electronic devices operating in ISM
bands. Certification under Part 15 rules occurs after emitted field strength is measur
an FCC approved laboratory’s anechoic chamber at a wide variety of frequencies fro
9KHz to 10GHz. All unlicensed devices must emit less than the maximum allowable
strength at every frequency to be certified under Part 15. For these purposes, field st
is the peak electric field intensity measured in microvolts per meter, with a specially
brated antenna located at a specified distance from the emitting device.
3-3: Field Strength Estimation
At our BPS carrier frequency of 1.9MHz, Part 15.223 specifies a maximum fie
strength of 100 microvolts per meter, measured at 30 meters distance. In the 13.56M
ISM band we may emit a field strength of 10000 microvolts per meter at 30 meters.
will estimate the emitted field strength of a BPS transmitter by using an expression r
ing transmitted power to field strength. This is really only an approximation because

A Phase Measurement Radio Positioning System for Indoor Use Reynolds 16
field
ncy
of the
he
m’s
timated
t.
asily
does not take into account such factors as antenna sidelobes, peak versus average
intensity, or power radiated at harmonic frequencies.
Eq. 3-1: Field Strength
In this expression, P is the transmitter’s output power, is the antenna efficie
derived in Chapter 7, D is the distance from source to receiver, and E is the strength
electric field. For those unfamiliar with electromagnetic waves, we note that is t
characteristic impedance of free space in ohms. This expression simply restates Oh
Law. Substituting the BPS parameters discussed in Chapter 7, our system has an es
field strength of 400 microvolts per meter at 30 meters when operating at 20W outpu
This system would have to be redesigned to be certified at 1.9MHz but would pass e
at 13.56MHz.
Pη4πD
2------------- E
2
120π------------=
η
120π

A Phase Measurement Radio Positioning System for Indoor Use Reynolds 17
the
eople,
tions
uire
ignals
als are
s from
one or
envi-
urces
e
an
assing
dio
Chapter 4: Signals and Noise
4-1: Overview
The use of a radio navigation system indoors presents several challenges to
designer of that system. Among these are signal attenuation by building materials, p
and objects, self-interference due to multipath propagation effects, and phase distor
caused by the presence of large amounts of metal in the building. These issues req
serious consideration because they may affect the range of the transmitted position s
or the accuracy of the position solution.
4-2: Frequency Dependent Signal Attenuation
Signal attenuation is perhaps the most fundamental technical problem to be
addressed, because no radio positioning system can operate when the tracking sign
too weak to be received. Any receiver is essentially a device which separates signal
noise, and recovers the information content of those signals. Usually, there are only
a few sources of the desired signal, but there are many sources of noise in a typical
ronment. We will first consider consider signal attenuation, and then the expected so
of noise. The goal of our design process is to maximize the signal to noise ratio at th
receiver by minimizing both noise and attenuation.
In general, given typical wood or reinforced concrete buildings, attenuation is
increasing function of frequency. This explains why GPS does not work indoors; its
microwave carrier signal at 1.5GHz undergoes severe attenuation in the course of p
through even the thinnest roofing materials. Other, commercially available indoor ra

A Phase Measurement Radio Positioning System for Indoor Use Reynolds 18
ttenu-
ncrete,
more
e sig-
, which
dget
h
oise
type
uces
of the
m the
un-
r’s pas-
ver, or
diffi-
oise
positioning systems use the ISM allocation at 2.4-2.45GHz. These frequencies are a
ated even more severely by passage through materials as common as reinforced co
people, and plant leaves. It is not uncommon for a 2.4GHz signal to be attenuated by
than 20dB when a single reinforced concrete wall appears in an otherwise free-spac
nal path. Rain induced attenuations at 1.5GHz can reach as much as 12dB [GPS95]
can render the GPS signals inaudible to receivers with poor sensitivity. In the link bu
analysis presented later, we will make several assumptions in an effort to bound pat
losses at 1.9MHz and determine a lower bound on the system’s expected signal to n
ratio in actual use.
4-3: Types of Noise
For our purposes, noise on the BPS channel is of two distinct types. The first
of noise is an uncorrelated, additive white Gaussian noise (AWGN) which simply red
the signal to noise ratio at the receiver. It does not cause any distortion in the phase
system’s signals as received at the receiving antenna, but it must be rejected by the
receiver’s signal processing algorithms. The second type of noise is phase noise fro
transmitter, receiver, or channel, which will be covered in the next section.
4-4: Sources of Additive White Gaussian Noise
We will first consider sources of AWGN and means of mitigating its effects. F
damental physical processes such as the motion of thermal electrons in the receive
sive components, quantum effects in semiconductor devices that consitute the recei
the broadband impulses produced by a lightning strike are responsible for the most
cult sources of AWGN to control. It is worthwhile to note that even though quantum n

A Phase Measurement Radio Positioning System for Indoor Use Reynolds 19
rs
.
. It is
ture
anism
s a
tenu-
he
rated
easure-
nt of
e
z. The
f that
put
in transistors, for example, is not Gaussian in profile over a wide bandwidth, enginee
will usually approximate its effects as Gaussian in the narrow bandwidths of interest
4-5: Thermally Dependent Noise Sources
Thermally-dependent noise is the result of many different physical processes
manifest as resistor noise due to the motion of thermal electrons, as well as tempera
dependent transistor noise which is largely a quantum effect. Regardless of the mech
of its generation, the best known solution to such noise is to build a receiver that ha
superconducting input filter and first amplifier. This is because the noise figure of a
receiver with substantial front-end gain is determined principally by the sum of the at
ation of front-end passive components and the contribution of the noise caused by t
semiconductor device providing the amplification. We find that the noise power gene
in the resistance of the passive components increases with temperature as well as m
ment bandwidth:
Eq. 4-1: Thermal Noise in Resistors
Here, N is the noise power available across any resistive element, independe
its resistance, is Boltzmann’s constant, T is the temperature of th
passive components in degrees Kelvin, and W is the measurement bandwith in Hert
noise contribution from an active device, like a transistor, is called the noise figure o
device and is usually expressed as a ratio of input signal to noise ratio (SNR) to out
SNR; it is most convenient to express noise figures in dB at a 290K.
N κTW=
κ 1.3823–×10
W°K Hz⋅( )
-----------------------=

A Phase Measurement Radio Positioning System for Indoor Use Reynolds 20
ould
ry
pass
ted
nd
ni-
s. This
s like
only
ces-
in
ivers
ce.
t the
atmo-
. This
urces
ery
e
If we wanted to build the most sensitive and selective receiver possible, we w
have little choice but to consider the most microscopic effects. Cryogenically cooled
receivers attack thermal noise from two fronts. First, superconducting filters have ve
low resistance and consequently extremely high Q factors. This means that they can
signals of a very well defined bandwidth with little attenuation while rejecting unwan
signals with extremely high attenuation. This allows very good rejection of out-of-ba
signals as well as out-of-band noise. Second, cooling the semiconductor devices mi
mizes the noise that is generated when thermal electrons jump among quantum state
noise is generally responsible for determining the noise figure of microwave receiver
those used for GPS. Superconducting filter technology, which until recently was used
in radio telescopes and NASA’s Deep Space Network, is becoming commercially ne
sary as the proliferation of wireless devices in crowded urban environments results
ever-increasing levels of interference at cellular telephone base stations. These rece
are extremely sensitive and must be protected at all cost from out-of-band interferen
In our system, however, the dominant contributors to the signal to noise ratio a
position tracking receiver are the more macroscopic sources of noise in the form of
spheric noise and adjacent-channel interference caused by errant electronic devices
is because our signal bandwidth is relatively small, and thermally dependent noise so
are completely dominated by externally generated noise.
4-6: Atmospheric Noise
Lightning and other sources of atmospheric noise are problematic mainly at v
low frequencies. This is partially because antennas for low frequency signals must b

A Phase Measurement Radio Positioning System for Indoor Use Reynolds 21
e
which
iate
rged
MHz
the
on
to
nnas
inter-
sub-
er
ener-
har-
te at
radi-
xpose
physically very large in order to be effective. Recently it has been determined that th
charged portion of the Earth’s atmosphere can act as a very large resonant antenna
forms part of the global circuit for atmospheric electricity. This large antenna can rad
impulse noise from lightning discharges or electrostatic noise from the motion of cha
clouds over great distances. Fortunately, the small antennas and the choice of a 1.9
carrier frequency for the proposed system minimizes this potential problem because
physically small receiving antennas couple very inefficiently to the electric field porti
of the very long wavelength 1.9MHz signal. Their electrostatic shields are designed
admit only the magnetic field component of the radio wave; these shielded loop ante
thus provide immunity in large part to atmospheric noise pickup.
4-7: Noise From Other Electronic Devices
Probably the most significant source of noise in our system is that caused by
ference from other electronic devices. This interference ranges from harmonics and
harmonics of computer clock signals to stray emissions from video displays and oth
electronic equipment. A typical television monitor, for example, has a circuit which
deflects the CRT’s electron beam horizontally across its phosphor face. This circuit g
ates a sawtooth waveform at 18.75KHz and is notorious for the wide spectrum of its
monics. Other internal oscillators commonly found in monitors and televisions opera
1.84MHz, 3.58MHz, 14.3MHz, and 40MHz.
Because of the irritating effects of these circuits, and their ubiquity, computer
monitor and television manufacturers must now go to great lengths to minimize the
ated harmonics of these signals. This is beginning to clear the spectrum enough to e

A Phase Measurement Radio Positioning System for Indoor Use Reynolds 22
ajor
m ana-
laced
to a
d can
cal
aster,
g of
from
BPS
m
of
cuits
le,
es.
d the
entry.
the next largest sources of interference. Computer clock signals are often the next m
source of interference. In one computer the author recently surveyed with a spectru
lyzer, more than 20 signal peaks of widely varying frequencies and strengths were
detected when the computer was examined with a small unshielded loop antenna p
on its plastic case. Any of these signals, if of sufficient power and in close proximity
BPS receiver, could cause the confusion of the system’s signal processing chain an
therefore result in measurement errors.
4-8: Internally Generated Digital Hash Noise
We know that the Fourier transform of the delta function is 1. This mathemati
fact explains many of the RF engineer’s sleepless nights. As digital circuits become f
the rise and fall times of their signals must necessarily become faster. Fast switchin
digital circuits generates broadband noise. The task of immunizing the BPS receiver
the hash noise of high speed digital circuits is made even more difficult because the
unit itself contains many of these circuits! For this reason, metal shield partitions for
Faraday cages around sensitive receiver circuits in the hope of reducing this source
noise as much as possible. Fortunately, these shield boxes also protect sensitive cir
from externally generated noise as well. Circuit board layouts, miniature coaxial cab
and ferrite beads are all used to prevent noise from entering these little Faraday cag
This can only help to protect against noise which does not enter the receiver
through the antenna or power ports, however. The use of a battery power supply an
use of an electrostatically shielded antenna help to reduce these pathways for noise

A Phase Measurement Radio Positioning System for Indoor Use Reynolds 23
ise is
e
of
ated
PS
he sig-
t
attempt-
pling
cilla-
tal
as
mea-
n the
he
ut the
very
0
tem-
4-9: Phase Noise
Phase noise has its origin in three major places. The first source of phase no
the transmitting chain, especially the system’s master oscillator unit. This noise is th
result of random processes involved in the operation of the oscillators and amplifiers
the transmitter itself. The second source of phase noise is an environmentally gener
position-sensitive phase offset. These offsets occur when the velocity with which a B
signal travels varies because of objects in the environment. This is unavoidable, as t
nals from the four spatially-separated transmitting stations necesssarily take differen
paths to reach the receiver. The third source of phase noise occurs because we are
ing to measure signal phases with an imperfect receiver, whose own clocks and sam
devices will exhibit phase jitter similar in nature to that caused by the transmitter’s os
tors.
4-10: Phase Noise in Oscillators and Frequency Synthesizers
In our system, oscillator induced phase noise is minimized by the use of crys
oscillators and direct digital synthesis techniques. Crystal resonators have Q factors
high as one million and therefore act as their own very narrow bandpass filters. The
sured phase noise of the temperature compensated crystal oscillator module used i
BPS transmitter unit is -140dBc at a 10KHz offset. This means that the signal from t
oscillator is as pure as can be measured on a sophisticated spectrum analyzer witho
use of extraordinary measures; the measured spurious power at the 10KHz offset is
small. If the oscillator output were a 1 Watt signal, the noise 10KHz away would be 1
femtowatts. This oscillator is specified to be stable to within 10ppm per day at room
perature and is not a major contributor to phase measurement errors.
A Phase Measurement Radio Positioning System for Indoor Use Reynolds 24
or
hich
te in
ncy
ave
ystal
ance
ghly
e
ffset
ly by
gital
ystal
is
is
erag-
oxi-
ron-
The transmitted signal itself is derived directly from the master crystal oscillat
by the use of direct digital synthesis (DDS) techniques. The DDS is a digital device w
uses internal logic to perform sine wave lookup from a numerical table stored in the
device’s on chip ROM. These numbers are then reconstituted at a programmable ra
the device’s 10-bit digital to analog converter (DAC) to provide a signal whose freque
and phase may be digitally adjusted by means of a 40-bit tuning word. As the sine w
table is fixed in ROM and the rate of its use is controlled by an extremely low noise cr
oscillator, the DDS’s close-in phase noise performance is dominated by the perform
of its DAC. Fortunately, the DAC is very good and the aggregate phase noise is rou
equivalent to that of a good LC oscillator; according to Analog Devices in [Ana99], th
manufacturer of the DDS IC used in our system, phase noise of -120dBc at 10KHz o
is typical.
4-11: Jitter in Sampling Systems
Phase measurement errors encountered in the receiver unit are caused large
the jitter of the sample and hold (S/H) unit which is part of the receiver’s analog-to-di
converter (ADC). This is due to the fact that all receiver clocks are derived from a cr
oscillator similar in specifications to that of the transmitter. This ADC sampling jitter
specified in [Ana98] to be better than plus or minus 100 picoseconds. Translating th
time-domain measurement into a perceived phase error is difficult because of the av
ing process that the receiver performs, but the raw 100pS jitter corresponds to appr
mately 1.62 millidegrees of phase jitter at each sample when the 455KHz receiver
intermediate frequency (IF) is digitized. This jitter is the major contributor to non-envi
mental phase measurement errors.

A Phase Measurement Radio Positioning System for Indoor Use Reynolds 25
e. At
s
etal
n,
ns-
recise
t for
te
ure-
ity of
aviga-
hase
eri-
4-12: Phase Offset Errors of Environmental Origin
The estimation of phase errors caused by environmental effects is troublesom
microwave frequencies these errors take the form of multipath propagation problem
which can at times be extremely severe in areas surrounded by reflective walls or m
objects. The situation is not so clear at low frequencies. To a first-order approximatio
physical intuition suggests that metal objects significantly smaller in size than the tra
mitted signal’s wavelength should present relatively little reflectivity to incident radio
waves. However, higher order effects can become very important when extremely p
measurements are made.
Practical experience suggests that these effects do indeed become importan
large objects. For example, the US Coast Guard’s published LORAN-C navigational
charts include offset errors caused by large metal structures such as the Golden Ga
Bridge. According to the Coast Guard in [LOR95], mariners making LORAN-C meas
ments while located closer than 100m from the bridge should be alert to the possibil
positioning errors and should include the fixed offsets found on the Coast Guard’s n
tional charts to account for these errors. This is in some ways encouraging; indoor p
errors of environmental cause should be limited due to the fact that the Golden Gate
Bridge is much too large to fit inside a typical building. More research and some exp
menting will be needed to determine whether very close proximity to much smaller
objects will result in significant position errors in a typical indoor case.

A Phase Measurement Radio Positioning System for Indoor Use Reynolds 26
se
is
from
those
BPS
et of
d for
st
at a
ted
n
they
uild-
re of
tter
nal.
MHz,
Chapter 5: Positioning by Phase Measurement
5-1: Overview
In this chapter we will examine how poisiton can be determined by signal pha
measurement. We will consider this problem in two parts. First, the forward problem
presented. This is the problem of determining what the relative phases of the signals
the BPS fixed stations should be at a receiver located in a particular place relative to
fixed transmitters. The second part is the inverse problem, which is actually what the
receiver must do. This is the problem of determining the receiver’s position, given a s
signals received from the BPS fixed station. The basic signal processing tools neede
this task are discussed in [Opp89].
5-2: The Forward Problem
To determine the relative phases of signals received at a remote point, we mu
consider the basic facts of radio wave propagation. For our purposes, waves travel
fixed speed, the speed of light in a vacuum, . In our system, signals are emit
from BPS transmitter stations S0-S3 which are placed at particular locations within a
imaginary cubic building. These signals emit spherical wavefronts which travel until
are received at the BPS receiver R, which is located at some arbitrary place in our b
ing. The system looks like the drawing in Figure 5-1, which omits the internal structu
the building for clarity. We assume that the maximum distance between any transmi
and any possible receiver position is less than one wavelength of the transmitted sig
This is one reason why it is convenient for BPS to operate at low frequencies; at 1.9
38×10
mS----

A Phase Measurement Radio Positioning System for Indoor Use Reynolds 27
ding
f the
as a
.
own
the wavelength of the transmitted signal is about 157m, which is larger than the buil
for which the system is designed.
Figure 5-1: Placement of Transmitters and Receiver
Assuming that all transmitting stations emit pure, sinusoidal signals that are o
same frequency f, with zero phase offset, we can use the fact that the distance Di from
each transmitter to the receiver adds a finite transit delay. We will express this delay
fraction of the signal’s wavelength and denote it with the symbol in Eq. 5-1
Eq. 5-1: Forward Model
This is our simplified forward model for the signals received at the receiver.
Graphically, at the receiver’s location our transmitted signals would look like those sh
below in Figure 5-2.
φi2πfDi
c--------------=
S0 t( ) 2πf φ0+( )sin=
S1 t( ) 2πf φ1+( )sin=
S2 t( ) 2πf φ2+( )sin=
S3 t( ) 2πf φ3+( )sin=

A Phase Measurement Radio Positioning System for Indoor Use Reynolds 28
our
rans-
offset
,
ever;
. Stated
te
Figure 5-2: Transmitted Signals from Stations S0, S1, and S2
5-3: The Inverse Problem
As long as the transmitted signal’s wavelength is longer than the diagonal of
cubic building in Figure 5-1, we notice that the transit time of the signals from each t
mitter to the receiver adds a non-zero phase offset to the measured signal. This
is related to the receiver’s distance from the transmitter, the speed of light
and to the transmitted frequency as shown in Eq. 5-2. There is a lurking issue, how
phase is only a meaningful concept when expressed with respect to some reference
another way, our problem is complicated by the fact that there is no notion of absolu
phase; we can only measure phase differences between pairs of signals.
Signal From Station 0
Signal From Station 1
Signal From Station 2
Ti φi
c 38×10=
mS----
f
A Phase Measurement Radio Positioning System for Indoor Use Reynolds 29
airs of
ce
use
ulti-
in
se
plitude
iscrete
l vec-
of
he
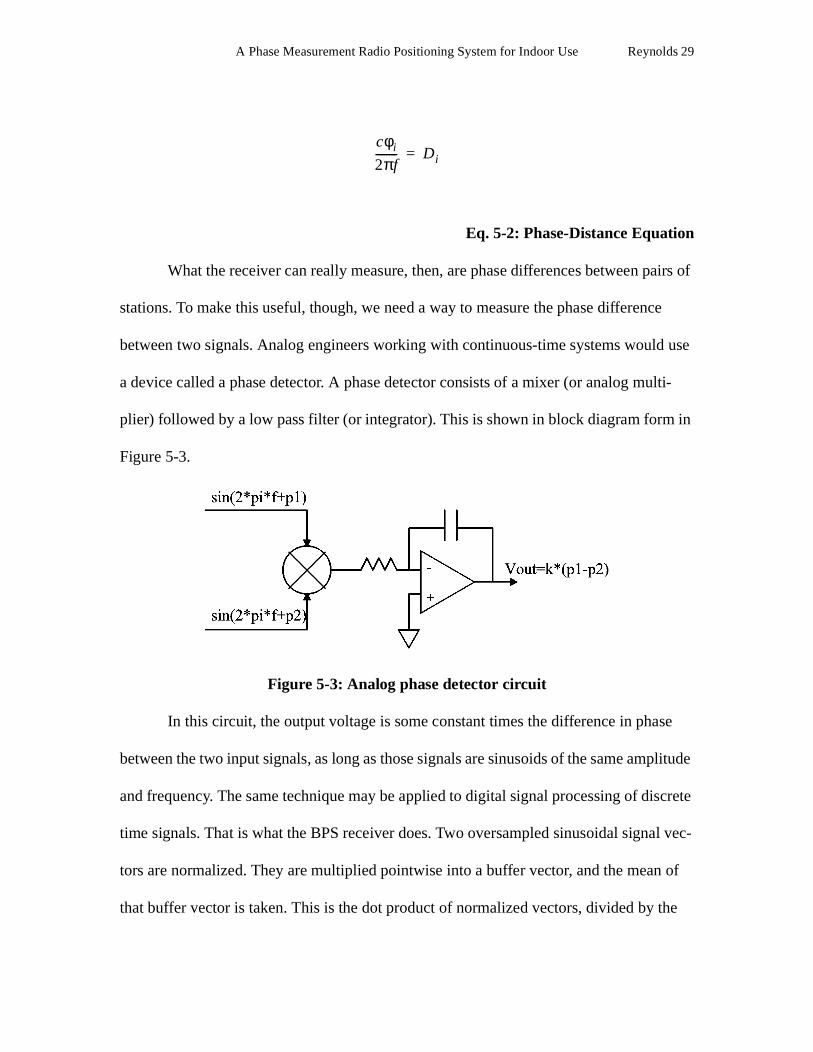
Eq. 5-2: Phase-Distance Equation
What the receiver can really measure, then, are phase differences between p
stations. To make this useful, though, we need a way to measure the phase differen
between two signals. Analog engineers working with continuous-time systems would
a device called a phase detector. A phase detector consists of a mixer (or analog m
plier) followed by a low pass filter (or integrator). This is shown in block diagram form
Figure 5-3.
Figure 5-3: Analog phase detector circuit
In this circuit, the output voltage is some constant times the difference in pha
between the two input signals, as long as those signals are sinusoids of the same am
and frequency. The same technique may be applied to digital signal processing of d
time signals. That is what the BPS receiver does. Two oversampled sinusoidal signa
tors are normalized. They are multiplied pointwise into a buffer vector, and the mean
that buffer vector is taken. This is the dot product of normalized vectors, divided by t
cφi
2πf-------- Di=

A Phase Measurement Radio Positioning System for Indoor Use Reynolds 30
enting
es
lots is
lf of
n of
als of
on of
e dis-
en two
why
number of samples in the input vectors. The resultant is a value from -1 to 1, repres
a phase difference of to .
Figure 5-4 illustrates this point by displaying the three pairs of phase differenc
that arise between any three of the four fixed stations. The source signals for these p
derived from the same forward model developed in Eq. 5-1. Plotted in the bottom ha
Figure 5-4 is the dot product of the two signals in the upper half, along with the mea
that dot product. This shows how the mean of the dot product of two sinusoidal sign
the same frequency indicates the phase difference between them
Figure 5-4: Pairwise phase differences for three stations
The last problem is how to take these phase differences and derive the locati
the receiver. The issue is that phase differences between stations do not indicate th
tance to a particular station. Instead, they represent the difference in distance betwe
stations, thus leading to hyperbolic curves of constant differential distances. This is
π– π
−1
−0.5
0
0.5
1Signals S1 and S2
−1
−0.5
0
0.5
1S1*S2 and Mean(S1*S2)
−1
−0.5
0
0.5
1Signals S2 and S3
−1
−0.5
0
0.5
1S2*S3 and Mean(S2*S3)
−1
−0.5
0
0.5
1Signals S1 and S3
−1
−0.5
0
0.5
1S1*S3 and Mean(S1*S3)

A Phase Measurement Radio Positioning System for Indoor Use Reynolds 31
rs for
5-5.
the
e it is
osi-
sition
ea at
rsect in
itting
ddi-
LORAN operators used maps and overlays; these overlays were graphical calculato
determining the intersection of several hyperbolic curves of the type shown in Figure
Figure 5-5: Position Solution by Intersecting Hyperboloids
In Figure 5-5 we see the intersection of three hyperbolic curves, derived from
measurement of all three pairs of signals taken from three transmitting stations. Whil
only strictly necessary to intersect two hyperboloids to generate a two dimensional p
tion solution, this graph shows why it is best to intersect every available pair. The po
solution reported by the receiver should lie somewhere within the small triangular ar
the intersection. Because of noise in the measurement, the three curves do not inte
a single point. This is a reason to provide more than the minimum number of transm
stations (we provide four stations to determine position in three dimensions). Each a
tional transmitter adds more information to the position solution process.
0 0.5 1 1.5 2 2.5 3 3.5 40
0.5
1
1.5
2
2.5
3
3.5
4Hyperbolic Plot of Three Phase Differences
X−Axis Position
Y−Ax
is P
ositi
on

A Phase Measurement Radio Positioning System for Indoor Use Reynolds 32
ould
espe-
ad to
is 1 as
n
ibed
fil-
ac-
ters
ship
dis-
er
ter
vious
ng the
t that
e met-
f a
When deciding which point to report as the receiver’s position, the software sh
take into account such factors as received signal strength, last known position, and
cially the angle formed between each pair of hyperboloids. Uncertainty is minimized
when two hyperbolic sections intersect at right angles, because small noise inputs le
large changes in the point of intersection. In Figure 5-5, the position output from the
receiver should not be as close to the intersections with the curve whose Y-intercept
it is to the other intersection. That is because the middle curve intersects the solutio
region at a more acute angle than the other two curves.
Mathematically, the receiver should use a Kalman-filtering algorithm as descr
in [Ger98] to filter the position solutions before they are output to the user. A Kalman
ter is a way of formalizing the notion of having an adaptive weighting among many f
tors, each of which contribute some information about the user’s position. Kalman fil
are commonly used in all kinds of navigation systems, including missile guidance and
navigation systems. For example, the Kalman filter “knows” that people do not move
continuously; if the position solution from the hyperbolic solver suddenly jumps farth
away by 20 meters in less time than a person could move 20 meters, the Kalman fil
would assign less weight to the current position solution and more weight to the pre
position solution, and would report an answer closer to the previous solution.
As usual in cases where noise or Nature intersect measurement needs, solvi
inverse problem is much harder than solving the forward problem. There is no doub
there are better methods than these that would minimize errors as determined by on
ric or another. Neil Gershenfeld has proposed that this problem be cast in the form o

A Phase Measurement Radio Positioning System for Indoor Use Reynolds 33
8] to
o
t are
one
ight-
ort-
an
avels
lar
w-
ugh
erial
ric
t
ry
st in
mate-
nonlinear search problem, and he suggests the application of Powell’s method [Ger9
arrive at a solution with an iterative method. This method could doubtless be made t
work, but further research would be necessary to characterize the types of noise tha
experienced in an operating BPS system before making a decision about the use of
method of solution or another. I have proposed what I think is the simplest, most stra
forward solution and am waiting for the completion of the system to elucidate the sh
comings of this method.
5-4: Indoor Wave Propagation and Phase Errors
All electromagnetic waves, regardless of their frequency or power, consist of
electric field component and a perpendicular magnetic field component. The wave tr
in the direction of the Poynting vector, , which is in the direction perpendicu
to both the electric and magnetic field components. We have all learned that, as is
assumed above, an electromagnetic wave “travels at the speed of light”, . Ho
ever, when we solve Maxwell’s equations for their wave solution, we notice that the
velocity of wave propagation is not really a constant. It depends on the material thro
which the wave is travelling. We usually write the wave propagation velocity in a mat
as , where is the magnetic permeability of the material and is its dielect
constant. It is a good thing that a vacuum has a small but nonzero dielectric constan
and permeability , so that . It is also a good thing that air is not ve
dense; because there is little “stuff” in air, electromagnetic waves travel almost as fa
air as in a vacuum. It is only when the BPS signals travel through large quantities of
P E B×=
38×10
ms----
V 1
µ ε⋅--------------= µ ε
ε0
µ01
µ0ε0( )-------------------- 3
8×10=ms----
A Phase Measurement Radio Positioning System for Indoor Use Reynolds 34
t
er than
n air.
f
an
be and
hen a
slow
Only
er is
s very
ation.
eri-
ios
ave
the
the
gi-
rials with high permeabilities or high dielectric constants that we have to worry abou
phase errors. For example, soft iron has a permeability over a thousand times great
air, and plastics like teflon can have a dielectric constant two to ten times greater tha
For this reason we might suspect that in a typical building environment, full o
metals and plastics, the signals from the BPS transmitters will be travelling slower th
expected, leading the system to calculate distances that are longer than they should
thus report erroneous position information. It is not that simple. One reason is that w
wave that has been travelling in air hits the edge of another material it must abruptly
down. This leads to reflection at the boundary between the air and the foreign object.
a fraction of the incident power actually travels through the object; the rest of the pow
reflected back and continues to propagate in the air in another direction. Because it i
difficult to predict the paths a wave will travel in a building, further work and a lot of
experimentation is needed to make any quantitative statements about indoor propag
This is especially true at the low frequencies that BPS uses; most of the existing exp
mental work has been done in the 100MHz-2GHz spectrum used for land mobile rad
and cellular telephones. Low frequency propagation in buildings is still largely unex-
plored.
5-5: A Special Note on the History of Radio Navigation
The underlying mathematical and physical principles underlying this chapter h
been well understood for many years. I wish to take this opportunity to acknowledge
pioneering work on radar and LORAN carried out at the MIT Radiation Laboratory in
1940s. The scientists working at the Rad Lab broke new ground in many areas of en

A Phase Measurement Radio Positioning System for Indoor Use Reynolds 35
ad-
a
tative
and
excel-
neering and physics while laboring under the enormous pressure of World War II. Re
ing the volumes of the original Rad Lab series in [Rad48] and [Hal47] has given me
profound appreciation for that work and the people who conducted it. For the authori
history on the development of radar, which also touches on many of the engineering
social issues surrounding radio navigation, the reader is directed to Robert Buderi’s
lent book [Bud97].

A Phase Measurement Radio Positioning System for Indoor Use Reynolds 36
ich is
ch
loca-
ta
trans-
bps.
the
wn
Chapter 6: BPS Signal Structure
6-1: Overview
The basic BPS signal structure consists of a set of 10mS frames, each of wh
formed from four signal periods and one data period. The four signal periods are ea
1.5mS long and consist of unmodulated carrier signal from each of the four primary
tion service transmitters. The remaining 4mS of each frame consists of 3.9mS of da
period, followed by 100uS of silence. The 3.9mS data period consists of digital data
mitted by primary location service transmitter 0, using an FSK modulation at 10.25K
The silent periods serve to allow the receiver sufficient time to recognize the end of
frame and to process the data received during each frame’s data period. This is sho
graphically in Figure 6-1 below.
Figure 6-1: BPS Signal Frame Timing

A Phase Measurement Radio Positioning System for Indoor Use Reynolds 37
or
me.
er’s
a sin-
e fast
MA
, yield-
to
tem
be
hey
me
raises
6-2: Frame Alignment Method
The receiver’s sampling engine digitizes the receiver’s signal strength indicat
(RSSI) voltage with the microprocessor’s slow ADC and looks for a 100uS period of
silence from the receiver IF module signifying the imminent beginning of a signal fra
When the RSSI indicates a silent period of 100uS, the high speed acquisition system
begins the acquire period on each of the four transmitter phase intervals. The receiv
DMA system is capable of capturing 6.5mS (65536 samples at 10Msamples/sec) in
gle shot measurement, but we capture only the first 6.0mS of the signal frame with th
ADC. This results in a buffer of 60K 12-bit words, or 90K bytes of raw data. These D
periods include 5.0uS dead times at the beginning and end of each subframe period
ing a total of 10.0uS to allow for the transmitter switching and power control systems
settle.
The 6.0mS DMA periods are timed by the timer pattern generator unit in the
SH7034’s peripheral controller, which requests a highest-priority DMA transfer at the
appropriate times. The processor is essentially idle during these periods, but the sys
bus is saturated by the ADC data filling its SRAM buffer. A simple refinement would
to have correlation or user interface routines running from on-chip RAM as long as t
do not require the bus. The 90K byte sample buffer is then passed to the non-real-ti
remainder of the signal processing system.
6-3: Framing Error Conditions
If two entire frame periods (20mS) pass with no silence interval, the receiver
assumes that it is encountering a “Jam” condition, reports the last valid position, and
A Phase Measurement Radio Positioning System for Indoor Use Reynolds 38
utput
the
hows
ame
d drop
ticed
ch
fer 40
sec-
S sys-
FSK
ation
ans-
ring
g for
the
M
ut
the “Jam” indicator on the operator display. It also reports an error code in its serial o
stream. This could be the result of interference from enviromental sources, including
close proximity of two BPS systems. If no frames are received at all, or if the RSSI s
too weak an incoming signal, a “No signal” indication is presented to the user. The s
indication is also presented if, for some reason, the processor records an unexpecte
in signal levels during the processing of the acquired signal frame. This will not be no
during the acquire period itself, but is apparent later when the receiver processes ea
received signal frame.
6-4: Frame Data Interval
The 3.9mS data subframes, each containing data sent at 10.25Kbit/sec, trans
bits of information to the receiver per frame. This occurs at a rate of 100 frames per
ond to form a 4.0Kbps data downlink channel which is used to communicate the BP
tem ID and operating health of the four primary channels. It is sent in a narrow-shift
data format in which a logic one is represented by shifting the carrier frequency of St
0 down by 10.0KHz. This modulation is done in the transmitter unit by loading the tr
mitter’s direct digital synthesizer with the appropriate new frequency value and resto
it when needed. This signal is demodulated by the simple expedient of digitizing the
receiver’s RSSI signal exactly as is done to locate the end-of-frame gaps and lookin
the small deviations in RSSI that occur as the received carrier shifts into and out of
6.0KHz passband of the ceramic IF filter. This is a digital version of slope-detected F
and is a crude but effective way to send small amounts of data to the receiver witho
requiring additional hardware.

A Phase Measurement Radio Positioning System for Indoor Use Reynolds 39
f the
f
oup
ing
four
riods.
d on a
en
h are
is lim-
ry.
An essential component of the downlink signal is the surveyed location of the
transmitter group’s origin point. This is sent as an NMEA string by Station 0 as part o
data period. This could be obtained from a long-time-averaged GPS measurement i
desired. All computed position solutions are of course made with reference to the gr
origin point.
6-5: Interframe Signal Processing
The correlation engine is the processor’s main task. It consists of a set of slid
multiply-accumulate operations that seek to achieve maximal correlation among the
transmit periods, and records the offset in samples between each pair of transmit pe
The subsample interpolation used to meet the target position resolution goals is base
simple sine-fitting algorithm that tries to fit a maximal-amplitude sine wave to the giv
point set. For our four transmit periods we can derive six pairs of phase offsets, whic
then used by the position solution task to calculate a position estimate. This process
ited by the bus fetch speed to retrieve the appropriate samples from the main memo
Further discussion appears in Chapter 8 when the receiver unit is discussed.
A Phase Measurement Radio Positioning System for Indoor Use Reynolds 40
riety
he
BPS, is
ature
ed we
lding.
cula-
ns-
ry
g
its Q
esti-
small
Chapter 7: Link Parameter Calculation
7-1: Overview
To determine whether a radio frequency system can be made to work in a va
of environments, the system engineer will generally perform a link budget analysis. T
objective of the link budget analysis is to account for loss, inefficiency, and noise to
ensure an adequate signal to noise ratio at the receiver. This analysis, in the case of
not as straightforward as a typical satellite link budget due to the poorly understood n
of indoor radio propagation. Until the system is built and signal strengths are measur
can only make educated guesses about the attenuation encountered in a typical bui
We allow for a very high link margin to account for all of the inevitably unexpected
sources of signal loss in our system. A good discussion of the use of link budget cal
tions in the context of satellite systems may be found in [Skl88].
7-2: Transmitting Antenna Performance Estimation
A key parameter of the antenna system is the antenna efficiency. Both the tra
mitting and receiving antennas used in this system are loops whose diameter is a ve
small fraction of the wavelength of the transmitted signal. In our case, the transmittin
antenna is a 5-turn loop of 0.5cm diameter copper refrigeration tubing that is wound
around a 0.5m diameter plastic form. Its measured inductance is about 100uH, and
factor is about 150. With these parameters we have enough information to make an
mate of the antenna’s efficiency. This section follows the standard procedure for the
loop approximation found in [Bal96].

A Phase Measurement Radio Positioning System for Indoor Use Reynolds 41
ed sig-
, the
l
alcu-
son
fective
f the
di-
um
We will first calculate the antenna’s radiation resistance as follows, where Rs is the
antenna’s radiation resistance, A is its area, and is the wavelength of the transmitt
nal:
Eq. 7-1: Radiation Resistance
In our case, given the transmitting antenna’s parameters as described above
radiation resistance Rs is 1.92x10⁻⁶ Ohms. This is a small number but is typical of smal
transmitting loops used at these frequencies. We now have enough information to c
late the antenna’s efficiency. In this expression, Q is the antenna quality factor, Rs is its
radiation resistance, fo is the operating frequency, and Lloop is the loop’s inductance.
Eq. 7-2: Antenna Efficiency
This yields an efficiency of 2.4x10⁻⁷. This is also typical of such a small loop at
these frequencies. This efficiency may be written as a loss of 66.1dB. This is the rea
why we must have such a high transmitted power to cover such a small area. The ef
radiated power of our +43dBm transmitter is therefore 43dBm-66.1dB=-23.1dBm.
7-3: Receiving Antenna Performance Estimation
Performing a similar analysis at the receiving antenna is difficult because the
receiving antenna is a very small ferrite core inductor. In this case, the inductance o
loop is increased dramatically by the very high permeability of the ferrite material. Ad
tionally, the effective loop area also increases because of the more permeable medi
λ
Rs 31kΩ A
λ2-----
2=
ηQ Rs⋅
2π fo Lloop⋅ ⋅--------------------------------=

A Phase Measurement Radio Positioning System for Indoor Use Reynolds 42
eceiv-
e will
rmer.
od-
e a
itter
ing is
posite
rived
and
e-
inside the loop. Because the transmitting loop is less than one wavelength from the r
ing loop, and the receiver is therefore in the near field of the transmitting antenna, w
assume that the two loops act more like two inductors loosely coupled like a transfo
It is therefore very difficult to predict this efficiency without very detailed near field m
elling of the B-fields surrounding the transmitting antennas. We will therefore assum
loss of 40dB as is typical of small ferrite rod antennas for AM radio use.
7-4: Freespace Path Loss Calculation
Next, we will calculate the path loss of the freespace path between the transm
and the receiver. The worst case path in the Media Lab’s cube-shaped Weisner Build
approximately 50m, measured from the bottom corner of the basement to the top op
corner of the fourth floor. The Friis free-space path loss equation is used, which is de
from an assumption of spherical spreading of the wave front at both the transmitter
receiver antennas. Here, d is the transmitter-receiver separation in km and f is the fr
quency in MHz.
Eq. 7-3: Path Loss
In our system, we note that with d=0.05km and f=1.9MHz, path loss Lo=12.05dB.
Table 7-1: Link Budget Calculation
Origin Parameter Value
[Measured] Transmitted Frequency 1.9MHz
[Measured] Transmitter Power Output +43dBm (20W)
[Estimated] Transmitter Antenna Pat-tern Gain
+1.7dB (Near-dipole)
Lo 32.5dB 20 dlog 20 flog+ +=

A Phase Measurement Radio Positioning System for Indoor Use Reynolds 43
tative
rative
easy to
signal
f an
pres-
7-5: Link Margin and Related Factors
These numbers are hypothetical, but the author believes them to be represen
of the actual link parameters of a finished system. The process, in any case, is illust
of the design process. The design engineer chooses values for variables which are
set, such as transmitter power or operating frequency, in order to provide adequate
to noise ratio at the receiver given his worst-case assumptions about the behavior o
unknown signal propagation path. In our case, the allowable attenuation due to the
ence of building materials in the signal path is at most about 28.4dB.
[Calculated] Transmitter Antenna Radi-ation Gain (loss)
-66dB
[Calculated] Freespace Path Gain (loss) 50m path
-12dB
[Estimated] Receiver Antenna Pattern Gain
+1.7dB (Near-dipole)
[Calculated] Receiver Antenna Radia-tion Gain (loss)
-40dB
[Calculated] Power at Antenna Port -71dBm
[Measured] Receiver Sensitivity -100dBm for 10dB SNR
[Calculated] System Link Margin +28.4dB
Table 7-1: Link Budget Calculation
Origin Parameter Value

A Phase Measurement Radio Positioning System for Indoor Use Reynolds 44
As
d to
his
cess
ame.
of a
plex-
r
erat-
Chapter 8: The BPS DSP-based Receiver Unit
8-1: Overview
The BPS Receiver Unit is based on a digitized IF software radio architecture.
shown in Figure 8-1 below, the signal from the antenna is filtered, preamplified, mixe
a 455KHz intermediate frequency (IF), and is then amplified by a limiting amplifier. T
signal is then passed to a high speed ADC which feeds the CPU’s direct memory ac
(DMA) unit with a high speed streaming digitization of the incoming signal. The CPU
acquires these signals in real time but processes them at leisure after each signal fr
This arrangement allows the use of a standard Hitachi SH-1 microcontroller instead
dedicated DSP unit. Of course, this results in a considerable savings in cost and com
ity. Another feature of this receiver is its direct digital synthesis (DDS) local oscillato
unit, based on an Analog Devices DDS IC. This IC greatly simplifies the task of gen
ing a clean local oscillator signal for the downconversion process.

A Phase Measurement Radio Positioning System for Indoor Use Reynolds 45
s of
tput
; it is
rt-
his
the
or
ional
Figure 8-1: BPS Receiver Block Diagram
8-2: Receiver Front End
The receiver front end consists of a low-noise FET RF preamplifier with 5 pole
associated LC coupled-resonator filtering. Input impedance is 50 ohms, while the ou
of the preamp is matched to the 100 ohm impedance of the subsequent mixer stage
transformer coupled to an Analog Devices AD608 mixer-IF IC which provies a Gilbe
cell mixer as well as a limiting amplifier and extremely accurate log-RSSI circuitry. T
receiver uses a single conversion design with a 455KHz IF, which is possible due to
relatively high Q input matching and filtering circuits. Signals that are 455KHz above
below the desired signal frequency are attenuated by more than 40dB, with an addit
20dB of selectivity due to the high Q loop antenna.

A Phase Measurement Radio Positioning System for Indoor Use Reynolds 46
d end
ived
is
pass
im-
r
tion
e BPS
An
t pur-
ncy is
l.
dB
al by
li-
re
8-3: Logarithmic Detection and RSSI A/D Conversion
In order to detect the gaps in the transmitted signal which indicate the start an
of each transmitted frame, the CPU’s internal 12-bit ADC is used to capture the rece
signal strength indicator (RSSI) voltage from the AD608 IF device. The RSSI output
logarithmic with respect with to the incoming signal over a range of 60dB and is low
filtered with a one-pole RC lowpass filter which has a cutoff frequency of 10KHz. A s
ple filter method is sufficient to remove high-frequency noise due to the much highe
455KHz IF signal which is the unwanted byproduct of the RSSI’s logarithmic genera
process. This signal is then buffered by a high-speed opamp and is connected to th
CPU’s internal 12-bit low speed A/D converter for the digital measurement of RSSI.
appropriate compensation function is used to report actual RSSI in dBm units for tes
poses. As the RSSI is used as a source of framing information the high cutoff freque
important to allow the signal acquisition to occur within the 100uS inter-frame interva
8-4: IF Stages and Filtering
The receiver’s 455KHz IF is then filtered by a four-pole ceramic filter with a 3
bandwidth of 6KHz, and is subsequently limited to a 200mV pk/pk square wave sign
the AD608’s internal limiter stage. The limiter stage is of great help in removing amp
tude noise contributed by AWGN sources. Shown below is a typical noisy IF signal
before, during, and after the limiting process. The sine wave is first limited to a squa
wave, and then undergoes a sine wave restoration in a subsequent filter.

A Phase Measurement Radio Positioning System for Indoor Use Reynolds 47
ich
ch then
his has
able
teed to
re irrel-
ceiver
to
e
noise
rob-
Figure 8-2: Signal with AWGN During Processing
That square wave signal is then applied to a bipolar tuned amplifier stage wh
operates in a Class C mode. This Class C output stage has a high-Q output tank whi
regenerates a sine wave at the same frequency as the IF signal as shown above. T
the advantage of providing a very selective filtering effect without introducing appreci
phase distortion to the differential measurements; as all four transmitters are guaran
be transmitting at the exact same frequency, the phase errors through the IF stage a
evant. This is one great advantage of a DSP-based receiver system. If an analog re
were designed, the four individual receiver chains would have to be carefully aligned
preserve phase from signal to signal. Even though the initial receiver stages could b
reused for all four receiver chains, the switching process would cause an inevitable
output which would then have to be filtered later, causing possible phase accuracy p
lems.
−1
−0.5
0
0.5
1
Signal With Amplitude Noise
0
0.5
1
Signal After Limiting
0
0.5
1
Signal After Limiting and Filtering

A Phase Measurement Radio Positioning System for Indoor Use Reynolds 48
d,
xim
o a
an
er-
9220
lling
re
sor
he-
utput
uning
ntrol
-
spu-
ncy.
y
8-5: Signal Conditioning for A/D Conversion
The sine wave RF from the Class-C stage’s tank is inherently amplitude limite
and a simple potentiometer adjusts this signal to the proper level for digitization. A Ma
MAX474 high-speed rail-to-rail opamp buffers this signal, and provides a level shift t
2.048V biased centerline. The resulting signal is digitized at 10Msamples/second by
Analog Devices AD9220 CMOS 12-bit ADC with internal 4.096 bandgap voltage ref
ence; this bandgap reference is also used to generate the 2.048V reference. The AD
ADC is a pipelined converter which is always running; the output word changes on fa
clock edges but is valid within about 70nS of the rising clock edges. This is fortunate
because it makes processor interfacing extremely straightforward. The output bits a
buffered by 74VHC logic bus drivers which latch the ADC bits on to the main proces
bus during periods of DMA transfer.
8-6: Receiver Local Oscillator
The receiver local oscillator is an Analog Devices AD9850 Direct Digital Synt
sizer. This device takes as its reference a 40MHz TCXO module and produces an o
signal whose frequency and phase may be specified by a 40-bit control word. This t
word consists of 32 bits of frequency control information as well as 5 bits of phase co
information, which are not used in this design. This 32 bit frequency resolution corre
sponds to a frequency variation of 0.093Hz (40MHz/232) at the least significant bit. Its
output is filtered by an 3-pole antialiasing LPF and has very good spectral purity (all
rious outputs more than 70dB below the carrier) at the desired 1.445MHz LO freque
The tuning word is supplied in a serial fashion by the main processor. As a frequenc

A Phase Measurement Radio Positioning System for Indoor Use Reynolds 49
quite
ossi-
ycle
rvice
differ-
ovide
Hita-
t is a
ing
update requires about 10uS, future experimentation with multifrequency operation is
possible if the input filtering circuitry can successfully be readjusted to cover other p
ble carrier frequencies.
8-7: Receiver CPU and Interface
The main receiver CPU provides three services. One is a time critical single c
latency DMA burst transfer of the digitized IF signal to main memory. The second se
is the non-real-time analysis of the received signals to decide on the pairwise phase
ences and to compute a position solution at a 100Hz rate. The third function is to pr
user interface I/O to a small keypad, to a serial port, and to a VFD display unit. The
chi SH7034 SH-1 RISC microcontroller is capable of providing all of these services. I
32-bit RISC microcontroller clocked at 20MHz; it operates in single cycle mode yield
20MIPS.
Figure 8-3: The BPS CPU Module

A Phase Measurement Radio Positioning System for Indoor Use Reynolds 50
ge;
d for
n AMD
ll as
write
ve the
sult-
emory
ith
y the
oni-
e
imes
,
MA
ne
The Hitachi SH7034 is capable of directly addressing over 32Mbytes of stora
the high order address bits are broken out to chip select signals to minimize the nee
external glue logic. In our case, as seen above, the system architecture consists of a
1M-bit FLASH ROM from which program code and lookup tables are retrieved, as we
1Mbyte of 70nS Toshiba static RAM. The static RAM is accessed on a single-cycle
mode so that the processor’s DMA controller can provide address sequencing to dri
A/D converter results directly into a specified 64K-word memory block. The 12-bit re
ants from the A/D converter subsystem are padded with zeros and stored in 16-bit m
words. From there the required compuations can be done while being interleaved w
bursts of transmitted position information from the master clock unit.
8-8: Receiver Real-Time Software
The main processor runs a simple cooperative multitasking OS constructed b
author to run in synchrony with the received frames. This OS is derived from SH-1 m
tor code originally written by my colleague Rehmi Post, also of MIT. This cooperativ
multitasking system is somewhat unique as it results in nondeterministic execution t
for user interface (UI) code but extremely precise control of signal acquisition timing
which is necessary for the proper operation of the position computation cycle. The
SH7034’s internal timer unit is used to set periodic interrupts which then cause the D
transfer of received signals at the appropriate times. There is a single low level routi
which apportions CPU time between signal processing and UI tasks.

A Phase Measurement Radio Positioning System for Indoor Use Reynolds 51
word
er
. The
gle
er.
s tim-
k
er.
solu-
the
o bus-
ther-
d
is a
gle,
d
8-9: DMA Transfer of Signal Samples
The 60K-word DMA transfers of incoming signal streams consume the CPU’s
entire bus bandwidth for 6.0mS time slices. The SH7034’s DMA controller limits the
maximum frame time of our signals because of its 65536-sample maximum transfer
limit. We want all four transmitted signals to fit within a single sampling interval in ord
to prevent phase jitter differences from detracting from the system’s phase accuracy
A/D conversion clock is derived directly from a divider chain on the receiver unit’s sin
40MHz clock, thus eliminating CPU or DMA trigger time induced sampling phase jitt
Of course this mandates the use of a single global clock to ensure that the CPU’s bu
ing expectations are always met; if more than one oscillator were used the A/D cloc
would slowly slide in phase relative to the CPU clock and thus bus timing would suff
During the DMA intervals, the processor can continue to operate against data
stored in its onboard static RAM area. This RAM area is used to perform the position
tion algorithm. The processor’s internal 32-bit data bus is logically disconnected from
external 16-bit bus during DMA periods, so separate operations may occur on the tw
ses. This makes possible the interleaving of position solution calculations and the ga
ing of another data set from the A/D converter system.
8-10: Receiver User Interface
The receiver’s UI consists of two display options, a small numeric keypad, an
two high speed serial ports for connection to an external PC. The first display option
4-line 40 character vacuum fluorescent display (VFD) which is readable from any an
but which can only display symbols from its internal ASCII character set. The secon

A Phase Measurement Radio Positioning System for Indoor Use Reynolds 52
ix
a-
om-
the
r inital
rts
ost-PC
osi-
mand-
ndary
ition
S
o
option, which is not yet fully implemented, is a 256x128 full dot matrix monochrome
LCD module with a CCFL backlight. Given sufficient development time, the dot matr
display may prove useful for a variety of geographic information service (GIS) applic
tions, such as the display of maps or associated information which is keyed to the c
puted position solutions. The numeric keypad is used for basic system control when
BPS receiver is used in its standalone mode of operation, and is especially useful fo
test and measurement operations.
The primary BPS receiver I/O is performed through two serial ports. These po
are capable of being operated at speeds of up to 115Kbit/sec. One is allocated to a h
connection for the transfer of raw data during testing, and the output of NMEA-like p
tion strings once the initial testing has been completed. The BPS unit presents a com
line interface through a system monitor application based on code initially written by
Rehmi Post. The second serial port is intended for use as an interconnect to a seco
peripheral device, such as a conventional GPS receiver, which can provide less pos
solutions when the handheld unit is outside in view of the GPS constellation. The BP
unit’s NMEA-like string will provide a quality of service metric which can be parsed t
determine the source and estimated precision of its position solutions.

A Phase Measurement Radio Positioning System for Indoor Use Reynolds 53
for
ta
of
mitter
ply rip-
grate
Chapter 9: BPS Transmitter Design
9-1: Overview
The BPS Transmitter is a key part of the system as a whole. It is responsible
generating a stable carrier signal, maintaining modulation timing, and transferring da
packets to the receiver. It must generate power levels as high as +43dBm. A mixture
very delicate low level signal processing, as well as RF power electronics, the trans
has been an interesting source of design challenges ranging from curing power sup
ple to watching one overstressed ferrite broadband transformer explode and disinte
into many small pieces due to excessive circulating RF currents.
Figure 9-1: BPS Transmitter Block Diagram

A Phase Measurement Radio Positioning System for Indoor Use Reynolds 54
wo
tem.
ture
ock
ls
’s
rol
e
s as
of
two
od-
ncy,
nals
ster
ited
quite
negli-
9-2: Transmitter Master Clock and Power Amplifier Modules
The BPS Transmitter Unit, whose block diagram appears above, consists of t
modules. One, the Master Clock module, is the source of all timing signals in the sys
Every clock signal needed for BPS is ultimately derived from a single 40MHz tempera
compensated crystal oscillator (TCXO) that is the heart of the Clock module. The Cl
accepts serial I/O from a controlling computer and produces four low-level RF signa
(+10dBm) which are available at rear-panel-mounted BNC jacks. The Clock module
rear panel also carries an 8-pin Amplifier Control jack which allows for dynamic cont
of the power amplifier unit, primarily for bias scheduling of the Class A portions of th
amplifier unit.
The other transmitter module is the Power Amplifier module. This module take
its input the low-level RF signals as well as the Amplifier Control signals. It consists
four submodules, each of which is a complete broadband amplifier module based on
Motorola MRF455 bipolar RF power transistors in a balanced configuration. These m
ules operate in a Class AB linear mode and deliver a gain of 30dB at 1.9MHz. Efficie
including bias currents, is about 45% which is roughly typical for such an amplifier.
9-3: Generation of Stable Signals
The BPS Master Clock unit consists of a four-output source of BPS timing sig
whose frequency and power output are under microprocessor control. The unit’s ma
oscillator is a quartz crystal based 40MHz TCXO with a stated short term stability lim
by the oscillator’s phase noise. A typical phase noise of -140dBc at 10KHz offset is
sufficient for our application; this corresponds to a short term phase variation that is
A Phase Measurement Radio Positioning System for Indoor Use Reynolds 55
y sta-
irect
e long
XO
m
erter
ut and
of
this
. A
by a
smit
n
GaAs
nsla-
rly
ing
ignal
gible compared to propagation based phase distortion. The unit’s long term frequenc
bility is less than 10ppm per day at room temperature range. This, coupled with the D
Digital Synthesizer (DDS) used to synthesize the BPS carrier frequency, ensures th
term stability of the BPS system. It is possible to update calibration values for the TC
calibration input based on an external GPS reference signal at 10MHz, as the syste
includes a phase-synchronous 10MHz output that is ordinarily used as the A/D conv
clock in a BPS receive unit. The system operator has access to this calibration outp
can easily compare it to a high-accuracy external standard. Alternatively, if a source
extremely stable 40MHz TTL level clock signals is available, it is very easy to inject
external reference and dispense with the onboard TCXO altogether.
9-4: Transmitter Station Switching
The multiport switching system must have extremely high port-to-port isolation
typical requirement is -70dB from the nominal carrier output. This is readily achieved
combination of the software programmable gain circuit, which is used to reduce tran
power before the switching operation takes place to minimize switch bleedthrough o
transitions, as well as the use of the MA/COM SW-114 GaAs multiport switch. This
switch consists of a hybrid module of two dies on a ceramic substrate. One die is the
FET switch element. The other die is a silicon ASIC which is responsible for level tra
tion and break-before-make sequencing. The stated 60dB isolation increases to nea
70dB at low frequencies where capacitive coupling dominates. The use of matched
microstrip technology is necessary to maximize isolation, even at such a low operat
frequency, due to the high isolations needed; the GaAs ASIC is rather intolerant of s
mismatches, so good design practices are mandatory.

A Phase Measurement Radio Positioning System for Indoor Use Reynolds 56
able
antly
e
put
idth
dth
ogy as
atch-
up-
er
to
han
re
s con-
e use
of
able
9-5: Power Amplifier Design
The BPS power amplifier system consists of four identical modules, each cap
of supplying up to 100W to a 50 ohm load. They are in practice operated at a signific
lower power output of 40W. As the phase stability requirements for the fixed-station
transmitters is rather severe, these amplifier modules are operated in Class AB mod
which unfortunately limits efficiency to at most 55%. An efficiency of 41% at 30W out
power was measured at 1.9MHz. Phase error over the amplifier’s 0.5-10MHz bandw
must be less than 2 degrees, with the phase error within an arbitrary 10KHz bandwi
less than 0.01 degree. This is achievable with standard broadband amplifier technol
long as the use of high-Q tuned circuits is minimized. The use of ferrite broadband m
ing transformers is permissible if Q-swamping resistors and balancing capacitors are
employed.
Each amplifier consists of a discrete-transistor preamplifier and driver which s
plies roughly 15dB of gain. Thus the +10dBm signal from the synthesizer and switch
board is amplified to +25dBm which is sufficient to drive the class-AB balanced pow
amplifier stage (using 2 Motorola MRF455 bipolar RF power transistors) to +45dBm
+50dBm on signal peaks. As duty cycle expected of any individual amplifier is less t
25%, heatsink design may be slightly easier than if a single high power amplifier we
switched among many antenna ports. Fortunately the Clock unit supplies a set of bia
trol signals, which are used to gate the biases of the individual amplifier modules. Th
of a power-FET based amplifier was considered but was not practical given the lack
available low-Vdss RF power MOSFETS. Standard power MOSFETs might be applic
if a driver stage capable of driving highly capacitive loads is available.

A Phase Measurement Radio Positioning System for Indoor Use Reynolds 57
ith
nfig-
erance
nas
e sys-
k cur-
nt
y
The
with a
be
it sig-
sult in
ly
oys, as
an
single
m to
Output filtering is performed by a set of matched L/C low pass filter elements w
resistor-swamped Q minimization, which are designed in the Butterworth lowpass co
uration to minimize phase errors in their passbands. As the specified phase error tol
would be difficult to meet given varying antenna loads, it is imperative that the anten
be carefully matched to the filter’s 50-ohm impedance. They must be readjusted if th
tem operating frequency is changed for some reason.
9-6: Power Supply Issues
The amplifier system requires a clean source of +13.8V at 7A average. A pea
rent of 15A must be supplied, as the bias circuitry may produce very short high curre
transients. As the RF output is cycled at a 100Hz rate, it is necessary to eliminate an
amplitude ripple which may result in a low frequency whine on the transmitted signal.
use of a large computer-grade electrolytic bypass capacitor may be necessary even
high frequency switching power supply. It is worthwhile to note that this supply must
free of switching harmonics at 455KHz (the receiver 1st IF) and 1.9MHz (the transm
nal frequency) as the presence of these components even at very low levels may re
the transmission of very slightly amplitude modulated carrier signals. This is extreme
undesirable in the high-precision mode of signal phase measurement that BPS empl
any amplitude modulation that makes it through the limiting amplifier stage results in
apparent phase change at the receiver’s A/D converter stage.
9-7: Transmitting Antenna Design
Frequency and environment based mismatching of the antenna system is the
largest cause of fixed phase offset errors. It is important to design the antenna syste

A Phase Measurement Radio Positioning System for Indoor Use Reynolds 58
the
hief
ting
at will
s were
d in a
ically
unda-
to
g
a rela-
losses
the
will
r fab-
sults
ble
minimize phase errors of environmental origin. As the antennas will be operating in
small loop limit, it will not be the movement of effective phase center that will be the c
problem, but rather the matching that will vary depending on the proximity of conduc
objects. An antenna housing has been designed in the fashion of a small radome th
serve to keep people and objects from obstructing the antenna system. The radome
once small, round office waste bins.
We have considered many possible antenna topologies that may be employe
working BPS system. As transmitted signal wavelengths of 157M are used, it is bas
impossible to design a small but efficient antenna. The engineer is then left with the f
mental choice of maximizing system Q to minimize radiation resistance (and thus try
minimize power coupling losses), or minimizing Q to faciliate phase matching amon
many antennas. We have chosen a compromise antenna Q of 150 which represents
tively lossy antenna at these frequencies in the belief that we may make up for these
with a peak amplifier power 10dB larger than would otherwise be necessary. Given
calculated link loss budget of 118dB and our +43dBm power output, receiver signals
be about -70dBm at the antenna which allows a link margin of about 28dB with our
receiver’s designed MDS of -100dBm. The relatively small noise power at the small
receiving antennas employed works greatly in our favor in this case.
9-8: Antenna Mechanical Assembly
The transmitting antenna that is employed is a loop antenna of 50cm diamete
ricated from 0.5cm diameter copper refrigeration tubing. Five turns are used, which re
in an inductance of about 100uH. This is made resonant with a 200pF vacuum varia

A Phase Measurement Radio Positioning System for Indoor Use Reynolds 59
ges
f
nted
feed-
te
test
long
a-
until
capacitor with a voltage rating of 10kV. Caution must be exercised as peak RF volta
can easily reach over 5kV in normal operation. Voltages may be higher in the case o
intentional or deliberate system mismatch. Any bystanders must of course be preve
from approaching closer than 1m to the antenna unit. The 50-ohm impedance of the
line is matched by a sliding tap arrangement which can be adjusted to provide a low
VSWR to the transmitter.
9-9: Antenna Tuning Methods
The antenna is tuned with a network analyzer to be resonant at the appropria
operating frequency, and the transmitter’s digital power control is set to provide a 5W
signal to aid in the final matching and tuning steps. The sliding tap is then adjusted a
with the vacuum variable capacitor (these adjustments will interact) to maximize me
sured RSSI at a strategically placed test location. Amplifier power is then increased
the required RSSI is achieved at all service points.

A Phase Measurement Radio Positioning System for Indoor Use Reynolds 60
Chapter 10: Concluding Thoughts
This system is not yet complete. Over the past several months, I have learned a lot
about the design and implementation of radio navigation devices. I’ve also gained a lot of
experience with complex hardware and software systems. This is the first project I have
worked on that is simply too complicated to design and build without constantly docu-
menting every hardware and software design and fabrication choice as it is made. I’ve
often run into what seems to be an arbitrary decision I made a few weeks before, only to
find that decision to be the source of an error costing days of debugging time. In the pro-
cess, I have found problems ranging from badly documented integrated circuits, to a bug
or two in the silicon of the SH-1 microcontroller, to one particularly insidious microscopic
solder bridge that was located beneath a 100-pin surface mount package.
On the other hand, even the most painful experience has been valuable in its own
way. The writing of this document was no exception, as I have struggled to find a style
and format that renders a complicated system understandable to those who have not
worked on it nearly constantly for months at a time. I hope that the reader can use my writ-
ten description to find design errors that I have not yet found; if not, he or she may simply
find the way to spell some word that eludes my weary fingers.
I must again thank the many people who have helped me as I have grown from a
10-year-old kid building radios in my basement to an MIT alumnus who wishes he had
more time to spend building radios in his basement.
Happily, this is the very last sentence of my thesis.

A Phase Measurement Radio Positioning System for Indoor Use Reynolds 61
ien-
-
s”.
List of References
[Ana98] “AD9221/9223/9220”. Data Sheet Revision A. Analog Devices, Inc.,1998.
[Ana99] “AD9850”. Data Sheet Revision C. Analog Devices, Inc., 1999.
[Bal96] Balanis, Constantine I. Antenna Theory: Analysis and Design. John Wiley and
Sons, 1996.
[Bud97] Buderi, Robert. The Invention that Changed the World. Simon and Schuster,
1997.
[Dix94] Dixon, Robert. Spread Spectrum Systems With Commercial Applications. John
Wiley and Sons, 1994.
[Fcc86] “FCC methods of measurements of radio noise emissions from industrial, sc
tific, and medical equipment”. FCC/OST MP-5. Federal Communications Com
mission Office of Science and Technology. 1986.
[Fcc96] “Understanding the FCC regulations for low power, non licensed transmitter
OET Bulletin 63. Federal Communications Commission Office of Engineering
and Technology. 1996.
[Ger98] Gershenfeld, Neil. The Nature of Mathematical Modelling. Cambridge University
Press, 1998.

A Phase Measurement Radio Positioning System for Indoor Use Reynolds 62
ion”.
chi
[GPS95] “Global Positioning System Standard Positioning Service Signal Specificat
2nd Ed. Air Force Space Command, 1995.
[Hal47] Hall, John Scoville. Radar aids to navigation. Mc Graw Hill Book Co., 1947.
[Hit96] “SuperH RISC Engine SH7032 and SH7034 Hardware Manual”. 2nd Ed. Hita
Micro Systems, Inc., 1996.
[LOR95] “LORAN-C User Handbook”. US Coast Guard Navigation Center, 1995.
[Opp89] Oppenheim, Alan V. and Ronald Schafer. Discrete Time Signal Processing.
Prentice Hall, 1989.
[Rad48] Pierce, John Alvin. LORAN, long range navigation. Mc Graw Hill Book Co.,
1948.
[Skl88] Sklar, Bernard. Digital Communications: Fundamentals and Applications. PTR
Prentice Hall, 1988.

A Phase Measurement Radio Positioning System for Indoor Use Reynolds 63
Appendix A: System Schematics
A-1: BPS Receiver Front End
12
34
56
ABCD
65
43
21
D C B A
Title
Num
ber
Rev
isio
nSi
ze B Dat
e:28
-Jan
-199
9Sh
eet
of
File
:C
:\My
Doc
umen
ts\b
ps\b
psfro
nten
d.sc
hDra
wn
By:
J1 Inpu
t
C1
680p
F
C2
180p
FL1 47
uHL2 47
uH
C5
330p
F
C4
270p
F
C3
10pF
R1
10K
Q1
MPF
102
R2
1KC
647
0pF
C7
100n
F
C8
100n
FR
35.
6K
C9
150p
FL3 47
uH
C12
47pF
VPS1
1
CO
M1
2
LOH
I3
CO
M2
4
RFH
I5
RFL
O6
MXO
P7
VMID
8IF
HI
9
IFLO
10
RS
SI
11
CO
M3
12
FDBK
13
VPS2
14
LMO
P15
PR
UP
16
U1
AD60
8
C14
1nF
R5
47K
C11
100n
FC
1010
uF
R7
330
R6
1.1K
R8
1.5K
in1
out
3
gnd 2
H(s
)
FL1
TOKO
HC
FM2-
455B
C15
100n
F
C16
100n
F
R10
1K
R9
1K
C17
100n
F
C13
1nF
Loca
l Osc
R4
51
VCC
C23
100n
F
R17
10K
R16
15K
C24
100p
F
C22
CAP
C19
100n
F
C18
100n
F
R12
9.1K
R11
24KR15
1K
R13
470
Q2
2N39
04
C20
150p
F
C21
33pF
L4 47uH
M. R
eyno
lds
BPS
2 R
ecei
ve A
nalo
g
RSS
I Sig
nal
Lim
iter O
utpu
t
VCC
C22
100n
FR
144.
7K
U2
MAX
474

A Phase Measurement Radio Positioning System for Indoor Use Reynolds 64
A-2: BPS Receiver LO and ADC
12
34
56
ABCD
65
43
21
D C B A
Title
Num
ber
Rev
isio
nS
ize
B Dat
e:28
-Jan
-199
9S
heet
o
f Fi
le:
C:\M
y D
ocum
ents
\bps
\bps
back
end.
schD
raw
n B
y:
1 2 3 4 5 6 7 8 9 10 11 12 13 14 15 16 17 18 19 20 21 22 23 24 25 26 27 28 29 30 31 32 33 34 35 36 37 38 39 40
J1 PR
OC
BU
S
D3
1
D2
2
D1
3
LSB
/D0
4
DG
ND
5
DV
DD
6
WC
LK7
FQU
D8
CLK
IN9
AG
ND
10
AV
DD
11
RS
ET
12
QO
UT
13
QO
UT
B14
D4
28
D5
27
D6
26
MS
B/D
7/S
L25
DG
ND
24
DV
DD
23
RS
T22
IOU
T21
IOU
TB20
AG
ND
19
AV
DD
18
NC
17
VIN
P16
VIN
N15
U7
AD
9850
CLK
1
LSB
/B12
2
B11
3
B10
4
B9
5
B8
6
B7
7
B6
8
B5
9
B4
10
B3
11
B2
12
MS
B/B
113
OT
R14
DV
DD
28
DV
SS
27
AV
DD
26
AV
SS
25
VIN
B24
VIN
A23
CM
L22
CA
PT
21
CA
PB
20
RC
OM
19
VR
EF
18
SE
NS
E17
AV
SS
16
AV
DD
15
U6
AD
9220
VCC8
GND4
OU
T5U1
40M
Hz
PR
E4
CLK
3
D2
CLR
1
Q5
Q6
U2A
74V
HC
74
PR
E10
CLK
11
D12
CLR
13
Q9
Q8
U2B
74V
HC
74V
CC
VC
C
VC
C
C5
100n
FC
610
0nF
C7
100n
FC
810
0nF
C9
47uF
VC
C
1 23
U3A
74V
HC
00
9 108
U3C
74V
HC
00
4 56
U3B
74V
HC
00
40M
HZ
CLO
CK
10M
HZ
CLO
CK
D0/
LSB
D1
D2
D3
D4
D5
D6
D7
D8
D9
D10
D11
OC
1
C11
1D2
1Q19
2D3
2Q18
3D4
3Q17
4D5
4Q16
5D6
5Q15
6D7
6Q14
7D8
7Q13
8D9
8Q12
U4
74V
HC
573
D0/
LSB
D1
D2
D3
D4
D5
D6
D7
OC
1
C11
1D2
1Q19
2D3
2Q18
3D4
3Q17
4D5
4Q16
5D6
5Q15
6D7
6Q14
7D8
7Q13
8D9
8Q12
U5
74V
HC
573
D8
D9
D10
D11
D0/
LSB
D1
D2
D3
D4
D5
D6
D7
D8
D9
D10
D11
D0/
LSB
D1
D2
D3
D4
D5
D6
D7
D8
D9
D10
D11
VC
C
10M
HZ
CLO
CK
VC
C
/CS
3
/CS
3
C10
100n
F
C16
100n
F
VC
C
VC
C
VC
C
PB
0/LS
B
PB
1
PB
2
PB
3
PB
4
PB
0/LS
B
PB
1
PB
2
PB
3
40M
HZ
CLO
CK
R1
3.9K
R2
10K
R3
10K
R6
25R
750
L1 1.2u
H
L2 1.2u
H
C22
180p
FC
2368
0pF
C24
180p
F
LO O
UT
PU
T
C13
100n
F
C14
100n
F
C11
100n
FC
1210
uF
C17
100n
FC
1810
uF
R4
47
R5
47
3 26
1
5
7 4
U8
AD
817
C15
100n
F
VC
C
C19
100n
F
C21
100n
F
R8
10K
R9
10K
R10
10K
C20
100n
F
Lim
iter O
utpu
t
PB
5
PB
5
1 2
J2 Pow
er
R11
RE
S1
R12
RE
S1
R13
RE
S1
BP
S L
O S
ynth
esiz
er
M. R
eyno
lds

A Phase Measurement Radio Positioning System for Indoor Use Reynolds 65
A-3: BPS Transmitter Clock Unit
12
34
56
ABCD
65
43
21
D C B A
Title
Num
ber
Rev
isio
nS
ize
B Dat
e:28
-Jan
-199
9S
heet
o
f Fi
le:
C:\M
y D
ocum
ents
\bps
\bps
xmit\
bpsx
mit.
sch
Dra
wn
By:
D3
1
D2
2
D1
3
LSB
/D0
4
DG
ND
5
DV
DD
6
WC
LK7
FQ
UD
8
CLK
IN9
AG
ND
10
AV
DD
11
RS
ET
12
QO
UT
13
QO
UT
B14
D4
28
D5
27
D6
26
MS
B/D
7/S
L25
DG
ND
24
DV
DD
23
RS
T22
IOU
T21
IOU
TB
20
AG
ND
19
AV
DD
18
NC
17
VIN
P16
VIN
N15
U1
AD
9850
VCC8
GND4
OU
T5
Y1
CLK
OS
C
GP
OS
1
GN
EG
2
VIN
P3
CO
MM
4
VP
OS
8
VO
UT
7
VN
EG
6
FDB
K5
U2
AD
603
RFC 1
GND 2
GND3
RF1 4
GND5
GND 6
RF2 7
GND8
VEE 9
VCC10
C1 11
C212
GND24
GND23
GND22
RF421
GND20
GND19
RF318
GND17
GND16
GND15
C414
C313
U3
MA
CO
MS
W-3
14
VC
C
VC
C
R1
10K
R2
10K
R3
10K
R4
25R
550
R6
100R7
100
R8
100
C1
100n
F
C2
180p
FC
368
0pF
C4
180p
F
L1 1.2u
H
L2 1.2u
H
1 23
U9A
74V
HC
00
4 56
U9B
74V
HC
00
9 108
U9C
74V
HC
00
PR
E4
CLK
3
D2
CLR
1
Q5
Q6
U10
A74
VH
C74
PR
E10
CLK
11
D12
CLR
13
Q9
Q8
U10
B74
VH
C74
VC
CV
CC
VC
C
20M
HZ
CLO
CK
40M
HZ
CLO
CK
10M
HZ
CLO
CK
C5
100n
F
R10
9.1K
R9
1KC
710
uFC
610
0nF
VC
C
-5
VC
C
C8
100n
F
R15
47
VC
C-5
R11
10K
R12
10K
R13
10K
R14
10K
J1 AN
T1
J2 AN
T2
J4 AN
T4J3 A
NT3
C11
100n
FC
1210
0nF
C9
100n
FC
1010
0nF
BP
S M
aste
r Clo
ck M. R
eyno
lds
40M
Hz
CLO
CK
OC
1
CLK
11
1D2
1Q19
2D3
2Q18
3D4
3Q17
4D5
4Q16
5D6
5Q15
6D7
6Q14
7D8
7Q13
8D9
8Q12
U6
DM
74LS
574
D0
D1
D2
D3
D4
D5
D6
D7
-CS
1
VO
UT
1
NC
2
NC
3
GN
D4
VIN
8
NC
7
NC
6
NC
5
U5
MA
X61
20
DIN
1
SC
LK2
-CS
3
DO
UT
4
VD
D8
VO
UT
7
RE
FIN
6
AG
ND
5
U4
MA
X53
8/9
VC
CV
CC
C13
100n
F
OC
1
C11
1D2
1Q19
2D3
2Q18
3D4
3Q17
4D5
4Q16
5D6
5Q15
6D7
6Q14
7D8
7Q13
8D9
8Q12
U7
DM
74LS
573
1 2 3 4 5 6 7 8 9 10 11 12 13 14 15 16 17 18 19 20 21 22 23 24 25 26 27 28 29 30 31 32 33 34 35 36 37 38 39 40
J5 AN
ALO
GB
US
D7
D6
D5
D4
D3
D2
D1
D0
-CS
1
DS
0
DS
1
DS
2
DS
3
DS
0D
S1
DS
2D
S3
DA
C0
DA
C1
DA
C2
DA
C0
DA
C1
DA
C2
SW
0
SW
1
SW
2
SW
3
SW
0S
W1
SW
2S
W3
DD
S3
DD
S2
DD
S0
DD
S1
DD
S0
DD
S1
DD
S2
DD
S3
-VO
UT
1
LBO
2
LBI
3
GN
D4
VFB
8
VR
EF
7
+VS
6
LX5
U8
MA
X63
5
VC
C
D1
1N58
17C
1410
0uF
L3 100u
H
-5
C15
100n
F
1 2 3 4
J6 PW
R
C10
110
0nF
C10
210
0nF
C10
310
0nF
C10
410
0nF
C10
510
0nF
C10
610
0nF
C10
710
uFC
108
100u
F
VC
C
C20
110
0nF
C20
21n
FC
203
100n
FC
204
100n
F
-5
VC
C

A Phase Measurement Radio Positioning System for Indoor Use Reynolds 66
A-4: BPS CPU Board
12
34
56
ABCD
65
43
21
D C B A
Title
Num
ber
Rev
isio
nS
ize
B Dat
e:28
-Jan
-199
9S
heet
o
f Fi
le:
C:\M
y D
ocum
ents
\bps
\bps
cpu.
sch
Dra
wn
By:
AD
04
AD
15
AD
26
AD
37
AD
48
AD
59
AD
610
AD
711
AD
813
AD
914
AD
1016
AD
1117
AD
1218
AD
1319
AD
1420
AD
1521
A0/
-HB
S23
A1
24
A2
25
A3
26
A4
27
A5
28
A6
29
A7
30
A8
32
A9
33
A10
34
A11
35
A12
36
A13
37
A14
38
A15
39
A16
41
A17
42
A18
44
A19
45
A20
46
A21
47
-CS
048
-CS
1/-C
AS
H49
-CS
250
-CS
3/-C
AS
L51
PA
0/-C
S4/
TIO
CA
053
PA
1/-C
S5/
-RA
S54
PA
2/-C
S6/
-TIO
CB
055
PA
3/-C
S7/
-WA
IT56
PA
4/-W
RL/
-WR
57P
A5/
-WR
H/-L
BS
58P
A6/
-RD
59P
A7/
-BA
CK
60P
A8/
-BR
EQ
62P
A9/
-AH
/-IR
QO
UT/
-AD
TRG
63P
A10
/DP
L/TI
OC
A1
64P
A11
/DP
H/T
IOC
B1
65P
A12
/-IR
Q0/
DA
CK
0/TC
LKA
66P
A13
/-IR
Q1/
-DR
EQ
0/TC
LKB
67P
A14
/-IR
Q2/
DA
CK
168
PA
15/-I
RQ
3/-D
RE
Q1
69
CK
71E
XTA
L73
XTA
L74
NM
I76
-WD
TO
VF
78
-RE
S79
MD
080
MD
181
MD
282
AV
CC
85
AV
ref
86
PC
0/A
N0
87P
C1/
AN
188
PC
2/A
N2
89P
C3/
AN
390
AG
ND
91
PC
4/A
N4
92P
C5/
AN
593
PC
6/A
N6
94P
C7/
AN
795
PB
0/T
P0/
TIO
CA
297
PB
1/T
P1/
TIO
CB
298
PB
2/T
P2/
TIO
CA
310
0P
B3/
TP
3/T
IOC
B3
101
PB
4/T
P4/
TIO
CA
410
2P
B5/
TP
5/T
IOC
B4
103
PB
6/T
P6/
TO
CX
A4/
TC
LKC
104
PB
7/TP
7/TO
CX
B4/
TCLK
D10
5P
B8/
TP8/
RxD
010
7P
B9/
TP9/
TxD
010
8P
B10
/TP
10/R
xD1
109
PB
11/T
P11
/TxD
111
0P
B12
/TP
12/-I
RQ
4/S
CK
011
1P
B13
/TP
13/-I
RQ
5/S
CK
111
2P
B14
/TP
14/-I
RQ
61
PB
15/T
P15
/-IR
Q7
2
U1
HD
6417
032F
20
A16
2
A14
3
A12
4
A7
5A
66
A5
7A
48
A3
9A
210
A1
11A
012
D0
13
D1
14
D2
15
D3
17
D4
18
D5
19
D6
20
D7
21
-CE
122
A10
23
-OE
24
A11
25
A9
26A
827
A13
28R
/-W
29
A15
31
A18
1A
1730
U4
TC55
4001
FL
A0
A1
A2
A3
A4
A5
A6
A7
A8
A9
A10
A11
A12
A13
A14
A15
A16
A17
A18
D8
D9
D10
D11
D12
D13
D14
D15
A16
2
A14
3
A12
4
A7
5A
66
A5
7A
48
A3
9A
210
A1
11A
012
D0
13
D1
14
D2
15
D3
17
D4
18
D5
19
D6
20
D7
21
-CE
122
A10
23
-OE
24
A11
25
A9
26A
827
A13
28R
/-W
29
A15
31
A18
1A
1730
U3
TC55
4001
FL
A0
A1
A2
A3
A4
A5
A6
A7
A8
A9
A10
A11
A12
A13
A14
A15
A16
A17
A18
D0
D1
D2
D3
D4
D5
D6
D7
D0
D1
D2
D3
D4
D5
D6
D7
D8
D9
D10
D11
D12
D13
D14
D15
A0
A1
A2
A3
A4
A5
A6
A7
A8
A9
A10
A11
A12
A13
A14
A15
A16
A17
A18
A0
12
A1
11
A2
10
A3
9
A4
8
A5
7
A6
6
A7
5
A8
27
A9
26
A10
23
A11
25
A12
4
A13
28
A14
29
A15
3
A16
2
CE
22
OE
24
WE
31
VP
P1
D0
13
D1
14
D2
15
D3
17
D4
18
D5
19
D6
20
D7
21
U2
A28
F010
A0
A1
A2
A3
A4
A5
A6
A7
A8
A9
A10
A11
A12
A13
A14
A15
A16
D0
D1
D2
D3
D4
D5
D6
D7
1 2 3 4 5 6 7 8 9 10 11 12 13 14 15 16 17 18 19 20 21 22 23 24 25 26 27 28 29 30 31 32 33 34 35 36 37 38 39 40
J2 AN
ALO
GB
US
OC
1
C11
1D2
1Q19
2D3
2Q18
3D4
3Q17
4D5
4Q16
5D6
5Q15
6D7
6Q14
7D8
7Q13
8D9
8Q12
U5
SN
74H
CT5
73 OC
1
C11
1D2
1Q19
2D3
2Q18
3D4
3Q17
4D5
4Q16
5D6
5Q15
6D7
6Q14
7D8
7Q13
8D9
8Q12
U6
SN
74H
CT5
73
D11
D10
D9
D8
D7
D6
D5
D4
D3
D2
D1
D0
D0
D1
D2
D3
D4
D5
D6
D7
D0
D1
D2
D3
D4
D5
D6
D7
-CS
0
-CS
2-C
S3
-CS
1
R1
10K
1 23
U7A
SN
74H
C32
4 56
U7B
SN
74H
C32
-LB
S
-LB
S
-HB
S
-CS
2-L
OC
S
-HIC
S
-HB
SA
0
-LO
CS
-HIC
S
-RD
-WR
-WR
-RD
-WR
-RD
VC
C
-CS
0-R
D
-OU
TL
-INL
-RD
9 108
U7C
SN
74H
C32
12 1311
U7D
SN
74H
C32
-INL
-OU
TL
-CS
3
-RD
-WR
BP
S C
PU
M. R
eyno
lds
VC
C
-CS
1
DD
S/S
L
DD
S/R
ST
DD
S/F
QU
D
DD
S/W
CLK
MT0
MT1
MT2
DD
S/S
LD
DS
/RS
TD
DS
/FQ
UD
DD
S/W
CLK
12
34
56
78
910
1112
1314
1516
1718
J3 EX
PN
PO
RT
VC
CG
ND
TXD
1R
XD
1TX
D0
RX
D0
R1
IN13
R2
IN8
T1 IN
11
T2 IN
10
GND 15V+2
V-6
VCC16
R1
OU
T12
R2
OU
T9
T1
OU
T14
T2
OU
T7
C1+
1
C1
-3
C2+
4
C2
-5
U8
MA
X23
2CP
E(1
6)
TXD
0TX
D1
RX
D0
RX
D1
1 6 2 7 3 8 4 9 5
J4 HO
ST
+C
101u
f+
C13
1uf
+
C11
1uf
+
C12
1uf
GN
D
VC
C
1 2 3
J5 US
ER
TR
ISE
XP
TR
ISE
XP
-RS
T
C1
0.1
C2
0.1
C3
0.1
C4
0.1
C5
0.1
C6
0.1
C7
0.1
C8
0.1
C9
0.1
VC
C
VCC8 GND 4
OU
T5
Y1
CLK
OS
C
VC
C
1 2 3 4
J6 PO
WE
R
R2
330
R3
330
D1
TXD
D2
PW
R
VC
C
R4
330 D3
RX
D
+C
1422
+C
1522
VC
C
VCC3 GND 1
-RS
T2
U9
DS
1233
VC
C
-RS
T