a photo-based route visualization method for indoor way
TRANSCRIPT

Technische Universität München
Department of Civil, Geo and Environmental Engineering
Chair of Cartography
Prof. Dr.-Ing. Liqiu Meng
A photo-based route visualization method for
indoor way-finding
Shihui Xu
Master's Thesis
Duration: 21.06.2015 - 21.12.2015
Study Course: Cartography M.Sc.
Supervisor: Hao Lyu
2015

Declaration of originality
I hereby declare that the submitted master thesis entitled
A photo-based route visualization method for indoor way-finding
is my own work and that, to the best of my knowledge, it contains no material previously
published, or substantially overlapping with material submitted for the award of any other
degree at any institution, except where acknowledgement is made in the text.
Munich, December 9, 2015
Shihui Xu

Abstract
Nowadays indoor location-based services (indoor-LBS) are getting more and more attention.
Various data are captured while little work has been done to investigate visualization
methods for those data to an optimal communication for indoor-LBS. As a typical application
for indoor-LBS, compared with outdoor navigation, indoor navigation is more difficult that
the presentation of indoor geographical information is depending on technical limitations of
output media, accuracy of location information, and cognitive restrictions of the user [17].
There are researches indicating that users perform significantly better with photographs in
navigation tasks, especially when the navigation instruction is given [21], but seldom
mention how those photographs can be applied to route visualization. Therefore, this work
focused on photo-based route visualization. The idea is based on the finding that the human
brain constructs subconsciously a unique cognitive map from the starting point to the
endpoint of the route which is divided into single route sections of manageable sizes
characterized by waypoints and landmarks known or communicated to the user [25]. It
overcomes location inaccuracy problem [20] since no accurate location information is
needed.
Three sub-tasks are involved: firstly, scene recognition method is employed to extract
information from each scene of a route; secondly, route descriptions are generated from the
extracted information according to image schema; thirdly, route descriptions are symbolized
and combined with images (photos being pre-processed) to visualize an indoor route. Some
suggestions and improvements are also discussed.
The difficulties of automatic scene recognition are addressed in preparation work of photo-
based visualization. Previous scene recognition method was adapted and recognition
accuracy was increased by reducing classification amounts. For all three test routes, accuracy
of route 1 is 87%, route 2 is 85% and route 3 is 82.5%. Minor manual work is needed to cope
with the inaccurate information.
Image schema is introduced as an intermediate representation between data (photo, floor
plan and other relevant data) and route description. An innovative framework extended
from image schema is also proposed to process similar visualization workflow.
A user test is conducted to prove the feasibility of the designed visualization. The user test
proved the effectiveness of this method and nearly all test persons performed much better
by using those visualization results. From feedback of those test persons, they think those
images are clear and suggestive, and help them greatly in finding destination. Most of them
said without those images, they had no idea how to find the destination. Some females said
they had problem in reading a map or floor plan, those images gave them a good sense in
perceiving environment and it’s easier for them to remember where they had been to. A
conservative finding is that females seem to be more image-dependent than males.

Acknowledgement
I would like to express my greatest gratitude to my supervisor, Hao Lyu, PhD candidate in
Department of Cartography in Technical University of Munich, who has helped me a lot
through the whole process of thesis work.
Furthermore I would like to thank Jianghua Xu, Xiaoxiao Xie, Tian’e Li, Chen Wang, Tong Liu,
Jingwei Liu, Yurun Wu and Yijin Shao for attending my experiment and giving me suggestive
advices.
I also would like to express my special thanks to Juliane Cron, who has helped me a lot no
matter in life or study during my whole master program.
I would like to thank my classmates for their endless friendship and encouragement. Besides,
I will never forget those precious moments we have spent together and all those interesting
places we have been to.
And thanks to all my loved ones, who have supported me all the way along.

List of Figures
Figure 1 Whole Workflow .......................................................................................................... 3
Figure 2 Indoor scene recognition workflow ............................................................................. 9
Figure 3 Four example scenes (Scene 1, Scene 2, Scene 3 and Scene 4) ................................. 12
Figure 4 Relationship between image schema, object and action .......................................... 13
Figure 5 Image Schema workflow ............................................................................................ 16
Figure 6 Image coordinate system ........................................................................................... 19
Figure 7 Coordinate definition of bounding box in image coordinate system ........................ 19
Figure 8 Visualization result after manual modification (1-1, 2-6 and 3-24) .......................... 24
Figure 9 Corridor model ........................................................................................................... 25
Figure 10 Correctly recognized corridor scenes with bounding boxes (6-1, 6-2 and 6-3) ....... 26
Figure 11 Door model ............................................................................................................... 27
Figure 12 Correctly recognized door scenes with bounding boxes (6-4, 6-5 and 6-6) ............ 27
Figure 13 Elevator model ......................................................................................................... 28
Figure 14 Correctly recognized elevator scenes with bounding boxes (6-7, 6-8 and 6-9) ...... 29
Figure 15 Lobby model ............................................................................................................. 29
Figure 16 Correctly recognized lobby scenes with bounding boxes (6-10 and 6-11) .............. 30
Figure 17 Staircase model ........................................................................................................ 30
Figure 18 Correctly recognized staircase scenes with bounding boxes (6-12 and 6-13) ......... 31
Figure 19 Path from room 1779 to room 3704 ........................................................................ 33
Figure 20 Visualization result of route 1 (1-1 to 1-23) ............................................................. 38
Figure 21 Path from entrance of Carl von Linde passage to room 3238 ................................. 39
Figure 22 Visualization result of route 2 (2-1 to 2-20) ............................................................. 42
Figure 23 Path from entrance of 2F No.6 building to exit of No.6 building ............................. 42
Figure 24 Visualization result of route 3 (3-1 to 3-40) ............................................................. 47
Figure 25 Histogram of time record of route 2 ........................................................................ 50
Figure 26 Histogram of time record of route 1 ........................................................................ 51
Figure 27 Histogram of time record of route 3 ........................................................................ 51
List of Tables
Table 1 Basic Forms of Image Schema ..................................................................................... 11
Table 2 Mapping between action and image schema ............................................................. 13
Table 3 Extracted Schema from 4 sample scenes .................................................................... 15
Table 4 Mapping list from Extracted Schema to Interpretation .............................................. 15
Table 5 symbol list for route visualization ............................................................................... 18
Table 6 Mapping from image schema to symbol ..................................................................... 23
Table 7 Image Schema result of route 1 .................................................................................. 35
Table 8 Symbol guess result analysis ....................................................................................... 49
Table 9 Time record of each route ........................................................................................... 50

List of Equations
Equation 1 Final score calculation .............................................................................................. 8
Equation 2 Score of each example ............................................................................................. 8
Equation 3 Center of circle ....................................................................................................... 20
Equation 4 Position of filled pentagon in corridor ................................................................... 20
Equation 5 Position of filled pentagon in door ........................................................................ 20
Equation 6 Position of filled pentagon in staircase .................................................................. 20
Equation 7 relative time used .................................................................................................. 49
Table of Contents
1 Introduction ............................................................................................................................. 1
2 Related Works ......................................................................................................................... 4
2.1 Scene Recognition ............................................................................................................ 4
2.2 Image Schema and Route Description ............................................................................. 5
2.3 Photo-based Route Visualization ..................................................................................... 5
3 Indoor Scene Recognition ....................................................................................................... 6
3.1 Basic idea .......................................................................................................................... 7
3.1.1 Model Description ..................................................................................................... 7
3.1.2 Training ...................................................................................................................... 8
3.2 Workflow .......................................................................................................................... 9
4 Image Schema ....................................................................................................................... 10
4.1 Basic idea ........................................................................................................................ 10
4.2 Image Schema Extraction Rules ..................................................................................... 14
4.3 Semantic Description from Extracted Image Schema .................................................... 15
4.4 Workflow ........................................................................................................................ 16
5 Route Visualization ................................................................................................................ 17
5.1 Symbol Design ................................................................................................................ 17
5.2 Automatic Route visualization ....................................................................................... 18
5.2.1 Corridor ................................................................................................................... 19
5.2.2 Door ......................................................................................................................... 20
5.2.3 Elevator ................................................................................................................... 20
5.2.4 Lobby ....................................................................................................................... 20
5.2.5 Staircase .................................................................................................................. 20
5.3 Manual Modification ...................................................................................................... 23
6 Case Study ............................................................................................................................. 25
6.1 Scene Recognition Model training ................................................................................. 25
6.1.1 Training Dataset ...................................................................................................... 25
6.1.2 Corridor ................................................................................................................... 25
6.1.3 Door ......................................................................................................................... 26

6.1.4 Elevator ................................................................................................................... 28
6.1.5 Lobby ....................................................................................................................... 29
6.1.6 Staircase .................................................................................................................. 30
6.1.7 Result Analysis ......................................................................................................... 31
6.2 Test Dataset .................................................................................................................... 32
6.3 Indoor scene recognition result ..................................................................................... 33
6.4 Image Schema Result ..................................................................................................... 34
6.5 Visualization Result ........................................................................................................ 35
6.6 User Test ......................................................................................................................... 39
6.6.1 Experiment Preparation .......................................................................................... 39
6.6.2 Experiment Execution ............................................................................................. 47
6.6.3 Result analysis ......................................................................................................... 48
6.7 Improvement .................................................................................................................. 52
7 Conclusion ............................................................................................................................. 54
Reference ................................................................................................................................. 56
Appendix I ................................................................................................................................. 58
Appendix II ................................................................................................................................ 59
Appendix III ............................................................................................................................... 65
Appendix IV .............................................................................................................................. 67

1
1 Introduction Nowadays indoor location-based services (indoor-LBS) are getting more and more attention.
Various data are captured while little work has been done to investigate visualization
methods for those data to an optimal communication for indoor-LBS. Indoor navigation is a
typical indoor-LBS that helps people find their way to the destinations. However a large body
of work indicating that navigating people towards their destinations inside a building is
challenging [22]. When people walk in buildings, it can be confusing to find a way to the
destination, especially when indoor building designed as complex as a maze. Although they
can use floor plans, finding the floor plans is sometimes already a challenge. Even if floor
plans exist, it’s still not easy to apply them to real-world, or to transit those 2D floor plans to
3D objects as people see in their daily life. Human’s psychological recognition is such a
process that if a scene is more close to reality, then it will be easier for them to form an
internal spatial representation. Familiarity with an area is probably positively correlated with
the completeness of this internal spatial representation [18] and only if people get familiar
with their surroundings that they can perform faster in finding a destination. Although there
are already tremendous ways to make use of different data to provide outdoor navigation
services, such as maps and audio-aid, most of them are not feasible for indoor navigation.
Some methods are even criticized in outdoor navigation to be annoying and fail to give clear
instructions. For example, people hear audio information like this: keep driving and turn
right after 3km or please turn around in the front. The fact is, not too many people have an
idea how far 3 km is, it can be just a few minutes or quite a while depending on the driving
speed and current traffic condition. Although the car navigation systems keep reminding
drivers all the time, sometimes it’s quite annoying and people may complain that why it
doesn’t give a clearer instruction at first time. In such situation, it would be better if
semantic information could be added depending on what people see. For instance, if car
navigation systems remind drivers like this: Keep driving until you see a McDonald in front,
and turn left at the gate of Mac Donald , or keep driving, you will see a KFC on your right,
there you will find your destination just behind it.
Pedestrian navigation systems are quite different from car navigation systems. Walking
speed is a lot slower than driving speed and attention to traffic is not as important which
gives the pedestrian a lot of time to concentrate on his environment [16].Often a pedestrian
does have a little bit of extra time and would appreciate some additional information about
his current environment, which is usually not included in today’s commercial navigation
software [16].
When it comes to indoor route instruction, it seems more difficult that the form of
presentation is depending on technical limitations of output media, accuracy of location
information, and cognitive restrictions of the user [17]. Therefore how to generate effective
instructions from various data type is an essential part for indoor navigation. Following Ohm
et al. [21], users performed significantly better with the navigation prototype using
photographs, especially if the navigation instruction is given at a route point with a high
branching factor and thus high complexity.Fang et al. [23] also mentioned that the key

2
requirement in navigation is to guide pedestrians efficiently and effectively with a minimal
spatial cognitive burden on the users. Thus, in this thesis, an photo-based method is
proposed to visualize indoor scene and enhance way-finding process, the route is also
described in a more human-friendly way, which is depending on what people see. The basic
idea is that the human brain constructs subconsciously a unique cognitive map from the
starting point to the endpoint of the route which is divided into single route sections of
manageable sizes characterized by waypoints and landmarks known or communicated to the
user [19].It overcomes location inaccuracy problem [20] since no accurate location
information is needed. Firstly each scene of a route is recognized and then be extracted into
image schema, secondly route description is generated automatically, thirdly visualization
method is proposed to display route photos and a user test is conducted to prove its
usability, and finally some modifications are made to get an optimal visualization effect.
The aim of this thesis is to study current scene recognition methods and develop photo-
based visualization strategies for typical indoor-LBS scenarios. Tasks include extracting useful
information from photos, visualization for usable route description, user test for
visualization strategies, as well as designing a framework for whole workflow.
Research goals are listed as follows:
1. Understand the underlying mechanism of indoor scene recognition and adapt current
methods to my research. In my case, recognize several main indoor scenes based on my
dataset.
2. Have a deep understanding of image schemata and their correlation to indoor scene
recognition, know how to create schemata from indoor scene recognition results and know
how to derive route descriptions from schemata as well.
3. Propose a photo-based route visualization method and prove its usefulness.
To reach these goals, the following workflow (Figure 1) is used:
1. Each image from each route is automatically recognized as a scene of five categories:
corridor, door, elevator, lobby and staircase.
2. A standardization process will extract image schema from given photos according to
certain rules and generate route description automatically.
3. Each photo from each route will be calculated and added respective symbols
automatically, and manual modification is needed after automatic process.
4. A user test is conducted to collect feedback for route visualization results and further
modifications are made when necessary.

3
Figure 1 Whole Workflow
The rest of this thesis is organized as follows:
The second chapter are related works in recent years. The related works include three
aspects: indoor scene recognition, image schema and route visualization. This chapter also
states research goals.
The third chapter clarifies basic mechanism of adopted indoor scene recognition method
and model training process, as well as how it relates with thesis topic.
The fourth chapter deals with image schema, which in this thesis is treated as an
intermediate representation between data (photo, floor plan and other relevant data) and
route description.
The fifth chapter explains visualization strategy and its respective route visualization effects.
The sixth chapter takes a case as an example and shows how whole workflow can be applied
in this specific case. Besides, a user test of three routes is also conducted to check whether
those visualization results can help people in indoor way finding.
The seventh chapter makes a conclusion of whole work and proposes some potential work in
the future.

4
2 Related Works
2.1 Scene Recognition
A very important phase in environment representation is the simplification of the building
structure, extracting the geometrical data model [24].In this thesis, what is needed to be
detected is not a specific object, instead, a scene, which consists of several objects and
features, should be recogized as a whole. Scene recognition is based on object recognition,
that is, several features in a region or closed boundary corresponds to a scene which people
are familiar with in their daily life.
In object recognition, it is assumed that a region or a closed boundary corresponds to an
entity that is either an object or a part of an object [9]. Plenty of work has been done in
object recognition.
Hariharan and Bharath [8] mentioned that object recognition is not only object detection,
but also semantic segmentation. Object detection has bounding box, spatial extent but is
coarsely localized, while semantic segmentation can accurately mark out pixel but there is
no spatial extent. Thus he proposed a workflow to combine both to realize simultaneous
detection and segmentation. His 4-step workflow is as follows: generate proposals to
produce hierarchy of segmentation, extract features using convolutional neutral network
(CNN), classify regions to get each assign score and finally refine regions using top-down
category specific information.
Belongie et al. [7] proposed an invariant and robust shape matching and object recognition
method using shape contexts. Earlier shape matching methods were feature-based or
brightness-based, instead, they measured similarity between shapes and exploited it for
object recognition by solving for correspondences between points on the two shapes and
using the correspondence to estimate an aligning transform.
LoI and David G [6] mentioned that in order to detect features efficiently, the features
themselves should be sufficiently distinctive. A staged filtering approach, which identifies
stable points in scale space can efficiently achieve this. Thus he proposed a method named
Scale Invariant feature transform (SIFT) to divide an image into a large collection of local
feature vectors, in which each vector is invariant to image translation, scaling and rotation
and partially invariant to illumination changes and affine or 3D projection, by using key (a
stable location, scale and orientation), and finally describes the local image region in a
manner invariant to these transformations.
Oliva and Torralba [1] proposed a computational model of the recognition of real world
scenes through a procedure which is based on spatial envelope. They introduced spatial
envelope is the relationship between the outlines of the surfaces and their properties, and
it’s a very low representation of the scene. Their model generates a multidimensional space
in which scenes sharing membership in semantic categories.

5
Weakly supervised discovery of common visual structure in highly variable, cluttered images
is a key problem in recognition [2]. Megha and Svetlana [2] addressed this key problem by
using deformable part-based models (DPM’s) with latent Support Vector Machine (SVM)
training [10]. The basic idea is through unsupervised training, training images of indoor
scenes are classified into different categories, and testing images will calculate score for
each category then finally falls into the category in which it has the highest score.
2.2 Image Schema and Route Description
Dealing with the indoor recognition results is a tough issue. Martin and Michael [5] dealt
with the process of wayfinding using image schemata and affordance theory. They argued
that previous mental representations are not sufficient to find route, instead, image
schemata and affordance are useful to represent people’s perceptual and cognitive
structures. They also proposed a wayfinding graph to represent action and knowledge.
Hao et al. [13] proposed a representation of indoor places adopting the definition of
affordance-based place. They used a triangle graph to represent relationships between
places, image schemata and actions. They also proposed a computational method of way-
finding process.
However, image schemata are still too abstract to be presented to human beings, thus they
should be translated to specific route description. Following Butz et al. [17], a path of motion
can be divided into certain segments, each segment consisting at least of four parts
belonging to different categories: starting point, reorientation (orientation),
path/progression and ending point. They also suggested that a simple model for the
generation of route descriptions consists of three steps: The first step is the activation of a
representation of spatial knowledge at the appropriate scale for the route. The second step
consists of the choice of a specific route through the environment (depending in general on
the mode of travel, the desired route characteristics and the user’s presumed knowledge
about the environment). The last step consists of a translation from the chosen route to a
description, in their case a set of multimodal instructions suitable for different output
devices [17].
2.3 Photo-based Route Visualization
Because Text only descriptions are notoriously inadequate for expressing complex spatial
relations [17], there are various attempts to present route descriptions in a more intuitive
way. Inig et al. [11] have done a research on using split screens to combine maps ad images
for pedestrian navigation and found that in this way potentially less errors are caused. They
also suggested to combine image augmenting audition hints, textual instructions, map,
photographs, landmarks pictured on images, automatic map rotation and situating
geotagged images on top of a map to improve visualization effect, and thus easier for
pedestrian navigation.

6
Krisp et al. [12] investigated the display and communication of indoor routing instructions
via small maps, map-like graphics and non-photorealistic presentations of interior spaces in
their research and suggested that 3D joint visualization of the routing information and the
building geometry is a challenge, and using transparency to look inside and through walls or
buildings could help to solve occlusion problem when the route is crossing different floor
levels.
Radoczky [16] suggested that adding multimedia presentation forms to pedestrian
navigation systems can help the user to access more details and background information
about his environment. He also discussed several multimedia presentation forms for indoor
and outdoor navigation system, such as map, floor plan, verbal guidance, images, videos, 3D
presentation and online services, and proposed that when these forms are combined
together with landmark integration, they can improve way finding process.
Christian [14] suggested that a good design should be able to render visual hierarchy that
guides the user’s attention immediately to the relevant information, thus some visual
variables such as size, hue, orientation and shape are important in image interpretation as
they indicate visual hierarchy. Those design ideas are suggestive for this thesis.
3 Indoor Scene Recognition
A scene is mainly characterized as a place in which people can move [1]. An indoor scene is
always characterized by some typical indoor objects, such as corridor, door, elevator, lobby
and staircase. Most of indoor scenes consist of more than one indoor object, such as lobby
and staircase, or corridor and door that they exist in the same scene. However, in such a
complicated scene which contains more than one indoor object, people can still distinguish
which object dominates the whole scene. For instance, in a scene which contains lobby and
staircase at the same time, people normally notice staircase at the first sight while
neglecting the fact that they are in a lobby; or in a scene which contains corridor and door at
the same time but the door is far away, people may mainly focus on the fact that they are in
a corridor. Only when they have reached the door which is at the end of corridor, then they
will notice there is a door here. Thus, human’s perception about a scene is hierarchical, and
the object which has the highest hierarchy dominates the semantic attribute of the scene.
Indoor scene recognition is critical for indoor visualization, since it indicates what people
perceive in their environment. Nearly all indoor building structures consist of corridor, door,
elevator, lobby and staircase, and each of them has certain functionalities. For instance,
staircase and elevator lead people upward or downward, lobby provides a place to stop and
rest, while corridor connects different spaces and provides a path for people to go along.
Therefore, corridor, door, elevator, lobby and staircase are the most important scenes in this
study. If those indoor scenes can be recognized, they can be highlighted in visualization step
and further help people in wayfinding.

7
Indoor scene recognition is challenging, although there are some methods present, they still
have not reached a perfect result and the miss-recognizing rate is relatively high (>50%). The
difficulty is while some indoor scenes (e.g. corridors) can be well characterized by global
spatial properties, others (e.g. bookstores) are better characterized by the objects they
contain [3]. In this study scene recognition method implemented by Megha and Svetlana [2]
is referenced which considers both global and local spatial properties, moreover, the
amount of categories in scene classification is largely reduced to 5 common scenes in
campus building to increase recognition accuracy.
3.1 Basic idea
Weakly supervised discovery of common visual structure in highly variable, cluttered images
is a key problem in recognition [2]. Megha and Svetlana [2] addressed this problem using
deformable part-based models (DPM’s) with latent support vector machines (LSVM) training
[10]. Oliva and Torralba [1] argued that the structure of a scene consists of a holistic
representation and the most important object, thus they used a root filter and a part filter
which refers to a movable “Region of Interest (ROI)” to structure a model of a scene.
Meanwhile, the LSVM training process is used to discover the ROI’s automatically [2].
3.1.1 Model Description
An image is represented by a multi-scale feature pyramid using a variation of histogram-of-
gradient (HOG) features [2].This thesis followed Megha’s [2] method of partitioning the
image at each pyramid level into cells of 8 × 8 pixels and used nine orientation bins per HOG
cell. It also used pyramids of eight and sixteen levels per octave for scene classification and
object localization, respectively.
The scene is context-based and this paper used a multi-scale set of early-visual features,
which capture the “gist” of the scene into a low-dimensional signature vector [15]. Therefore,
each image (scene) in dataset has a basket of one-to-one GIST feature (a low dimensional
representation of the scene, which does not require any form of segmentation1).
This model consists of a coarse root filter that approximately covers an entire object, a set of
higher resolution parts filters that cover smaller parts of the object and associated
deformation models [10]. In the model of Megha and Svetlana [2], each filter defines a HOG
(histogram of oriented gradients) window of a given size. The filter responses at a given
location and scale in the image is given by the dot product of the vector of filter weights and
the HOG features of the corresponding window in the feature pyramid . The part filters are
applied to features at twice the spatial resolution of the root. They suggested that when the
number of parts filters was eight, it had the best performance. Therefore, in this model, the
number of parts filters is also set as eight.
The scene detection is hypothesized that there is at most one instance per root location [10].
Therefore, in the deformable part-based model (DPM’s), this paper define a score at
1http://lear.inrialpes.fr/pubs/2009/DJSAS09/gist_evaluation.pdf

8
different positions and scales in an image by using a feature pyramid, which specifies a
feature map for a finite number of scales in a fixed range [10]. The final score is calculated
(Equation 1) by the scores of each filter at their respective locations minus a deformation
cost that depends on the relative position of each part with respect to the root plus the bias
[10].
score(𝑝0, 𝑝1, … 𝑝𝑛) = ∑ 𝑆𝑘
𝑛
𝑘=0
− ∑ 𝐶𝑘
𝑛
𝑘=0
+ 𝑏
(1)
Equation 1 Final score calculation
(𝑆𝑘 is the score of each filter at its respective location, 𝐶𝑘 is the deformation cost that
depends on the relative position of each part with respect to the root, b is the bias)
In this model the part filters capture features at twice the spatial resolution relative to the
features captured by the root filter [10].In LSVM training process, each example x is scored
by a function as (Equation 2):
𝑓𝛽(𝑥) = max 𝛽 ∙ ∅(𝑥, 𝑧) (1)
Equation 2 Score of each example
(𝑧 ∈ 𝑍(𝑥),𝛽 is the concatenation of the root filter, the part filters, and deformation cost
weights, 𝑧 is a specification of the object configuration, and ∅(𝑥, 𝑧) is a concatenation of sub
windows from a feature pyramid and part deformation features) [10]
3.1.2 Training
In this study, multi-class scene classification is used. To improve accuracy, a square root filter
is used and restricted to have at least 40% overlap with the image (which means that for a
square image, the root filter covers over 60% of each dimension) [2].
The automatic training process is weakly unsupervised. For training one model, it takes all
images in current folder as positive images and all other images in other folders as negative
images. After training, it will calculate score of the test image for each class. The class which
has the maximum score for the test image is where the test image belongs to.

9
3.2 Workflow
Figure 2 Indoor scene recognition workflow
The workflow (Figure 2) is a 4-step process:
1. Prepare all training images and test images and preprocess all dataset. Put each training
image into its unique training image folder. After this step, there should be 5 folders each
containing its own training images.
2. Extract GIST features for all dataset by using Computer Vision Feature Extraction Toolbox
[1] classified by folder. All GIST features should be a one to one relation to the image folder.
3. Run training. It takes normally 1 hour to run one model and will get model, score and
bounding box in the end.
4. According to the highest score one scene gets, it will be classified to one specific category.
Bounding box can be also visualized in a scene to see where the important object lies in.

10
4 Image Schema
After indoor scene recognition, all images taken from one route get their respective labels.
However, all those labels can be repetitive in one sub-route. For instance, in a corridor-only
sub-route, all images (can be five, six or even more) are labeled as ‘corridor’, but in human
cognition process, it’s better to perceive such a corridor-only route as a whole, that is, to
treat the whole corridor as one scene and describe only once.
All those images of one route are labeled chronologically, therefore subsequent images have
a certain kind of relation. For instance, if several subsequent images are all labeled as
‘staircase’, it tells that the observer is walking on the stairs; if subsequent images are all
labeled as ‘door’ and the next image of door looks bigger than the previous one, it tells that
the observer is walking approaching the door, when the next image after door-series is a
corridor, it tells that the observer just walked through the door.
In order to clarify all those relations and to briefly describe a route, definition of image
schema is adopted and a formal model [5] is built in this thesis.
4.1 Basic idea
An image schema is a recurring structure within cognitive processes which establishes
patterns of understanding and reasoning [4].Image schemata are intended to be pervasive,
well defined, and of sufficient structure to constrain people’s understanding and reasoning.
The PATH schema, for example, represents movement and is therefore important for
wayfinding. It is structured through a starting point, an endpoint, and a connection between
these points [5].
An image schema reflects a relation. For one certain relation, it is fixed that can be easily
adapted to describe other situations. Table 1 lists some basic image schemata (some are not
used in this study), which nearly covers most of human indoor wayfinding processes.
Example scenes are shown in Figure 3.
Description Extracted Image Schema Example
starting point START(I) ”I start from here“= START(I)
endpoint END(I) ” I end here” = END(I)
Link observer to an object LINK(I, object)
S2:”I see an elevator and a
staircase”= LINK(I, elevator),
LINK(I, staircase)
Observer is inside a specific
area IN_CONTAINER(I, area)
S4:”I stand in the lobby to the
library” = IN_CONTAINER(I,
lobby)
Observer is out of a specific
area
OUT_OF_CONTAINER(I,
area) S4:”I stand out of
library“=OUT_OF_CONTAINER(I,

11
library)
Observer is in front of a
specific object IN_FRONT_OF(I, object)
S2:”I stand in front of an
elevator”= IN_FRONT_OF(I,
elevator)
Observer is in the left of a
specific object LEFT_OF(I, object)
S4:”I stand left of a
staircase”=LEFT_OF(I, staircase)
Observer is in the right of a
specific object RIGHT_OF(I, object)
S1”I stand right of room
1783”=RIGHT_OF(I, Room
1783)
Observer is between object
A and object B
BETWEEN(I, object A, object
B)
S1:”I stand between room 1783
and a door to another
corridor”= BETWEEN(I, Room
1783, door)
Observer is standing on the
surface of a specific object ON_SURFACE(I, object)
S1:”I stand on the surface of a
corridor”= ON_SURFACE(I,
corridor)
Observer is passing
through an object PATH_THROUGH(I, object)
S3:”I go through the door which
is to a lobby”=
PATH_THROUGH(I, door)
Observer is walking along
an object/path PATH_ALONG(I, object)
S1:”I go along a corridor” =
PATH_ALONG(I, corridor)
Observer is walking
upward UP(I, object)
S2:”I go upstairs by
elevator”=UP(I, elevator)
Observer is walking
downward DOWN(I, object)
S2:”I go downstairs by
elevator”=UP(I, elevator)
Observer is connecting
object A and object B
CONNECT(I, object A, object
B)
S2:”The elevator is connecting
1st floor and 2nd floor”=
CONNECT(elevator, 1st floor, 2nd
floor)
Table 1 Basic Forms of Image Schema
12
Scene 1 Scene 2
Scene 3 Scene 4
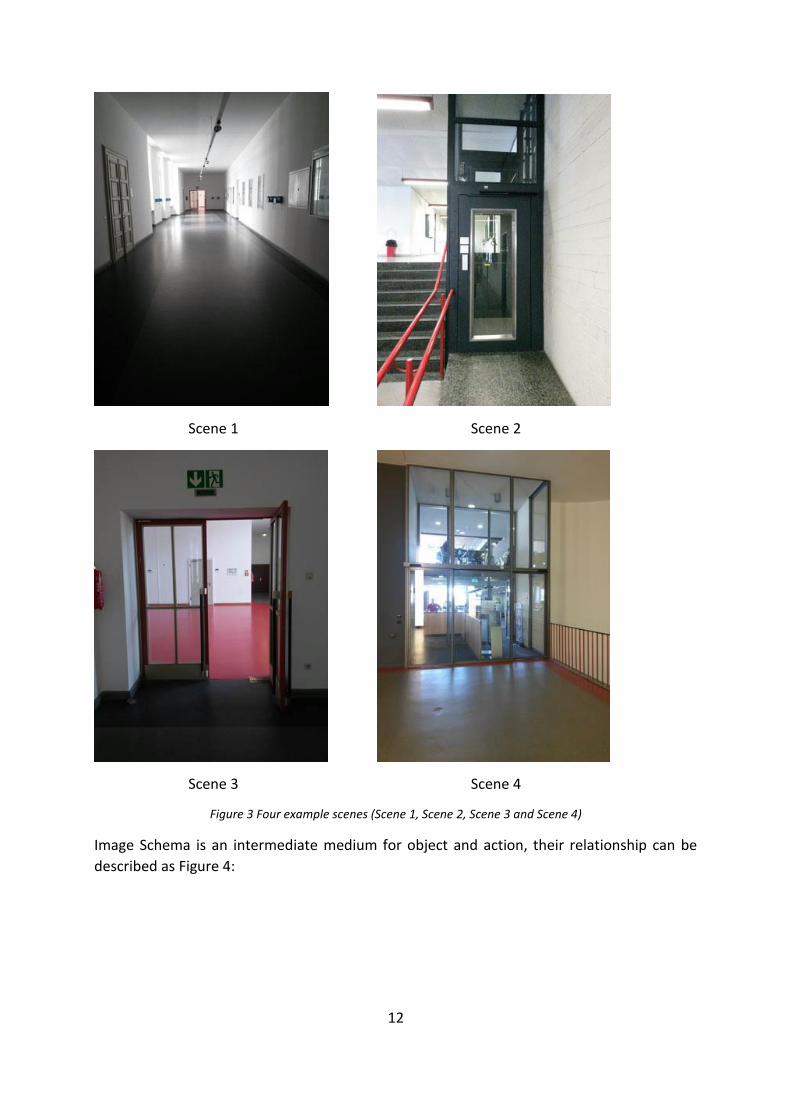
Figure 3 Four example scenes (Scene 1, Scene 2, Scene 3 and Scene 4)
Image Schema is an intermediate medium for object and action, their relationship can be
described as Figure 4:

13
Figure 4 Relationship between image schema, object and action
There are many interpretations for one image schema. In this study, a certain action for one
schema is defined. Some actions can be used by several schemata. Table 2 lists mapping
relations between action and image schema.
Action Image Schema
See LINK(I, object)
Stand ON_SURFACE(I, object)
IN_FRONT_OF(I, object)
LEFT_OF(I, object)
RIGHT_OF(I, object)
BETIEN(I, object A, object B)
Go along PATH_ALONG(I, object)
Go through PATH_THROUGH(I, object)
Go up/down UP(I, object)
DOWN(I, object)
Table 2 Mapping between action and image schema
14
4.2 Image Schema Extraction Rules
Through indoor scene recognition method, main scene in each image has been already
recognized, such as elevator, lobby, staircase, corridor and door. Since one path contains
several images, depending on image frequency, resulting in different scene extraction
frequency, e.g. in one corridor-only path, may contain 2 corridor images or 5 corridor images.
Thus, in order to efficiently use image schema and simpify extraction process, three
conditions for an ideal dataset and four image schema extraction rules are defined in this
paper:
Condition 1: The given amount of images for one path is large enough to describe the path,
which means, more images are needed for complex scene (transition from one scene to
another scene) than simple scene(e.g. remain in a corridor or staircase).
Condition 2: All critical scenes can be recognized. Due to limitations of indoor scene
recognition method, not all scenes can be correctly recognized (which will have wrong label),
suppose all critical scenes(corridor, staircase, door) have been recognized more than the
minimum number.
Condition 3: Each scene is front-view scene, which means, each scene is path relevant, what
observer saw on his left or right doesn't matter, only what he saw in the front is taken into
consideration.
Rule 1: MODE is first given (1 represents up, 0 represents down) as an indication of up/down
direction when walking staircase.
Rule 2: One path schema starts with START(I) and ends with END(I).
Rule 3: The first corridor will be extracted as ON_SURFACE schema and the first staircase will
be extracted as LINK schema.
Rule 4: When there are more than one subsequent “corridor” in indoor scene recognition
result, all those subsequent “corridor” will be treated as one and be derived into
PATH_ALONG schema; likewise, when there are more than one subsequent ‘staircase’in
indoor scene recognition result, all those subsequent ‘staircase’ will be treated as one and be
derived into UP/DOWN schema.
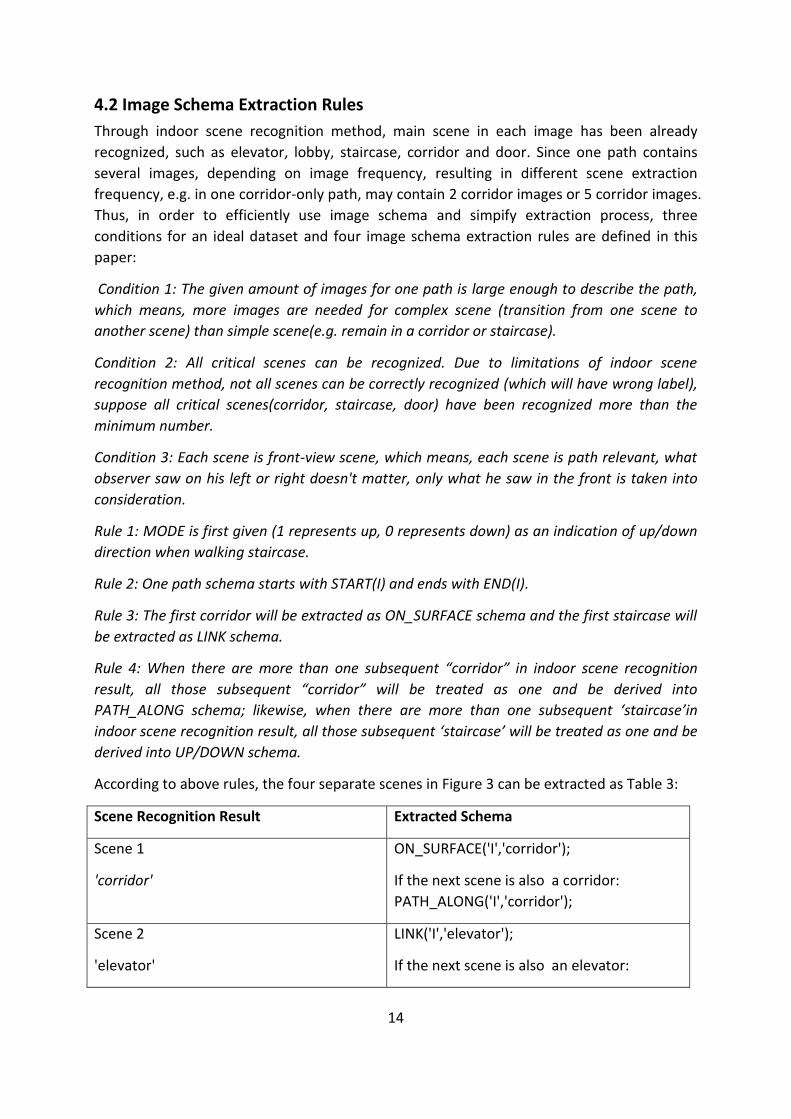
According to above rules, the four separate scenes in Figure 3 can be extracted as Table 3:
Scene Recognition Result Extracted Schema
Scene 1
'corridor'
ON_SURFACE('I','corridor');
If the next scene is also a corridor:
PATH_ALONG('I','corridor');
Scene 2
'elevator'
LINK('I','elevator');
If the next scene is also an elevator:

15
UP('I','elevator '); or DOWN('I','elevator ')
Scene 3
'door'
LINK('I','door');
If the next scene is a corridor:
PATH_THROUGH('I','door');
Scene 4
‘elevator’ (this is the last scene in one path
and this label is wrong)
LINK('I','elevator');
END(I);
Table 3 Extracted Schema from 4 sample scenes
4.3 Semantic Description from Extracted Image Schema
One given image schema can be organized into one sentence through given action. There is
also a mapping list (Table 4) of how to change schema into sentence.
Extracted Image schema Interpretation
LINK(I, object) I see object.
ON_SURFACE(I, object) I stand in object.
PATH_ALONG(I, object) I go along object.
PATH_THROUGH(I, object) I go through object.
UP(I, object) I go up of object.
DOWN(I, object) I go down of object.
Table 4 Mapping list from Extracted Schema to Interpretation
One full description also begins with “I start from here.” and end with “I end here.” In this
way a whole description of a path is automatically generated.
After several trials, it is noticed that the generated description is too simple and without
turn-left or turn-right actions. Therefore, some self-defined action demands are added
according to floor plan. See chapter 5 Route Visualization for details.

16
4.4 Workflow
Figure 5 Image Schema workflow
The workflow (Figure 5) is a 3-step process:
1. Sort indoor scene recognition results and make it in a one-after-one order of the path.
2. Extract image schema from each scene.
3. Generate route descriptions from all extracted image schemata.
The whole process is automatic, therefore, the semantic route description seems to be
robotic.
17
5 Route Visualization
It is plausible to assume that a person perceives more objects on a route than he would use
in navigation instructions for the same route [22].Therefore, a good route visualization
strategy should help people in indoor way-finding process by attracting people’s attention.
Several symbols are designed here to visualize given route images following a principle that
those symbols should be easy to understand and clear to see.
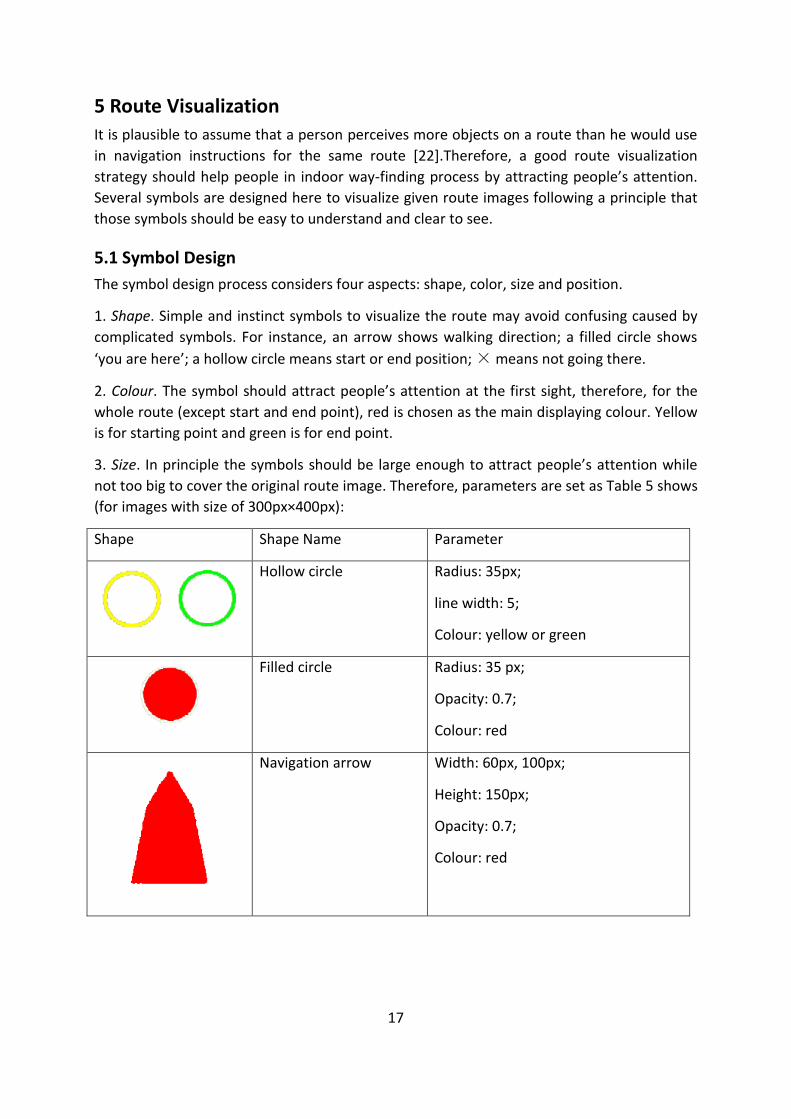
5.1 Symbol Design
The symbol design process considers four aspects: shape, color, size and position.
1. Shape. Simple and instinct symbols to visualize the route may avoid confusing caused by
complicated symbols. For instance, an arrow shows walking direction; a filled circle shows
‘you are here’; a hollow circle means start or end position; × means not going there.
2. Colour. The symbol should attract people’s attention at the first sight, therefore, for the
whole route (except start and end point), red is chosen as the main displaying colour. Yellow
is for starting point and green is for end point.
3. Size. In principle the symbols should be large enough to attract people’s attention while
not too big to cover the original route image. Therefore, parameters are set as Table 5 shows
(for images with size of 300px×400px):
Shape Shape Name Parameter
Hollow circle
Radius: 35px;
line width: 5;
Colour: yellow or green
Filled circle Radius: 35 px;
Opacity: 0.7;
Colour: red
Navigation arrow Width: 60px, 100px;
Height: 150px;
Opacity: 0.7;
Colour: red

18
Staircase arrow Width: 100px;
Height: 150px;
Opacity: 0.7;
Colour: red
Staircase arrow + cross Staircase arrow:
Colour: black
Cross:
Line length (each): 100√2 px;
Intersection angle: 90°;
line width: 20;
Cross colour: red
Direction arrow Position and direction according to
each situation;
Colour: red
Table 5 symbol list for route visualization
4. Position. Theoretically those symbols should be placed in middle of recognized scene.
5.2 Automatic Route visualization
Automatic route visualization process has been realized in such a way that in conformity
with rules of image schemata, and positions of symbols are calculated according to position
of bounding box of each image. The coordinate system is defined as Figure 6:

19
Figure 6 Image coordinate system
The position of bounding box is defined as figure 5 that the up-left coordinate of bounding
box is (x1,y1) and the right-down coordinate is (x2,y2) . The position (Figure 7) of hollow circle
symbol in start or end image is fixed as the center of image.
Figure 7 Coordinate definition of bounding box in image coordinate system
5.2.1 Corridor
The position of symbol in corridor scene depends on whether the image schema is
ON_SURFACE(I, object) or PATH_ALONG(I, object). If the image schema is ON_SURFACE(I,

20
object), then the symbol is a filled red circle and the center of circle (𝑥𝑂 , 𝑦𝑂 ) is calculated as
Equation 3:
𝑥𝑂 = (𝑥1 + 𝑥2)/2
𝑦𝑂 = (𝑦1 + 𝑦2)/3
(2)
Equation 3 Center of circle
If the image schema is PATH_ALONG(I, object), then the symbol is a navigation arrow which
is actually a filled pentagon consisting of 5 coordinates: (x-30, y+50), (x-50, y+150), (x+50,
y+150), (x+30, y+50), (x, y), x and y are calculated as Equation 4:
𝑥 = (𝑥1 + 𝑥2)/2
𝑦 = (𝑦1 + 𝑦2)/2
(3)
Equation 4 Position of filled pentagon in corridor
5.2.2 Door
When the image schema is PATH_THROUGH(I, object), the symbol is also a filled pentagon
consisting of 5 coordinates: (x-30, y+50), (x-50, y+150), (x+50, y+150), (x+30, y+50), (x, y) but
with different calculation method (Equation 5):
𝑥 = (𝑥1 + 𝑥2)/2
𝑦 = 2 × (𝑦1 + 𝑦2)/3
(4)
Equation 5 Position of filled pentagon in door
5.2.3 Elevator
The symbol and position of elevator is the same with the red filled circle in corridor scene.
5.2.4 Lobby
The symbol and position of elevator is the same with the red filled circle in corridor scene.
5.2.5 Staircase
If the image schema is UP(I, object) or DOWN(I, object), the symbol is a filled pentagon
consisting of 5 coordinates: (x-50, y+50), (x-50, y+150), (x+50, y+150), (x+50, y+50), (x, y), x
and y are calculated as Equation 6:
𝑥 = (𝑥1 + 𝑥2)/2
𝑦 = (𝑦1 + 𝑦2)/3
(5)
Equation 6 Position of filled pentagon in staircase

21
Otherwise, people should not step on the staircase. Therefore, color of filled pentagon is set
from red to black and a filled red cross is placed above pentagon to warn people. The
pentagon is in the same position and the cross consists of two lines with coordinates ((x-50,
y+25), (x+50, y+125)) and ((x+50, y+25), (x-50, y+125)) respectively, x and y are calculated
from the same staircase formula.
Table 6 shows a list of designed symbol for each image schema:
Image Schema Visualization symbol
START(I)
END(I)

22
PATH_ALONG(I, object)
PATH_THROUGH(I, object)
UP(I, object) DOWN(I, object)

23
ON_SURFACE(I, object)
DO_NOT(I)
Table 6 Mapping from image schema to symbol
5.3 Manual Modification
In order to improve way finding process, direction arrow is added to the automatically generated routes and unnecessary symbols which are created due to wrong recognition are deleted. For instance, a turn-left arrow is added to 1-1; original filled red circle is replaced by a walk-forward arrow in 2-6; original filled red circle is replaced by a turn-left arrow in 3-24. (Figure 8)

24
1-1 2-6 3-24
Figure 8 Visualization result after manual modification (1-1, 2-6 and 3-24)
25
6 Case Study
In case study, three typical indoor routes were selected from main campus of TUM
(Technical University of Munich) and were studied how indoor scene recognition method,
image schema and visualization techniques can be applied to these route data.
6.1 Scene Recognition Model training
6.1.1 Training Dataset
The training dataset is original training dataset [2] mixing with several indoor photos taken in
person from main TUM campus, mainly from five categories: corridor, door, elevator, lobby
and staircase. Since the original dataset didn’t contain door category, training dataset of
door were created additionally, which has 80 training images. In order to make each image
comparable, all photos were downgraded to similar size of the original training images.
The test images are also from TUM campus and can be partly downloaded2, and the image
size is also downgraded to comparable size with the training dataset.
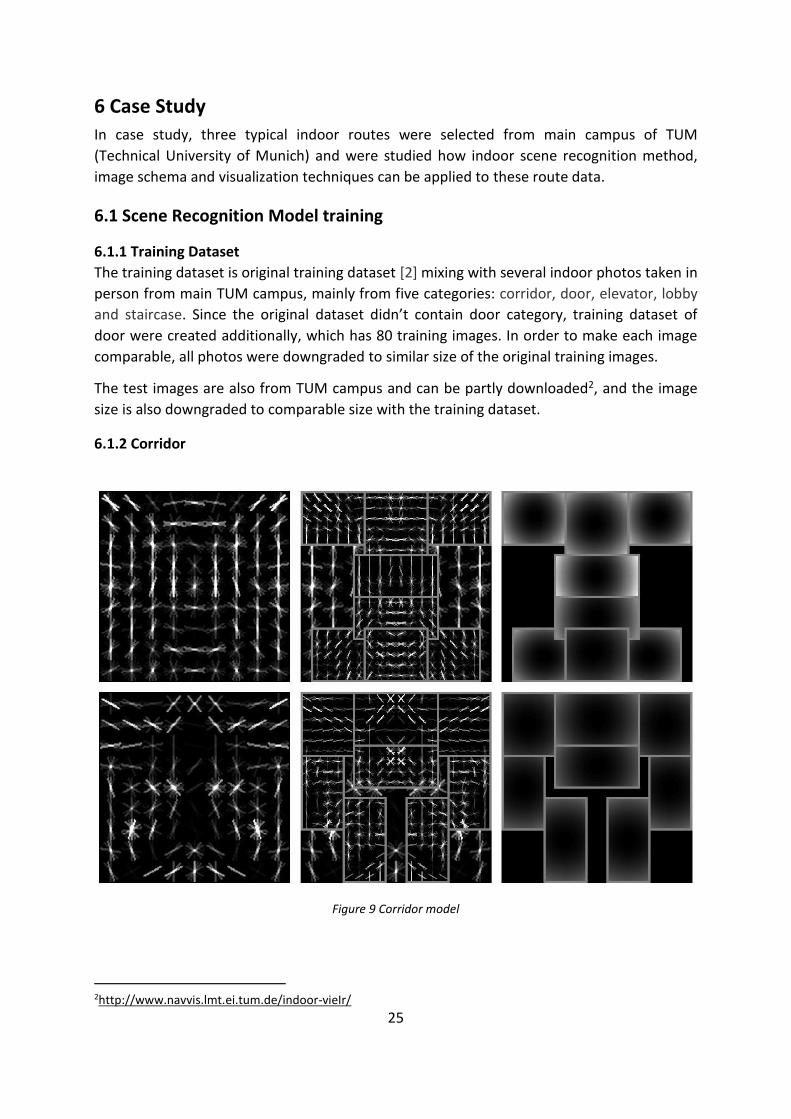
6.1.2 Corridor
Figure 9 Corridor model
2http://www.navvis.lmt.ei.tum.de/indoor-vieIr/

26
The above corridor model (Figure 9) shows the root filter (column 1), part filters (column 2)
and the deformation model (column 3). Top row is the first model component and bottom
row is the second model component.
Figure 10 shows three correctly recognized corridor scenes with bounding boxes:
6-1 6-2 6-3
Figure 10 Correctly recognized corridor scenes with bounding boxes (6-1, 6-2 and 6-3)
According to the test result, it is noticed that most corridor scenes can be recognized, since
corridor is mainly characterized by global feature that a scene has two parallel facades (one
on the left and one on the right). It is also found that when a corridor scene has only one
facade of wall, it cannot be recognized or mistakenly recognized.
6.1.3 Door

27
Figure 11 Door model
The above door model (Figure 11) shows the root filter (column 1), part filters (column 2)
and the deformation model (column 3). Top row is the first model component and bottom
row is the second model component.
Figure 12 shows three perfectly recognized door scenes with bounding boxes:
6-4 6-5 6-6
Figure 12 Correctly recognized door scenes with bounding boxes (6-4, 6-5 and 6-6)

28
According to the whole test results, it is noticed that most of the door scenes can be
recognized. Since doors have different sizes or shapes, they cannot always be enclosed by
the bounding box. Some door scenes are mistakenly recognized. The reasons come from
three aspects:
1. When the surface of a door is coved by something (e.g. posters), the door might be
mistakenly recognized as cinema.
2. When the door is part of a corridor (e.g. end of a corridor or a connection between two
corridors), especially when the door is open, it has a high possibility to be recognized as
corridor.
3. When people can clearly see other large objects (e.g. staircase) through the door, which is
normally part of a corridor and at a state of open, it is probably recognized as something else,
depending on what people see.
6.1.4 Elevator
Figure 13 Elevator model
The above elevator model (Figure 13) shows the root filter (column 1), part filters (column 2)
and the deformation model (column 3). Top row is the first model component and bottom
row is the second model component.
Figure 14 shows three perfectly recognized elevator scenes with bounding boxes:

29
6-7 6-8 6-9
Figure 14 Correctly recognized elevator scenes with bounding boxes (6-7, 6-8 and 6-9)
According to the whole test results, it is noticed that most elevator scenes can be recognized,
since most elevators have a typical different properties compared with background.
6.1.5 Lobby
Figure 15 Lobby model

30
The above lobby model (Figure 15) shows the root filter (column 1), part filters (column 2)
and the deformation model (column 3). Top row is the first model component and bottom
row is the second model component.
Figure 16 shows two recognized lobby scenes with bounding boxes from my test dataset:
6-10 6-11
Figure 16 Correctly recognized lobby scenes with bounding boxes (6-10 and 6-11)
6.1.6 Staircase
Figure 17 Staircase model

31
The above staircase model (Figure 17) shows the root filter (column 1), part filters (column 2)
and the deformation model (column 3). Top row is the first model component and bottom
row is the second model component.
Figure 18 shows two perfectly recognized staircase scenes with bounding boxes:
6-12 6-13
Figure 18 Correctly recognized staircase scenes with bounding boxes (6-12 and 6-13)
Staircase recognition is a bit tricky in this study since there are many types of staircase. Even
for one staircase, it has many shapes from different viewing aspects, and each aspect differs
a lot from each other. It’s not possible to include all aspects in this study, therefore, let’s
assume all views are front-view, so that each staircase scene has nearly the same viewing
aspect. Nevertheless, there are still some mistakenly recognized cases as follows:
1. When the scene is a stand-on-the staircase view, which means the staircase occupies
nearly the whole image and the steps are only part of the staircase, it is usually cannot be
recognized or mistakenly recognized as railway.
2. When a scene has a corridor and a staircase at the same time but the staircase just
appears as a side view, in which the steps cannot be seen, it will be recognized as corridor as
supposed to be.
6.1.7 Result Analysis
According to analysis to recognized scene results, five factors are found that affect
recognized accuracy.
1. The number of training images, especially those similar to test images, can improve
recognized accuracy.
2. The conformity of training images and test images can affect result. When all those
images are in similar or comparable size, the result is better than those that are not.
3. Some overlapping features in test images between different classes can affect test results.
For instance, in elevator training dataset, some elevators have handrails which look quite
similar to some staircases in one of test dataset and thus, those staircases with handrails
were mistakenly recognized.
4. Illumination of images does not affect recognized accuracy.

32
5. The position of critical features in test images can greatly affect accuracy. It’s better that
critical features such as staircase or door is just in the middle of image, otherwise it can be
mistakenly recognized.
In overall, every scene is at least partly recognized since it is assumed that root filter covers
at least 40% of the whole image and current accuracy of recognition results are acceptable.
6.2 Test Dataset
Three typical routes from TUM main campus are chosen as test routes. Route 1 contains 23
images (Appendix II) describing the path from room 1779 to room 3704 (Figure 19). It’s a
simple and typical indoor route which mainly consists of corridors and staircases. Route 2
contains 20 images describing the path from lobby in direction of Carl von Linde-HÖRSAAL to
room 3238 (Figure 21). This path is a bit more complicated than the first route as it has some
ambiguous structures and especially one door scene among this route is a door-closed scene,
which is beyond conception of normal situation. Route 3 is the most complicated as it
contains all five structures. It has 40 images and describes the path from the lobby which on
the 2nd floor in direction of physical building to the door on the ground floor which is the
closest exit to signal light on Theresienstr (Figure 23). This route contains elevator at corner
while at the same time staircases are also nearby thus poses a big challenge for test group.
All those test images were taken from TUM main campus and were set to same size. Those
images can be found in Appendix II. Floor plans are also drafted to display photograph spot
of each image. Here route 1 is explained in detail, others can be found in Appendix III. In this
33
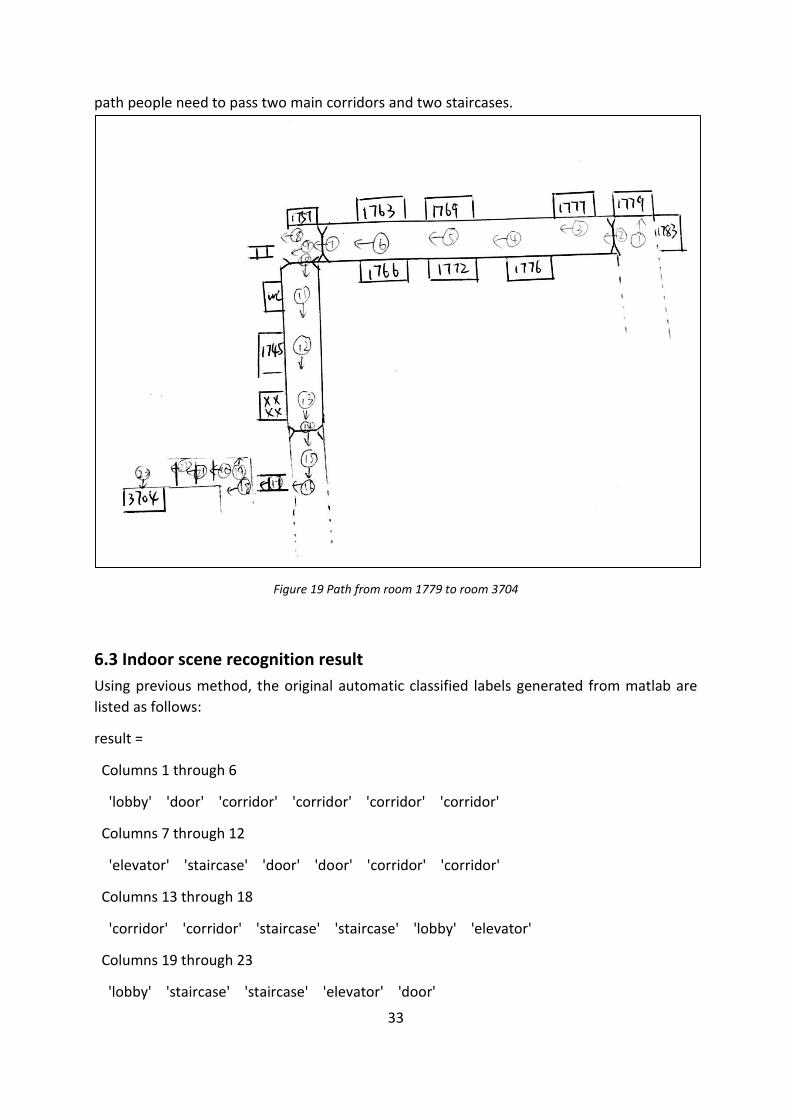
path people need to pass two main corridors and two staircases.
Figure 19 Path from room 1779 to room 3704
6.3 Indoor scene recognition result
Using previous method, the original automatic classified labels generated from matlab are
listed as follows:
result =
Columns 1 through 6
'lobby' 'door' 'corridor' 'corridor' 'corridor' 'corridor'
Columns 7 through 12
'elevator' 'staircase' 'door' 'door' 'corridor' 'corridor'
Columns 13 through 18
'corridor' 'corridor' 'staircase' 'staircase' 'lobby' 'elevator'
Columns 19 through 23
'lobby' 'staircase' 'staircase' 'elevator' 'door'

34
If bounding boxes are added to original images (Appendix II), they look like in Appendix IV.
In 23 path images, it is acceptable that only three scenes are not correctly recognized, the
mistakenly recognized rate is 13%.
In those mistakenly recognized scenes, Scene 6.3-7, 6.3-18 and 6.3-22 are mistakenly
recognized as elevator, that’s because they share most similarities with training dataset of
elevator so they are classified into elevator class. Those mistakes reflect problem in training
process.
For those complicated scenes, which have more than one scene in one image, it might be
skeptical that which class it actually belongs to. For instance, Scene 6.3-2 has both door and
corridor in one image, it is recognized as “door” because door is at the first hierarchical sight;
Scene 6.3-6 has both door and corridor in one image but is recognized as “corridor” because
this time corridor is at the first hierarchical sight. In Scene 6.3-14, which has corridor, door
and staircase at the same image, is finally recognized as “corridor” because corridor occupies
largest area of this image.
6.4 Image Schema Result
Table 7 shows extracted image schemata of route 1.
Scene Extracted Image Schema
View 1 START('I');
ON_SURFACE('I','lobby');
View 2 LINK('I','door');
View 3 ON_SURFACE('I','corridor');
PATH_ALONG('I','corridor');
View 4
View 5
View 6
View 7
View 8 LINK('I','staircase');
View 9 LINK('I','door');
PATH_THROUGH('I','door'); View 10
View 11 ON_SURFACE('I','corridor');
PATH_ALONG('I','corridor'); View 12

35
View 13
View 14
View 15 LINK('I','staircase');
UP('I','staircase'); View 16
View 17 ON_SURFACE('I','lobby');
View 18
View 19 ON_SURFACE('I','lobby');
View 20 LINK('I','staircase');
UP('I','staircase'); View 21
View 22
View 23 LINK('I','door');
END(I);
Table 7 Image Schema result of route 1
Automatic generated route description:
I start from here. I stand in the lobby. I see a door. I stand in the corridor. I go along the
corridor. I see a staircase. I see a door. I go through the door. I stand in the corridor. I go
along the corridor. I see a staircase. I go up the staircase. I stand in the lobby. I stand in the
lobby. I see a staircase. I go up the staircase. I see a door. I end here.
According to the floor plan, it is noticed that there are two obvious turn-left actions, one
between view 1 and view 2, the other is between view 9 and view 10. Therefore, I add my
self-defined description to the previous description.
I start from here. I stand in the lobby. Turn left. I see a door. I stand in the corridor. I go along
the corridor. I see a staircase. Turn left I see a door. I go through the door. I stand in the
corridor. I go along the corridor. I see a staircase. I go up the staircase. I stand in the lobby. I
stand in the lobby. I see a staircase. I go up the staircase. I see a door. I end here.
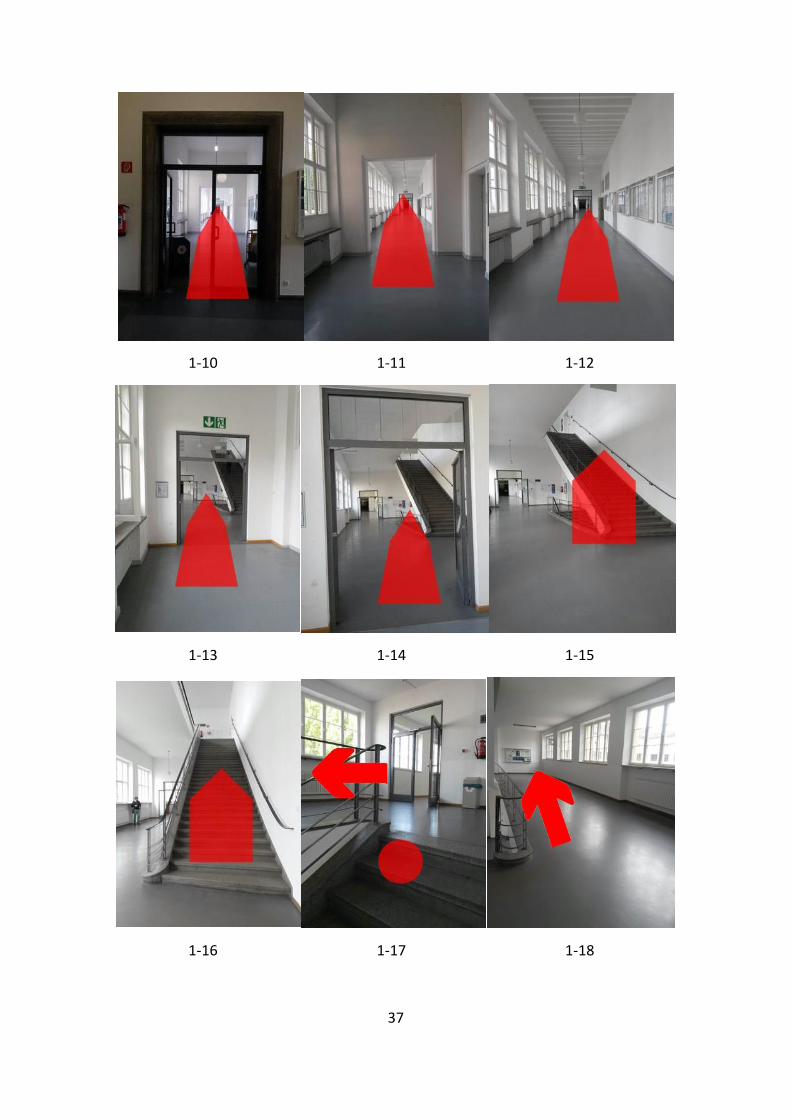
6.5 Visualization Result
Figure 20 shows visualization result of route 1.

36
1-1 1-2 1-3
1-4 1-5 1-6
1-7 1-8 1-9
37
1-10 1-11 1-12
1-13 1-14 1-15
1-16 1-17 1-18

38
1-19 1-20 1-21
1-22 1-23
Figure 20 Visualization result of route 1 (1-1 to 1-23)
39
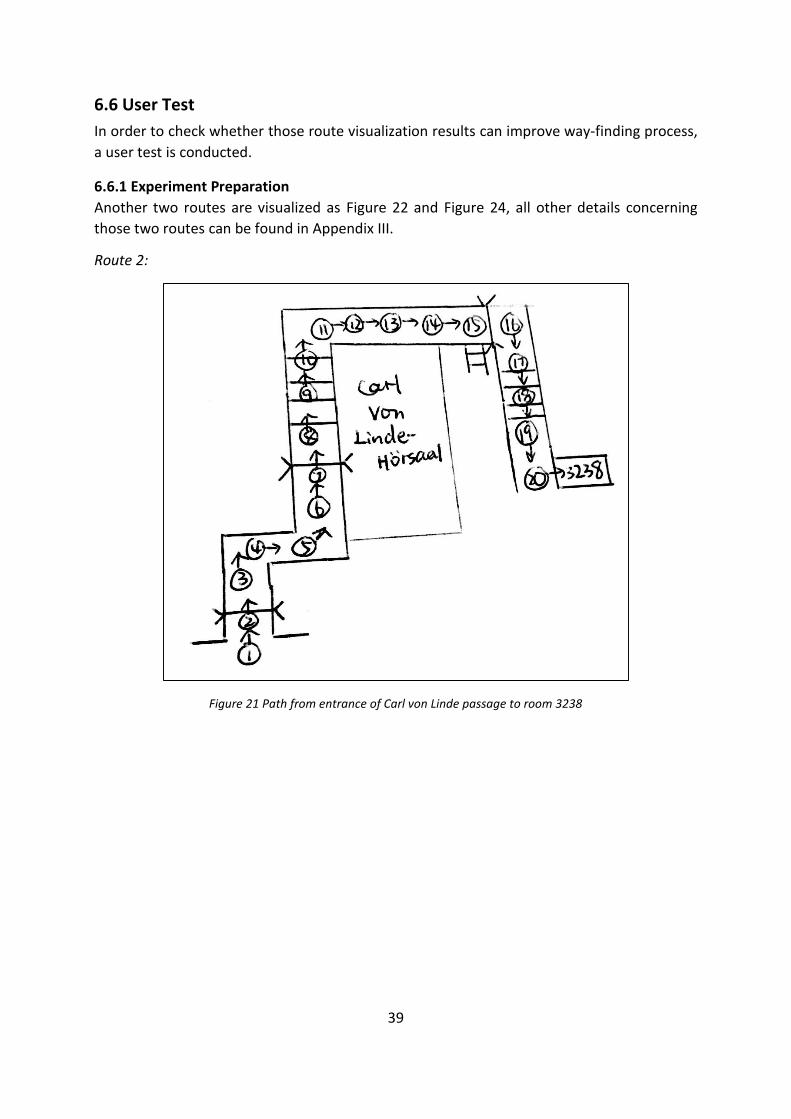
6.6 User Test
In order to check whether those route visualization results can improve way-finding process,
a user test is conducted.
6.6.1 Experiment Preparation
Another two routes are visualized as Figure 22 and Figure 24, all other details concerning
those two routes can be found in Appendix III.
Route 2:
Figure 21 Path from entrance of Carl von Linde passage to room 3238

40
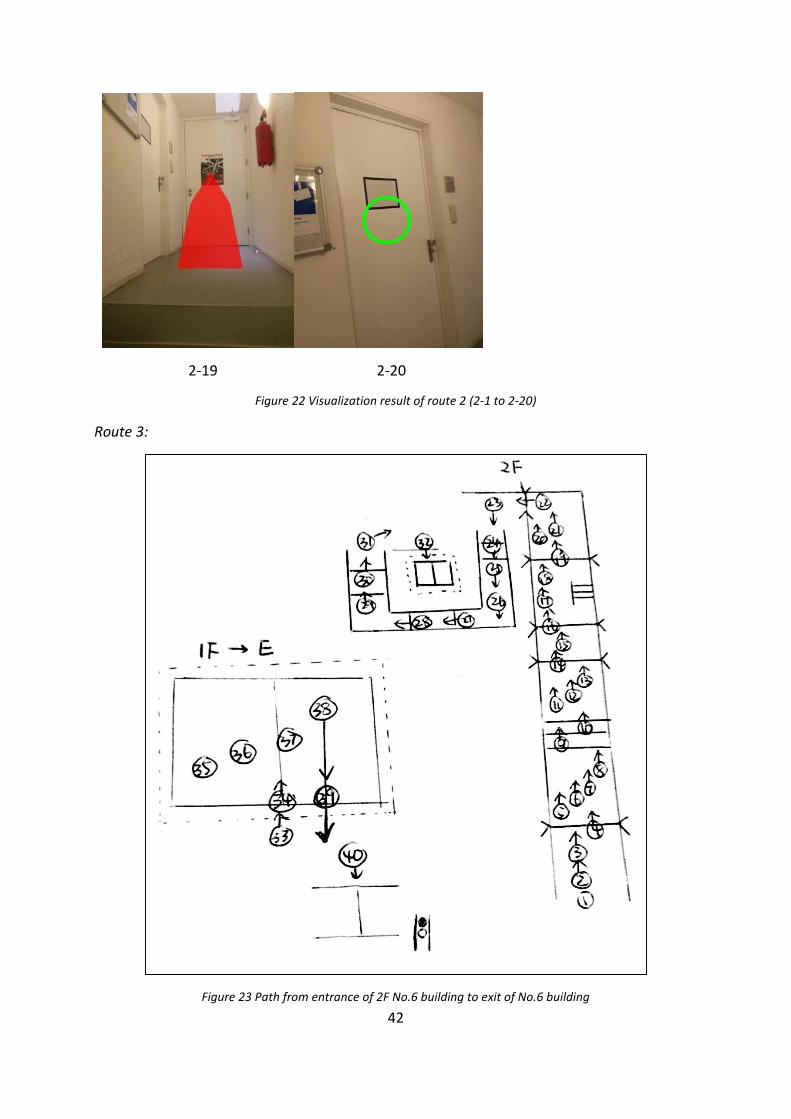
2-1 2-2 2-3
2-4 2-5 2-6
2-7 2-8 2-9

41
2-10 2-11 2-12
2-13 2-14 2-15
2-16 2-17 2-18
42
2-19 2-20
Figure 22 Visualization result of route 2 (2-1 to 2-20)
Route 3:
Figure 23 Path from entrance of 2F No.6 building to exit of No.6 building
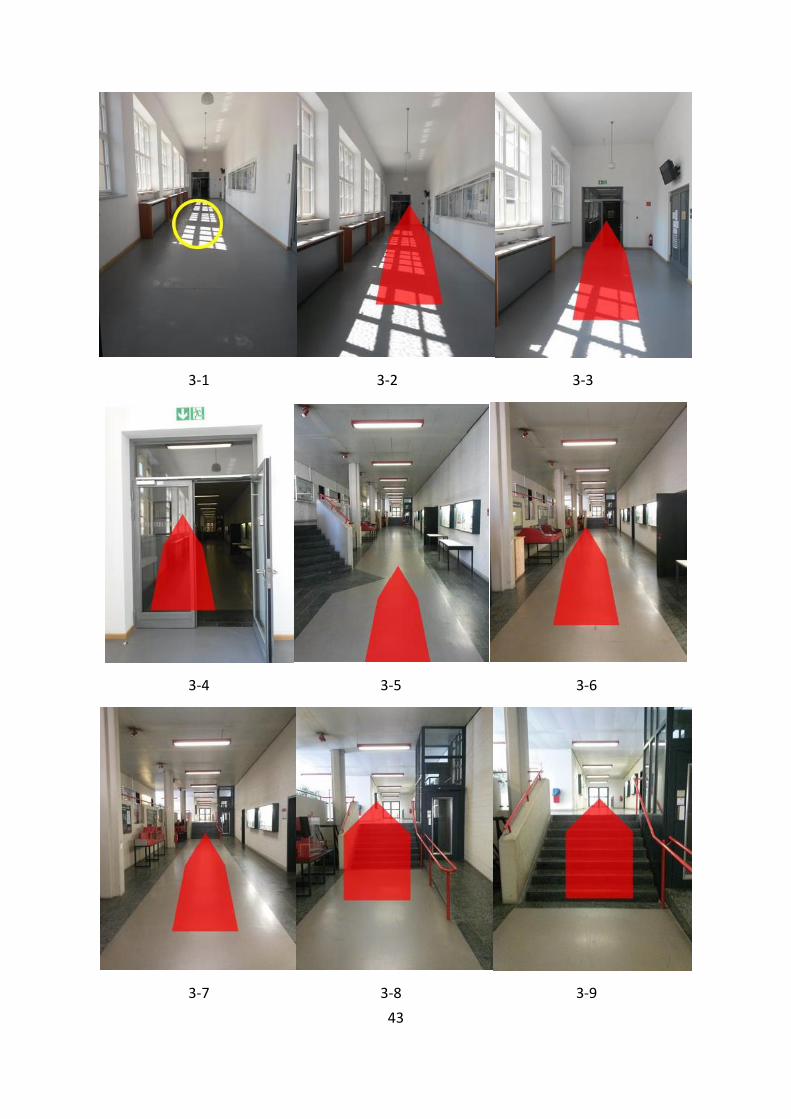
43
3-1 3-2 3-3
3-4 3-5 3-6
3-7 3-8 3-9
44
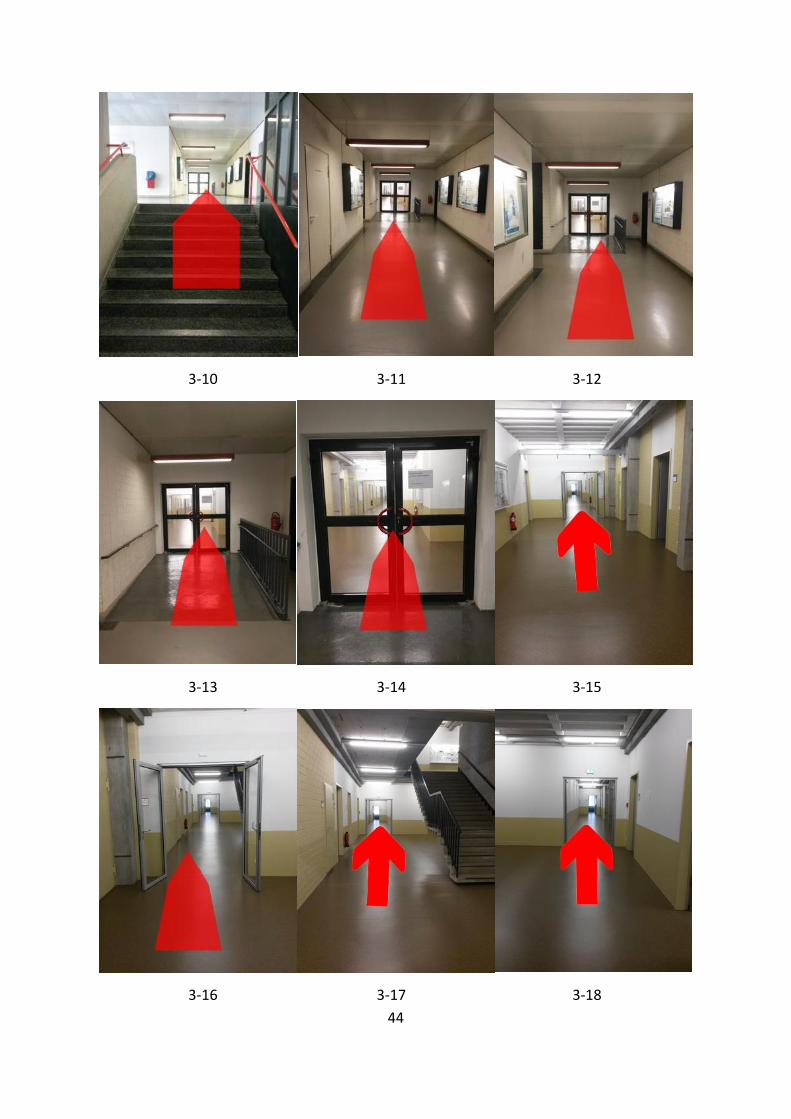
3-10 3-11 3-12
3-13 3-14 3-15
3-16 3-17 3-18

45
3-19 3-20 3-21
3-22 3-23 3-24
3-25 3-26 3-27

46
3-28 3-29 3-30
3-31 3-32 3-33
3-34 3-35 3-36
47
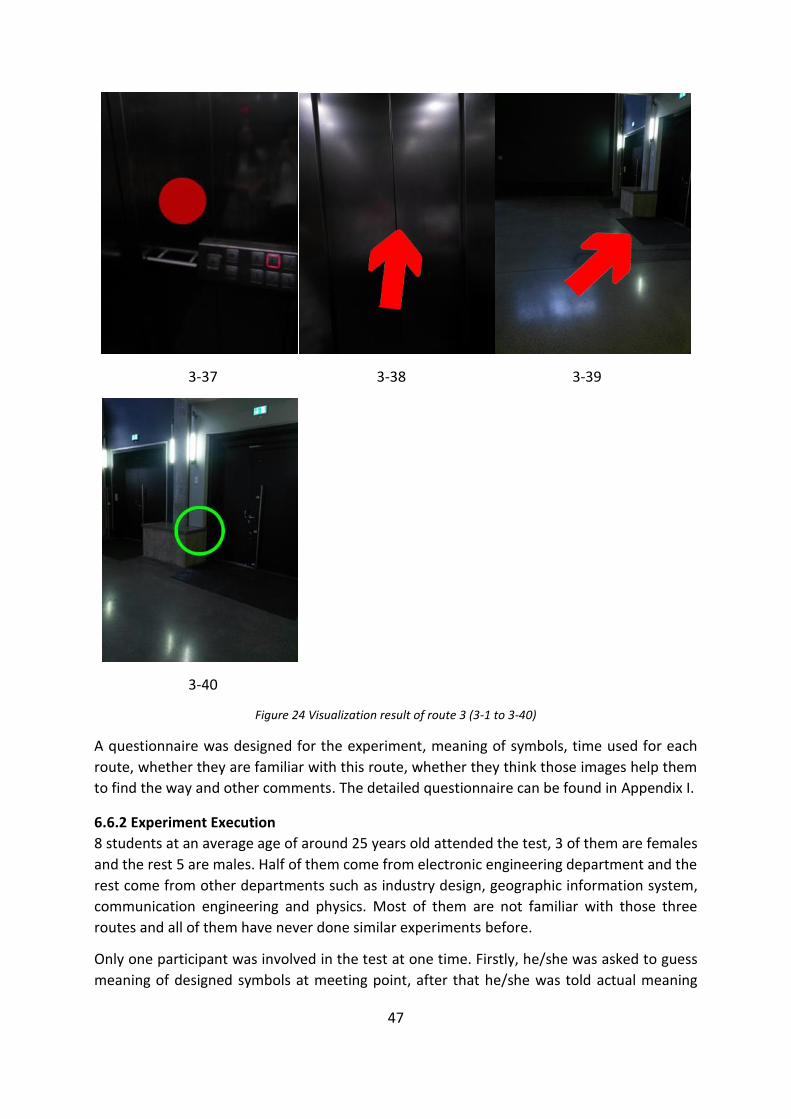
3-37 3-38 3-39
3-40
Figure 24 Visualization result of route 3 (3-1 to 3-40)
A questionnaire was designed for the experiment, meaning of symbols, time used for each
route, whether they are familiar with this route, whether they think those images help them
to find the way and other comments. The detailed questionnaire can be found in Appendix I.
6.6.2 Experiment Execution
8 students at an average age of around 25 years old attended the test, 3 of them are females
and the rest 5 are males. Half of them come from electronic engineering department and the
rest come from other departments such as industry design, geographic information system,
communication engineering and physics. Most of them are not familiar with those three
routes and all of them have never done similar experiments before.
Only one participant was involved in the test at one time. Firstly, he/she was asked to guess
meaning of designed symbols at meeting point, after that he/she was told actual meaning

48
and asked if it made sense. Secondly, his/her time used for a test route was recorded as a
baseline. Thirdly, his/her time used for each route was also recorded according to the order
of route 2-route 1-route 3. After he/she finished each route, he/she was asked whether
he/she was familiar with this route and whether he/she thought those images had helped
him/her better to find the way. Besides, his/her immediate reactions about a specific route
were also recorded. For the whole time recoding period, time recorder walked behind test
object and kept a distance in order not to disturb him/her. After he/she had finished all
routes, he/she was invited to the lab and did a small interview for questions like: How do
you feel about those visualization results? Do you think what can be improved? Do you think
it’s significant to do route visualization?
6.6.3 Result analysis
The participants in this experiment consist of 3 females and 5 males. Their answers to the
meaning of those symbols vary from each other (Table 8).
1
Most of them connect these two
symbols with traffic signals and believe
they have the same meaning with
yellow traffic light and green traffic
light. Only one of them guesses that
they are related with destination.
After explaining, one of them suggests
that green should be starting point
because green represents continuing;
another one suggests the destination
can be marked with a flag instead.
2
More than 60% guess this symbol as
“stop”, which is the exact meaning
designed for. 25% of them think this
symbol as some kind of warning or
forbidden.
3
40% of them guess this symbol as going
straight or walking on the road; 25%
think it means going upward.

49
4
All of them understand this pair of
symbol represents a contradiction, but
none of them connect those symbols
with staircase.
5
All of them understand it means turn
left or to other directions.
Table 8 Symbol guess result analysis
According to their feedback about those symbols, 25% of them regard the third and the
fourth symbol as the same; one out of eight suggests the fifth symbol is better than the third
and they both have similar meaning.
Their time used for each route is shown in Table 9. Considering different walking speed of
different people, 𝑅𝑛 is introducedas a factor to represent visualization effect.relative time
used for each route, 𝑅𝑛 is calculated as Equation 7:
𝑅𝑛 =
𝑟𝑜𝑢𝑡𝑒(𝑛)
𝑡𝑒𝑠𝑡 𝑡𝑖𝑚𝑒
(6)
Equation 7 relative time used
where route(n) is time used for each route including normal waling time plus other time
used due to perception of environment and understanding of visualization results , test time
is time used for baseline test route.

50
Table 9 Time record of each route
Figure 25 Histogram of time record of route 2
From Figure 25 we can see that for route 2, except two people have a record of more than 7
in R1, most of them remain between 3 and 4. According to questionnaire, none of them are
familiar with this route. Except those two people which have a record of more than 7 in R1,
others think those images help them better find the way. The first participant thinks most of
those images help him better find the way, except 2-15. Actually during experiment, he was
stuck in that position for nearly two minutes and had never thought that the door in image
2-15 could be opened. After continuing reminding and keeping asking:” are you sure that’s
the right way?” he finally opened that door. This situation also happened in other test
objects but not that serious. One of them was asked why he didn’t hesitate to open that
door, he answered that 2-15 is a closer look of 2-14, this tells that he should approach the
door, otherwise there should be a “turn left arrow”, instead of a “keep walking sign”. His
answer is exactly those images are telling. The third person was stuck at beginning and later
she told us that she was not good at distinguishing those images and confused with their
orders, after being explained that those images are in exact order she should follow and she
7,84
4,12
7,06
3,03 3,17
3,943,61 3,81
0,00
1,00
2,00
3,00
4,00
5,00
6,00
7,00
8,00
9,00
1 2 3 4 5 6 7 8
R2

51
should notice those images very carefully in order not to miss one of them, she performed
much better.
Figure 26 Histogram of time record of route 1
For route 1, 25% are totally unfamiliar, 50% are familiar and 25% are half familiar. From
Figure 26 we can see that there is not too much difference among the participants, except
the first and the third. They took a bit more time than others. Compared with results from
first route, it is suspected that those two people have weaker way-finding capability than
others. Anyway they all agree that those images help them better find the way in this route.
Figure 27 Histogram of time record of route 3
4,74
4,12
4,81
3,44
3,97 3,94 3,753,52
0,00
1,00
2,00
3,00
4,00
5,00
6,00
1 2 3 4 5 6 7 8
R1
8,55
7,486,84
6,49
8,498,14
6,315,87
0,00
1,00
2,00
3,00
4,00
5,00
6,00
7,00
8,00
9,00
1 2 3 4 5 6 7 8
R3

52
Route 3 is the most complicated one. Half of the participants are totally unfamiliar with this
route, two are familiar and the rest are half familiar with it. 87.5% think those images help
them better find the way. From Figure 27 we can still see a difference ranging from 5.87
seconds to 8.55 seconds. During experiment, it is noticed that most of them got stuck after
3-32 that they walked toward staircase instead of elevator. Time recorder had to keep asking
“stop and think, is this correct way?” to force them to walk back and find the elevator.
According to their feedback, those images relating to elevator are too dark, and the elevator
has no sign of going up or down, or to which floor.
In overall, they think those images are clear and suggestive, and help them greatly in finding
destination. Most of them said without those images, they had no idea how to find the
destination. Some females said they had problem in reading a map or floor plan, those
images gave them a good sense in perceiving environment and it’s easier for them to
remember where they had been to as well.
When asked if they think it’s significant to do route visualization, all of them said yes.
Especially for those image-sensitive people, route visualization with images is better and
more impressive than those without. It is also discovered that females seem to be more
image- dependent than males.
They also propose some suggestions for improvement:
1. Add an “open the door” gesture when the door is closed and people need to get through,
e.g. 2-15.
2. Change light condition of some images, e.g. 3-33 to 3-40.
3. Reduce some unnecessary images because too many similar images describing the same
scene can be confusing, e.g. 3-33 to 3-38, 3-25 and 3-26 are “repetitive”.
4. There should also be a turn-left or turn-right arrow on staircase even front-view is a dead
end, e.g. 3-25 to 3-28.
5. Up, down and “To-which-floor” sign in elevator should be highlighted, e.g. 3-33, 3-34, 3-
36.
6.7 Improvement
Some improvements are made according to feedback from user test.
1. Add sign “Open the Door” to 2-15 to remind people they should open the door in order
to go to next step.

53
2-15-1
2. Add “turn left” arrow to 3-25 and 3-27, besides, delete 3-25 and 3-28 so that people will
only see one image when walking on one staircase and will not be confused.
3-25-1 3-27-1
3. Increase illumination of those images relating to elevator so that elevator is easily
distinguished. Besides, 3-32 is replaced by 3-32-1, 3-33 is replaced by 3-33-1, 3-36 is
replaced by 3-36-1, and 3-34, 3-35, 3-37, as well as 3-38 are deleted to reduce
redundancy. In 3-33-1, downward button is emphasized by magnifying; in 3-36-1, floor
number button is also emphasized by adding an extra magnifying letter to original image.

54
3-32-1 3-33-1
3-36-1
7 Conclusion
There are several multimedia representation forms for indoor route visualization and
communication in recent studies, and photo-based visualization is getting more and more
attention. Existing photo-based indoor dataset are open to public (e.g. navvis provides
indoor photos for main campus of TUM), however, few studies are carried for exploring
systematic methods to give a full route description based only on photos. The main
challenge lies in extracting useful information from route photos and designing a good
visualization strategy. Current technologies such as computer vision can help to extract
information that is needed to describe an indoor route for people from a dataset, which is
also the core idea of this paper.

55
This paper focused on route visualization and proposed a systematic method, which is an
innovative framework extended from image schema to process similar visualization
workflow, to deal with overall process from dataset to visualization result. Firstly, the whole
route was treated as a combination of consequent separate scene photos, which are related
to what people perceive when they walk on specific route and are selected depending on
their importance that may affect decision that people might make. Secondly, previous scene
recognition method was adapted and recognition accuracy was increased by reducing
classes of final results. Accuracy of route 1 is 87%, route 2 is 85% and route 3 is 82.5%.
Thirdly, visualization strategy was made and symbols were designed basically to highlight
and point out where people should go next. Finally a user test was conducted and nearly all
test objects performed better by applying visualization strategy in this thesis, thus
effectiveness of this method was proved.
Future work includes following aspects: Firstly, understand the underlying mechanism of
machine learning method so that training algorithms for dataset can be optimized and
accuracy can be improved. Secondly, landmark extraction and recognition is also a promising
research direction as it can provide more additional information for people, which is seldom
studied in indoor navigation. In this paper, those critical structures (corridor, door, elevator,
lobby and staircase) can also be treated as landmarks, but more objects such as food
automat, WC sign and garbage box can also be important landmarks for wayfinding, and
thus should be extracted from photos. Thirdly, automatic visualization of symbols, especially
those turn-left/right arrow is challenging and need to be studied in the future in terms of
placement and direction.

56
Reference
[1] A. Oliva, A. Torralba, Modeling the shape of the scene: a holistic representation of the
spatial envelope, IJCV 2001
[2] Megha Pandey and Svetlana Lazebnik, "Scene Recognition and Iakly Supervised Object
Localization with Deformable Part-Based Models", ICCV 2011.
[3] A. Quattoni, and A.Torralba. Recognizing Indoor Scenes. IEEE Conference on Computer
Vision and Pattern Recognition (CVPR), 2009.
[4] Mandler, J. M. (1992). "How to build a baby: II. Conceptual primitives". Psychological
review 99 (4): 587–604. PMID 1454900
[5] Martin Raubal and Michael Worboys. A Formal Model of the Process of Wayfinding in
BuiltEnvironments. COSIT, 1999.
[6]LoI, David G. "Object recognition from local scale-invariant features." Computer vision,
1999. The proceedings of the seventh IEEE international conference on. Vol. 2. Ieee, 1999.
[7]Belongie, Serge, Jitendra Malik, and Jan Puzicha. "Shape matching and object recognition
using shape contexts." Pattern Analysis and Machine Intelligence, IEEE Transactions on 24.4
(2002): 509-522.
[8]Hariharan, Bharath, et al. "Simultaneous detection and segmentation." Computer Vision–
ECCV 2014. Springer International Publishing, 2014. 297-312.
[9]Jain, Ramesh, Rangachar Kasturi, and Brian G. Schunck. Machine vision. Vol. 5. New York:
McGraw-Hill, 1995.
[10]P. F. Felzenszwalb, R. B. Girshick, D. McAllester, and D. Ramanan.Object detection with
discriminatively trained part-based models.PAMI, 2010.
[11]Inig, Dirk, et al. "Using split screens to combine maps and images for pedestrian
navigation." Jmynal of Location Based Services 8.3 (2014): 179-197.
[12]Krisp, Jukka M., et al. "Visualization and Communication of Indoor Routing Information."
Progress in Location-Based Services 2014. Springer International Publishing, 2015. 33-44.
[13]Lyu, Hao, Zhonghai Yu, and Liqiu Meng. "A Computational Method for Indoor Landmark
Extraction." Progress in Location-Based Services 2014. Springer International Publishing,
2015. 45-59.
[14]Christian E. Murphy. "Concise Image Maps - A Design Approach." Doctor Dissertation.
[15]C. Siagian, L. Itti, Rapid Biologically-Inspired Scene Classification Using Features Shared
with Visual Attention, IEEE Transactions on Pattern Analysis and Machine Intelligence, Vol.
29, No. 2, pp. 300-312, Feb 2007.

57
[16]Radoczky, Verena. "How to design a pedestrian navigation system for indoor and
outdoor environments." Location based services and telecartography. Springer Berlin
Heidelberg, 2007. 301-316.
[17]Butz, Andreas, et al. "A hybrid indoor navigation system." Proceedings of the 6th
international conference on Intelligent user interfaces. ACM, 2001.
[18]Lovelace, Kristin L., Mary Hegarty, and Daniel R. Montello. "Elements of good route
directions in familiar and unfamiliar environments." Spatial information theory. Cognitive
and computational foundations of geographic information science. Springer Berlin
Heidelberg, 1999. 65-82.
[19]Heiniz, Paul, et al. "Landmark-based navigation in complex buildings." Indoor Positioning
and Indoor Navigation (IPIN), 2012 International Conference on. IEEE, 2012.
[20]Möller, Andreas, et al. "Navigating indoors using decision points." Computer Aided
Systems Theory-EUROCAST 2013. Springer Berlin Heidelberg, 2013. 450-457.
[21] Ohm, Christina, Bernd Ludwig, and Saskia Gerstmeier. "Photographs or Mobile Maps?."
[22]Ludwig, Bernd, Manuel Müller, and Christina Ohm. "Empirical Evidence for Context-
aware Interfaces to Pedestrian Navigation Systems." KI-Künstliche Intelligenz 28.4 (2014):
271-281.
[23] Fang, Zhixiang, et al. "A GIS data model for landmark-based pedestrian navigation."
International Journal of Geographical Information Science 26.5 (2012): 817-838.
[24] Russo, Davide, Sisi Zlatanova, and Eliseo Clementini. "Route directions generation using
visible landmarks." Proceedings of the Sixth ACM SIGSPATIAL International Workshop on
Indoor Spatial Awareness. ACM, 2014.
[25] R. M. Downs and D. Stea. Kognitive Karten: Die Welt in unseren Köpfen. UTB für
Wissenschaft, 1982

58
Appendix I Experiment for An image based route visualization and communication for indoor way-finding
1. Gender: ⃝ female ⃝ male
Guess the meaning of those symbols!
A.
B.
C.
D.
E.
After explaining, do you think it makes sense?
⃝ yes _________
⃝ no _________
xxxxxxxxxxxxxxxxxxxxxxxxxxxxxxxxxxxxxxxxxxxxxxxxxxxxxxxxxxxxxxxxxxxxxxxxxxxxxxxxxxxxxxxxxxxxxxx
Time used for each route:
Test Route:
Route 1:
Route 2:
Route 3:
xxxxxxxxxxxxxxxxxxxxxxxxxxxxxxxxxxxxxxxxxxxxxxxxxxxxxxxxxxxxxxxxxxxxxxxxxxxxxxxxxxxxxxxxxxxxxxx
2. Are you familiar with this route?
Route 1: ⃝ yes ⃝ no
Route 2: ⃝ yes ⃝ no
Route 3: ⃝ yes ⃝ no
3. Do you think those images help you better find the way?
Route 1: ⃝ yes ⃝ no
Route 2: ⃝ yes ⃝ no
Route 3: ⃝ yes ⃝ no
4. Comments(How do you feel about those visualization results? Do you think what can be improved?
Do you think it’s significant to do route visualization?)

59
Appendix II
View 1 View 2
View 3 View 4

60
View 5 View 6
View 7 View 8

61
View 9 View 10
View 11 View 12

62
View 13 View 14
View 15 View 16

63
View 17 View 18
View 19 View 20

64
View 21 View 22
View 23

65
Appendix III
path2: result = Columns 1 through 6 'door' 'corridor' 'corridor' 'staircase' 'elevator' 'corridor' Columns 7 through 12 'door' 'staircase' 'staircase' 'staircase' 'corridor' 'corridor' Columns 13 through 18 'corridor' 'door' 'door' 'corridor' 'staircase' 'staircase' Columns 19 through 20 'corridor' 'corridor' The mistakenly recognized rate is 15%. ans = I start from here. I see a door. I stand in the corridor. I go along the corridor. I see a staircase. I stand in the corridor. I see a door. I see a staircase. I go up the staircase. I stand in the corridor. I go along the corridor. I see a door. I go through the door. I stand in the corridor. I see a staircase. I go up the staircase. I stand in the corridor. I go along the corridor. I end here. path3: result = Columns 1 through 6 'corridor' 'corridor' 'corridor' 'door' 'corridor' 'corridor' Columns 7 through 12 'corridor' 'staircase' 'staircase' 'staircase' 'corridor' 'corridor' Columns 13 through 18 'corridor' 'door' 'corridor' 'door' 'elevator' 'staircase'

66
Columns 19 through 24 'elevator' 'corridor' 'corridor' 'door' 'corridor' 'elevator' Columns 25 through 30 'staircase' 'staircase' 'staircase' 'staircase' 'staircase' 'elevator' Columns 31 through 36 'lobby' 'lobby' 'elevator' 'elevator' 'elevator' 'elevator' Columns 37 through 40 'elevator' 'elevator' 'staircase' 'staircase' The mistakenly recognized rate is 17.5%. ans = I start from here. I stand in the corridor. I go along the corridor. I see a door. I stand in the corridor. I go along the corridor. I see a staircase. I go down the staircase. I stand in the corridor. I go along the corridor. I see a door. I stand in the corridor. I see a door. I see a staircase. I stand in the corridor. I go along the corridor. I see a door. I stand in the corridor. I see a staircase. I go down the staircase. I stand in the lobby. I stand in the lobby. I stand in the elevator. I see a staircase. I go down the staircase. I end here.

67
Appendix IV
Scene 6.3-1 Scene 6.3-2 Scene 6.3-3
'lobby ' 'door' 'corridor'
Scene 6.3-4 Scene 6.3-5 Scene 6.3-6
'corridor' 'corridor' 'corridor'

68
Scene 6.3-7 Scene 6.3-8 Scene 6.3-9
'elevator' 'staircase' 'door'
Scene 6.3-10 Scene 6.3-11 Scene 6.3-12
'door' 'corridor' 'corridor'

69
Scene 6.3-13 Scene 6.3-14 Scene 6.3-15
'corridor' 'corridor' 'staircase'
Scene 6.3-16 Scene 6.3-17 Scene 6.3-18
'staircase' 'lobby' ‘elevator'
Scene 6.3-19 Scene 6.3-20 Scene 6.3-21
'lobby’ ‘staircase' ‘staircase'
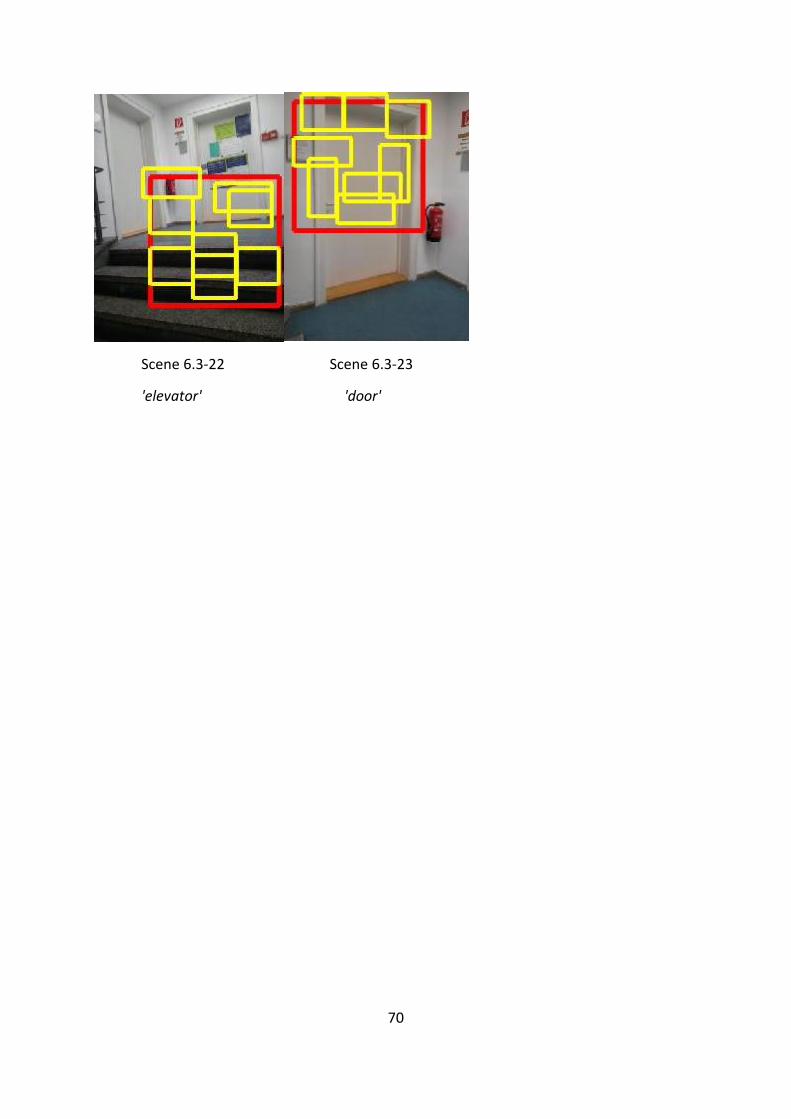
70
Scene 6.3-22 Scene 6.3-23
'elevator' 'door'