a pilot study to investigate the effects of test …
TRANSCRIPT

A PILOT STUDY TO INVESTIGATE THE EFFECTS OF TEST POSITION AND
STIMULUS TYPE ON VESTIBULAR EVOKED MYOGENIC POTENTIALS
Capstone Project
Presented in Partial Fulfillment of the Requirements for the
Doctorate of Audiology
in the Graduate School of The Ohio State University
By
KRISTI FLORES POOLE, B.A.
*****
The Ohio State University
2009
Capstone Committee: Approved By
ROBERT FOX, Ph.D., Advisor
KAMRAN BARIN, Ph.D.
JULIE HAZELBAKER, Ph.D.
_________________________________
Advisor


ii
ABSTRACT
Vestibular evoked myogenic potentials (VEMPs) are a non-invasive test of otolith
function and a portion of the descending vestibulo-spinal system. Three subjects with
normal function of the vestibular system underwent VEMP testing with 500 Hz tone
bursts and click stimuli. Response characteristics were observed in both the sitting and
supine test positions. The success rate of each stimulus in VEMP studies, the mean P1
and N1 latencies for both stimuli, the P1-N1 amplitude, the amplitude symmetry, and the
relationship between muscle activation and P1-N1 amplitude were explored in each
individual. The 500 Hz tone burst stimuli were more successful at evoking the desired
response. Subjects generated more muscle activity as measured by EMG in the supine
position than in the sitting position. Due to the small sample size, a clear relationship
between muscle activation and amplitude did not emerge.

iii
I dedicate this to my family.

iv
ACKNOWLEDGEMENTS
I would like to thank my husband for his sincere patience and support during the
completion of this project. The feedback and suggestions provided by all three
committee members were welcomed and appreciated greatly. Thanks also to Dr. Kamran
Barin, Dr. Robert Fox, and Dr. Pam Mishler for giving me their time, a most valuable
commodity.

v
VITA
14 June 1980………………………..Born – ST. LOUIS, MISSOURI
14 December 2003………………….BACHELOR OF ARTS,
Ohio State University
2005-2006…………………………..GRADUATE FELLOW
Ohio State University
2006…………………………………GRADUATE TEACHING ASSISTANT
Ohio State University
2007-2008…………………………..GRADUATE RESEARCH ASSISTANT
Ohio State University
FIELDS OF STUDY
Major Field: Audiology

vi
TABLE OF CONTENTS
Page
Abstract……………………………………………………………………………………ii
Dedication…………………………………………………...……………………………iii
Acknowledgements……………………………………………………………………….iv
Vita……………………………………………………………………………………......v
List of Tables…………………………………………………………………………….vii
List of Figures…………………………………………………………………...………viii
List of Abbreviations………………………………………………………………..……ix
Chapters
1. Introduction………………………………………………………………………..1
2. Review…………………………………………………………………………….3
2.1 Historical Perspective……………………………………………………..3
2.2 Anatomy and Physiology………………………………………………….5
2.3 Elements in the Collection Protocol………………………..……………..7
2.4 Response Features………………………………………………………..10
3. Methods…………………………………………………………………..………15
4. Results & Discussion…………………………………………………………….18
References……………………………………………………………………….……….32

vii
LIST OF TABLES
Table Page
3.1 The four test conditions included in the study…………………………...15
4.1 Number of successful trials when using click stimuli………………..….18
4.2 Table of other studies using clicks as stimuli……………………………19
4.3 Mean, standard deviation, and range for EMG levels…………………...20
4.4 Means and standard deviations for P1-N1 amplitude……….…………...21
4.5 Means and standard deviations for P1 and N1 latencies …………...…....28

viii
LIST OF FIGURES
Figure Page
1.1 Basic VEMP morphology…………………………………………….…..1
2.2 Detection of small contralateral response…….…………………….……10
4.1 Average EMG activity recorded in the two test positions……………….20
4.2 Regression analysis for EMG and amplitude for Subject 1……...………24
4.3 Regression analysis for EMG and amplitude for Subject 2…………...…25
4.4 Regression analysis for EMG and amplitude for Subject 3……...………26

ix
LIST OF ABBREVIATIONS
dBC decibels C-weighted, characterizes intensity of short-duration sound
dBnHL decibels referenced to normal hearing level
dBpeakSPL decibels referenced to peak sound pressure level
dBSPL decibels referenced to sound pressure level
EMG electromyography, electromyogram
ENG/VNG electronystagmography/videonystagmography
Hz Hertz
kHz kilohertz
µsec microsecond(s)
µV microvolt(s)
msec millisecond(s)
SCM sternocleidomastoid muscle
VEMP vestibular evoked myogenic potential

1
CHAPTER 1
INTRODUCTION
The vestibular evoked myogenic potential (VEMP) is an acoustically-evoked
muscle response generated by otolith activation. The saccule is the otolith responsible for
transducing vertical movements of the head to the central nervous system. Because the
saccule is located in the labyrinth beneath the stapes, sufficiently loud sound (105-125 dB
peakSPL) can activate the saccule through stapedial vibration. The VEMP is a short-
latency response recorded from surface electrodes placed over muscles of the neck,
appearing as a series of two to four positive and negative peaks in the first 10-50 msec
following the acoustic stimulus (Figure 1.1).
Figure 1.1 The VEMP is a muscular response evoked by sound. The first two peaks of
the waveform, P1 and N1, have been identified here.

2
The value of VEMP testing is the selective assessment of the saccule and the
integrity of its neurological connections through the inferior branch of the vestibular
nerve (Colebatch, 2001). The VEMP is attractive in several regards: it offers a non-
invasive test of otoliths, it assesses a branch of the vestibular nerve that caloric testing
does not, the equipment needed to collect VEMPs would be familiar in labs equipped for
other types of evoked potentials, and testing time is relatively brief and well tolerated by
patients.
This study was designed to gain experience with VEMP testing using two kinds
of stimuli and in two test positions. The experimental design resulted in four test
conditions, which enabled a comparison of VEMP characteristics in each condition.
3
CHAPTER 2
REVIEW
2.1 HISTORICAL PERSPECTIVE
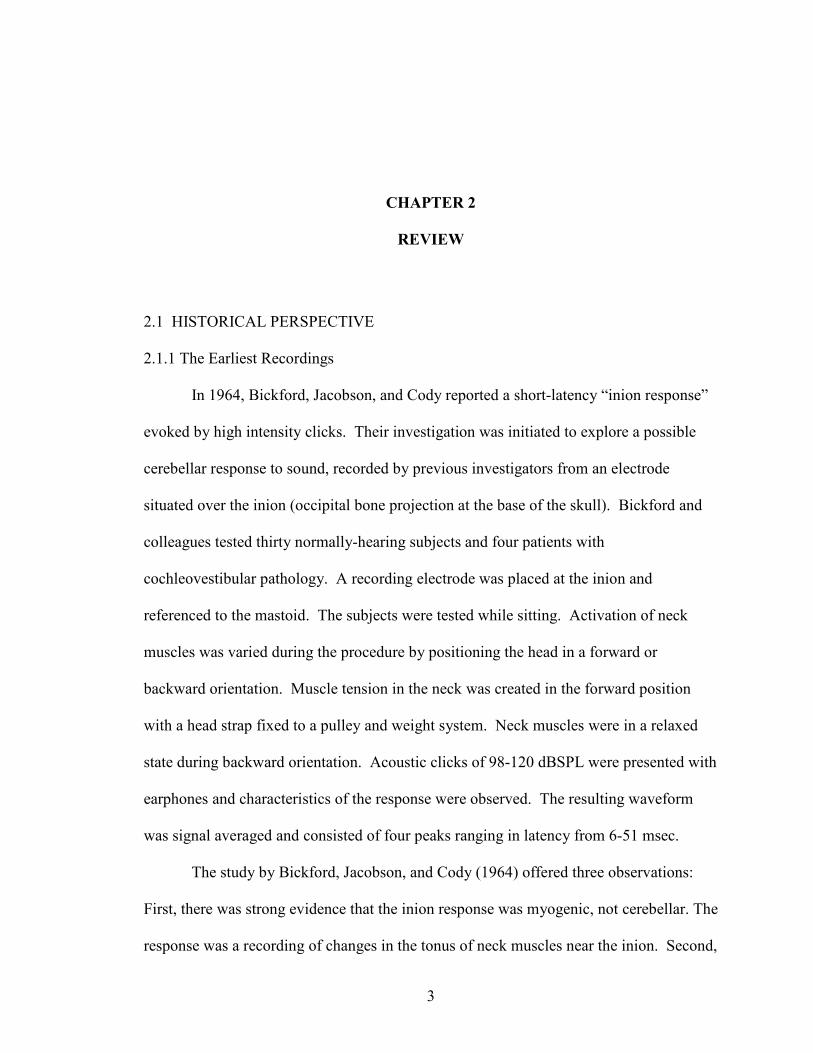
2.1.1 The Earliest Recordings
In 1964, Bickford, Jacobson, and Cody reported a short-latency “inion response”
evoked by high intensity clicks. Their investigation was initiated to explore a possible
cerebellar response to sound, recorded by previous investigators from an electrode
situated over the inion (occipital bone projection at the base of the skull). Bickford and
colleagues tested thirty normally-hearing subjects and four patients with
cochleovestibular pathology. A recording electrode was placed at the inion and
referenced to the mastoid. The subjects were tested while sitting. Activation of neck
muscles was varied during the procedure by positioning the head in a forward or
backward orientation. Muscle tension in the neck was created in the forward position
with a head strap fixed to a pulley and weight system. Neck muscles were in a relaxed
state during backward orientation. Acoustic clicks of 98-120 dBSPL were presented with
earphones and characteristics of the response were observed. The resulting waveform
was signal averaged and consisted of four peaks ranging in latency from 6-51 msec.
The study by Bickford, Jacobson, and Cody (1964) offered three observations:
First, there was strong evidence that the inion response was myogenic, not cerebellar. The
response was a recording of changes in the tonus of neck muscles near the inion. Second,

4
the amplitude of the waveform varied with the intensity of the sound stimulus. Loud
clicks resulted in waveforms with large amplitudes; lower intensity clicks resulted in
smaller amplitudes or sometimes the absence of the waveform’s earliest deflections.
Third, the response origin was localized to the vestibular system. The response was
present in subjects with sensorineural deafness, but absent in those with lesions of the
peripheral vestibular system. Despite the fact that the stimulus was acoustic, the response
did not appear to be cochlear.
2.1.2 Evolving Understanding of the Response
Colebatch and Halmagyi (1992) resumed experimentation on the acoustically-
evoked vestibular response in a case study documenting a patient before and after
unilateral vestibular neurectomy with successful hearing preservation. An acoustically-
evoked EMG response was present bilaterally before the surgical procedure. Following
right-sided vestibular neurectomy, the response was absent on the right. This study is
significant for two reasons: First, it supported previous research that localized the origin
to the peripheral vestibular system. Second, these investigators used the
sternocleidomastoid (SCM) muscles on the anterior surface of the neck as a recording site
instead of the inion and obtained an acoustically-evoked vestibular potential similar in
morphology and latency to previous studies. Subsequent investigators also using
recording electrodes on the SCM confirmed that the response is dependent on the
peripheral vestibular system and that vestibular pathology degrades or abolishes it
(Colebatch et al., 1994; Akin & Murnane, 2001; Murofushi et al., 1999).

5
As understanding of the response developed and collection procedure evolved, the
terminology changed from “inion response” to the more technically descriptive term
“vestibular evoked myogenic potential,” or VEMP.
In humans, the origin of the VEMP is often inferred non-invasively by studying
patients with known lesions of the vestibular system. Basta et al. (2005a) approached the
matter from a different perspective and directly stimulated the inferior vestibular nerve in
several patients during otoneurosurgery. An EMG response was obtained from the
sternocleidomastoid muscle ipsilateral to the side stimulated. Their work indicates that
the inferior vestibular nerve is the initial branch of the reflex, and because the inferior
branch is where saccular afferents are predominately located, it lends credence to a
saccular origin.
2.2 ANATOMY AND PHYSIOLOGY
The anatomical pathway involved in vestibular evoked myogenic potentials bears
several differences from those involved in a standard ENG/VNG test battery. Caloric
testing accesses the vestibulo-ocular reflex by way of the horizontal semicircular canal.
VEMP testing accesses parts of the vestibulo-spinal tract via the saccule. The reflex arc
from the primary saccule afferents to the ipsilateral sternocleidomastoid muscle is a
disynaptic pathway in experimental animals. Primary vestibular afferents emanating
from the saccule project to the vestibular nuclei of the brainstem via the inferior
vestibular nerve (McCue & Guinan, 1994; Murofushi et al., 1995; Murofushi &
Curthoys, 1997). From the lateral and descending vestibular nuclei, the response travels
along the ipsilateral vestibulospinal tract, to the spinal accessory nerve, and synapses on

6
the sternocleidomastoid (Murofushi et al., 1996; Kushiro et al., 1999; Uchino et al.,
1997). The neuronal transmission time required to cross this two-neuron arc is in
agreement with VEMP latencies reported clinically in humans (Murofushi et al., 1995)
and implies that the course of the human vestibulocollic reflex arc is also a short,
disynaptic pathway.
VEMP testing is typically conducted with acoustic stimuli presented by air
conduction, meaning that VEMP testing relies on a healthy middle ear system to conduct
the stimulus to the labyrinth. A conductive hearing loss can inhibit collection of VEMPs
if the stimuli are presented by air conduction. Use of a bone oscillator is indicated in
cases of conductive hearing loss and has been shown to produce a biphasic response with
peak latencies comparable to air-conduction-evoked VEMPs (Basta et al., 2005b;
Sheykholeslami et al., 2000). Bone conduction VEMPs do however have lower
thresholds than would be expected from air conduction, leading to speculation that
vibration of the skull recruits contributions from other structures, namely the utricle
(Curthoys et al., 2006).
The VEMP is tapping into the vestibulocollic reflex. The vestibulocollic reflex
works in tandem with the cervicocollic reflex to adjust and stabilize the head in space
during whole body movements. Interaction between the vestibular system and neck
muscles allows volitional adjustments that accurately oppose head displacements during
body movement, thus maintaining clear vision on a chosen target (Guitton et al., 1986;
Bronstein, 1988).

7
2.3 ELEMENTS IN THE COLLECTION PROTOCOL
2.3.1 Electromyography
Electromyography is a way to evaluate and record the electrical activity produced
by muscle cells. The VEMP waveform is a signal averaged electromyogram. Surface
electrodes are placed on the skin over the sternocleidomastoid muscle midway between
the mastoid and the sternum. Placement at the midpoint demonstrates the highest VEMP
amplitudes and the most consistent morphology (Sheykholeslami et al., 2001). These
electrodes are referenced to an electrically neutral location.
2.3.2 Muscle Activation
The response can only be detected when the neck muscles are voluntarily
activated. The VEMP is recording an IPSP (inhibitory post synaptic potential) on the
cervical musculature and unless the muscles are contracted, there is no activity to inhibit.
Methods used to activate the relevant musculature include turning the head to stretch the
neck muscle or raising the head from a supine position to contract the neck muscles. The
stretch activates the muscle unilaterally; raising the head activates both muscles
simultaneously. Based on available literature, both poses are capable of creating
effective activation of the SCM muscles for VEMP testing. Features of the VEMP are
essentially the same between the two methods except for the amplitude, which may be
larger when using the method of bilateral activation (Wang & Young, 2006; Versino et
al., 2001).

8
2.3.3 Acoustic Stimuli
Clicks and 500 Hz tone bursts are regularly available on evoked potential units
equipped to collect the auditory brainstem response. Clicks are brief pulses of broadband
energy having a short duration (approximately 50-200 µsec) and an instantaneous onset.
Tone bursts are brief stimuli that contain energy within a discrete band of
frequencies. Tone bursts are typically designed with a short-duration rise and fall time of
a few milliseconds and no plateau (or a brief plateau).
The acoustic stimuli used to evoke VEMPs are frequently calibrated in decibels of
normal hearing level (dBnHL), a unit that takes into account a normally-hearing person’s
perceptual (auditory) threshold for either click or tone burst stimuli. Because the VEMP
is a vestibular response, it is acceptable to utilize a descriptive unit not referenced to the
auditory system. Clicks and tone bursts are very short duration, only 1/1000th or 5/100
ths
of a second, respectively, and too brief to be calibrated in decibels of sound pressure level
(dBSPL). However, a comparison can still be made by matching the peak sound pressure
level of the click or tone burst to a sine wave having the same amplitude on an
oscilloscope. The matching sine wave has a known sound pressure level and the
corresponding acoustic transient can then be referenced in dB peakSPL. This unit
reflects the physical peak voltage of the stimulus.
2.3.4 Stimulus Intensity
Click intensities of 95-100 dBnHL and 500 Hz tone burst intensities of 90-100
dBnHL are adequate to evoke a VEMP in normal individuals (Zhou & Cox, 2004;
Welgampola & Colebatch, 2005). The presentation level necessary for other tone bursts

9
will vary with their center frequency, but in general, the level required becomes more
intense as the center frequency rises (Akin et al., 2003).
2.3.5 Presentation Rate
The presentation rate is 5 clicks or tone bursts per second. Slower presentation
rates do not dramatically improve the waveform morphology and quicker rates dampen
the response amplitude (Wu & Murofushi, 1999).
2.3.6 Possible Risks
Click and tone burst stimuli used in VEMP testing are presented at a high
intensity so the safety of the cochlea must be considered. The amount of damage
possible from noise exposure increases with two variables: intensity of the acoustic
stimulation and length of exposure time. Noise induced hearing loss often develops over
time through repeated exposure to occupational and recreational noise sources. The
exception to this scenario would be an incident of sufficient sound intensity to cause
instantaneous hearing loss, either temporary or permanent. The American Academy of
Audiology recognizes a level of 140 dBC peakSPL for impulsive sounds as hazardous for
any length of exposure time (AAA, 2003). The intensity of the clicks and tone bursts
used in VEMP studies are below this level, so the risk of permanent hearing loss is
remote.

10
2.4 RESPONSE FEATURES
2.4.1 Waveform Morphology
The major landmarks of the waveform are discerned from the tracing based on
polarity and absolute latency of its peaks or troughs, denoted P1 and N1. If a VEMP is
present, other characteristics such as latency and amplitude can be measured. If a VEMP
is absent, it provides meaningful information as well.
VEMPs are typically an ipsilateral response. Monaural acoustic stimulation
usually evokes the myogenic response in the ipsilateral SCM, however sometimes a
small-amplitude response of comparable latency is recorded from the contralateral side
(Figure 2.2). Absence of the small contralateral component is not considered abnormal.
Figure 2.2 A response is visible in the contralateral recording (upper tracing). Results
here were obtained in the supine position. (LI90(500)= left side of the neck, ipsilateral
recording electrode, 90 dBnHL intensity, 500 Hz tone burst stimulus; LC90(500)=
contralateral recording site)
11
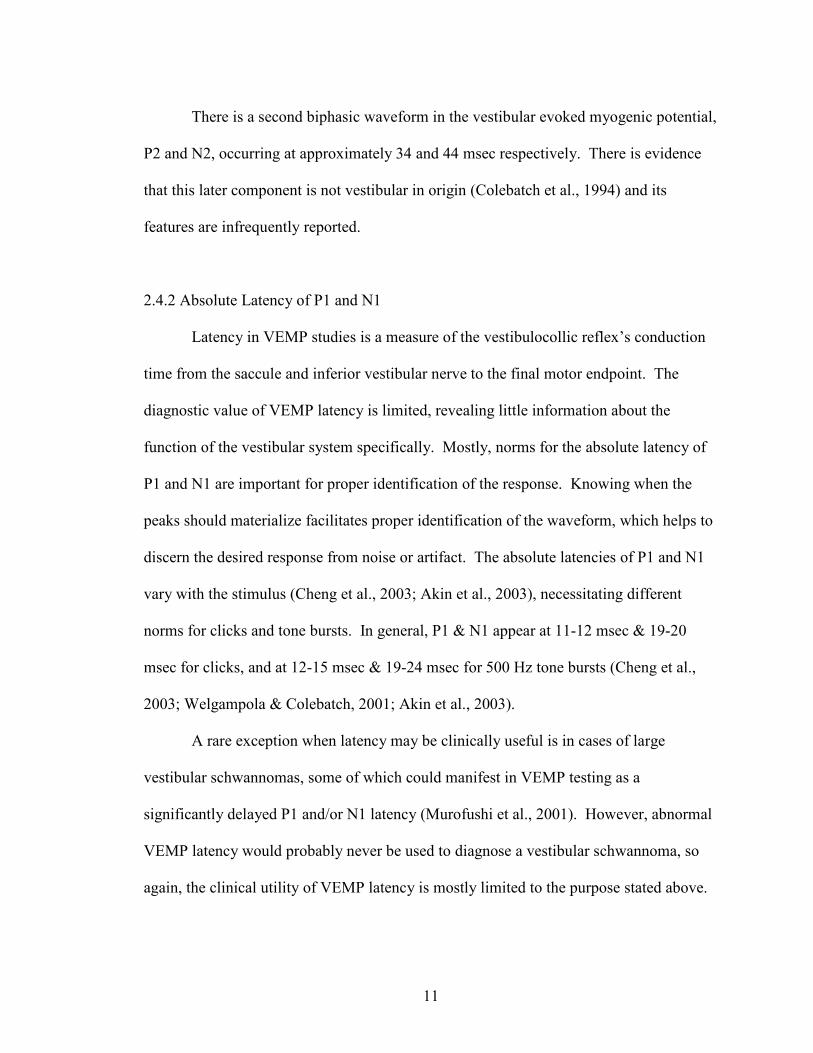
There is a second biphasic waveform in the vestibular evoked myogenic potential,
P2 and N2, occurring at approximately 34 and 44 msec respectively. There is evidence
that this later component is not vestibular in origin (Colebatch et al., 1994) and its
features are infrequently reported.
2.4.2 Absolute Latency of P1 and N1
Latency in VEMP studies is a measure of the vestibulocollic reflex’s conduction
time from the saccule and inferior vestibular nerve to the final motor endpoint. The
diagnostic value of VEMP latency is limited, revealing little information about the
function of the vestibular system specifically. Mostly, norms for the absolute latency of
P1 and N1 are important for proper identification of the response. Knowing when the
peaks should materialize facilitates proper identification of the waveform, which helps to
discern the desired response from noise or artifact. The absolute latencies of P1 and N1
vary with the stimulus (Cheng et al., 2003; Akin et al., 2003), necessitating different
norms for clicks and tone bursts. In general, P1 & N1 appear at 11-12 msec & 19-20
msec for clicks, and at 12-15 msec & 19-24 msec for 500 Hz tone bursts (Cheng et al.,
2003; Welgampola & Colebatch, 2001; Akin et al., 2003).
A rare exception when latency may be clinically useful is in cases of large
vestibular schwannomas, some of which could manifest in VEMP testing as a
significantly delayed P1 and/or N1 latency (Murofushi et al., 2001). However, abnormal
VEMP latency would probably never be used to diagnose a vestibular schwannoma, so
again, the clinical utility of VEMP latency is mostly limited to the purpose stated above.

12
2.4.3 P1 – N1 Amplitude
The amplitude of the response is usually measured from the positive peak of P1 to
the negative trough of N1. When it is abnormally low, amplitude is taken as a sign of
dysfunction in the vestibular end organ. Because amplitude seems to assess the integrity
of the saccule, pains have been taken to describe “normal” amplitude. There are however
problems impeding the creation of norms for amplitude (described below), so it is
difficult to define limits indicating abnormality. An alternative to creating norms for
amplitude is to use a measure of amplitude symmetry, much the same way caloric testing
uses one of a patient’s ears as a reference for the other. Amplitude symmetry is
reportedly quite good in normals (Akin et al., 2003; Ochi et al., 2001), so asymmetries
are very useful for detecting abnormal VEMP amplitude.
Amplitude is difficult to norm because it varies with test factors such as stimulus
intensity and stimulus frequency (for tone bursts) and it varies with patient factors like
age and amount of muscle activation (Welgampola & Colebatch, 2005). Variability
related to muscle activation can result in very large standard deviations if attempting to
norm VEMP amplitude. If norms for amplitude are desired, two methods for reducing its
range have been utilized and reported. One method is through monitoring and the other
through a mathematical correction. The monitoring methods all use some sort of visual
feedback to provide the patient with a way to maintain a relatively constant level of
background EMG activity (Vanspauwen et al., 2006; Versino et al., 2001; Akin &
Murnane, 2001). The mathematical method uses a “corrected” measure of amplitude: the
peak-to-peak amplitude of the VEMP divided by the average EMG recorded in the 20

13
msec prestimulus intervals. This corrected amplitude yields a ratio value that could
potentially minimize some individual differences.
2.4.4 Threshold
VEMP threshold is expected around 75-105 dBnHL for clicks (Colebatch et al.,
1994; Akin et al., 2003; Ochi & Ohashi, 2003) and about 75-90 dBnHL for 500 Hz tone
bursts (Akin et al., 2003).
Threshold of the VEMP is useful when it is abnormally low, a meaningful clinical
sign of superior canal dehiscence (Brantberg et al., 1999; Minor, 2005).
2.4.5 Left/Right Symmetry
Amplitude and threshold are generally very symmetric when observed in a person
with normal vestibular function (Ochi et al., 2001; Versino et al., 2001). If a significant
asymmetry in threshold or amplitude is present, it suggests that dysfunction or
hypofunction is likely present. The abnormal VEMP (i.e., absent response, atypically
low amplitude, atypically low threshold) will be ipsiliateral to the lesioned ear. Because
the VEMP has localizing power, describing symmetry is useful in the clinical setting.
Judging an asymmetry as significantly large is done by comparing a patient to
normative data. For thresholds, there is evidence that symmetry is very high, with the left
and right sides being within about 5 dB (Ochi et al., 2001).
Norms for amplitude symmetry are derived by plugging amplitude values from
the left and right ears into the following: (L-R) /(L+R). When using this formula, a
significant asymmetry has been defined as one that exceeds two standard deviations from

14
the mean of a normal population, or about 0.35 (Young et al., 2002; Murofushi et al.,
1999).
2.4.6 Tone Burst Tuning Curve
A tuning curve measures the intensity of an input necessary to evoke a desired
response as a function of frequency. In the context of VEMPs, the tuning curve graphs
the intensity of the different tone bursts that is necessary to produce a change in the firing
pattern of the saccule neurons. VEMPs evoked by tone bursts between 250 – 3200 Hz
reveal a broad, V-shaped tuning curve of the saccule having lowest threshold and highest
amplitude between 250-750 Hz (McCue & Guinan, 1994; Murofushi et al., 1999; Todd et
al., 2000; Akin et al., 2003; Rauch et al., 2004; Welgampola & Colebatch, 2001).
Due to the time required to construct a tuning curve for VEMPs, it is unlikely that
one would be part of a standard collection protocol. However, it is interesting at least to
note that the dynamics of the tuning curve appear to change in patients with
endolymphatic hydrops. There is evidence that patients with endolymphatic hydrops
either lose the specific sensitivity to stimuli between 250-750 Hz, or the tuning curve
shifts to a higher frequency (Node et al., 2005; Rauch et al., 2004).

15
CHAPTER 3
METHODS
Three subjects participated in the experiment. None had any reported history of
vertigo, hearing loss, dizziness, or any other cochleo-vestibular symptoms and normal
vestibular function was assumed. Each subject was analyzed separately for their average
EMG activity at the recording site, peak to peak VEMP amplitude, absolute latencies of P1
and N1, symmetry of EMG activity, and symmetry of P1-N1 amplitude. All were tested in
supine and sitting positions and all underwent VEMP testing with clicks and 500 Hz tone
bursts. Table 3.1 shows a grid outlining the basic format of the experiment.
500 Hz tone burst click
Sitting
Supine
Table 3.1 The four test conditions included in the study
The skin over all electrode locations was prepared using a skin peeling gel. The
electrodes used were disposable dry gel electrodes. The non-inverting electrodes were
placed symmetrically over the mid portion of the left and right sternocleidomastoid

16
muscles, the inverting electrode was placed on the upper sternum and the ground was
placed on the forehead. An additional electrode was placed immediately inferior to each
non-inverting electrode for the purpose of recording and averaging muscle activity
(EMG) during testing.
A 2-channel evoked potential unit (ICS Chartr EP 200) was used to record surface
electromyographic activity and to generate rarefaction clicks (97 dBnHL; 0.1 msec) and
500 Hz tone bursts (90 dBnHL; Blackman gated; rise/fall time, 2 msec; no plateau).
Stimuli were presented to the subject via ER-3A insert earphones. Repetition rate was
5.1 clicks or tone bursts per second. The response was filtered (1-5 kHz) and amplified
(5000x). A 20 msec delay preceded presentation of each stimulus; the recording window
totaled 100 msec in duration. One hundred fifty presentations of the stimulus were signal
averaged into a single representative waveform and graphed on a plot of time (msec) vs.
amplitude (µV). At least two trials were attempted in each test condition. A value for
EMG was generated by the software after each sequence of 150 presentations, which was
indicative of the overall average electromyographic activity of the 150 recording
windows. The order in which the two stimuli were used was random.
Muscle activation was achieved in two ways. In the supine position, the subject
was reclined in an adjustable chair and asked to raise the head against gravity while
turning the head to stretch the muscle ipsilateral to the test ear. In the sitting position, the
subject was instructed to keep their shoulders against the chair and turn the head to
stretch the neck muscle ipsilateral to the test ear. The order in which the positions were
tested was random.

17
A response was judged “present” when a biphasic waveform appeared with the
first positive peak occurring at approximately 10-15 msec, followed by a negative peak at
approximately 19-25 msec. The absolute latencies of P1 and N1 were marked, P1-N1
amplitude was calculated by the software, and the mean level of EMG was noted. A
response was judged “absent” when nothing beyond the background EMG activity could
be discerned from the tracing.
Each subject was analyzed separately. Comparative within-subject analysis of
VEMPs was accomplished by two-tailed independent samples t-tests and correlation. A
significant difference indicates p<.05. All statistical analysis was completed using the
commercial software program SPSS (version 17.0).

18
CHAPTER 4
RESULTS & DISCUSSION
4.1 RESULTS
4.1.1 Response Rate
The response rate indicates what percentage of the attempted trials resulted
successfully in eliciting the desired response. For tone bursts, the response rate was
100% for all three subjects in sitting and supine positions. The response rate for clicks
ranged from 0-75% and was 43% overall (Table 4.1).
Table 4.1 The number of successful trials when using click stimuli
Response rate for clicks was 43% overall. Independent samples t-tests indicate Subject 3
was the only to have significantly different EMG levels in trials with no response; in the
sitting position, the mean EMG activity was higher in trials without a clear response.
Response Rate (with clicks)
Subject Sitting Supine
1 1/2 2/5
2 2/4 2/4
3 0/4 3/4
19
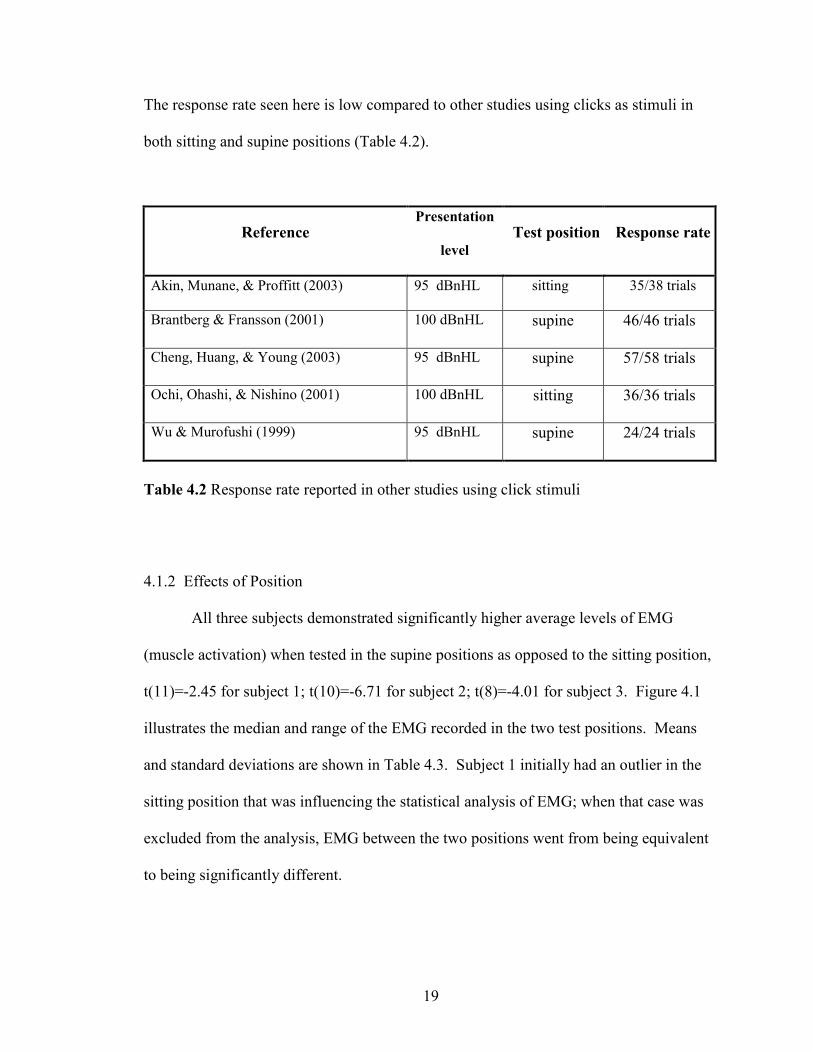
The response rate seen here is low compared to other studies using clicks as stimuli in
both sitting and supine positions (Table 4.2).
Reference Presentation
level
Test position Response rate
Akin, Munane, & Proffitt (2003) 95 dBnHL sitting 35/38 trials
Brantberg & Fransson (2001) 100 dBnHL supine 46/46 trials
Cheng, Huang, & Young (2003) 95 dBnHL supine 57/58 trials
Ochi, Ohashi, & Nishino (2001) 100 dBnHL sitting 36/36 trials
Wu & Murofushi (1999) 95 dBnHL supine 24/24 trials
Table 4.2 Response rate reported in other studies using click stimuli
4.1.2 Effects of Position
All three subjects demonstrated significantly higher average levels of EMG
(muscle activation) when tested in the supine positions as opposed to the sitting position,
t(11)=-2.45 for subject 1; t(10)=-6.71 for subject 2; t(8)=-4.01 for subject 3. Figure 4.1
illustrates the median and range of the EMG recorded in the two test positions. Means
and standard deviations are shown in Table 4.3. Subject 1 initially had an outlier in the
sitting position that was influencing the statistical analysis of EMG; when that case was
excluded from the analysis, EMG between the two positions went from being equivalent
to being significantly different.

20
Average electromyographic activity recorded in the two test positions
Figure 4.1 Medians, quartiles, and range for the EMG (muscle activity) recorded in the
two test positions are presented. The average EMG activity recorded from the SCM
during VEMP testing was different in the sitting and supine positions for Subject 2 and
Subject 3, with supine position tending towards significantly higher levels of muscle
activity. When the outlier of 191 µV was excluded from the data of Subject 1, EMG
became significantly different between positions for that subject as well.
Table 4.3 Average EMG activity and range for each subject in the two test positions
Position N (trials) Mean (µV) SD (µV)
Minimum
(µV)
Maximum
(µV)
sitting 4 111.00 18.02 90 127 Subject 1
supine 9 189.22 61.33 130 290
sitting 6 101.83 33.68 60 150 Subject 2
supine 6 233.33 34.17 184 285
sitting 4 60.50 23.36 44 95 Subject 3
supine 6 214.83 73.14 134 329
21
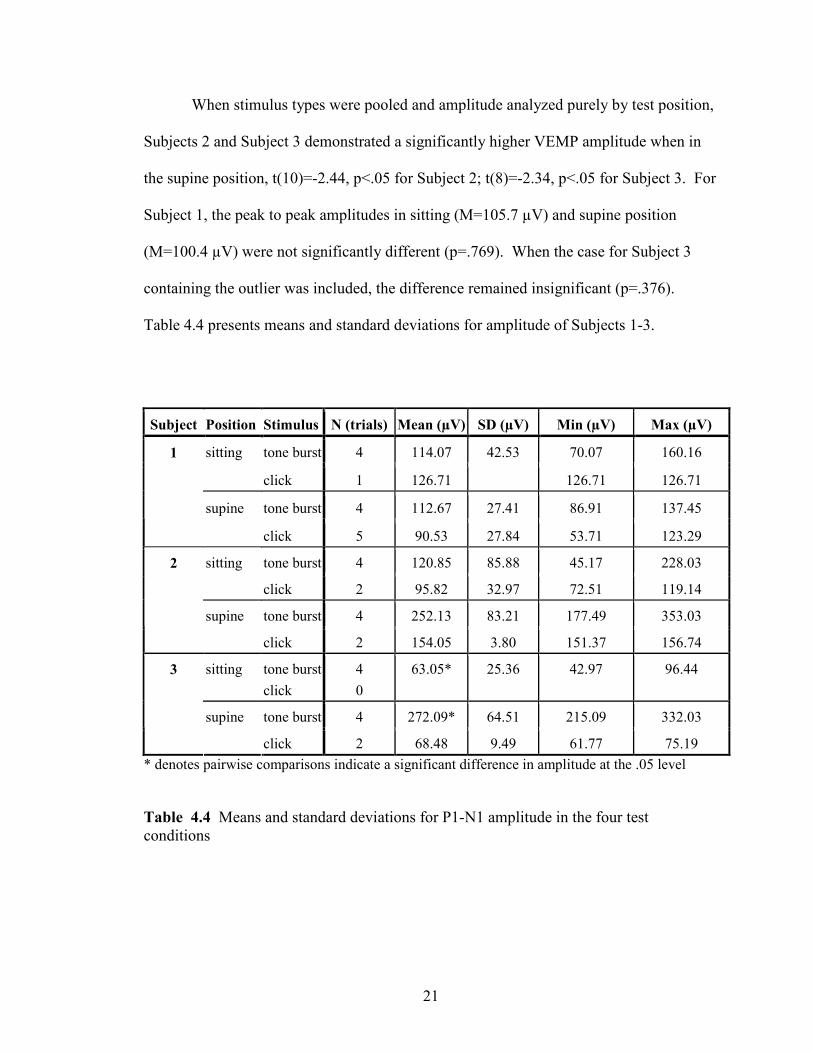
When stimulus types were pooled and amplitude analyzed purely by test position,
Subjects 2 and Subject 3 demonstrated a significantly higher VEMP amplitude when in
the supine position, t(10)=-2.44, p<.05 for Subject 2; t(8)=-2.34, p<.05 for Subject 3. For
Subject 1, the peak to peak amplitudes in sitting (M=105.7 µV) and supine position
(M=100.4 µV) were not significantly different (p=.769). When the case for Subject 3
containing the outlier was included, the difference remained insignificant (p=.376).
Table 4.4 presents means and standard deviations for amplitude of Subjects 1-3.
Subject Position Stimulus N (trials) Mean (µV) SD (µV) Min (µV) Max (µV)
tone burst 4 114.07 42.53 70.07 160.16 sitting
click 1 126.71 126.71 126.71
tone burst 4 112.67 27.41 86.91 137.45
1
supine
click 5 90.53 27.84 53.71 123.29
tone burst 4 120.85 85.88 45.17 228.03 sitting
click 2 95.82 32.97 72.51 119.14
tone burst 4 252.13 83.21 177.49 353.03
2
supine
click 2 154.05 3.80 151.37 156.74
sitting tone burst
click
4
0
63.05* 25.36 42.97 96.44
tone burst 4 272.09* 64.51 215.09 332.03
3
supine
click 2 68.48 9.49 61.77 75.19
* denotes pairwise comparisons indicate a significant difference in amplitude at the .05 level
Table 4.4 Means and standard deviations for P1-N1 amplitude in the four test
conditions

22
Independent samples t-tests of average EMG (muscle activity) in trials with and
without VEMPs were not statistically different for any of the three subjects in the supine
position, or for Subject 1 or Subject 2 in the sitting position (p>.05). Subject 3 did have
significantly different levels of background EMG in successful (M=60.5 µV) and
unsuccessful (M=103.0 µV) trials when in the sitting position.
4.1.3 Effect of Stimulus
In the previous section, stimulus types were pooled and amplitude was viewed in
the context of test position. The stimulus types were also separated from each other and
amplitude was again compared by position, e.g., click-evoked or tone-burst-evoked
VEMP amplitude compared in sitting and supine positions. The peak to peak amplitudes
were found to be statistically similar in Subject 1 and Subject 2 in both test positions
(independent samples t-tests, p>.05). For Subject 3, the stimulus did have a significant
effect on the peak to peak amplitude of the response when in the supine position,
t(4)=4.19, p<.05, which is denoted in Table 4.4. Subject 3 was the only subject to show a
significantly different peak to peak amplitude based on the stimulus used, with tone
bursts tending toward a higher VEMP amplitude than clicks. The finding of larger
amplitudes being evoked by tone bursts has been reported before in studies also using
both types of stimuli, in the sitting position (Murofushi et al., 1999) and in the supine
position (Akin et al., 2003).

23
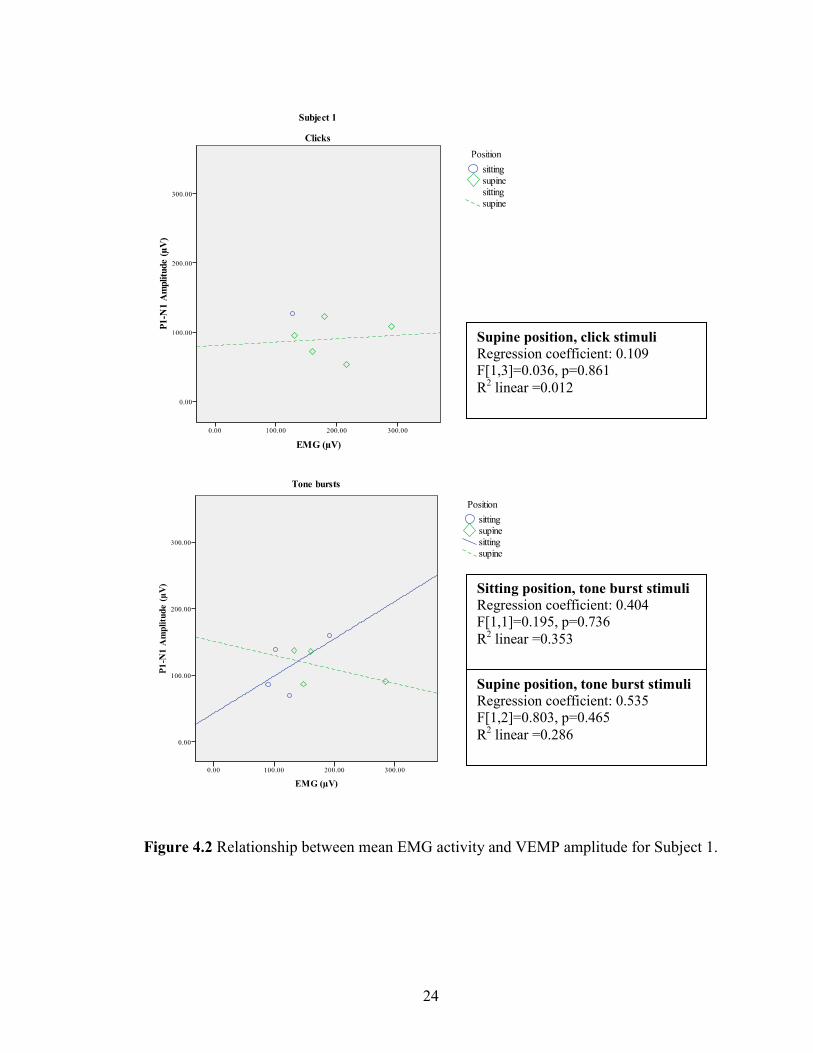
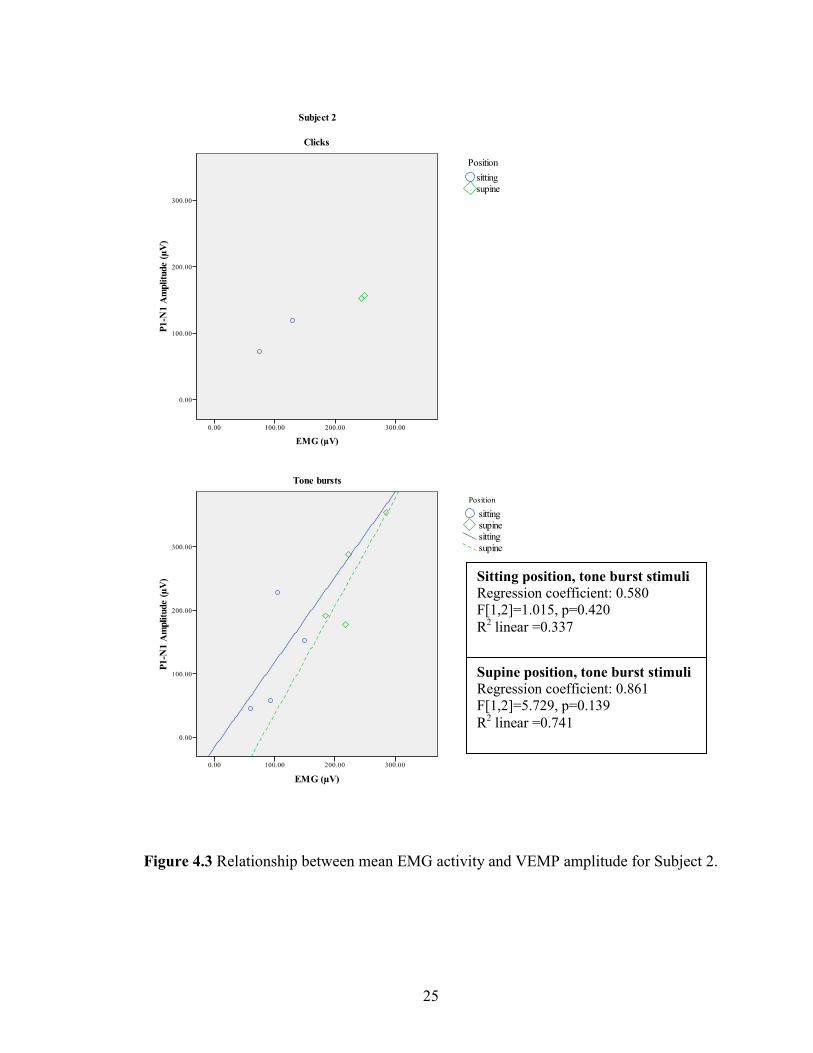
4.1.4 Effect of background EMG
Previous investigators have reported a correlation between amplitude of the
response and the level of background EMG present during testing (e.g., Lim et al., 1995;
Colebatch et al., 1994), indicating that increased levels of EMG (muscle activity) result in
increased amplitude of the VEMP. The correlation between average EMG and peak to
peak amplitude was explored in every subject but did not reveal a strong or consistent
relationship (p>.05, two tails). Figures 4.2 – 4.4 illustrate the various relationships
between the mean EMG activity and VEMP amplitude that were found in Subjects 1-3
when explored via linear regression. Correlation coefficients, analysis of regression
results and p-levels are presented with the regression lines in Figures 4.2 – 4.4 when
applicable.
24
Figure 4.2 Relationship between mean EMG activity and VEMP amplitude for Subject 1.
Supine position, click stimuli
Regression coefficient: 0.109
F[1,3]=0.036, p=0.861
R2 linear =0.012
Supine position, tone burst stimuli
Regression coefficient: 0.535
F[1,2]=0.803, p=0.465
R2 linear =0.286
Sitting position, tone burst stimuli
Regression coefficient: 0.404
F[1,1]=0.195, p=0.736
R2 linear =0.353
25
Figure 4.3 Relationship between mean EMG activity and VEMP amplitude for Subject 2.
Supine position, tone burst stimuli
Regression coefficient: 0.861
F[1,2]=5.729, p=0.139
R2 linear =0.741
Sitting position, tone burst stimuli
Regression coefficient: 0.580
F[1,2]=1.015, p=0.420
R2 linear =0.337

26
Figure 4.4 Relationship between mean EMG activity and VEMP amplitude for Subject 3.
Supine position, tone burst stimuli
Regression coefficient: 0.217
F[1,2]=0.099, p=0.783
R2 linear =0.047
Sitting position, tone burst stimuli
Regression coefficient: 0.591
F[1,2]=1.075, p=0.409
R2 linear =0.350

27
4.1.5 Symmetry
The average EMG produced by the left and right sides of each subject was
examined via independent samples t-tests. All subjects produced symmetric levels of
muscular activity in the supine position. Subject 1 and Subject 3 were also symmetric in
the sitting position; Subject 2 did show significantly asymmetric electromyographic
activity in the right (M= 128 µV) and left (M= 75.7 µV) recording sites while in the
sitting position, t(4)=3.24, p<.05.
Symmetry ratios for amplitude were calculated using the equation L-R / L+R,
where L and R denote the grand averages of peak to peak amplitude of the successful
trials from the left and right sides. Amplitude symmetry ranged from 0.01 to 0.60 (n=8,
mean ± SD = .28 ± .22). The value 0.72 (mean + 2 SD) would be the upper limit of the
normal range for the three subjects, which is higher than previous reports showing an
upper limit of about 0.35 (Young et al., 2002; Murofushi et al., 1999).
All three subjects in the present experiment produced amplitude ratios below 0.35
in the supine position. Subject 1 and Subject 3 were also below 0.35 in the sitting
position; amplitude ratio for Subject 2 in the sitting position exceeded this limit with a
value of 0.57 for tone bursts and 0.60 for clicks. Recall that Subject 2 also had
significantly asymmetric muscle activation in the sitting position.
4.1.6 Latency
Mean values for P1 and N1 latency are presented in Table 4.6. Independent
samples t-tests indicate that absolute peak latencies were not affected by the test position
(p>.05 for clicks and for tone bursts). Correlating latencies with background EMG did

28
not reveal any significant relationships (p>.05, two tails). In agreement with previous
authors, mean P1 and N1 latencies were slightly different between clicks and tone bursts,
statistically significant in some cases (denoted in Table 4.5).
Tone burst Click
Subject P1 (msec) N1 (msec) P1 (msec) N1 (msec)
Mean 15.12* 22.23* 10.22* 17.56* 1
Std. Deviation .61 1.11 1.03 1.86
Mean 14.50 22.04 11.96 19.33 2
Std. Deviation 1.33 1.26 2.19 2.02
Mean 15.65 24.35* 13.83 26.33* 3
Std. Deviation .82 1.45 2.59 .00
Mean 15.09 22.87 11.40 19.61 Total
± 2 SD 2.08 3.26 4.18 7.28
*denotes pairwise comparisons of latency between stimuli were significantly different
at the .05 level
Table 4.5 Average peak latencies and SD for clicks and tone bursts
4.2 DISCUSSION
The biggest problem encountered when reviewing the results of the present
experiment was the small sample size. The results reported here are interpreted while
mindful of this limitation.
The response rate observed in this experiment suggests that clicks were less
successful at evoking VEMPs than the 500 Hz tone bursts. Clicks had a 43% success rate
for evoking the desired response in this study, which is in contrast to the 100% success
rate achieved with 500 Hz tone bursts. Initially, the low response rate was thought to be

29
a result of insufficient muscle activation during testing or possibly from a malfunction of
the click generator. Inadequate muscle activation was ruled out after t-tests revealed no
significant difference in the EMG levels in click-evoked trials with and without a
response in two of the three subjects. A software malfunction was also reasoned to be
less likely because clicks did in fact evoke VEMPs occasionally throughout the study.
There was also no indication that the machine was poorly calibrated or the software out
of date. For some unknown reason, the tone bursts were more successful as an evoking
stimulus.
The lack of a clear and consistent relationship between EMG level and VEMP
amplitude was notable. Electromyographic activity plays an essential role in VEMP
testing since the response can not be detected from the SCM unless a background of
muscle activity is present. The work of others who have investigated the relationship
between varying degrees of muscle activation and subsequent VEMP amplitudes (e.g.,
Lim et al., 1995; Colebatch et al., 1994) indicate a positive covariation between these
features. The obtained results were much more interesting and included at least two
situations where increased EMG resulted in a decrease of VEMP amplitude. Correlation
between EMG and amplitude never reached a level of significance and the regression
analyses all had a high standard error of the estimate. In retrospect, more data points or a
larger n may have reduced the observed variability. If an attempt had been made to
create different levels of muscle activation during this study, a relationship between
amplitude and muscle activation may have become more apparent.
It was decided that amplitude would be reported for each individual subject
without any attempt to report a group mean or standard deviation. The variability of

30
VEMPs between subjects in this experiment has been observed to be high and it appears
as though it will be difficult to describe a clinical feature such as amplitude with absolute
values. More value was placed on symmetry of amplitude, comparing values obtained
from the same physical body. However symmetry also showed some interesting
variation, specifically with Subject 2, who produced different amounts of muscle activity
from the two sides of the neck even though the physical act of turning the head one way
or the other had no noticeable variation upon observation from the tester. A method for
monitoring and maintaining muscle activation at a constant level has been described (e.g.,
Akin & Murnane, 2001). The use of monitoring may have prevented the observed
difference in muscle activation.
The one finding that was consistent across all three subjects was the difference in
electromyographic activity that was obtained in the two test positions. There is certainly
strong evidence that the supine position is capable of producing greater amounts of
background EMG than the sitting position. Initially this was considered desirable
because, as noted previously, higher amounts of background EMG have been correlated
with higher VEMP amplitude. Clinically, one would want amplitude to be as high as
possible to facilitate identification, especially since merely judging the response present
or absent is sometimes the desired objective of VEMP testing. However, after examining
the relationships obtained in the subjects of this study, it is not so clear that background
EMG had a lot of influence on VEMP amplitude for these three subjects.
Future studies of VEMPs could concentrate on describing 500 Hz tone burst-
evoked VEMPs more thoroughly, perhaps expanding the experiment to include an
examination of response threshold. It would also be valuable to discover, if possible,
31
why click stimuli had such a poor rate of success at evoking VEMPs. This experiment
demonstrated high variability in several aspects of the VEMP, which was attributed in
large part to the small sample size. Future studies would be advised to have a larger n
and discover whether variability reduces or increases as a result.

32
LIST OF REFERENCES
American Academy of Audiology. (2003). Position statement on prevention of noise-
induced occupational hearing loss. Retrieved on March 18, 2008 from
http://www.audiology.org/NR/rdonlyres/99AC5AAE-21EB-44FA-A058-
10C899845FB6/0/niohlprevention.pdf
Akin, F. W. & Murnane, O. D. (2001). Vestibular evoked myogenic potentials:
Preliminary report. Journal of the American Academy of Audiology, 12(9), 445-
52.
Akin, F. W., Murnane, O. D., & Proffitt, T. M. (2003). The effects of click and tone-burst
stimulus parameters on the vestibular evoked myogenic potential (VEMP).
Journal of the American Academy of Audiology, 14(9), 500-09.
Basta, D., Todt, I., Eisenschenk, A., and Ernst, A. (2005a). Vestibular evoked myogenic
potentials induced by intraoperative electrical stimulation of the human inferior
vestibular nerve. Hearing Research, 204, 111-14.
Basta, D., Todt, I., & Ernst, A. (2005b). Normative data for P1/N1-latencies of vestibular
evoked myogenic potentials induced by air- or bone-conducted tone bursts.
Clinical Neurophysiology, 116(9), 2216-19.
Bickford, R. G., Jacobson, J. L., & Cody, D. T. (1964). Nature of average evoked
potentials to sound and other stimuli in man. Annals of the New York Academy of
Sciences, 112, 204-23.
Brantberg, K., Bergenius, J., & Tribukait, A. (1999). Vestibular-evoked myogenic
potentials in patients with dehiscence of the superior semicircular canal. Acta Oto-
Laryngologica, 119(6), 633-40.
Brantberg, K., & Fransson, P. A. (2001). Symmetry measures of vestibular evoked
myogenic potentials using objective detection criteria. Scandinavian Audiology,
30(3), 189-96.
Bronstein, A.M. (1988). Evidence for a vestibular input contributing to dynamic head
stabilization in man. Acta Oto-Larygologica, 105, 1-6.

33
Cheng, P. W., Huang, T. W., & Young, Y. H. (2003). The influence of clicks versus short
tone bursts on the vestibular evoked myogenic potentials. Ear & Hearing, 24(3),
195-97.
Colebatch, J. G. (2001). Vestibular evoked potentials. Current Opinion in Neurology,
14(1), 21-26.
Colebatch, J. G. & Halmagyi, G. M. (1992). Vestibular evoked potentials in human neck
muscles before and after unilateral vestibular deafferentation. Neurology, 42(8),
1635-36.
Colebatch, J. G., Halmagyi, G. M., & Skuse, N. F. (1994). Myogenic potentials generated
by a click-evoked vestibulocollic reflex. Journal of Neurology, Neurosurgery, and
Psychiatry, 57(2), 190-97.
Curthoys, I. S., Kim, J., McPhedran, S. K., & Camp, A. J. (2006). Bone conducted
vibration selectively activates irregular primary otolithic vestibular neurons in the
guinea pig. Experimental Brain Research, 175(2), 256-67.
Guitton, D., Kearney, R.E., Wereley, N., & Peterson, B.W. (1986). Visual, vestibular and
voluntary contributions to human head stabilization. Experimental Brain
Research, 64, 59-69.
Kushiro, K., Zakir, M., Ogawa, Y., Sato, H., & Uchino, Y. (1999). Saccular and utricular
inputs to sternocleidomastoid motoneurons of decerebrate cats. Experimental
Brain Research, 126(3), 410-16.
Lim, C. L., Clouston, P., Sheean, G., & Yiannikas, C. (1995). The influence of voluntary
EMG activity and click intensity on the vestibular click evoked myogenic
potential. Muscle & Nerve, 18(10), 1210-13.
McCue, M. P. & Guinan, J. J. (1994). Acoustically responsive fibers in the vestibular
nerve of the cat. The Journal of Neuroscience, 14(10), 6058-70.
Minor, L.B. (2005). Clinical manifestations of superior semicircular canal dehiscence.
The Laryngoscope, 115(10), 1717-27.
Murofushi, T. & Curthoys, I. S. (1997). Physiological and anatomical study of click-
sensitive primary vestibular afferents in the guinea pig. Acta Oto-Laryngologica,
117(1), 66-72.
Murofushi, T., Curthoys, I. S., & Gilchrist, D. P. (1996). Response of guinea pig
vestibular nucleus neurons to clicks. Experimental Brain Research, 111(1), 149-
52.

34
Murofushi, T., Curthoys, I. S., Topple, A. N., Colebatch, J. G., & Halmagyi, G. M.
(1995). Responses of guinea pig primary vestibular neurons to clicks.
Experimental Brain Research, 103(1), 174-78.
Murofushi, T., Matsuzaki, M., & Wu, C. H. (1999). Short tone burst-evoked myogenic
potentials on the sternocleidomastoid muscle: Are these potentials also of
vestibular origin? Archives of Otolaryngology—Head & Neck Surgery, 125(6),
660-64.
Murofushi, T., Shimizu, K., Takegoshi, H., & Cheng, P. W. (2001). Diagnostic value of
prolonged latencies in the vestibular evoked myogenic potential. Archives of
Otolaryngology--Head & Neck Surgery, 127(9), 1069-72.
Node, M., Seo, T., Miyamoto, A., Adachi, A., Hashimoto, M., & Sakagami, M. (2005).
Frequency dynamics shift of vestibular evoked myogenic potentials in patients
with endolymphatic hydrops. Otology & Neurotology, 26, 1208-13.
Ochi, K. & Ohashi, T. (2003). Age-related changes in the vestibular-evoked myogenic
potentials. Otolaryngology-Head and Neck, 129(6), 655-59.
Ochi, K., Ohashi, T., & Nishino, H. (2001). Variance of vestibular-evoked myogenic
potentials. The Laryngoscope, 111(3), 522-27.
Rauch, S. D., Zhou, G., Kujawa, S. G., Guinan, J. J., & Herrmann, B. S. (2004).
Vestibular evoked myogenic potentials show altered tuning in patients with
Meniere's disease. Otology & Neurotology, 25(3), 333-38.
Sheykholeslami, K., Murofushi, T., & Kaga, K. (2001). The effect of sternocleidomastoid
electrode location on vestibular evoked myogenic potential. Auris, Nasus, Larynx,
28(1), 41-43.
Sheykholeslami, K., Murofushi, T., Kermany, M. H., & Kaga, K. (2000). Bone-
conducted evoked myogenic potentials from the sternocleidomastoid muscle. Acta
Oto-Laryngologica, 120(6), 731-34.
Todd, N. P., Cody, F. W., & Banks, J. R. (2000). A saccular origin of frequency tuning in
myogenic vestibular evoked potentials?: Implications for human responses to loud
sounds. Hearing Research, 141(1-2), 180-88.
Townsend, G. L. & Cody, D. T. (1971). The averaged inion response evoked by acoustic
stimulation: Its relation to the saccule. The Annals of Otology, Rhinology, and
Laryngology, 80(1), 121-131.
Uchino, Y., Sato, H., Sasaki, M., Imagawa, M., Ikegami, H., Isu, N., et al. (1997).
Sacculocollic reflex arcs in cats. Journal of Neurophysiology, 77(6), 3003-12.

35
Vanspauwen, R., Wuyts, F.L., & Van de Heyning, P.H. (2006). Improving vestibular
evoked myogenic potential reliability by using a blood pressure manometer. The
Laryngoscope, 116, 131-35.
Versino, M., Colnaghi, S., Callieco, R., & Cosi, V. (2001). Vestibular evoked myogenic
potentials: Test-retest reliability. Functional Neurology, 16(4), 299-309.
Wang, C. T. & Young, Y. H. (2006). Comparison of the head elevation versus rotation
methods in eliciting vestibular evoked myogenic potentials. Ear & Hearing,
27(4), 376-81.
Welgampola, M. S. & Colebatch, J. G. (2001). Characteristics of tone burst-evoked
myogenic potentials in the sternocleidomastoid muscles. Otology & Neurotology,
22, 796-802.
Welgampola, M. S. & Colebatch, J. G. (2005). Characteristics and clinical applications of
vestibular-evoked myogenic potentials. Neurology, 64(10), 1682-1688.
Wu, C. H., & Murofushi, T. (1999). The effect of click repetition rate on vestibular
evoked myogenic potential. Acta Oto-Laryngologica, 119(1), 29-32.
Young, Y. H., Wu, C. C., & Wu, C. H. (2002). Augmentation of vestibular evoked
myogenic potentials: An indication for distended saccular hydrops. The
Laryngoscope, 112(3), 509-12.
Zhou, G. & Cox, L. C. (2004). Vestibular evoked myogenic potentials: History and
overview. American Journal of Audiology, 13(2), 135-143.