a policymaker's guide to scaling home energy … policymaker’s guide to scaling home energy...
TRANSCRIPT
A Policymaker’s Guide to Scaling Home Energy Upgrades Residential Retrofits Working Group September 2015
The State and Local Energy Efficiency Action Network is a state and local effort facilitated by the federal government that helps states, utilities, and other local stakeholders take energy efficiency to
scale and achieve all cost-effective energy efficiency by 2020.
Learn more at www.seeaction.energy.gov
DOE/EE-1271

ii www.seeaction.energy.gov September 2015
A Policymaker’s Guide to Scaling Home Energy Upgrades was developed as a product of the State and Local Energy Efficiency Action Network (SEE Action), facilitated by the U.S. Department of Energy/U.S. Environmental Protection Agency. Content does not imply an endorsement by the individuals or organizations that are part of SEE Action working groups, or reflect the views, policies, or otherwise of the federal government.
This document was final as of Sept. 30, 2015.
If this document is referenced, it should be cited as:
State and Local Energy Efficiency Action Network. (2015). A Policymaker’s Guide to Scaling Home Energy Upgrades. Prepared by Robin LeBaron and Kara Saul-Rinaldi of the Home Performance Coalition.
FOR MORE INFORMATION
Regarding A Policymaker’s Guide to Scaling Home Energy Upgrades please contact:
Steve Dunn Chandler von Schrader U.S. Department of Energy U.S. Environmental Protection Agency [email protected] [email protected]
Regarding the State and Local Energy Efficiency Action Network, please contact:
Johanna Zetterberg U.S. Department of Energy

September 2015 www.seeaction.energy.gov iii
Acknowledgments
A Policymaker’s Guide to Scaling Home Energy Upgrades is a product of the State and Local Energy Efficiency Action Network’s Residential Retrofit Working Group. This document was developed under the guidance of and with input from the working group. The guide does not necessarily represent an endorsement by the individuals or organizations of the working group members. This guide is a product of SEE Action and does not necessarily reflect the views or policies of the federal government.
The Residential Retrofit Working Group co-chairs during the development of this guide were Frank J. Murray, formerly of the New York State Energy Research and Development Authority, and Susan Ackerman of the Oregon Public Utility Commission. The federal staff leads for the working group are Steve Dunn, U.S. Department of Energy, and Chandler VonSchrader, U.S. Environmental Protection Agency.
This guide was prepared by Robin LeBaron and Kara Saul-Rinaldi Home Performance Coalition, under contract to the U.S. Department of Energy. Matt Mitchell, Eastern Research Group, Inc. edited the report.
The authors are grateful to the following members of the Residential Retrofit Working Group and other technical experts for reviewing the guide, in part or in full:
Matthew Brown, Harcourt, Brown & Carey
Rachel Cluett, American Council for an Energy-Efficient Economy
Steve Dunn, U.S. Department of Energy
Dale Hoffmeyer, U.S. Department of Energy
Jennifer Kallay, Synapse Energy Economics
Mike Li, U.S. Department of Energy
Maggie Molina, American Council for an Energy-Efficient Economy
Katrina Pielli, U.S. Department of Energy
Rich Sedano, Regulatory Assistance Project
Cliff Staton, Renew Financial
Laura Stukel, Elevate Energy
Chandler Von Schrader, U.S. Environmental Protection Agency
Johanna Zetterberg, U.S. Department of Energy
The authors also gratefully acknowledge the following experts for generously sharing their knowledge about energy efficiency-related policies with the authors during the research process:
Sandy Adomatis, Adomatis Appraisal Service
Jared Asch, National Strategies
Pamela Brookstein, Elevate Energy
Steve Cowell, E4TheFuture
Cisco DeVries, Renew Financial
Craig Foley, RE/MAX Leading Edge

iv www.seeaction.energy.gov September 2015
Rick Gerardi, New Dawn Concept LLC
Joan Glickman, DOE
Matt Golden, Open Energy Efficiency
Karen Hamilton, New York State Energy Research and Development Authority
David Heslam, Earth Advantage
Damian Hodkinson, True Energy Solutions
Kelsey Horton, Midwest Energy Efficiency Alliance
Gannat Khowailed, SRA International
Emily Levin, Vermont Energy Investment Corporation
Anthony Roy, Earth Advantage
Peter Rusin, Colorado Energy Office
It should be noted that none of experts listed above are in any way responsible for any errors that may be found in the document.

September 2015 www.seeaction.energy.gov v
Contents
Acknowledgments ................................................................................................................................................ iii
Executive Summary.............................................................................................................................................. vii Incentives and Financing ................................................................................................................................... viii Making the Value of Energy Efficiency Visible in the Real Estate Transaction ................................................... ix Data Access and Standardization ......................................................................................................................... x Supporting Utility System Procurement of Energy Efficiency ............................................................................. xi Implementation Considerations ....................................................................................................................... xiii
Introduction .................................................................................................................................................. 1 1.1.1. Purpose and Content of this Guide ............................................................................................................ 1 1.2. Addressing Market barriers through Policy Initiatives ............................................................................... 2 1.3. Policy Implementation ................................................................................................................................ 6 1.4. How to Use this Guide ................................................................................................................................ 8
Lowering Upfront Costs through Incentives and Financing............................................................................ 9 2.
2.1. Incentives: Tax Policies ............................................................................................................................... 9 2.2. Incentives: Rebates ................................................................................................................................... 11 2.3. Financing ................................................................................................................................................... 12 2.4. Getting Started ......................................................................................................................................... 22 2.5. Additional Information and Resources ..................................................................................................... 23
Making the Value of Energy Efficiency Visible in the Real Estate Transaction ............................................. 25 3.3.1. Overview ................................................................................................................................................... 25 3.2. Home Energy Labeling and Disclosure ...................................................................................................... 26 3.3. Integration with the Real Estate Market .................................................................................................. 33 3.4. New Trends and Recommendations ......................................................................................................... 38 3.5. Recommendations .................................................................................................................................... 39 3.6. Reference Materials ................................................................................................................................. 40
The Case for Energy Data: Driving Home Performance with Standards and Access ..................................... 44 4.4.1. Introduction .............................................................................................................................................. 44 4.2. Access to Energy Data .............................................................................................................................. 45 4.3. Data Standardization ................................................................................................................................ 50 4.4. The Data Use-Case: Evaluation, Measurement, and Verification ............................................................. 54 4.5. Conclusion ................................................................................................................................................ 57 4.6. Additional Information and Resources ..................................................................................................... 57
Utility System Opportunities and Challenges .............................................................................................. 58 5.5.1. Introduction .............................................................................................................................................. 58 5.2. Energy Efficiency Resource Standards ...................................................................................................... 58 5.3. Solving the Throughput Incentive and Utility Incentives .......................................................................... 61 5.4. Cost-Effectiveness Testing ........................................................................................................................ 66 5.5. Recommendations .................................................................................................................................... 77 5.6. Additional Information and Resources ..................................................................................................... 77
Conclusion .................................................................................................................................................. 78 6.6.1. Lowering Upfront Costs through Incentives and Financing ...................................................................... 78 6.2. Making the Value of Energy Efficiency Visible in the Real Estate Transaction ......................................... 78

vi www.seeaction.energy.gov September 2015
6.3. The Case for Energy Data Driving Home Performance with Standards and Access ................................. 79 6.4. Utility System Opportunities and Challenges ........................................................................................... 79 6.5. Keys to Successful Implementation .......................................................................................................... 80 6.6. Towards the Future .................................................................................................................................. 81
Bibliography ................................................................................................................................................ 82 7.
Appendix A .......................................................................................................................................................... 89

September 2015 www.seeaction.energy.gov vii
Executive Summary
There has never been a better time to launch initiatives to promote residential energy efficiency savings. Over the past several decades, residential retrofit programs have demonstrated that energy efficiency measures contribute to achieving multiple benefits, including but not limited to reductions in home energy consumption, stabilization improvements for the grid by shaving peak loads, saving consumers millions on utility bills, and significantly reducing carbon emissions. Although a number of barriers to widespread uptake of home energy upgrades persist, the lessons learned as a result of the 2009 stimulus funding
1 have resulted
in a set of policy approaches that create new strategies for taking residential energy efficiency to scale.2 The
identification of these approaches is well timed; energy efficiency is often the least expensive and most cost effective way to comply with a variety of federal, state and local policies.
This Guide is designed to help state and local policymakers to take full advantage of new policy developments by providing them with a comprehensive set of tools to support launching or accelerating residential energy efficiency programs. It is written primarily for state and local policymakers, including state and local executives, legislators, public utility commissioners, and the staff who advise them.
The Guide focuses on four categories of policies that have proven particularly effective in providing a framework within which residential energy efficiency programs can thrive:
Incentives and financing
Making the value of energy efficiency visible in the real estate market
Data access and standardization
Supporting utility system procurement of energy efficiency
These policies are designed to overcome barriers in both the consumer and utility markets. In the consumer market, policies address:
Challenges related to the quantification of savings
Insufficiently compelling value proposition
High first costs
Contractor delivery system challenges
And in the utility system markets, policies address:
Non-alignment between utility incentives and energy efficiency
Design of cost-effectiveness tests that systematically undervalues energy efficiency
The policies outlined in the following sections are discussed in greater detail in the Guide, which looks at policy goals, indicators of success, implementation history, design considerations and recommendations that support effective policy design and implementation. The Guide also provides information about additional
1 The American Recovery and Reinvestment Act of 2009, or ARRA (Public Law 111–5) was an economic stimulus package signed into law by President Obama that provided the states with billions of dollars in economic recovery funds for a range of uses, including investment in energy efficiency measures and programs.
2 LeBaron, R and Saul-Rinaldi, K. “Bringing On The Boom and Beating the Bust,” NHPC, April 2014 http://www.homeperformance.org/sites/default/files/nhpc_white-paper-bringing-on-the-boom_20130430.pdf.

viii www.seeaction.energy.gov September 2015
resources and reading materials for policymakers seeking specific state and local examples, or to research a particular issue in greater depth.
Incentives and Financing
Addressing the upfront costs of energy efficiency upgrades to homeowners is one of the most significant ways in which policymakers can drive residential energy efficiency. Although homeowners can expect to see bill savings from energy upgrades, these savings are realized over time, while the contractor who made the improvements must be paid immediately. This upfront cost represents a significant financial investment, and consequently serves as a significant deterrent for many homeowners who might otherwise be interested in upgrading their homes.
Policymakers have two broad strategies for helping homeowners manage these upfront costs:
Incentives, in the form of tax credits and/or rebates; and,
Financing, including traditional consumer loans as well as more innovative forms of financing and repayment, such as on-bill programs and Property Assessed Clean Energy (PACE) programs.
Incentives, typically in the form of tax credits or rebates for energy efficiency measures or whole-house upgrades, are a very common policy option to encourage homeowners to undertake energy efficiency measures. Rebates can be designed in a range of ways to support specific policy goals. The amount of the rebate is a crucial consideration, as size of the rebate may affect the consumer’s interest and willingness to move from only completing an energy efficiency audit to undertaking a full energy efficiency upgrade project. Tax incentives intended to promote energy efficiency can also be relatively straightforward to design. Many states have enacted laws that provide homeowners who make their homes more efficient with a personal tax credit; others have enacted temporary or permanent sales tax holidays on high-efficiency products.
State and municipal policies may promote residential energy efficiency through the provision of consumer finance, enabling homeowners who do not have access to traditional credit, or can only access credit at a high cost, to afford efficiency improvements.
On-bill programs allow homeowners to pay off an energy efficiency loan through their utility bill. Now offered in 25 states, these programs feature a number of different designs, which can be:
Funded by public, ratepayer, or private capital.
Unsecured or attached as a tariff to the meter.
Serviced by the utility or by a third party where failure to pay may or may not result in meter shut-off.
PACE programs provide another innovative way to finance energy improvements through a voluntary tax assessment. The assessment, which is used to pay for improvements up front, is attached to the property tax bill as a lien and is repaid over time.
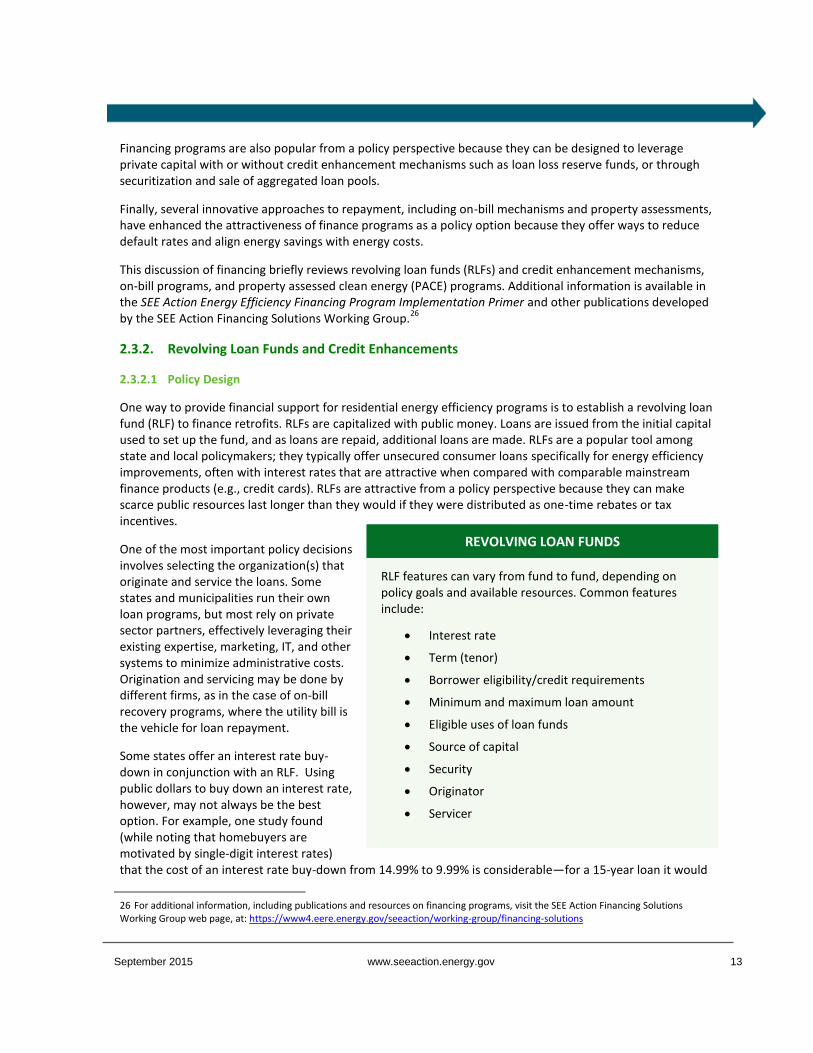
RESIDENTIAL ENERGY EFFICIENCY FINANCING PROGRAM DESIGN CONSIDERATIONS
While legislative or regulatory action will be a prerequisite for providing financial support to home owners for home energy upgrades, it is crucial to know the goals of the policy, socioeconomics of the target homeowners, and contractor availability and interest in order to determine which mechanisms will best drive energy savings. A well-planned financing policy, coupled where possible with targeted incentives, can provide important energy savings.

September 2015 www.seeaction.energy.gov ix
Loan funds have been a popular policy option because the funds are replenished as loans are repaid; which can allow scarce public resources to last longer than if they were given away as rebates or tax incentives. The cost of buying down interest rates to affordable levels can be expensive, however. Loan loss reserves (LLR), which lower the risk to a private lender, or lenders, by creating a fund that will make them whole in the event of a default (under certain conditions) is an alternative to a loan fund, in that an LLR can both leverage private capital and reduce the cost of borrowing. However, while an LLR may be a less expensive way to achieve a given interest rate than a buy-down creation of a loan fund, this is not always the case.
Securitization of energy efficiency funds, such as the national Warehouse for Energy Efficiency Loans (WHEEL) program administered by Renew Financial, offers a way to leverage private capital for energy efficiency lending by using the proceeds from the sale of bundles of energy efficiency loans to make more energy efficiency loans.
Making the Value of Energy Efficiency Visible in the Real Estate Transaction
Policies designed to support accurate valuation of energy efficient homes and energy efficient home features at the time of sale are a promising way to drive consumer demand for energy efficiency. Research from a wide variety of sources indicates that consumer demand for energy efficient homes has been growing steadily in recent years, and that when such homes are available consumers will often pay a premium for them (for example, see Griffen et al. 2009, Pfleger et al, 2011, Stuart 2011, and Walls 2013). An “energy efficiency premium” could be a game changer for the home performance industry. As more buyers demonstrate their willingness to pay more for energy efficient features, then insulation, air sealing, and high-efficiency HVAC equipment will be increasingly seen as good financial investments, much in the way that kitchen and bathroom upgrades are seen as smart investments today.
To date, however, the emergence of an “energy efficiency premium” has been hampered by lack of information. In many markets across the United States, sellers and listing agents don’t have an easy way to advertise their homes’ energy efficient features, nor do buyers and buyer’s agents have an easy way to search for energy efficient homes. In addition, appraisers don’t have the data they need on how the market values efficient features, so they cannot take this into consideration in their financing or refinancing of a home.
There are now several policy approaches to providing information about a home and its energy consumption, including labeling, listing of a home’s energy efficiency assets, and disclosure of actual consumption data. Policymakers may select one of these options; however, given the real estate profession’s interest in multiple types of data, policymakers might also want to explore ways to provide the market with a label, energy efficiency inventories, and consumption data.
MAKING ENERGY EFFICIENCY VISIBLE IN REAL ESTATE TRANSACTIONS
Policymakers can address the lack of information about the energy efficiency of homes through policies that achieve one or both of the following goals:
Providing an appropriate, accurate, and reliable indication of a home’s energy consumption through a label that describes the home’s energy performance and/or disclosure of the home’s energy consumption or energy-efficient features.
Communicating this information effectively to stakeholders engaged in real estate transactions, including homebuyers, listing agents, appraisers, lenders, home inspectors, and others.

x www.seeaction.energy.gov September 2015
Supporting labeling and disclosure of energy efficient features or consumption data is an important but not sufficient step to ensure that the market has the necessary information to value energy efficient homes. It is also crucial that the listing agent, the buyer, the appraiser, and the lender can access, understand, and make use of information about a home’s energy efficient features. Policies that support understanding and use of this data include integrating information about energy efficiency into multiple listing services (MLS) databases, using national data standards and forms, and training real estate agents and appraisers.
MLS databases are crucial to real estate transactions because they are the primary repository of information about for-sale homes for real estate agents and appraisers. To effectively provide the correct information about energy efficiency, MLS databases need to have searchable fields for energy efficiency labels or characteristics. Policymakers can play an important role in encouraging and coordinating efforts by multiple MLS systems within a state or locality to adopt energy efficiency data fields.
Policymakers can take advantage of the alignment between the real estate industry’s new energy efficiency standard data fields, the Appraisal Institute’s Green and Energy Efficiency Addendum (G&EEA), and recently developed national energy efficiency data standards. Coordination between these tools allows data from energy efficiency programs to flow easily to real estate agents and appraisers in a form convenient to them.
Finally, policymakers can draw from the policies presented here to support or require training for real estate agents, appraisers and/or lenders. Most professionals in these fields have only a very limited understanding of energy efficiency, and training courses that are integrated into credentialing requirements can have a significant impact in ensuring that the value of home efficiency is properly understood.
Data Access and Standardization
The challenges involved in collecting, transferring, and analyzing energy consumption data via paper utility bills is one of the most significant issues facing the energy efficiency industry. Program administrators need data to allocate rebates, offer appropriate financing, and quantify savings. Researchers need data to identify the most successful energy saving methods and approaches. To date, however, most of the stakeholders involved in residential energy efficiency, including contractors, program administrators, and researchers, have found the collection, transfer, and analysis of data to be difficult and expensive.
Policymakers can make significant contributions to reducing the expense and difficulty of data collection through two policy approaches. The first category of policies is designed to enhance the ease and speed of access to digital utility data. Enabling access to energy consumption data can play an important role in allowing stakeholders, and contractors in particular, to predict savings more accurately through software calibration methods. This access is also a crucial tool for quantifying the savings after efficiency measures are implemented. The second category of policies is designed to reduce industry-wide software development costs through data standardization.
Consumers can find it difficult to access detailed information online about their energy consumption or to share this data with energy efficiency program administrators or program-affiliated contractors. The White House’s Green Button Initiative provides a standard method for utilities to provide consumers with easy, secure access to their energy usage information, including “traditional” monthly consumption data in a consumer- and computer-friendly format. Green Button Connect-My-Data goes further by providing protocols for sharing “interval” data from smart meters. However, the Green Button Initiative is entirely voluntary; to date, a total over 70 utilities and electricity suppliers have signed on to the initiative.
To speed the process, a number of states have enacted policies that require utilities to provide consumers access to utility data. California and Texas, for example, have supported the development of methods to enable consumers to access their interval utility data through web portals. Several other states, including

September 2015 www.seeaction.energy.gov xi
Illinois, Colorado, and New York, are also developing data access policies that can serve as templates for ways to give consumers and third parties acting on their behalf rapid, easy access to accurate, detailed consumption data.
Data privacy is an important consideration in the development of data access policies.3 A number of states
have passed laws designed to ensure that the privacy of consumer utility data is protected at the same time that relevant energy consumption and energy savings data is made more accessible. In January 2015, the U.S. Department of Energy (DOE) released Data Privacy and the Smart Grid: A Voluntary Code of Conduct, which identifies “high level principles of conduct for both utilities and third parties” designed to mitigate concerns related to privacy and security (DOE 2015b).
Policymakers can consider supporting policies that support adoption of data standards. At present, a suite of standards developed by the Building Performance Institute (BPI), including two “HPXML” standards (BPI-2100 and BPI-2200), are most directly relevant for residential retrofit programs. A companion set of standards offer “off-the-shelf” software solutions. They include BPI-2101, which identifies a standard set of data about home energy upgrades that programs can transfer to MLS databases. The electric utility Arizona Public Service (APS) pioneered use of the BPI data standards to allow contractors in its Home Performance with ENERGY STAR program to use modeling tools of their choice. Contractors have expressed strong satisfaction with the program in surveys, while APS has documented meaningful cost reductions.
Data access and data standards policies can be used together to support development of important new tools for the residential retrofit industry. As the industry matures, the need for better approaches to quantify energy efficiency savings has been growing. Robust evaluation, measurement, and verification (EM&V) methods based on use of pre- and post-retrofit consumption data have the potential to make quantification of energy efficiency savings considerably more accurate. Full development of these methods would require policies that allow for easy, rapid, and inexpensive transfer of both utility and upgrade-related data to program sponsors, aggregators, and EM&V experts.
Supporting Utility System Procurement of Energy Efficiency
Policies that create a framework for utilities to procure energy efficiency are among the most effective tools for driving residential retrofit programs. Energy efficiency often represents the least expensive way to meet a portion of the energy needs of utility customers. However, the utility system’s economic structure does not always provide utilities with the appropriate guidelines and incentives to fully incorporate energy efficiency
3 For Additional insights on data privacy concerns and how to address them, please see SEE Action's: “A Regulator’s Privacy Guide to Third-Party Data Access for Energy Efficiency Customer Information and Behavior” which was released by the Working Group in December 2012.
THE ROLE OF DATA STANDARDIZATION
Data standardization is important for the residential energy efficiency industry because it provides a way to significantly reduce transactional costs, promote interoperability among software systems, enhance quantification of energy efficiency savings, and support research on specific energy efficiency measures and approaches.

xii www.seeaction.energy.gov September 2015
into their mix of energy resources. Policymakers can address this challenge through policies4 that create appropriate, market-based incentives and requirements (“carrots and sticks”) for regulated utilities, such as:
Direct utilities to procure energy efficiency through an Energy Efficiency Resource Standard, an Integrated Resource Plan
5
that recognizes energy efficiency as a resource, or an order directing the procurement of all energy efficiency resources found to be cost effective.
Address utilities’ financial disincentive to use energy efficiency as an energy resource by:
o Allowing them to recover the direct costs of administering energy efficiency programs in a timely manner.
o Addressing the impact on revenue and earnings of reduced sales due to efficiency by compensating them for lost margins or decoupling the link between sales and profit.
o Giving them an opportunity to profit from the energy efficiency investment by providing financial incentives if the utility performs well in delivering energy efficiency.
6
Implement best practices in designing cost-effectiveness tests and ensure that tests are appropriately aligned with the state’s policy goals (for examples, see Lazar and Colburn 2013, Woolf et al. 2012a, Woolf et al. 2012b, and NESP 2014).
Energy efficiency resource standards (EERS) and “all-cost effective requirements” can serve as primary drivers to increase the procurement of energy efficiency within a jurisdiction. EERS require utilities to meet a percentage of their customers’ energy needs through energy efficiency over a multi-year period. In addition, a requirement that utilities procure all energy efficiency found to be cost-effective is an alternative to an EERS that can have a similar, or even more significant, impact.
4 See also the National Action Plan’s implementation goals and key steps for ratepayer-funded programs that support achieving all cost-effective energy efficiency in the U.S. http://www.epa.gov/cleanenergy/documents/suca/vision.pdf
5 For more information, see SEE Action’s report on Integrated Resource Planning at https://www4.eere.energy.gov/seeaction/publication/using-integrated-resource-planning-encourage-investment-cost-effective-energy-efficiency
6 For a more in-depth discussion on policy tools for utility regulators to incentivize utilities to use energy efficiency as an energy resource, see the National Action Plan for Energy Efficiency’s Aligning Utility Incentives with Investment in Energy Efficiency at http://www.epa.gov/cleanenergy/documents/suca/incentives.pdf.
QUANTIFYING RESIDENTIAL ENERGY EFFICIENCY SAVINGS: THE ROLE OF EVALUATION, MEASUREMENT AND
VERIFICATION (EM&V)
Quantifying savings has often posed challenges for utilities, given the inherent difficulty of measuring energy efficiency. In some jurisdictions, the savings claimed by a utility have been challenged by stakeholders.
To address these challenges, policymakers can ensure that transparent EM&V procedures are established, understood, and agreed on by all key stakeholders. Current EM&V procedures, such as the Universal Methods Project protocols, can establish savings with a high degree of accuracy. New “smart” technologies, including both advanced metering infrastructure (AMI) and consumer-oriented home energy management systems, offer additional ways to increase accuracy while significantly lowering costs.
Accurate quantification of savings not only ensures that the utility is meeting its targets, but also helps commissions and utilities integrate energy efficiency as a resource for meeting a wide range of needs, including energy, capacity, and transmission and distribution (T&D) requirements.

September 2015 www.seeaction.energy.gov xiii
EERS have proved extremely successful at driving investments in energy efficiency: states with EERS have far more energy efficiency savings than states that do not (Downs and Cui 2014: 16). At the national level, ACEEE found that states with EERS have mandated a total of more than 18 million MWh in savings for 2012, and have actually achieved savings of more than 20 million MWh—about 85% of total U.S. energy efficiency procurement in 2011 (Downs and Cui 2014: 16).
Utilities may be concerned about EERS and certain “all cost-effective” requirements because their revenue models typically create a disincentive to the procurement of energy efficiency. Traditionally, utilities generate additional revenue by selling more energy above volumes predicted in the last rate-making case, and they lose revenue if sales fall below these volumes. Policymakers can remove this disincentive through a mechanism that allows periodic adjustment of rates to ensure that a utility earns a fixed, predetermined amount of income sufficient to cover expenses and a set return on investments. The rate adjustment may be an increase or a decrease, depending on whether the actual energy used by utility customers was more or less than projected.
Even if disincentives are addressed, however, utilities still have no incentive to invest in energy efficiency. Energy efficiency is typically considered an operating expense rather than a capital investment, and utilities are generally allowed to make a return on investments in generation, transmission, distribution, and other capital projects, but not on operating expenses.
Policymakers can address this issue with policies that provide utilities with the opportunity to generate additional revenues through successful implementation of energy efficiency programs, making such programs an incentivized alternative to other capital investments. Several different models for calculating these incentives have been developed, although most link the amount of the incentive to the quantity of energy saved. In states with incentives, utilities typically meet or exceed their targets, and when the incentives are offered in a range, most utilities achieve maximum savings or savings at the high end of the range (Hayes et al. 2011: iii).
To fully address the barriers to utility investment in energy efficiency, policymakers can also address cost-effectiveness testing, ensuring it accounts for the full range of benefits provided by energy efficiency. These tests, which are designed to ensure that ratepayer funds are spent effectively, may be implemented in ways that systematically undervalue energy efficiency. Policy solutions include implementing the tests that use best practices and designing or selecting a test that is aligned with the state’s energy policy goals according to the newly-developed Resource Value Framework (RVF).
7
Implementation Considerations
Policymakers can implement multiple policies, which can be mutually reinforcing. For example, incentives and financing programs together can bring homeowners into a program and ensure that they have the resources to undertake a home upgrade. Policies that support valuation of energy efficiency features at the time of home sale will increase the value proposition and make the homeowner more likely to upgrade. Data access and standards can make virtually all policy and programmatic activities more efficient and cost-effective, as well as facilitate better quantification of savings. And policies that address utility system barriers can provide additional funding to support all the policies discussed above.
7 For information on best practices, see National Action Plan for Energy Efficiency 2008 and National Home Performance Council 2012
the Resource Value Framework please see http://www.homeperformance.org/policy-research/advocacy/about-resource-value-
framework.

xiv www.seeaction.energy.gov September 2015
Taken together, these policy approaches can lay the foundation for rapid growth in new or existing programs and initiatives to advance residential energy efficiency.
CHARACTERISTICS OF EFFECTIVE RESIDENTIAL ENERGY EFFICIENCY PROGRAMS
Successful approaches to residential energy efficiency policy development have three broad characteristics that have enable their ability to deliver residential energy efficiency savings. These characteristics include:
Leveraging market mechanisms to ensure that policies or programs are sustainable, and that policy supports the market rather than distorting it.
Promoting standardized approaches to the collection and transfer of data that describes both energy consumption and building characteristics, with the goals of supporting and easier, more rapid and precise ways of quantifying and recording energy efficiency savings, providing a better indication of a building’s energy performance, and tracking metrics such as the incremental value of energy efficiency in real estate sales transactions.
Engage the key stakeholders critical to the success of a policy—including contractors, banks, utilities, home owners and homeowner associations, appraisers, or realtors—at the outset to ensure that policies have broad support through the design and implementation phases.

September 2015 www.seeaction.energy.gov 1
Introduction 1.
There has never been a better time to launch initiatives to promote residential energy efficiency savings. Approximately 112 million occupied residential buildings account for almost 22% of the nation’s annual energy consumption, at an annual cost of approximately $225 billion in 2011. A large proportion of these homes could receive cost-effective upgrades that would reduce their energy consumption by 20% or more. A recent SEE Action roadmap for the residential retrofit sector identifies a target market of 82 million homes built before 2005 and occupied by non-low-income households; an earlier study notes that the approximately 75 million homes constructed prior to modern energy codes offer particularly significant opportunities for energy savings (SEE Action 2011: 1-4; Plympton et al. 2008: 2-246). McKinsey (2009) estimates that capturing all cost-effective energy efficiency in non-low income households would lower end-use energy demand by 1,300 trillion BTUs and save $14 billion annually in 2020.8
Over the past several decades, residential retrofit programs have demonstrated that energy efficiency measures can reduce home energy consumption, contribute to stabilizing the grid by shaving peak loads, save consumers millions on utility bills, and significantly reduce carbon emissions. Although there are a number of market barriers which serve to hinder the widespread adoption of home energy upgrades, the lessons learned as a result of the 2009 stimulus funding9 have resulted in new and emerging policy approaches, innovations in program design and delivery, and advancements in workforce development and certification systems that offer new opportunities for advancing the scale10 of residential energy efficiency benefits.
1.1. Purpose and Content of this Guide
This Guide is designed to help state and local policymakers identify and select policies that will provide a foundation to successfully launch or accelerate residential energy efficiency upgrade programs in their jurisdictions. Therefore, this document is written primarily for state and local policymakers, including state and local executives (including governors, mayors, and county executives), legislators (including members of state legislatures and local officials), public utility commissioners, and the staff who advise them. It is designed in particular for policymakers from states and municipalities with little or no history of energy efficiency initiatives. The policy environment has been changing so rapidly, however, that policymakers from states with long-standing programs may also find useful ideas and resources.
The Guide focuses on four areas where public policy has proven particularly effective in creating a framework to advance residential energy efficiency:
Incentives and financing—enabling homeowners to afford the upfront costs of efficiency improvements and potentially paying back loans through utility bill savings over time.
Real estate—making the value of energy efficiency attributes visible in the home sale transaction so that buyers can see the financial advantages of energy efficient homes over comparable, less energy efficient homes and sellers can recapture the value of their energy efficiency investments.
8 McKinsey & Company, 2009. Unlocking energy efficiency in the U.S. economy. P. 34 http://www.mckinsey.com/client_service/electric_power_and_natural_gas/latest_thinking/unlocking_energy_efficiency_in_the_us_economy.
9 The American Recovery and Reinvestment Act of 2009, or ARRA (Public Law 111–5) was an economic stimulus package signed into law by President Obama that provided the states with billions of dollars in economic recovery funds for a range of uses, including investment in energy efficiency measures and programs.
10 See LeBaron, R and K. Saul-Rinaldi, “Bringing On The Boom and Beating the Bust,” NHPC, April 2014 http://www.homeperformance.org/sites/default/files/nhpc_white-paper-bringing-on-the-boom_20130430.pdf.

2 www.seeaction.energy.gov September 2015
Data access and standardization—developing a data collection infrastructure built on national standards and implementing data access policies to ensure that energy efficiency savings can be quantified and verified.
Utility-sector policies—ensuring that utilities are appropriately incentivized to deliver energy efficiency savings and the accompanying benefits to their customers.
1.2. Addressing Market barriers through Policy Initiatives
The potential opportunity to reduce residential energy consumption is immense. Approximately 112 million occupied residential buildings account for almost 22% of the nation’s annual energy consumption, at an annual cost of approximately $225 billion in 2011. A large proportion of these homes could receive cost-effective upgrades that would reduce their energy consumption by 20% or more. A recent SEE Action roadmap for the residential retrofit sector identifies a target market of 82 million homes built before 2005 and occupied by non-low-income households; an earlier study notes that the approximately 75 million homes constructed prior to modern energy codes offer particularly significant opportunities for energy savings (SEE Action 2011: 1-4; Plympton et al. 2008: 2-246). McKinsey (2009) estimates that capturing all cost-effective energy efficiency in non-low income households would lower end-use energy demand by 1,300 trillion BTUs and save $14 billion annually in 2020.
11
Residential energy efficiency has historically posed a paradox for policymakers. Despite the value proposition for individual homeowners, utilities, and society in general, most homeowners have yet to implement energy efficiency upgrades in their homes, and most utilities have yet to seek to procure all cost-effective energy efficiency resources. In the case of consumers, four market barriers are particularly significant:
Challenges related to the quantification of savings
Insufficiently compelling value proposition
High first costs
Contractor delivery system challenges
Energy efficiency is inherently difficult to quantify. A solar panel is rated to deliver a certain number of watts over a certain period of time, and it is relatively easy to measure and confirm whether or not the product actually delivers the specified watts. Energy efficiency, in contrast is “counter-factual”; in other words, the savings of energy that would have been consumed in the absence of savings – cannot be measured directly. Traditional methods for estimating savings have created challenges for the industry: energy modeling does not always achieve precision at the level of the individual home, and comparing pre- and post-upgrade energy consumption has historically been expensive and time-consuming to generate, in part because of the need to take significant variable factors such as weather and occupant behavior into account. Procedures that make quantification of energy savings more accurate would play an important role in interesting homeowners in reliable savings, and in enabling the utility system to rely on energy efficiency as a resource.
Energy savings are a major, though not the only, part of the energy efficiency value proposition. Even if energy savings can be accurately quantified, however, they may not be enough to induce a homeowner to upgrade their property. A mid-range energy upgrade may save a homeowner between $20 and $150 a month. Though not insignificant, these savings are not always compelling enough to convince the owner to spend disposable income on an energy upgrade rather than a vacation or a kitchen remodel.
11 McKinsey & Company, 2009. Unlocking energy efficiency in the U.S. economy. p. 34 http://www.mckinsey.com/client_service/electric_power_and_natural_gas/latest_thinking/unlocking_energy_efficiency_in_the_us_economy.

September 2015 www.seeaction.energy.gov 3
If a homeowner understands the energy efficiency value proposition and finds it compelling enough to move forward, she or he may still lack the financial resources to undertake a project, because of the first cost challenge. The payment is required up front, whereas the payback occurs over a period of years. Financing is an obvious solution, but a significant number of homeowners do not have access to credit, or at least access to affordable credit.
DEVELOPING A QUALIFIED RESIDENTIAL ENERGY EFFICIENCY WORKFORCE
Successful residential energy efficiency programs depend on strong relationships with contractors. Contractors employ home performance professionals who implement energy efficiency measures in homes.
The benefits of workforce development efforts include:
Contractors that actively engage in programs and help meet shared goals
High quality of home performance services provided to homeowners
Homeowner confidence that they will see real energy savings and comfort improvements, due to effective quality assurance and communications
Job opportunities for local, qualified home performance professionals.
Workforce Development Resources The following resources have been developed to support the development of an effective and highly skilled residential energy efficiency workforce. These resources are available to contractors supporting the Weatherization Assistance Program (WAP), Home Performance with ENERGY STAR (HPwES) Program Sponsors, as well as other residential energy efficiency programs sponsored by utilities, state and local governments, and other organizations.
DOE Guidelines for Home Energy Professionals – include standard specifications for quality work, critical tasks and core competencies for effective training programs, and a framework for professional certifications. The website includes job task analyses that describe the tasks and skills needed for specific jobs, information about accredited training programs, downloadable training modules, and other resources.
Professional Certifications – Home Energy Professional Certifications are funded by DOE, developed by the National Renewable Energy Laboratory (NREL), and administered by BPI. BPI is the first third-party organization licensed to deliver the certifications.
DOE Building America Solution Center – provides home performance professionals with building science resources, integrated energy efficiency tools, case studies, and best practices designed to dramatically reduce energy use in new and existing homes. This website includes expert information on hundreds of high-performance design and construction topics, including air sealing and insulation, HVAC components, windows, indoor air quality, and more.
Home Performance with ENERGY STAR Sponsor Guide and Reference Manual (v1.5) – provides relevant, easily accessible guidance for program administrators to plan, develop, and implement local HPwES programs. The guide includes minimum requirements, recommended approaches, and resources relevant to contractors, as well as templates, checklists, and other tools.

4 www.seeaction.energy.gov September 2015
When the homeowner decides to upgrade their home, they will need to find a contractor qualified to successfully conduct the upgrade (see box, Developing a Qualified Residential Energy Efficiency Workforce) . In some markets, the supply of contractors willing to do this work is limited. This is partly because many consumers do not fully understand the value proposition or do not believe that the described benefits and/or savings are compelling enough to warrant the investment, and there is the fact that contractors have had difficulty charging prices that make entry to the residential energy efficiency market attractive.
Contractors have also been dissuaded from entering the market because many residential energy efficiency programs require arduous data collection requirements and/or difficult-to-use modeling tools, which add to the time and cost of the job. Addressing these issues would bring more firms into the energy efficiency market, and would improve the energy efficiency value proposition as well by reducing costs.
Over the past decade, market stakeholders, programs, and policymakers have developed a wide range of solutions for addressing these barriers. Many of the best solutions are emerging in the marketplace. However, policymakers can play a key role in supporting these initiatives.
Market stakeholders and programs have developed a variety of ways to quantify efficiency savings from residential upgrades more accurately and rapidly. These approaches include data standards that increase modeling accuracy through a “true-up” of a model to a utility bill and increasingly sophisticated evaluation, measurement, and verification procedures. All of these approaches depend on utility data, and many also rely on data about buildings and upgrade measures. As described in Chapter 3, policymakers can support these approaches through policies that improve access to utility consumption data, and that support data standards.
To enhance the value proposition of energy efficiency, policymakers have two broad, complementary options. First, the program can offer incentives, designed as rebates, tax credits, and other forms, to reduce the cost to homeowners. Incentives can have a significant market impact, if properly designed, as discussed in Chapter 1. Second, the program can enhance the value proposition of energy efficiency by supporting efforts to ensure that homebuyers have access to information about homes’ energy efficient features. Survey research shows that buyers are interested in energy efficiency, but for them to find efficient homes, data about energy efficient homes must be incorporated into multiple listing service (MLS) listings. Also, real estate agents need training about the value of energy efficiency, and appraisers need information about the homes and how to appropriately value their efficient features. Although market stakeholders can take the lead in all these areas, there are a number of ways that policy can support their efforts, including supporting the addition of energy efficient fields to MLS databases, standard data formats for delivering information to MLS systems, and real estate agent and appraiser training, as described in Chapter 2.
To address the first cost issue, policymakers have a wide range of tools. In addition to enhancing the value proposition, incentives also address the first cost barrier. In some cases, policymakers have used public or ratepayer funds to establish loan funds. Policymakers may also want to create an energy efficiency financing vehicle or enact policies that make financing more accessible. In some cases, states and municipalities have created loan funds. More commonly, policymakers have sought to leverage private market lenders’ capital and expertise by providing credit enhancements or funds to write down market-based interest rates. Alternative and innovative finance and repayment mechanisms, including on-bill and property assessed clean energy (PACE) financing, are other policy tools to support delivery of affordable energy efficiency. These solutions are discussed in Chapter 1.
Finally, to ensure that contractors are adequately equipped to provide energy efficiency upgrade services, policymakers can support the adoption and use of data standards policies that reduce time and cost burdens for contractors, as discussed in the second section of Section 3.
Residential energy efficiency programs serve the utility system as well as the consumer market. The utility system is designed to meet the energy needs of customers – residential, commercial, and industrial – in the

September 2015 www.seeaction.energy.gov 5
utility’s service territory. These needs include not only the provision of energy, but reliability, resiliency, and other system characteristics. As an extremely low-cost resource, energy efficiency can play an important role in meeting these utility system goals.
Energy efficiency programs face barriers in the utility system, in much the same way they face barriers in the consumer market. The most important of these are:
Non-alignment between utility incentives and energy efficiency
Design of cost-effectiveness tests that systematically undervalues energy efficiency.
Utilities are traditionally incentivized to deliver energy: the more kilowatt-hours or therms that the utility provides to its customers, the more revenue earned by the utility. This means that, in practice, utilities have a disincentive to procure energy efficiency.
Even if a utility wants to create energy efficiency programs, cost-effectiveness tests pose a significant barrier to the creation and implementation of energy efficiency in many states. The tests are intended to ensure that ratepayer funds are spent wisely on cost-effective programs. But the tests systematically undervalue energy efficiency because of the practical challenges of implementing such programs.
To align utilities’ interests with energy efficiency procurement, policymakers can implement decoupling policies that sever the connection between utility revenues and the quantity of energy delivered by the utility, and create incentives that give utilities financial rewards for procuring energy efficiency, in much the same way that the utility receives a return from other forms of investment. Policymakers can draw on best practices in the design and implementation of cost-effectiveness tests.
Policies that mandate utilities to procure energy efficiency, such as Energy Efficiency Resource Standards (EERS) and “all cost-effective” requirements are much more likely to be effective than a policy environment in which the utilities have negative incentives to do so.
Chapter 4 discusses further how policymakers can help to realign utilities incentives and improve the way that efficiency programs are screened, so that there is more favorable utility system adoption and support for energy efficiency.

6 www.seeaction.energy.gov September 2015
Table 1. Residential Retrofit Barriers and Policy Opportunities
1.3. Policy Implementation
In most contexts, policymakers will achieve the greatest and most rapid success by adopting one or more policies in each of the four areas discussed in this report – incentives and financing, real estate, data access and standardization, and utility sector regulation – and designing energy efficiency policies in such a way that they are complementary and mutually reinforcing. No single policy will provide a “silver bullet” solution that will scale the residential energy efficiency industry. In combination, however, integrated policies that are designed to address both utility system and consumer market barriers can significantly accelerate the number of energy efficiency retrofits that homeowners undertake. Figure 1 shows how residential energy efficiency policies in three key areas – workforce development, consumer demand and incentives, and utility investments in EE – can work together to overcome market barriers.

September 2015 www.seeaction.energy.gov 7
Figure 1. Interaction of residential energy efficiency policies
Incentive programs can play an important role in driving homeowner interest in energy efficiency. As discussed in Chapter 1, incentive programs can work well with energy efficiency loan programs: the incentive brings the homeowner to the table, and the financing enables consumers and the funding source to close the deal. Policies that facilitate recognition of the value of energy efficiency at the time of home re-sale can play a complementary role in driving demand for many homeowners by providing them with an opportunity to recoup some or all of the energy efficiency investments.
Policies that address the barriers to the utility system valuing and making use of energy efficiency as a resource can support other policies by generating resources to support incentives, financing, data standards, and other energy efficiency-related investments. If utility incentives are properly aligned, the utility will support energy efficiency programs because they provide recognized value to the utility system. In other words, the utility will be paying to procure energy efficiency as an energy resource, which can mean stable funding for energy efficiency over the long term.
Data standards and data access policies provide an infrastructure that will make many of the other policies more effective. In combination, data access and data standards can facilitate the quantification of energy efficiency, which leads to more consumers and utilities understanding the value proposition. Data standards can play a crucial role in ensuring that information about energy efficiency improvements is incorporated into real estate transactions. Data standards can also play an important role in ensuring that all stakeholders in the utility system have confidence that energy efficiency is making contributions towards meeting EERS or “all cost effective” goals and is helping to meet the energy needs of the utility’s customers.
It should be noted that policymakers will probably want or need to tailor the policies described in this Guide to meet the specific economic and demographic conditions of their state or locality. Among the issues to consider during policy development are local energy prices, the state’s regulatory framework, the availability of trained contractors, and the availability of funding for efficiency programs. Because these and other factors

8 www.seeaction.energy.gov September 2015
are different in every area, it is unlikely that any two state or local residential energy efficiency policy approaches will be identical.
1.4. How to Use this Guide
Each chapter describes key policies related to one of the issue areas listed in Section 1.1 above: finance and incentives, real estate, data access and standardization, and utility sector regulation. Most of the chapters are further subdivided into types of policies: Chapter 2, for example, is divided into subsections that deal with tax policies, rebates, and financing.
Each of these subsections addresses:
The goals that the policy is designed to address
Policy design options
Indicators of success
Implementation history and actual outcomes
Considerations for successful policy design
An “Additional Resources and Information” section follows each chapter; policymakers interested in learning more about a particular issue or policy are encouraged to visit the sites and/or download related documents.

September 2015 www.seeaction.energy.gov 9
Lowering Upfront Costs through Incentives and Financing 2.
Addressing the upfront costs of energy efficiency upgrades to homeowners is one of the most significant ways in which policymakers can drive the scale of residential energy efficiency. The potential avoided electricity and gas cost savings from installed energy efficiency measures in a home can be compelling to consumers. The average homeowner spends approximately $2,300 a year on energy bills, and a comprehensive whole-house energy efficiency upgrade will likely reduce this cost 20-25%.
12 To achieve these savings, however, the
homeowner must pay for the energy efficient upgrade measures (HVAC, insulation and air sealing, etc.) up front.
The two most common sets of policies that states and municipalities can implement to address first costs are:
Incentives to bring down the cost of the project. These take the form of:
o Tax credits/deductions—either a tax credit or deduction in state tax liability for installation of energy efficiency measures or a temporary elimination of sales taxes.
o Rebates for the purchase and installation of energy-efficient products, equipment, systems, and appliances.
Access to low-cost capital via public investment. This includes:
o Financing programs that enable access to capital through secured or unsecured loans, which may be repaid through conventional means or through innovative new mechanisms such as on-bill financing.
o Repayment mechanisms that provide another means to support payment for the upgrade such as the use of property assessments in PACE programs.
States and municipalities are well positioned to enact such policies because these governmental stakeholders can provide tax incentives, and may also have access to low-cost financial resources to support rebate programs, loan funds, and/or credit enhancements.
This chapter provides an introduction to the range of policies states and local governments have implemented to overcome the first cost barrier, including emerging, innovative approaches designed to maximize energy savings and minimize public costs.
13
2.1. Incentives: Tax Policies
2.1.1. Goals
Tax incentives provide direct public dollars to homeowners to encourage them to take an action in the public interest—energy savings. With limited funding available from state and local budgets, it is important to understand the efficacy of the incentives themselves, and adopt incentive policies that effectively and efficiently use limited public funds for maximum benefit.
12 https://www.energystar.gov/index.cfm?c=home_improvement.hpwes_for_homeowners and http://aceee.org/fact-sheet/home-efficiency-retrofit-program-feb-2009.
13 Incentives and financing are not substitutes for comprehensive programs. While financing can be a critical component of an energy efficiency program, programs that address consumer education and demand, quality assurance and EM&V, split incentives, and contractor engagement and training are important pieces of a successful and scalable energy efficiency program.

10 www.seeaction.energy.gov September 2015
Incentives that use the tax code will reduce public tax revenue, temporarily, rather than outlaying funds from current budgets—essentially paying next year for the good investment that is undertaken today. A benefit of using the tax code compared to offering rebates is that the federal government and the states have an established system for processing the incentives, through tax forms, thus avoiding the administrative costs of new revenue disbursement mechanisms associated with a new rebate.
2.1.2. Policy Designs and Implementation History
2.1.2.1.1 Income Tax Credits
Income tax credits allow homeowners to lower their state or local tax liability in the amount equal to qualifying purchases and installation of energy efficiency measures. At the state level, income tax credits have been used extensively to promote residential energy efficiency. Kentucky, Missouri, Montana, Oregon, and Virginia
14 have existing laws that allow homeowners conducting audits and/or installing specific energy
efficiency measures to receive a personal income tax credit ($500–$2,000 depending on state and filing status). The tax credits are based on the energy savings measures being installed and their estimated efficiency gains.
2.1.2.1.2 State Sales Tax
State sales tax exemptions represent another way to drive energy efficiency, particularly through the purchase of energy-efficient equipment. A number of states, including Georgia,
15 Maryland,
16 Missouri,
17 Texas,
18 and
Virginia,19
have “sales tax holidays” on high-efficiency products that meet or exceed the efficiency
14 For more information on tax incentives applied by state see http://programs.dsireusa.org/system/program?state=TER.
15 For more information on the Georgia credit see http://gefa.georgia.gov/energy-star-and-watersense-sales-tax-holiday
16 For more information on the Maryland credit see http://comptroller.marylandtaxes.com/Public_Services/Agency_Information/Office_of_the_Comptroller/Comptroller_Initiatives/Shop_Maryland_Tax-free_Week/
17 For more information on the Missouri credit see http://dor.mo.gov/business/sales/taxholiday/green/
18 For more information on the Texas credit see http://www.window.state.tx.us/taxinfo/taxpubs/tx96_1331/
19 For more information on the Virginia credit see http://www.tax.virginia.gov/site.cfm?alias=EnergyStarQualifiedProductsHoliday
25C RESIDENTIAL TAX INCENTIVE
Section 25C of the Internal Revenue Code (“Nonbusiness Energy Property”) —enacted in the Energy Policy Act of 2005— is the only federal residential energy efficiency tax incentive available to homeowners. The tax credit is prescriptive, providing a credit for individual measures or efficiency technologies that are purchased (no proof-of-installation requirements) within an overall cap. Manufacturers, contractors, and policymakers have leveraged the federal tax credit as financial support for retrofit projects. The 25C tax credit was increased under the American Recovery and Reinvestment Act of 2009 (ARRA) from 10% of total project costs (up to $500) to 30% of total project costs (up to $1,500). Then, in 2011 the credit reverted to pre-ARRA levels. During the ARRA period, there were significant increases in energy efficiency purchases; when the ARRA expansion expired, the number of taxpayers claiming the residential credit declined as shown in the table below (Crandall-Horlick 2014). The increase in use, even during the recession, showed that the size of the tax incentives can influence purchasing power and motivate consumers to make energy efficiency improvements.
Table B-1. Residential Energy Credits Claimed and Average Amount, 2006–2010 from page 19, Source: Crandall-Hollick 2014.

September 2015 www.seeaction.energy.gov 11
requirements of the ENERGY STAR® program (though the lists of equipment are not always the same). Connecticut has gone further by making all weatherization products permanently exempt from sales tax.
20
Other states have provided permanent exemptions for renewable energy measures, such as solar systems, and could extend those tax exemptions to energy efficiency measures.
State sales tax exemptions provide both short-term and long-term benefits. In the short term, they give the consumer an incentive to make a more efficient purchase than they otherwise would have, as well as providing the consumer with the validation that the equipment will benefit them. In the long term, they can help increase the market share for efficient technology, ensure that the states’ stores stock those products and educate their sales teams about them, which will further advance market share in a virtuous circle that encourages additional investment and greater competition (Brown et. al. 2002).
Sales tax exemptions may also have some redistributive benefits: sales taxes are often seen as regressive because they affect all income levels equally, and an energy efficiency rebate can reduce regressive taxation on specific products (by removing the sales tax), while incentivizing behavior that supports public policy goals through pragmatic energy savings.
2.2. Incentives: Rebates21
2.2.1. Goals
The primary goals of rebates are to: (1) lower the upfront costs of installing energy efficiency measures, (2) encourage consumers to act by providing an instant monetary incentive, and (3) contribute to achieving scalable energy savings.
2.2.2. Policy Design and Implementation History
Most states have some form of residential energy efficiency rebate program(s) that are offered by electric and gas utilities for either prescriptive measures (e.g., HVAC, insulation), whole house (e.g., Home Performance with ENERGY STAR®) upgrades, or a combination of measures. The type and amount of incentives offered, however, varies significantly.
Some local governments also provide rebates. For example, Boulder County, Colorado, provides rebates equal to 25% of the cost of the energy efficiency measure with a cap of $100–$200 (exact rebate amount depends on the particular energy efficiency purchase and if the work is performed by a program participating contractor). Policymakers in Boulder keep the costs in check with a “first come, first served” policy. They budget a certain amount for the program, and when the funds are gone then the program ends until additional funds are available (a running tally is maintained on their website).
22 This limited time rebate offer
is one approach to keep costs low and motivate consumers to make home upgrades.
Good design is important to running successful rebate programs. Determining the size of the rebate is one crucial design consideration. Generally, rebates need to be large enough to motivate consumers to act, but not so large that upgrades become dependent on them or that money is exhausted before the demands in the market are met. Typically, the best rebate size is determined by the amount of money available, divided by the number of consumers anticipated to use the rebate, reduced by the cost to educate and inform target
20 For more information on the Connecticut credit see http://www.ct.gov/drs/cwp/view.asp?a=1514&q=384952
21 Rebates are offered from a variety of sources that influence, advance, and guard public policy, including PUCs and local governments. The programs noted are legislative unless otherwise noted.
22 For more information on the program in Boulder, CO see http://www.energysmartyes.com.

12 www.seeaction.energy.gov September 2015
consumers about the rebate. Setting rebate size is not an exact science, so programs should regularly evaluate rebate amounts, target audience and eligible measures.
23
When determining rebate levels, it has been shown that higher rebate levels lead to higher conversion rates (i.e., the higher the rebate, the more likely projects are to move from application to completed upgrade). Clean Energy Works (CEW), a non-profit organization, undertook a thorough review of their rebate offer, which went up significantly during ARRA. CEW found that the presence of a modest promotional rebate that would expire in the near-term increased the numbers of applications for the program. They also found a significant correlation (86%) between higher incentives and conversion rates. The conclusion was that the size of the rebate is crucial for ensuring actual retrofits. Modest rebates might get homeowners to apply for the program, but the rebate has to be substantial for the sale to occur. CEW also found that promotional rebates provided an urgency that drove applications. (Tim Miller, Clean Energy Works Oregon, interview, March 3, 2015).
2.3. Financing
2.3.1. Goals
Financing programs are an attractive alternative to tax incentives and rebates for addressing the first cost problem. In some cases, they may be more attractive, because they allow the entire cost of the upgrade to be financed over time, rather than partially reducing the cost through a tax credit or rebate. For example, a homeowner might contact a contractor to repair or replace an HVAC system, and learn from the contractor that more insulation in the attic would solve their comfort concerns and further reduce their utility bills. However, the HVAC replacement may already be stretching the homeowner’s budget, making additional upgrades seem out of reach, even after local utility rebates are factored in. Financing programs designed specifically for home energy upgrades enable homeowners to make significant energy efficiency upgrades and pay for them through manageable monthly payments. Available financing can be even more of a driver for homeowner action when combined with incentives.
23 Additional information on designing residential energy efficiency incentive levels is available in the DOE Better Buildings Residential Program Solution Center, at: http://bbnp.pnnl.gov.
24 Many state and utility programs add an incentive to recycle old appliances unattached to the incentive, such as Massachusetts’ MassSave Program (http://www.masssave.com/residential/offers/refrigerator-and-freezer-recycling-rebates), Austin Energy (http://powersaver.austinenergy.com/wps/portal/psp/residential/offerings/appliances-and-equipment/refrigerator-and-freezer-recycling/), or Duke Energy’s North Carolina program (http://www.duke-energy.com/north-carolina/savings/appliance-recycling.asp). Other states like Idaho will recycle for free (http://www.idahopower.com/EnergyEfficiency/Residential/Programs/Refrigerator/).
25 For more information on the New Jersey recycling program see: http://www.njcleanenergy.com/residential/programs/refrigerator-freezer-recycling-Program.
OUT WITH THE OLD, IN WITH THE NEW: ENSURING REBATES ACHIEVE ENERGY EFFICIENCY GOALS IN APPLIANCE PROGRAMS
Unlike a tax incentive, a rebate can be more easily coupled with the removal of old appliances. When white goods such as refrigerators are replaced, for example, the old appliance is often relocated to a basement or garage when the new one is plugged in—thus failing to achieve the energy savings of removing the old item from the home. A rebate can apply to the installation and/or removal of old appliances and equipment.24 New Jersey combines its refrigerator recycling and incentive program in its marketing ($50 for a high-efficiency refrigerator and another $50 to recycle the old one).25
September 2015 www.seeaction.energy.gov 13
Financing programs are also popular from a policy perspective because they can be designed to leverage private capital with or without credit enhancement mechanisms such as loan loss reserve funds, or through securitization and sale of aggregated loan pools.
Finally, several innovative approaches to repayment, including on-bill mechanisms and property assessments, have enhanced the attractiveness of finance programs as a policy option because they offer ways to reduce default rates and align energy savings with energy costs.
This discussion of financing briefly reviews revolving loan funds (RLFs) and credit enhancement mechanisms, on-bill programs, and property assessed clean energy (PACE) programs. Additional information is available in the SEE Action Energy Efficiency Financing Program Implementation Primer and other publications developed by the SEE Action Financing Solutions Working Group.
26
2.3.2. Revolving Loan Funds and Credit Enhancements
2.3.2.1 Policy Design
One way to provide financial support for residential energy efficiency programs is to establish a revolving loan fund (RLF) to finance retrofits. RLFs are capitalized with public money. Loans are issued from the initial capital used to set up the fund, and as loans are repaid, additional loans are made. RLFs are a popular tool among state and local policymakers; they typically offer unsecured consumer loans specifically for energy efficiency improvements, often with interest rates that are attractive when compared with comparable mainstream finance products (e.g., credit cards). RLFs are attractive from a policy perspective because they can make scarce public resources last longer than they would if they were distributed as one-time rebates or tax incentives.
One of the most important policy decisions involves selecting the organization(s) that originate and service the loans. Some states and municipalities run their own loan programs, but most rely on private sector partners, effectively leveraging their existing expertise, marketing, IT, and other systems to minimize administrative costs. Origination and servicing may be done by different firms, as in the case of on-bill recovery programs, where the utility bill is the vehicle for loan repayment.
Some states offer an interest rate buy-down in conjunction with an RLF. Using public dollars to buy down an interest rate, however, may not always be the best option. For example, one study found (while noting that homebuyers are motivated by single-digit interest rates) that the cost of an interest rate buy-down from 14.99% to 9.99% is considerable—for a 15-year loan it would
26 For additional information, including publications and resources on financing programs, visit the SEE Action Financing Solutions Working Group web page, at: https://www4.eere.energy.gov/seeaction/working-group/financing-solutions
REVOLVING LOAN FUNDS
RLF features can vary from fund to fund, depending on policy goals and available resources. Common features include:
Interest rate
Term (tenor)
Borrower eligibility/credit requirements
Minimum and maximum loan amount
Eligible uses of loan funds
Source of capital
Security
Originator
Servicer

14 www.seeaction.energy.gov September 2015
be equivalent to offering a rebate of 23% of the project (Borgeson et al., 2012). In some states, lower interest rates are offered for projects that achieve more comprehensive scopes, such as the Keystone HELP program in Pennsylvania, which offered reduced interest rates for Home Performance with ENERGY STAR projects.
27 Thus,
policymakers need to analyze and evaluate the structure of financing programs and match them to their overall energy goals, similar to how rebate programs are evaluated.
The interest rate is widely seen as one of the most important features of an RLF because of its perceived potential to drive consumer uptake. Privately financed unsecured loan programs for energy efficiency have historically offered rates in the double digits, and one of the primary uses of public dollars has been to offer considerably lower rates—in some cases as low as 0%—either by establishment of the fund with public capital or through interest rate buy-downs on private capital. There has been considerable debate on the optimal rate for attracting consumer interest, with many experts arguing that very low rates are not necessary to motivate consumers.
28 Policymakers may want to consider use of public funds to buy down rates, but may also want to
explore other strategies for reducing rates, such as on-bill and credit enhancement mechanisms.
The most widely used credit enhancement vehicle for residential energy efficiency loans is a loan loss reserve (LLR). An LLR is a fund established to reduce the risk to the lender by making them whole in the event of a default, up to a certain level or under certain conditions. For example, a publicly funded LLR of $2 million might be established to support a $20 million fund established by a private lender to make energy efficiency loans. The LLR makes the lender whole for loans that default, so that the lender is only at risk if losses exceed the total amount of the LLR: in this case, if losses exceed $2 million, or 10% of the loan portfolio. The LLR allows the lender to charge a lower interest rate commensurate with the reduced risk.
From a policy perspective, an LLR may be more attractive than a buy-down as a way to achieve the same lower interest rate because, in theory, less money may be needed to lower the risk such that the third-party lender will be willing to offer the efficiency loan at the desired rate.
29 Moreover, if the default rate is low, the LLR will
continue to leverage private capital as old loans are paid off and new ones can be made. An LLR may also be used to adjust other risk-based features of the loan, such as borrower credit requirements, allowing the lender to relax underwriting criteria because the LLR provides some protection against presumed higher default rates.
The loan fund and LLR created by Michigan Saves, a non-profit organization launched in 2010 with a grant from the Michigan Public Service Commission, demonstrates how an LLR functions. Michigan Saves’ Home Energy Loan Program makes loans for residential energy efficiency upgrades available through nine participating lenders, both credit unions. The loans, for a maximum amount of $30,000 and a maximum term of 10 years, would carry a rate of 7%. A separate LLR established by Michigan Saves allows each lender to recover up to 5% of the total loan volume in losses resulting from defaults. This structure has allowed the participating lenders to offer the loans at lower rates of 4.25% (for borrowers with FICO scores of 680 and above) and 4.99% (for borrowers with FICO scores in the 640 to 679 range). Homeowners often combine the financing with rebates offered by local utility programs to increase the affordability of efficiency measures. As of early 2014, the Michigan Saves LLR had a default rate of 1.1% (James et al. 2014).
Securitization of energy efficiency funds offers a second, potentially complementary, route to leveraging private capital. In the residential energy efficiency industry, this approach has been developed by the Warehouse for Energy Efficiency Loans (WHEEL), a national program created to make low-cost capital
27 For more information on the Keystone Help Program http://www.keystonehelp.com.
28 In a review of multiple energy efficiency loan programs, for example, James et al. note that: “While the two programs that offer 0% have successful uptake, a rate this low is not a noticeable trend among programs, nor does it appear necessary for success” (2014: 20).
29 See Borgeson et al. (2012), pp. 5 and 6, for a detailed discussion of this issue. The authors note that while there is a reasonable case to be made that an LLR may increase leverage, this result is not guaranteed.

September 2015 www.seeaction.energy.gov 15
available for residential energy efficiency lending on a large scale.
30 When a program participates in WHEEL,
the program must first commit funds and then deposit the initial commitment of interest rate buy-down into the fund. The program can have specific criteria assigned to their program (target low-income families, in a specific region, add a supplemental interest rate buy-down, etc.). Next the program, or very likely a third-party lender, originates and issues the loans. The borrowers receive a fixed rate for the term of the loan.
WHEEL is unique in that it aggregates loans across all participating programs and issues bond for sale to secondary market investors such as pension funds and other investors. This bond issuance is backed by cash flow of loan principal and interest repayments. Then WHEEL repays the original investors and programs that put in the initial monies. After private investors are paid with the revenues from the loan pool, remaining cash flows from the loan pool will be returned as program income. The programs can then recycle the income into WHEEL to offer more or modified loans, or allocate the funds to other efforts.
31 “What we’ve set up is an
indefinitely scalable program,” said Cisco DeVries, chief executive of WHEEL partner Renew Financial, in the Atlantic last April. “We can purchase loans and securitize them and the more we do it, the cheaper the funds become. This has no limit to its capacity” (Woody 2014).
Key to WHEEL’s success, not only for its loan product but for home efficiency performance loans in general, is that WHEEL is building a track record for the cost of capital and the data on the performance of these loans. If the loans perform as well as expected, and continue to provide a return on the investment, they will hold less risk. These loans are also providing an opportunity for the secondary market to learn from them and understand the performance of this asset class—all efforts to support cheaper loan products in the future.
2.3.2.1.1 Indicators of Success
The key indicators of success for RLFs and credit enhancements are:
Consumer interest and use of product
Low default rates
Leverage of private sector capital
Positive results of energy efficiency savings, preferably through a reported metric
2.3.2.1.2 Implementation History and Actual Outcomes
Initially, loans designed specifically to fund energy efficiency improvements had limited uptake and were not a significant driver of demand for energy efficiency upgrades. A 2011 study of 16 residential and 11 commercial loan programs found that, even after many years of operation, only two programs reached more than 3% of their target customer base, while most had participation rates of less than 0.5% (Hayes et al. 2011: iv, 4–5). More recently, however, several programs – including loan funds established through ARRA – have achieved participation rates of 50% or greater, such as the MASS Save program and New Jersey Clean Energy’s loan fund.
32 Analyses of loan programs established under ARRA has shown that loans for energy efficiency
30 Energy Programs Consortium (EPC), in collaboration with the Pennsylvania Treasury, began developing the concept that evolved into the WHEEL program in 2010; in 2011, Renewable Funding and Citi Group Global Markets Inc. joined the effort.
31 As the National Association of State Energy Officials describes it (NASEO [n.d.]): “WHEEL facilitates secondary market sales by purchasing unsecured residential energy efficiency loans originated in participating programs. The loans are aggregated into diversified pools and used to support the issuance of rated asset backed notes sold to capital markets investors. Proceeds from these note sales will be used to recapitalize WHEEL, allowing it to continue purchasing eligible loans from state and local programs for future rounds of bond issuance.”
32 See ACI 2015 presentations for more information.

16 www.seeaction.energy.gov September 2015
improvements default at a lower rate than comparable financial products (Thompson et al. 2014).33
While further research is needed, initial data shows that residential energy efficiency financing products have performed well, and are attracting investment from private capital, such as through WHEEL (Business Wire, June 2015). Some traditional loan funds also have very low default rates, but this may be due partly to unwillingness to undertake aggressive collections or write off loans. It is noted that the evidence is unclear on whether energy efficiency loan funds perform better than other types of loan funds. A Lawrence Berkeley National Laboratory (LBNL) study argues: “[T]here is reason to doubt, at least with existing programs, that efficiency lending is meaningfully more secure—there is significant variance across the country in actual customer savings and even if savings are realized, there are no promises that borrowers will allocate these funds to repaying the loans” (Borgeson et al. 2012: 6).
Even though financing can increase the overall success of a program, it remains a complex and open question as to the specific financing products needed to pair with various programs. The answer is partly a function of whether energy efficiency financing products outperform other lending tools and partly a function of how customer demand might change with a transition from rebate-driven programs to financing (Borgeson et al. 2012: 6).
2.3.3. On-Bill Programs
2.3.3.1.1 Policy Design
“On-bill” programs allow homeowners to repay financing for energy improvements through their utility bill.34
There are several attractive features associated with on-bill programs, which include:
Making repayment of debt related to energy efficiency improvements simple, since the homeowner is already accustomed to pay utility bills on a monthly basis.
Connecting the expense of the upgrade (the loan repayment) with the energy savings from the upgrade. This is particularly important from a marketing perspective if there is a net benefit to the consumer, as when the monthly loan repayment is less than the energy savings.
Some of the available evidence suggests that on-bill programs have lower delinquency rates than similar loans with more traditional repayment mechanisms.
35
Like most finance-related programs, on-bill programs can be structured in several ways. Three key considerations for policymakers are:
What will be the financing source(s) and who will originate the loans?
What secures the debt?
Does delinquency trigger utility disconnection?
On-bill programs may be funded by governments and utilities (using ratepayer funds, public funds, the proceeds from bond issues, revenue from cap-and-trade programs, etc.), or by private sector lenders or investors (e.g. banks, credit unions, Community Development Financial Institutions (CDFIs), investment funds, etc.). Public and utility-funded programs are usually referred to as on-bill finance programs. Programs funded
33 The number, diversity and terms of the loan have been evolving and additional research is needed.
34 On-bill programs may also allow repayment of other energy-related investments, such as solar or demand-response technologies.
35 First, consumers are generally more likely to pay utility bills before many other types of obligations, such as unsecured debt, because they want to avoid shut-offs, and as a result they are likely to pay the on-bill finance charge even if non-payment of that portion of the bill would not result in a shut-off. Second, some, although not all, on-bill programs actually do apply shut-off sanctions to customers who do not repay the energy efficiency portion of the bill. Third, the actual default rates of existing on-bill programs suggest that delinquency for on-bill programs is lower than for other forms of repayment.

September 2015 www.seeaction.energy.gov 17
by private third parties are usually called on-bill recovery programs, because the utility bill is simply serving as a payment collection mechanism (SEE Action 2014: xiii).
Another fundamental policy decision concerns loan security. Some on-bill programs offer unsecured consumer loans. Others can structure the obligation as a tariff, which attaches the charge to the utility meter, rather than the homeowner or the property. This arrangement has the benefit of linking the debt obligation to the home where the energy efficiency improvements were made; in many such programs, if the owner moves, the new owner will assume the obligation to repay the remaining outstanding debt through monthly utility bill payments if the loan was not paid off in the home purchase.
The financing provided through an on-bill program can be serviced in several ways. In some on-bill recovery programs, the utility merely serves a billing role: if the customer falls behind on payments the third-party lender attempts to collect the debt. In other programs, particularly on-bill finance programs, the utility services the loan and assumes responsibility for dealing with delinquencies.
If the utility services the loan, the utility may have a way to address delinquency specific to on-bill programs: the threat of meter shut-off. Loss of power or gas can be a serious enough threat to result in repayment rates significantly better than a typical unsecured loan program. However, disconnection may be seen as a drastic measure by consumer advocates and other stakeholders, and in some jurisdictions disconnection is prohibited during heating and/or cooling seasons on the grounds that gas and electricity are essential services.
Some on-bill programs seek to ensure that the homeowner realizes savings from the outset of the loan by requiring that the monthly payment be less than the projected monthly reduction in the homeowner’s utility bill. This provision both ensures that the homeowner benefits and provides additional protection to the utility from the risk of default, since the homeowner’s payments will always be equal to or lower than they were previously.
36 This on-bill program feature leads to some complications, however. First, in the case of single-
fuel utilities, the designers of the on-bill program will have to decide whether other fuel savings (e.g., gas or electric, oil) should be included in the savings calculation—which can be a particular problem if ratepayer funding supports the program. Second, at a time of low natural gas prices, it means that many projects cannot be financed, even if the loan term is relatively long (e.g., 10 to 15 years).
2.3.3.1.2 Indicators of Success
The indicators of success for an on-bill program are similar to those of a loan fund, i.e., consumer use of product, leverage of private funds, and low default rates. On-bill programs are designed in particular to stimulate consumer use and to keep default rates below those of comparable products.
2.3.3.1.3 Implementation History and Actual Outcomes
On-bill programs have become increasingly popular over the past decade; as of 2014, they were offered in 25 U.S. states, as well as several Canadian provinces. A study commissioned by the SEE Action network looked at 30 residential and commercial on-bill programs and found that the 20 programs that offered residential on-bill had made $1.05 billion in financing available to more than 182,000 customers. Of the total loan volume, however, $790,000 had been made through just two programs, offered by the Tennessee Valley Authority (TVA) and Manitoba Hydro, showing how small most other residential programs are to date.
The residential on-bill programs are characterized by very low default rates. The TVA and Manitoba Hydro programs had default rates of 3% and 0.48%, respectively, and the other programs reviewed by the SEE Action
36 In New York State, a cash-neutral provision was important in ensuring utility support of legislation creating the on-bill program.

18 www.seeaction.energy.gov September 2015
study had default rates that ranged from 0% to 3%. The study did not find a strong correlation between the programs’ default rates and their ability to disconnect customer accounts.
The New York State Energy Research and Development Agency’s (NYSERDA’s) on-bill program provides both secured and unsecured loans at a competitive 3.49% by using ARRA-era Qualified Energy Conservation Bonds to buy down the percentage of the unsecured loans (Karen Hamilton, NYSERDA, interview, October 2014). According to NYSERDA, the program has driven growth in consumer upgrades in comprehensive energy efficiency upgrades through NYSERDA’s Home Performance with ENERGY STAR® program.
37
Policymakers considering the challenges of implementing an on-bill program can consider the stakeholder and utility environment needed to implement the program. Utility support, as noted above, is crucial. In particular, the necessary modifications to the utility’s billing system may be expensive and time-consuming (Bell et al. 2011). This is obviously surmountable as noted in the above New York example, especially when there is strong stakeholder support from contractors and others.
37 New York enacted the Green Jobs/Green New York Act in 2009, which established the revolving loan fund to finance energy efficiency
retrofits, followed by the Power NY Act in June 2011.

September 2015 www.seeaction.energy.gov 19
2.3.4. Property Assessed Clean Energy Programs
2.3.4.1.1 Policy Design
Property Assessed Clean Energy (PACE) programs provide another innovative way for home and building owners to borrow and repay the cost of energy efficiency improvements. A PACE program provides a property owner (both residential and commercial) with capital to finance energy efficiency improvements through a voluntary tax assessment. The assessment is structured as a lien on the property. A state or locality seeking to create a PACE program must first pass enabling legislation that allows local governments to offer PACE financing to homeowners. Local governments may then adopt an enabling ordinance creating a special assessment district. The local government may administer a PACE program directly or choose a third-party
38 Based on a Presentation by Sandra Byrd at SEE Action Executive Group Meeting. January 22, 2015.
LEVERAGING MULTIPLE STRATEGIES
Many of the policy approaches discussed in this chapter can be combined together, as demonstrated in the examples of Arkansas and Connecticut:
Arkansas:
The Arkansas Energy Office’s Residential Energy Efficiency Loan Loss Reserve Program is one example of an LLR. The reserve was established by the state to provide funds to qualifying utilities (municipal, cooperative, or investor-owned) across Arkansas that provide residential on-bill repayment or on-bill financing programs to their customers. Because funding was in short supply, Arkansas made the LLR a competitive grant program, so that the funds were provided to the utilities with the most chance of using their reserves to garner energy savings (Arkansas Energy Office 2014). The Arkansas Electric Cooperative used the LLR to develop a home energy loan program in the Ouachita Electric Cooperative (more than 7,000 members) and the Ozarks Electric Cooperative with more than 70,000 members. In Ouachita, 160 audits were performed and 75 loans were provided, with a 25% energy savings. The Ozarks example was more pronounced, as they had been offering audits for more than 30 years with improvements occurring only 10% of the time. After they partnered with the City of Fayetteville and worked with the city employees, some 70% of the employees applied for the retrofits and on-bill collection. According to Sandra Byrd, VP of Public Affairs and Member Services for the Electric Cooperative of Arkansas, the key to the success of the program was the combination of low-interest loans, on-bill collection, quality audits, and qualified contractors.38
Connecticut:
In Connecticut in 2009, the Community Housing Investment Fund followed a legislative directive that stated that utilities needed to offer an on-bill financing program. They established a revolving loan program that was funded through ratepayer dollars via the public utility commission. By 2011 they were able to offer $3,000 “micro-loans” to $25,000 “max-loans” at competitive interest rates for single-measure and deeper retrofits. This financing complemented a Home Energy Solution program that included qualified contractors to work with homeowners and provide in-home services including blower-door testing, lighting, water savings, and pipe wrap measures for $99 (at a value of roughly $1,000). While in the house the contractor could make recommendations for insulation, appliances, and HVAC that would qualify for the low-interest loans. By combining the program with the incentives and the in-house services and homeowner education, Connecticut’s approach is seeking energy savings through multiple policy mechanisms (Marissa Westbrook, United Illuminating Co., and Christine Koch, Community Housing Investment Fund, interview, March 6, 2014).

20 www.seeaction.energy.gov September 2015
administrator. In the latter case, the local government will typically assume responsibility for attaching the lien and collecting the assessment, but leave all other functions, such as providing financing, screening contractors, and/or reviewing eligible projects for funding, to the third party.
As with on-bill programs, the financing for a PACE program can come from several sources, including the government’s general fund, a bond offering, or a private lender. Until recently, the FHFA has restrictions on the implementation of PACE senior-lien structures, for properties that are backed by mortgages insured by either of the government-sponsored enterprises (GSEs), Fannie Mae or Freddie Mac.
39 On August, 24, 2015
the White House and Department of HUD announced that they would be revising their position to allow for mortgages with subordinated PACE loans to be eligible to use FHA-insured financing.
2.3.4.1.2 PACE Implementation History and Current Status
Enabling legislation to begin PACE programs has been passed or is in process in 31 states, with California taking the lead on project generation. In California, enabling legislation was passed
40 to establish localities’
ability to enter into PACE assessments and the program has resumed as originally envisioned, although without approval of the FHFA. While the lack of FHFA backing added regulatory risk, it did not stop the loans because the legislation additionally established an LLR fund to address loan defaults in an effort to address the concerns of FHFA.
41,42
Table 2. List of Residential PACE Programs
The impact of PACE’s success in California is significant. With low overhead costs, states are looking to California as a leader on this innovative financing. PACENow estimates that the market for Residential PACE is 25,000 projects worth some $500 million and 7500 new jobs created. While PACE is also used for renewable energy, 60.4% of PACE projects are for energy efficiency. And the lack of mortgage defaults have sent an
39 It is anticipated that specific guidance on this issue will be released after the publication of this report.
40 Specifically, the Improvement Act of 1911 as amended by AB 811, city charter authority under the Mello-Roos Act of 1982, and the Mello-Roos Act of 1982 as amended by SB 555.
41 Governor Brown signed Senate Bill 96 on September 26, 2013, to establish the California Alternative Energy and Advanced Transportation Financing Authority that provides the LLR program. While FHFA acknowledged the attempt, they noted that it was not enough to remove their objection.
42 https://energycenter.org/sites/default/files/docs/nav/policy/research-and-reports/PACE%20in%20California.pdfergy.

September 2015 www.seeaction.energy.gov 21
important signal to the federal government. As of this writing, there has not been a claim on the California PACE Loss Reserve as a result of a mortgage default. Whether or not policymakers decide to adopt a PACE program, they can learn much from the initial success of PACE, particularly in California:
PACE demonstrates innovative alternatives to rebates and prescriptive financing through programs that deliver fast, low-cost financing through existing sales channels and markets.
Measuring delivered energy savings from PACE and other financing programs is important, in order to evaluate and expand the effectiveness any energy efficiency program financing. Critics of the PACE projects worry about the levels of contractor training and evaluation, measurement, and verification (EM&V) provided for PACE projects. If states are going to use monies set aside for energy efficiency to back the loans in a reserve, it is important to have a better understanding of the program associated contractor training and EM&V effectiveness. How much energy is projected to be saved remains an estimate— nonetheless, the energy savings in California delivered from PACE are considered to be significantly higher than from California’s Energy Upgrade programs.
States can consider including non-energy measures, such as water efficiency, to promote widespread market adoption of financing mechanisms. With new California requirements to reduce water use, Californians could be leveraging more PACE dollars for water efficiency in 2015. In Florida, PACE efforts continue to consist mostly of investments in efficiency and roof and window upgrades for wind hardening against hurricanes. In Oregon and California
43, state lawmakers recently approved a bill that will allow cities and counties to leverage
PACE for seismic upgrades. While PACE can be altered to fit the unique concerns of the region, no single state has come close to rivaling California’s robust residential PACE market.
44
With the upcoming reduction in regulatory uncertainty, there may be more of an expansion of PACE financing for single-family homes.
2.3.4.1.3 Final Thoughts on Policy Design Considerations
As noted in this chapter, there are obstacles and opportunities for addressing the cost of home performance upgrades that are key to scaling the industry. Making a project more affordable through a combination of policies (rebates and incentives) can be key—and these policies do not have to be covered by the same public coffers. Michigan Saves, for example, found that projects that used incentives and financing
45 were on
average twice as large as projects that did not use financing (Laura James, Michigan Saves, presentation, April 22, 2014), showing that a combination of incentives and financing can lead to deeper retrofits and more substantial energy savings. Karen Hamilton, the Director of the Residential Energy Services Program at NYSERDA, noted that they have witnessed low-interest financing driving some amount of the home performance retrofits, “Through the alternative financing underwriting criteria we offer, many households that would not have qualified for market-based financing can qualify for our financing, enabling work to go forward” (Karen Hamilton, NYSERDA, interview, November 2014).
Policymakers must carefully consider how fertile the environment is for their effort to address consumer cost challenges. Important barriers may exist in the program design (contractor training and availability, education of the consumers about the program, program participation simplicity for the contractor and the homeowner) that will stand in the way of good financing. The policy goals and market opportunities are thus a key factor in developing incentive and financing programs. Each policy mechanism noted in this chapter requires some
43 California passed a law allowing the use of PACE to finance seismic retrofits (AB 184 (2011). See:
http://www.ibabuzz.com/politics/2011/06/20/swansons-seismic-retrofit-bill-becomes-law/. San Francisco mandated that certain multi-family buildings be retrofit and established PACE as the method of financing the retrofits.
44 http://www.greentechmedia.com/articles/read/renovate-america-issues-240m-in-pace-bonds
45 Michigan Saves was able to use the data from the 3000 projects in the BetterBuildingsMichigan program to come to this conclusion.

22 www.seeaction.energy.gov September 2015
public financial investment (if only via loan-loss reserves), administrative oversight, and legislative or regulatory action. At a time of fiscal belt-tightening and political stalemates, these market barriers alone can prove significant, but are not insurmountable.
While available, low-interest financing has been crucial in helping the majority of homeowners undertake deeper retrofits, policymakers should understand their targeted homeowners. Homeowners with good credit who may be happy to accept a subsidized low-interest rate would likely qualify for other low-interest financing, such as a home equity loan or bank loan. Policymakers, however, must consider if the cost of the interest rate buy-down is the best use of public dollars.
Chris Kramer and Richard Faesy of the Energy Futures Group studied seven different programs across the U.S. and discovered that, while financing can be a useful tool to address upfront costs and help convince homeowners to take additional energy efficiency measures, other program design elements such as simplifying the program administrator models, technical assistance, and contractor engagement were crucial to their success (Kramer and Faesy 2013). In fact, lack of financing is rarely the primary reason that an energy efficiency retrofit is abandoned by the homeowner. Many other barriers—lack of information, split incentives, performance uncertainty, lack of perceived resale value, and other challenges addressed in this Guide—affect the homeowner’s decision-making.
46 It is important for policymakers to remember that the implementation of
the policy and the resulting program design are crucial to the overall program success.
2.4. Getting Started
Policymakers wishing to make energy efficiency more affordable to their constituent homeowners must look for the appropriate combination of incentive and financing policies. Tax incentives and rebates require the most financial investments but can provide enormous benefits—yet size of the incentive and corresponding red tape are crucial to efficacy. If contractors raise their fees to offset the investments, less goes to the homeowner. Furthermore, current financing models aim to ensure that homeowners can make upgrades and pay for them over time, making energy efficiency retrofit/upgrade projects less onerous. To get started, policymakers must first consider:
The amount of public funds available to the project.
o Significant funds: look to combine a Revolving Loan Fund (RLF) program or a Loan Loss Reserve (LLR) program capitalized with public funds with an incentive program that lowers the overall cost of the retrofit.
o Modest funds: look to establish a tax or rebate incentive program to reduce the overall cost of energy efficiency retrofit/upgrade projects, but depend on homeowners to use their credit history to secure financing elsewhere.
o Low funds: look to establish an LLR or third party financed loan program (such as WHEEL) that can support energy efficiency retrofits with low public dollars.
The energy goals of the state and need to measure the results.
o Metrics are more simply determined for some policies than for others. If precision is needed, prescriptive energy rebates are a good source of data for metrics, allowing the exact numbers of equipment and their deemed savings to be assessed.
o Performance-based programs require additional paperwork and software investments, but will provide for whole-house energy savings.
46 These points are also made consistently in the two papers written by LBNL and reviewed for this chapter: Zimring et al. (2013) and Borgeson et al. (2012).

September 2015 www.seeaction.energy.gov 23
o Loan programs often do not accurately track overall energy savings measures and
referenced energy data is generally estimated.
Numbers of trained contractors able to undertake the project.
o An incentive program that is offered without qualified contractors will fall flat. The “if we build it, they will come” approach has been used with questionable success. Care must be taken to audit the contractor availability to meet increased demand.
o Contractors will alter their business models to utilize incentives for their customers. However, if an incentive requires more paperwork than it is worth to the contractor, the contractor may choose not to include it in the sale or simply absorb its cost to avoid the paperwork hassle. Furthermore, temporary incentives can prove difficult to convince contractors to alter business models for the short-lived benefits provided.
Incentives: size and sustainability matter.
o As noted in the Oregon rebate and 25C federal incentive examples, the size and temporary quality of the incentive is “key” to motivating homeowner action. However, the “tipping point” for action is unknown and varies by region. Policymakers should take care not to establish a too-small incentive that will provide no motivation and waste valuable public dollars.
o Short-term incentives can be motivating, but can also distort the market by leading contractors to develop business models around them so that the industry becomes more dependent on incentives. Engaging with the contractor workforce and ensuring transparency and intensive marketing of the short-term incentives can ensure that the timing is well-used as a motivating tool.
Current demand for energy efficiency retrofits.
o The current building stock, number of contractors, past uptake of energy programs, or pilot offerings can be considered before a financing program is announced. If low demand is diagnosed, policymakers must take into account the need for increased marketing in their program plans.
While legislative or regulatory action will be a prerequisite for providing financial support to home owners for home energy upgrades, it is crucial to know the goals of the policy, socioeconomics of the target homeowners, and contractor availability and interest in order to determine which mechanisms will best drive energy savings. A well-planned financing policy, coupled where possible with targeted incentives, can provide important energy savings.
2.5. Additional Information and Resources
2.5.1. SEE Action Resources
Financing Primer
https://www4.eere.energy.gov/seeaction/sites/default/files/pdfs/financing_primer.pdf
Residential Blueprint Report
https://www4.eere.energy.gov/seeaction/system/files/documents/residentialretrofit_blueprint.pdf
On-Bill Financing
https://www4.eere.energy.gov/seeaction/system/files/documents/onbill_financing.pdf

24 www.seeaction.energy.gov September 2015
2.5.2. State and Local Programs
DOE State and Local Solution Center: Financing Solutions http://energy.gov/eere/slsc/financing-solutions
ENERGY STAR Rebate Finder
https://www.energystar.gov/rebate-finder
DOE Energy Savers
http://energy.gov/energysaver/energy-saver
DSIRE website
http://www.dsireusa.org/
2.5.3. ACEEE Resources
ACEEE State and Local Policy Database
http://database.aceee.org/
The Limits of Financing for Energy Efficiency (ACEEE Summer Study, 2012)
http://aceee.org/files/proceedings/2012/data/papers/0193-000155.pdf
On-Bill Financing for Energy Efficiency Improvements: A Review of Current Program Challenges, Opportunities, and Best Practices (ACEEE, 2011)
http://www.puc.state.pa.us/Electric/pdf/Act129/OBF-ACEEE_OBF_EE_Improvements.pdf
Tax Credits for Energy Efficiency and Green Buildings: Opportunities for State Action (ACEEE, 2002)
http://aceee.org/files/proceedings/2002/data/papers/SS02_Panel9_Paper02.pdf
What Have We Learned from Energy Efficiency Financing Programs? (ACEEE, 2011)
http://www.pacenow.org/wp-content/uploads/2012/08/ACEEE-Sep-2011-paper.pdf
2.5.4. Other Resources
Driving Demand for Home Energy Improvements (Lawrence Berkeley National Laboratory, 2010)
http://emp.lbl.gov/sites/all/files/REPORT%20low%20res%20bnl-3960e.pdf
United States Building Energy Efficiency Retrofits: Market Sizing and Financing Models (Rockefeller Foundation, 2012)
http://www.rockefellerfoundation.org/uploads/files/791d15ac-90e1-4998-8932-5379bcd654c9-building.pdf
California Joint Utilities Financing Research: Existing Programs Review (CADMUS, 2014)
http://www.calmac.org/publications/Existing_Programs_Review_FINALES.pdf
Residential Energy Tax Credits: Overview and Analysis (CRS, 2014)
http://fas.org/sgp/crs/misc/R42089.pdf

September 2015 www.seeaction.energy.gov 25
Making the Value of Energy Efficiency Visible in the Real Estate Transaction 3.
3.1. Overview
Policymakers can play a pivotal role in helping an energy efficiency premium emerge for energy efficient homes by addressing a crucial market failing: lack of information about energy efficiency features in the real estate transaction. Buyers will pay a premium for an energy-efficient home only if they know that the home is efficient.
Consumer surveys show growing interest in efficient homes, with many buyers indicating that low energy bills and energy-efficient features are high on their list of “must-haves” when shopping for a new home. Studies indicate that, in markets with a significant stock of efficient homes, this growing demand is translating into higher prices (see for example Griffen et al. 2009, Pfleger et al 2011, Stuart 2011, and Walls 2013.).
48 When
homeowners that might be future sellers know buyers will pay more for an efficient home, they can view energy efficiency upgrades not only as a way to enjoy bill savings and greater and comfort while still occupying the home, but also as an investment that increases their home’s resale value.
If an energy efficiency premium is reflected in real estate valuations
47 The term “disclosure” is sometimes used in discussions of making the value of energy efficiency visible in the real estate market to indicate
mandated or required reporting of information about a home’s energy consumption. However, given that the real estate industry recognizes both
mandatory and voluntary disclosure, and that several states have discussed making a transition from voluntary to mandatory disclosure of home
features, this chapter does not automatically associate the term “disclosure” with a mandate—although mandated disclosure is possible.
48 Note also that in the European Union, which has over a decade of experience with an energy labeling framework, a premium is also emerging. “The EU energy label seems to be quite effective in resolving the information asymmetry in understanding the energy efficiency of dwellings: Dirk Brounen and Nils Kok (2011) estimate hedonic pricing gradients for recently sold homes in the Netherlands and document that homes receiving an ‘A’ grade in terms of energy efficiency sell for a 10 percent price premium. Conversely, dwellings that are labeled as inefficient transact for substantial discounts relative to otherwise comparable, standard homes” (Kok and Kahn 2012: 3).
KEY TERMS
Terms such as “label,” “rating,” “score,” “certification,” and “disclosure” are commonly and not always consistently used in discussions of integrating energy efficiency into real estate transactions. For the sake of clarity, this Guide adopts the following definitions:
The term “label” is used to denote a set of information about a home that is collected (by a qualified professional) and presented according to specific protocols with the intention of providing clear, coherent information about the home’s energy consumption and relative energy efficiency. A label may contain a wide range of types of information, including scores and ratings, certifications, energy consumption data, etc.
The terms “score” and “rating” are used interchangeably to denote an analytical construct designed to indicate a home’s energy efficiency relative to other homes through a numerical scale. These include HERS ratings, the Home Energy Score, the Energy Performance score, and other similar systems.
The term “certification” is used to denote a system that designates whether a home has reached specific threshold criteria. The certification may be binary (either a home has a certification or does not, as in the case of ENERGY STAR qualified homes), or the certification system may involve “certification tiers” (as in the case of LEED certification).
The term “disclosure” is used to denote policies and actions designed specifically to require or encourage provision of information about the home’s energy efficiency characteristics to interested parties at the time of the real estate transaction.
47
One other, less common expression is important here: in this Guide, the expression “integration with the real estate market” is used to denote the process of developing the infrastructure that allows disclosure to occur easily, rapidly, and inexpensively. This includes systems and mechanism such as data architecture, data transfer protocols, and training and educational efforts designed to ensure that relevant stakeholders can access and use the information.

26 www.seeaction.energy.gov September 2015
and sales, the premium paid can serve as an important role in driving demand for energy-efficiency upgrades. Thus, policymakers have new opportunities to drive energy efficiency upgrades by enacting policies that help make energy efficiency improvements visible in residential real estate transactions.
At present, however, the mechanisms are inadequate for providing the market with information. Unlike many
other features that top buyers’ “must-have” lists, such as granite countertops, pools, or multiple bedrooms, energy efficiency improvements are frequently either invisible (such as air sealing or upgraded wall insulation) or not readily understood (such as efficient HVAC equipment) by consumers. This information barrier prevents these market stakeholders from valuing energy efficiency and the long-term costs of energy use. A customer’s inability to identify efficient homes represents a substantive gap in the value chain of delivering energy efficiency: many customers want efficiency and cost savings, but there is a major information barrier between this demand and the number of retrofits being done by building owners (Nadkarni and Michaels 2012: 2).
Consumers, realtors, appraisers, home inspectors and others involved in real estate transactions must have the capacity and training to readily identify energy efficiency features at multiple steps in the real estate transaction:
Providing information on energy efficiency features to home purchasers (e.g., MLS fields)
Including energy efficiency features in real estate listings (e.g., fields, specifications, performance criteria such as Home Energy Score, HERS or other certifications)
Quantitative information to support appraisals and underwriting (e.g., asset information, including scores if available)
Policymakers can address the market failure and enact policies that help make energy efficiency improvements visible in the residential real estate transaction by:
1. Providing an appropriate, accurate, and reliable indication of a home’s energy consumption, in absolute terms and/or relative to other homes, through a label that describes the home’s energy performance and/or disclosure of the home’s energy consumption or energy-efficient features.
2. Communicating this information effectively to parties to the real estate transaction, and more generally to stakeholders engaged in real estate transactions, including homebuyers, listing agents, appraisers, lenders, home inspectors, and others.
It could be noted that although both of these activities require the voluntary efforts of market stakeholders, experience to date suggests that policymakers can play a crucial complementary role in setting a framework for labeling and disclosure.
The first type of policy—providing information about a home’s relative efficiency or energy-efficient features—is familiar to many energy efficiency professionals and policymakers. There is broad agreement that this type of policy is necessary, and as a result policy debates tend to focus on what sort of information is most appropriate—a label, a score, utility bills, details about the home’s features, or some other information. (For a discussion of these terms, see the “Key Terms” box.) The issue of which type of information is most powerful for moving the real estate market is taken up in Section 3.2 below.
The second type of policy—creating the mechanisms or pathways to ensure that buyers and real estate professionals have relevant, comprehensible information that they can use when they need it—is a crucial part of making the value of energy efficiency visible by making energy efficiency features visible to buyers and other stakeholders (Nadkarni and Michaels 2012: 10).
The following sections address each of these two broad policy categories in turn.
3.2. Home Energy Labeling and Disclosure
3.2.1. Goals
The goals of labeling and disclosure policies include:
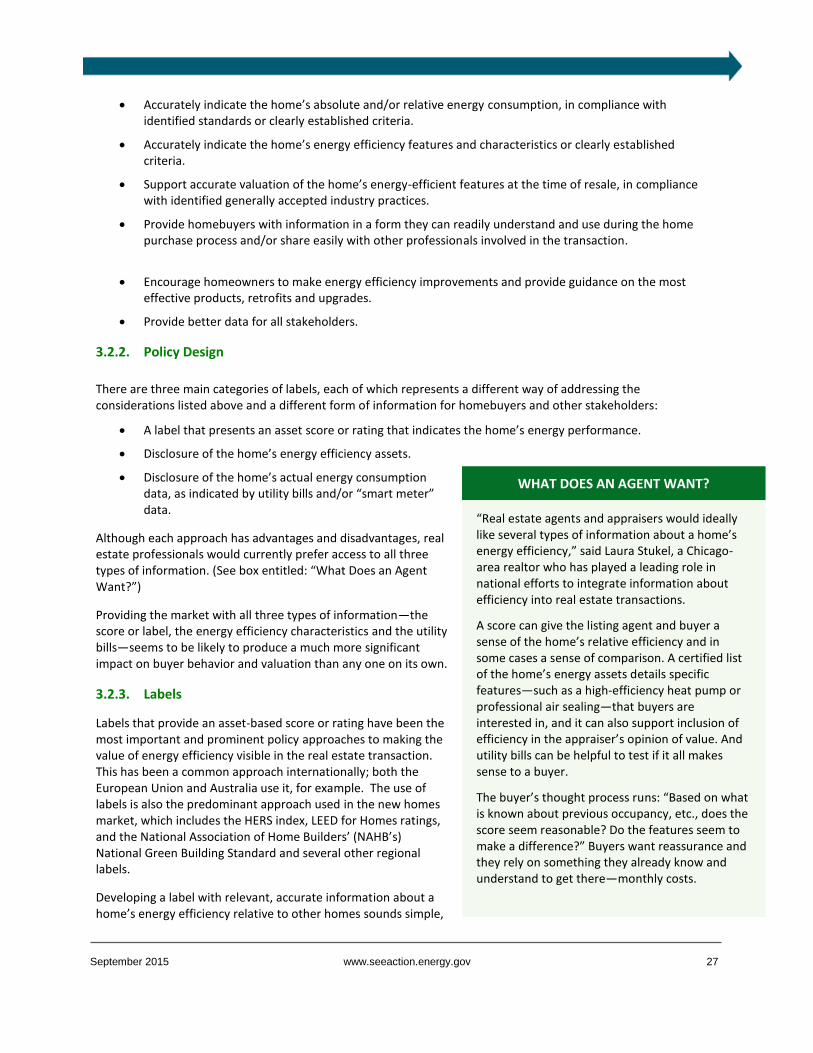
September 2015 www.seeaction.energy.gov 27
Accurately indicate the home’s absolute and/or relative energy consumption, in compliance with identified standards or clearly established criteria.
Accurately indicate the home’s energy efficiency features and characteristics or clearly established criteria.
Support accurate valuation of the home’s energy-efficient features at the time of resale, in compliance with identified generally accepted industry practices.
Provide homebuyers with information in a form they can readily understand and use during the home purchase process and/or share easily with other professionals involved in the transaction.
Encourage homeowners to make energy efficiency improvements and provide guidance on the most
effective products, retrofits and upgrades.
Provide better data for all stakeholders.
3.2.2. Policy Design
There are three main categories of labels, each of which represents a different way of addressing the considerations listed above and a different form of information for homebuyers and other stakeholders:
A label that presents an asset score or rating that indicates the home’s energy performance.
Disclosure of the home’s energy efficiency assets.
Disclosure of the home’s actual energy consumption data, as indicated by utility bills and/or “smart meter” data.
Although each approach has advantages and disadvantages, real estate professionals would currently prefer access to all three types of information. (See box entitled: “What Does an Agent Want?”)
Providing the market with all three types of information—the score or label, the energy efficiency characteristics and the utility bills—seems to be likely to produce a much more significant impact on buyer behavior and valuation than any one on its own.
3.2.3. Labels
Labels that provide an asset-based score or rating have been the most important and prominent policy approaches to making the value of energy efficiency visible in the real estate transaction. This has been a common approach internationally; both the European Union and Australia use it, for example. The use of labels is also the predominant approach used in the new homes market, which includes the HERS index, LEED for Homes ratings, and the National Association of Home Builders’ (NAHB’s) National Green Building Standard and several other regional labels.
Developing a label with relevant, accurate information about a home’s energy efficiency relative to other homes sounds simple,
WHAT DOES AN AGENT WANT?
“Real estate agents and appraisers would ideally like several types of information about a home’s energy efficiency,” said Laura Stukel, a Chicago-area realtor who has played a leading role in national efforts to integrate information about efficiency into real estate transactions.
A score can give the listing agent and buyer a sense of the home’s relative efficiency and in some cases a sense of comparison. A certified list of the home’s energy assets details specific features—such as a high-efficiency heat pump or professional air sealing—that buyers are interested in, and it can also support inclusion of efficiency in the appraiser’s opinion of value. And utility bills can be helpful to test if it all makes sense to a buyer.
The buyer’s thought process runs: “Based on what is known about previous occupancy, etc., does the score seem reasonable? Do the features seem to make a difference?” Buyers want reassurance and they rely on something they already know and understand to get there—monthly costs.

28 www.seeaction.energy.gov September 2015
but is in fact technically challenging. Most of the difficulties stem from the fact that a number of factors contribute to a home’s energy consumption at any given time, including the characteristics of the building, the behavior of the occupants, and the vagaries of the weather. In selecting a label, policymakers may want to review the considerations that underlie the development of the labels currently in use.
There are a number of scoring tools and labels available, including:
Home Energy Score (DOE),
Energy Performance Score (Energy Trust of Oregon),
Home Energy Rating System (RESNET),
LEED for Homes (USGBC), and
NAHB’s National Green Building Standards
Each is described below with examples of state or local implementation approaches and applications.
The Home Energy Score, developed by the U.S. Department of Energy (DOE), measures a home’s source energy consumption relative to other homes in the same climate zone on a scale of 1 to 10 (Figure 2) . A trained assessor can generate a score in between 15 minutes and an hour at a relatively low cost. The score is source- rather than site-based. Recommendations for energy efficiency improvements are generated together with the score.
Figure 2. DOE Home Energy Score example

September 2015 www.seeaction.energy.gov 29
The Colorado Energy Office (CEO) has begun supporting use of the Home Energy Score to provide a market-facing indication of a home’s relative energy efficiency. With encouragement and some indirect support from the CEO, several utility programs and a number of independent home inspectors and energy raters in the state are now generating Home Energy Scores. Because the programs and inspectors use different energy modeling and data collection software tools, the CEO has sponsored the creation of a central database that can receive Home Energy Score–related information from multiple sources. As discussed in more detail in the section below, this effort is integrated into a larger ongoing initiative coordinated by the CEO to create an infrastructure for disclosing information about residential energy efficiency during the real estate transaction.
Colorado is supporting use of the Home Energy Score not only as a way to generate information about homes’ relative energy efficiency, but also as a way to encourage homeowners to make improvements. Proposed legislation would provide tax incentives to homeowners who improve their Home Energy Score by implementing energy efficiency measures.
In 2011 Connecticut approved legislation requiring that any home upgraded through the state Home Energy Solutions residential audit and retrofit program be labeled with a Home Energy Score. The decision was based on extensive consumer research and consultation with stakeholders.
Most recently, a new approach that indicates a home’s consumption in MMBtu or MMBtu/square foot, rather than a scoring system, has begun to gain traction in both the Northeast and Pacific Northwest. This approach is more granular than the Home Energy Score, but consumer research suggests such granularity is relatively easy to understand.
The Energy Performance Score (EPS) was developed by the Energy Trust of Oregon during the late 2000s as a simple, inexpensive tool to provide an asset-based measure of the site energy consumption of existing and new homes. The EPS requires few (about 30) inputs, and as a result is relatively inexpensive to generate.
The state of Oregon has adopted legislation that encourages use of the EPS as a voluntary label for both retrofits and new construction, and provides a supportive infrastructure, including training and licensing for assessors and guidance for using the score in property appraisals. The EPS is not used universally throughout the state, however: some of the municipal utilities in Oregon are using the Home Energy Score, described below, as a labeling system in their territories.
The HERS rating has been in existence longer than most other labeling systems; HERS is the most common label for newly constructed homes, but is not often used for existing homes, due largely to the time and expense required to generate it. The HERS index provides an asset-based measure of a home’s energy consumption, on a per-square-foot basis, as compared to a code-built home with similar characteristics.
Several other labeling systems, including LEED for Homes and the NAHB National Green Building Standards, are also more common for newly constructed homes, and have limited impact on the existing homes market. Regional labels, including Earthcraft, Greenpoint Rated and Built Green labels, have achieved some volume in specific markets, but do not have a national presence.
Vermont and Massachusetts have both developed asset labels that estimate the home’s energy consumption, as indicated in MMBtu/year, on a per-household, site energy basis. This approach is designed to be easy for consumers to understand and to provide a measure that provides broad comparability with homes in other regions. It is also relatively inexpensive to generate: Vermont deliberately designed its label to cost approximately $250. As in Connecticut, in both states the label is integrated into the energy efficiency programs offered by utilities and non-profits.
All of the states discussed above provide supplemental information on their labels in addition to a score. Oregon’s EPS, and the Massachusetts and Vermont labels, all provide an indication of the home’s carbon footprint, which
30 www.seeaction.energy.gov September 2015
serves as an indication of source energy consumption. Vermont also uses the Home Energy Score as a secondary indication of the home’s energy consumption (NASEO 2014: 4–6).
A number of other states, including Alabama, Arkansas, Florida, Missouri, New Hampshire, and Washington, are currently launching similar initiatives, several in the form of pilot programs.
All of the labels discussed above are based on a modeled estimate of a home’s energy consumption based on its physical characteristics and energy efficiency assets. As a result, each relies on one or more software systems to generate the label. A proprietary software system, developed by CakeSystems, generates the EPS. The HERS Index is generated by several software systems approved by the Residential Energy Services Network (RESNET). The Home Energy Score is generated by an online tool developed and maintained by DOE.
The Home Energy Score tool can communicate with multiple software tools through its application program interface (API). As a result, multiple modeling tools are used in several of the states that have incorporated the Home Energy Score into their labeling system. CakeSystems and Conservation Services Group’s Energy Measure Home software are used in Massachusetts, for example, while in Colorado CakeSystems, Optimizer and SnuggHome are all used.
Design of the label has been an important policy design consideration for many jurisdictions. Research strongly indicates that the label’s design components, such as how a scale is presented and described, whether the “good” and “bad” ends of the scale are clearly indicated, and what the home’s performance is being compared to, have a significant impact on consumer acceptance. Vermont, in particular, conducted extensive consumer testing before designing its label. Massachusetts has not required a single label design, but instead allows utility programs to design the label according to certain parameters (see Faesy et al. 2014; NASEO 2014: 10–11; Earth Advantage [n.d.]: 19–24s.).
A few states (MA, OR, VT) have considered requiring a label at time of sale. As of 2014, however, disclosure of almost all the labeling systems described above is voluntary. This is due in large part to stakeholder opposition: real estate agents and to a lesser extent mortgage lenders have historically opposed mandatory ratings and scores. The sole exception for existing homes is the Boulder ordinance that requires a HERS rating for additions and major renovations.
3.2.4. Disclosure of Energy Efficiency Assets
An alternative to a label is to require a physical description of a home’s energy efficiency assets, as determined by an energy assessment (also known as an audit) or some other inspection by a “qualified professional”. This approach allows the development of tailored recommendations for improvements, and it does not require the data inputs associated with generating an asset-based score or rating. To date, the real estate community has sometimes expressed more comfort with this approach than with a rating or label.
The City of Austin pioneered this approach with a 2008 law requiring that every for-sale home receive an energy audit before the sale, and the results be disclosed to the potential buyer (Cluett and Amann 2013: 7, see also Bamberger et al. 2012:23). To minimize costs, the audit is designed to focus on the issues that affect a home’s energy efficiency in Austin’s climate: duct testing is required, but blower door testing is not (Cluett and Amann 2013: 9). The buyer is provided with the audit results and a set of recommendations for improvement. The City of Austin and Austin Energy worked extensively with stakeholders, particularly the Austin Board of Realtors to ensure that the program addressed their concerns. The original program design required not only the audit, but also improvements based on the audit findings; this latter requirement, however, was not included in the final bill, as a result of stakeholder concerns (see Cluett and Amann 2013: 10).
The City of Berkeley, California, approved energy audit ordinance in March 2015. The Berkeley ordinance requires owners of residential one- to four-family buildings to conduct a building energy assessment that includes a building energy score, and to provide this information to prospective buyers before execution of the contract of sale.

September 2015 www.seeaction.energy.gov 31
Several Home Performance with ENERGY STAR programs, including ones in Illinois, New York, Vermont, and Virginia, have created or are creating certificates that indicate that the home was upgraded according to the program’s standards. The certificates typically list the improvements made in the home, such as insulation with a specific R-value or heating/cooling equipment with a specific efficiency. They may also include the extent to which the upgrade reduced the home’s energy consumption.
The New York and Vermont programs are currently both developing ways to ensure that the certificates generated by their Home Performance with ENERGY STAR programs are compliant with the national data standard BPI-2101-S-2013 (Building Performance Institute 2013), as discussed in greater detail later in this chapter.
Unlike the Austin program, none of these states discussed above require that their certificates be disclosed at the time of home sale. However, programs are developing methods to encourage voluntary disclosure: the Illinois Home Performance program, for example, has worked with the multiple listing service (MLS) that serves the Chicago metro area to encourage homeowners to make the selling agent and other real estate professionals aware of the certificate at the time of sale, as discussed in Section 3.3 of this chapter. For example, the MLS serving the Chicago metro area offers a field to indicate that an Illinois Home Performance gold or silver certificate is on file.
3.2.5. Energy Consumption Data Disclosure
Several jurisdictions have required homeowners and listing agents to provide recent utility usage data at the time of home sale. This information is relatively easy to collect and process, and it is instantly understandable to most homeowners. However, actual consumption data reflects only the former occupant’s behavior, so a home’s past energy consumption history may not provide an accurate indication of a new owner’s real costs or consumption.
As of early 2015, the following jurisdictions require disclosure of utility bills:
Chicago, Illinois
Montgomery County, Maryland
Alaska
Hawaii
New York State
Disclosure in each of these jurisdictions is mandatory, except in New York, where the buyer has the right to request the information. With the exception of Chicago (discussed below), each jurisdiction requires the information to be disclosed before the purchase contract is signed. The information to be disclosed varies: three months of usage in Hawaii, twelve months of utility usage in Montgomery County, and average annual energy usage in Alaska. (See Cluett and Amann 2013: 17.)
Chicago’s utility bill disclosure requirements are probably the most sophisticated in the country. The program, which originated in a 1987 ordinance that had been ineffective because disclosure was conducted by fax, enables real estate agents in the city to access a home’s annual and monthly gas and electric costs from an online database, and download a report to provide to homeowners. The information is gathered and prepared through the MyHomeEQ tool, and is available at the time of listing, so that the buyer can consider the data when choosing among properties and making an offer. (See Stukel et al. 2014: 10-309–311 and Cluett and Amann 2013: 18).
3.2.6. Indicators of Success
Indicators of success of labeling and disclosure programs, from the most basic to the most complex, are listed below:
Information about homes’ energy efficiency and/or energy-efficient features is available to the parties involved in home sale transactions.

32 www.seeaction.energy.gov September 2015
Homebuyers, real estate agents, appraisers, home inspectors, and other parties in the real estate transaction understand and can use the information provided to make decisions about the purchase and sale.
Homebuyers, given the information provided by the label can then value and set an “energy efficiency premium” which then is reflected by paying higher prices for more efficient homes.
Homeowners are more likely to make energy efficiency improvements in anticipation of their ability to recapture some or all of the value of their investment at the time of resale.
3.2.7. Implementation History and Actual Outcomes
Implementation of labels featuring asset-based scores and labels is still in the early stages in most states. As of 2014, in Oregon, about 3,000 existing homes had received an EPS by 2014, while 3,500 Massachusetts homes had received EPS scorecards and over 1,800 had signed contracts for insulation improvements (Faesy et al. 2014: 2-111).
Research on the price impact of labeling existing homes have been limited to date. Studies that indicate an energy efficiency premium were primarily conducted using data about newly constructed homes, largely because the existing data about existing homes does not yet permit rigorous analysis. Enactment of the policies designed to integrate information about efficiency into the real estate transaction will help to address this lack over time. And DOE is currently working on four studies in conjunction with partner organizations, including New Jersey Natural Gas, Focus on Energy in Wisconsin, NYSERDA, and the Colorado Energy Office to research the impact of scores.
Austin’s Energy Conservation Audit and Disclosure (ECAD) ordinance requiring audits was initially adopted in 2008. Initially, only 5.8% of the homes that received audits and recommendations were actually upgraded; a much lower conversion rate than the 25% that the authors of the legislation had anticipated because information was presented when a contract was signed, rather than at the time of listing. The ordinance was subsequently modified so that so that disclosure occurred at the time of listing rather than when a contract was signed, allowing buyers and sellers more time to factor in the results of the audit (Cluett and Amann 2013: 34).
The experience of utility consumption disclosure programs suggests that effort needs to be made to ensure compliance. A study of the “soft launch” of the Chicago program (i.e., a study of the program during the phase when it was advertised and adopted primarily through word of mouth, rather than advertised through programmatic outreach and/or training initiatives) found that only 13% of home listings opted to disclose energy costs online between July 2013 and December 2014. However, the same study found that the disclosure may affect the market: the home listings that disclosed energy consumption spent less time on the market, had higher closing rates, and sold for higher prices than comparable homes that did not. (The effect was more pronounced for attached than detached homes.) Whether and how this correlation indicates causality merits further study. (See Elevate Energy [n.d.] and Stukel et al. 2014: 10-312.)
3.2.8. Policy Design Considerations
Implementation: Labeling and disclosure policies do not roll themselves out: they require dedicated staff, and sometimes other resources. An ACEEE study makes the point with reference to a Santa Fe HERS rating disclosure program, which required hundreds of staff hours to implement (Cluett and Amann 2013: 12). Policymakers adopting these policies should ensure that adequate funds are available for program staffing and support, including monitoring and tracking, and data analytics capabilities, as discussed below.
49
Tracking and monitoring mechanisms: Most programs are still in the early stages of developing the information technology infrastructure necessary to track, monitor, and evaluate the success of their labeling and disclosure programs. In their 2014 study of disclosure policies, Cluett and Amann noted that none of the programs studied had developed full-fledged systems for determining the impact of disclosure on buyer reaction or sales price
49 Home Energy Labels: A Policy Playbook, published by Earth Advantage, provides useful guidance regarding the implementation of energy efficiency labels.

September 2015 www.seeaction.energy.gov 33
(Cluett and Amann 2013: 18–19). Several programs are making significant progress, however. In Chicago, Elevate Energy has been able to study trends related to the energy consumption disclosure based on data collected by the regional MLS service and MyHomeEQ. As discussed above, Colorado and Vermont are developing central databases for storing information related to the Home Energy Score, and Vermont is also exploring an ambitious overhaul of its data architecture to promote tracking and analysis as well as interoperability.
Stakeholder engagement: Engagement with stakeholders is very frequently crucial to the success or failure of labeling and disclosure policies. Opposition from real estate agents and other stakeholders has prevented adoption of mandatory labeling standards in a number of jurisdictions. Conversely, many of the successful efforts discussed in this chapter succeeded because stakeholders were involved throughout the process, and revisions were made to the legislation or ordinance on the basis of their feedback. In Chicago, for example, the Mayor’s office reached out to the local MLS data provider and the city’s major brokerages early in the process, and built enough support that the Chicago Association of Realtors eventually testified in favor of the project (Stukel et al. 2014: 10-311). Engaged stakeholders can support labeling and ordinance efforts in other ways: successful outreach to the Austin Board of Realtors during the development of the city’s mandatory disclosure law led to the real estate community taking an active role in the training and education necessary for the policy to succeed for example (see Cluett and Amann 2013: 10).
Timing of disclosure: It is important for the disclosure to be made early enough in the sales transaction to allow the potential buyer to factor the information into the purchase decisions, and the appraiser to incorporate the information into the opinion of value. The Austin ordinance, for example originally specified only that a home audit be completed and provided to the buyer prior to the sale, but this provision was later changed so that the audit has to be provided during the contract period, because the original provision allowed the audit to be made available so late in the process that the information could not be factored into the buyer’s offer, and/or incorporated into the appraisal and the mortgage underwriting (see Cluett and Amann 2013: 5, 8).
Vintage and aging: Now that some performance ratings having been in the market for a period of time, questions are beginning to emerge regarding how long a home’s score or rating remains valid. Homes that received HERS ratings when they were newly constructed have been entering the market, and some appraisers have recently questioned whether they can reasonably rely upon a score that dates back five or 10 years, as (still) being valid.
Data access: As discussed above, access to utility data can be a practical challenge for the implementation of policies that mandate disclosure of utility data. However, the experience of several jurisdictions suggests that these obstacles can be overcome, and, as an ACEEE study notes, a side effect of these policies can be to make utility data easier to access for all ratepayers (Cluett and Amann 2013: 18)
The history of the utility bill disclosure mandates demonstrates the challenges of program implementation. In theory, it could be easy for utilities to provide homeowners with bill data, but in practice most jurisdictions have had to work with the utilities to ensure that the data can be provided in a way that is consistent, simple to understand, and easy to access.
3.3. Integration with the Real Estate Market
3.3.1. Overview
Collecting and packaging information about a home’s energy efficiency and energy-efficient characteristics is a significant challenge. Simply generating this information is not enough, however. The participants in a home purchase transaction, including the listing agent, the buyer, the appraiser, and the lender, need to receive, understand, and make use of the information for an energy efficiency premium to be realized. In the absence of this transfer of knowledge, the work of generating information about a home’s efficient features may have no effect on the market, as illustrated by the findings of market research from several years ago:

34 www.seeaction.energy.gov September 2015
Prior to the residential market collapse, an unpublished independent market survey in Colorado for a homebuilder’s trade organization (Built Green) specifically targeted homeowners who had purchased a certified green home in the previous year. Of those purchasers, nearly 50% of respondents indicated they did not even know the home was certified…Moreover, the study found, purchasers said that the project sales staff had not presented the green certification as important. (Stovall et al. 2011: 3)
Integrating information about energy efficiency into the real estate transaction requires a mechanism to transfer information about the home—whether in the form of a label, information about the home’s characteristics, or billing data—to the parties in the transaction. The integration effort also requires training or education so that the information can be used appropriately and effectively.
Public policies can play a critical role in facilitating the transfer of information and supporting appropriate training of professionals in the real estate transaction.
Several of the programs discussed in the previous section on labeling and disclosure have effectively incorporated strategies for incorporating information into the real estate market. The Austin ECAD program, for example, effectively ensures that the audit will be provided to the potential buyer during the sales process. Similarly, the Chicago ordinance is designed to ensure that energy consumption data happens at the time of listing, by embedding fields for disclosure information in the software used by the listing agent. Even in these cases, however, real estate agents and other real estate professionals such as appraisers require training. And many of the other labeling and disclosure initiatives discussed above require even greater levels of integration with the real estate market.
3.3.2. Goals
Ensure that all parties to real estate transactions, including buyers, sellers, real estate agents, home inspectors, appraisers, lenders, and others, have easy access to information about a home’s relative energy efficiency.
Ensure that the information is provided in a form that can be readily understood and used in a real estate transaction and other contexts.
Ensure that the information is provided at a time that allows parties to a real estate transaction to use the information to make decisions about purchase, price, opinion of value, underwriting, and other issues related to the transaction.
Ensure that the professionals in a real estate transaction have the training and knowledge necessary to use information about energy efficiency.
3.3.3. Indicators of Success
The information is accessed at the time of real estate transactions.
The information can be adequately explained by real estate professionals to potential buyers.
The information can be used for all relevant aspects of the real estate transaction, including development of the opinion of value and the underwriting.
The information is used to make decisions about the transaction, such as the decision to purchase, the purchase price, and whether and how the seller makes specific improvements.
3.3.4. Policy Design
Several complementary policy strategies have been developed to disclose information about homes’ energy efficiency in the real estate transaction. They include:
Integrating information about energy efficiency into MLSs
Using national data standards and forms
September 2015 www.seeaction.energy.gov 35
Training real estate agents and appraisers
Each of these strategies is discussed below.
3.3.4.1.1 Integration with Multiple Listing Service
MLS databases store information about for-sale homes. They are crucial to real estate transactions because they are the primary repository of information about for-sale homes for real estate agents and buyers, as well as appraisers. Buyers who have access to information about a home’s energy characteristics as presented through the MLS database may choose the home over competing ones, and/or offer a higher price for the home because they value energy-efficient features. (On the other hand, if information about a home is not included in the MLS database, the absence of such energy data will almost certainly not affect the sale.) Accordingly, the policymakers, energy efficiency professionals, and members of the real estate community have been working for years to develop ways to ensure that information about energy efficiency is incorporated into MLS databases.
To effectively provide the correct information about energy efficiency, an MLS database needs to have a searchable field. These fields can contain different types of information, including:
A score (e.g., a Home Energy Score or a HERS rating) or certification (e.g. LEED for homes or ENERGY STAR Certified).
Specific home characteristics (e.g., a ground-source heat pump or R-49 attic insulation).
Energy consumption data (e.g., annual or monthly kWh or therms).
Real estate professionals note that all three types of information are valuable in the sales transactions, because they support the homebuyer’s thought process during the home purchase in different ways. The certification flags the property as being above-code and authenticated by a neutral third party. A score can provide a point of comparison with other homes. A list of the home’s energy-efficient characteristics will make a label more credible, may help buyers identify specific features that they value, and is particularly valuable for the appraisal process. Finally, the consumption data provides a reality check: do the improvements seem to make a difference in actual energy costs?
Over a decade ago, real estate agents and energy efficiency professionals began efforts to incorporate energy-efficiency-related fields in several MLS databases across the U.S. However, these efforts moved very slowly, because there are over 860 MLSs in the U.S., most of which are independently owned and operated. Convincing a single MLS to adopt fields related to energy efficiency required stakeholders to develop proposals, attend multiple meetings, and typically took months or years.
Several states and municipalities have demonstrated that public policy can be particularly effective in addressing this challenge. Colorado and the Midwest Energy Efficiency Alliance, for example, have developed state and regional approaches that have not only encouraged a number of MLSs to adopt energy-efficiency-related fields at the same time, but have also promoted standardization between MLS systems.
As discussed in Section 3.2 of this chapter, certificates that document energy efficiency improvements are particularly difficult to integrate into the real estate transaction because the upgrade may occur years before the home sale. The Illinois Home Performance program has taken a number of basic but important steps to address this challenge.
Illinois Home Performance engages program participants in multiple ways. The IHP website advises participants to share a copy of the certificate with their real estate agent when they put the home up for sale. The website also recommends asking the realtor to upload the certificate to the home’s listing on the MLS. In 2015, IHP will send postcards to participants offering to replace missing certificates and reminding them to tout efficiency features when they decide to sell their homes. (Stuart [n.d.] 7)

36 www.seeaction.energy.gov September 2015
3.3.4.1.2 Data Standardization
Data is central to disclosure policies. As discussed in Chapter 3, collecting and transferring energy-efficiency-related data has traditionally been expensive and involved logistical hurdles for states, municipalities, and programs. One indication among many of the data-related challenges involved in incorporating information about energy efficiency into real estate transactions is provided in the executive summary of a report commissioned by the Colorado Energy Office to quantify the contributory value of energy efficiency, if any, in the Denver residential market. The study found that:
Standardized documentation about energy efficiency appears to be in its infancy; thus, during this study and the valuation process, we ran into many challenges related to information gathering and sharing…In some of the case studies, this lack of data resulted in an inordinate amount of time dedicated to research and analysis…
Currently, the documentation about the level of energy efficiency noted in any particular home is a rare occurrence—even when energy efficiency is a relevant feature to that market area. Without a reasonable quantity of researchable data, it is not possible for an appraiser to develop a reliable, credible and market-supported opinion of value for energy efficiency. Additionally, the amount of time required to assimilate and dissect the data may be problematic for the typical residential assignment. (Desmarais 2015: 9-10)
To address this challenge, stakeholders in the real estate, appraisal, and energy efficiency industries have been working to develop and promote the use of national data standards. These standards are intended to enable significant quantities of data about the energy-efficient characteristics of a home that will allow energy efficiency to be captured, viewed, and analyzed by real estate professionals.
Over the past decade the Real Estate Standards Organization (RESO) has developed a national data dictionary for the real estate industry, which was recently expanded to include a number of energy-efficiency-related terms. The organization has also created a data transfer standard (the Real Estate Transfer Standard, or RETS). These resources provide a basis for communication among the real estate industry’s many different software systems, and a basis for incorporating information about energy efficiency into these communications.
The National Association of Realtors built on the RESO data dictionary infrastructure by issuing a Green MLS Implementation Guide (v. 1.0) in the spring of 2014 (NAR 2014). The Implementation Guide provides MLS and their vendors with guidance on how to integrate the data elements defined by the RESO Data Dictionary and RETS standards into MLS databases.
The appraisal industry’s most important contribution to standardization to date has been the Appraisal Institute’s Residential Green and Energy Efficiency Addendum (G&EEA). The Addendum was created to address the fact that the standard document for collecting appraisal-related information about residential buildings, the Uniform Residential Appraisal Report (Form 1004), does not include information about “green” or energy-efficient features. The G&EEA addresses this problem by providing a detailed schedule that appraisers can use to make a detailed inventory of the energy-efficient features of a home, including insulation, air infiltration rates, high-efficiency HVAC systems and other similar characteristics, as well as other features and equipment such as solar photovoltaic (PV) installations and water-saving devices. The appraiser can use the information collected in the G&EEA to develop the opinion of value. (See Appraisal Institute 2013, Adomatis 2013 and CNT Energy and National Home Performance Council 2013: 14.)
The energy efficiency industry has developed a national standard designed specifically to facilitate the flow of data from energy efficiency sponsors and programs to real estate professionals. The standard, BPI-2101-S-2013 (Building Performance Institute 2013), uses a national energy efficiency data dictionary and XML transfer standard (BPI-2100 and BPI-2200) as the basis for identifying a standard set of data elements used for describing the energy-efficient characteristics of a home. The standard is designed for use by energy efficiency programs, which can issue BPI-2101-compliant certificates that describe the home and any improvements made to it in terms of the data standard.

September 2015 www.seeaction.energy.gov 37
Stakeholders from the real estate, appraisal, and energy efficiency industries worked together to ensure that the data elements in the RETS data dictionary, the Appraisal Institute’s G&EEA, and BPI-2101 are aligned. As a result, the data that a program collects for a BPI-2101-compliant certificate is largely the same information required in the Appraisal Institute’s G&EEA, which in turn generally corresponds to the “green” and energy-efficient fields in the RETS data dictionary.
This alignment offers the potential for an easier, more rapid and less expensive data transfer. To date, the flow of information between the three sectors has mostly been the result of manual data entry: an appraiser taking a BPI-2101-compliant certificate and filling out the Appraisal Institute’s G&EEA with pen and paper, or a real estate agent manually entering the same information into an MLS database, for example. However, the data standards create the possibility of electronic data transfer, such that data from the program can auto-populate an Appraisal Institute’s G&EEA or flow directly into the MLS database. This strategy can provide much greater quantities of high-quality information to all parties involved in real estate transactions at a much lower cost than current methods. (For a more extended discussion, see CNT Energy and National Home Performance Council 2013: 15–16, 21).
3.3.4.1.3 Real Estate Agent, Appraiser, and Lender Training and Education
Getting information to real estate agents and appraisers through MLS databases and the Appraisal Institute’s G&EEA is crucial, but unless the agent or appraiser understands the information then the relevant energy data is essentially meaningless. To address this issue, a growing number of state, municipalities, and energy efficiency programs are developing training and educational strategies to ensure that the professionals in the real estate transaction fully understand the home’s energy-efficient features and can explain them to potential buyers and accurately incorporate them into the opinion of value. Because professional licensure for real estate agents and appraisers is overseen at the state level, licensing represents a policy opportunity for state policymakers. Training and education can be supported at both the state and local levels.
Education for real estate agents is often focused on providing a basic understanding of the principles underlying energy efficiency, the reasons that homebuyers may want energy efficiency homes, and types of energy efficient features commonly found. Appraiser training can take advantage of new methods designed to incorporate energy efficiency into the opinion of value. (For a comprehensive treatment, see Adomatis 2014.)
To date, lenders have generally been less engaged in energy efficiency than either real estate agents or appraisers. However, some policymakers have begun to explore ways to educate lenders and engage them in understanding the value of energy efficiency.
3.3.5. Implementation History and Actual Outcomes
3.3.5.1.1 Integration with Multiple Listing Service
Colorado: Over the past five years, the Colorado Energy Office has supported a sustained and extremely successful effort to incorporate energy efficiency into real estate transactions. The effort began with an initiative to identify, describe, and track high-performing homes through all of the state’s MLSs. The Office convened the MLS representatives and other stakeholders to identify a standard set of green and energy-efficient fields to be used throughout the state, and to develop a process for incorporating them into the MLSs’ respective databases.
50 The
CEO subsequently provided small planning grants totaling about $120,000 to help cover some of the MLSs’ IT costs associated with adopting the fields. By early 2015, all but one of the 18 MLSs in the state had adopted the fields.
(Stovall et al. 2011: 10–15; Stukel et al. 2014: 10-307–9; Peter Rusin, Colorado Energy Office, personal
communication, February 20, 2015.)
50 The fields included information about several major certifications, including HERS rating, ENERGY STAR new home certification, and LEED for Homes, as well as a few significant features such as solar PV and solar thermal. (See Stovall et al. 2011: 15.)

38 www.seeaction.energy.gov September 2015
This integration effort has effected real change in the way homes are marketed in Colorado. Almost 13% of new homes listed in Colorado MLS databases in 2012 included the word “energy,” compared to less than 2% four years previously. Use of “energy” as a term to describe existing homes tripled during the same period, but since the term had been used to describe less than 1% of the housing stock in 2008, the total proportion of existing homes that had energy mentioned in the listing was just over 2% of the total. (See Stukel et al. 2014: 10-309.)
3.3.5.1.2 Data Standardization
Colorado: To complement its work in getting MLS databases to accept energy efficiency data, the Colorado Energy Office worked with stakeholders to provide the information to populate the Appraisal Institute’s G&EEA. As a result of liability concerns, the state has facilitated the creation of a separate form for real estate agents that mirrors the Addendum’s data fields. Colorado’s central database can populate this form, which real estate agents can use during the sale. (Peter Rusin, Colorado Energy Office, personal communication, February 20, 2015.)
Vermont: As discussed in the previous section, Vermont has designed an energy efficiency label for existing residential homes that focuses on MMBtu per square foot, but provides a wealth of additional information. To ensure that the certificate is used during home sales transactions, the Vermont Energy Investment Corporation is redesigning its data architecture to conform to national energy efficiency data standards (BPI-2100 and BPI-2200) with the goal of being able to transfer detailed, BPI-2101-compliant information from a range of data collection tools to a central database, and from the database to the local MLS database.
NYSERDA in New York, APS in Arizona, and the Local Energy Alliance Program based in Charlottesville, Virginia, are also exploring auto-population of the Appraisal Institute’s G&EEA and export of program data directly to local MLS databases.
3.3.5.1.3 Real Estate Agent, Appraiser, and Lender Training and Education
In conjunction with its efforts to integrate energy efficiency into MLS databases, the Colorado Energy Office has also played an active role in developing strategies to train appraisers and real estate agents. As the green fields were being incorporated into MLS databases, the CEO provided some support to train real estate agents. Since then, two slides on the green and energy-efficient fields in the state’s MLS databases have been integrated into the state’s annual real estate update course, ensuring that every real estate agent in the state will eventually understand them. The Colorado Energy Office is now taking on an issue that has been a concern within the real estate community nationally by developing training and tools for selling poor-performing homes.
A number of other states, municipalities, and utilities, including Build It Green in California, Earth Advantage in Oregon, the Midwest Energy Efficiency Alliance, and Georgia Power, have developed or sponsored real estate agent and appraiser training.
3.4. New Trends and Recommendations
This section briefly outlines several newly emerging trends related to labeling, disclosure, and integrating energy efficiency with the real estate market. These trends are too new to be characterized as full-fledged efforts, but policymakers may find it useful to follow them as they develop.
This section also provides a brief set of policy recommendations that draws from and refers to the examples described above.
3.4.1. Required Disclosure of Energy-Efficient Features
Kansas and South Dakota require new home builders to indicate whether the home was built to 2006 International Energy Conservation Code, information that is particularly relevant in these states, because neither has adopted a statewide energy code. South Dakota also requires the builder to provide information about specific energy-efficient features of the home, such as the R-value of the insulation. Although these initiatives only apply to new homes, in South Dakota legislation that would have required disclosure of the home’s energy-efficient features at

September 2015 www.seeaction.energy.gov 39
the time of sale was considered but ultimately not adopted. This latter approach would complement energy assessment disclosure policies such as those in Berkeley and Austin, as well as efforts by Home Performance with ENERGY STAR program sponsors to generate certificates of completion, in that the information generated through these programs can be used to satisfy this type of disclosure requirement, while solving the problem of incorporating this information into the real estate market.
3.4.2. Incorporating Renewable Energy into Certifications and Labels
In some regions of the country, residential solar PV panels have become commonplace. Given this prevalence, it would make sense for home energy labeling systems to take solar PV into account. The EPS label already addresses this issue, and other labeling and certification systems are exploring it.
3.4.3. Mapping Energy-Efficient Homes
Chicago-based Elevate Energy (formerly the CNT Energy) has worked with real estate industry partners to develop maps that identify the locations of certified high-performing homes, e.g. homes built to ENERGY STAR or LEED standards or improved with a Home Performance with ENERGY STAR upgrade. The maps are powerful visual tools to demonstrate to real estate professionals that an inventory of efficient homes already exists in a given market. Elevate Energy has already mapped Vermont, Virginia, and other states, and is willing to explore working with partner organizations to map other areas.
3.4.4. Appraiser Competency
Technically, the secondary market entities overseen by FHFA require that an appraiser must be competent to conduct the assignment. This requirement has been interpreted to mean that an appraiser could not be assigned to appraise energy-efficient home unless they have the training to complete the Appraisal Institute’s G&EEA and incorporate the information into the opinion of value. This requirement would enhance the value of training on energy efficiency, and would promote appropriate valuation of efficient homes. To date, the regulation has largely been unenforced. (For a more detailed discussion of this issue, see CNT Energy and National Home Performance Council 2013: 27–28.)
3.4.5. The SAVE Act
The Sensible Accounting to Value Energy (SAVE) Act, proposed federal legislation, provides a different and potentially transformative approach to disclosure. The Act would:
Update appraisal and underwriting guidelines for mortgages “issued, insured, purchased, or securitized by FHA and other federal mortgage loan insurance agencies or their successors.”
Offset costs in debt-to-income by anticipated energy savings.
Add the present value of anticipated energy savings to loan-to-value ratio.
Offer additional consumer information.
3.5. Recommendations
Invest the necessary resources to develop robust data collection, tracking, and analysis systems (Examples: Colorado, Chicago, Oregon, and Vermont, which have all made and/or planned significant investments in data systems.)
Create a system for voluntary labeling that makes an existing home’s energy efficiency and energy-efficient characteristics visible in the real estate transaction. (Examples: the labeling approaches used in Connecticut, Colorado, Oregon, Massachusetts, and Vermont.)

40 www.seeaction.energy.gov September 2015
To the greatest extent feasible, ensure that any labeling systems developed have as much relationship or comparability with other state, regional, and/or national labeling systems as possible. (Examples: the Colorado, Oregon, and Vermont experiences in striking a balance between the Home Energy Score and the MMBtu rating.)
Explore use of energy consumption disclosure, either as a stand-alone requirement or in conjunction with a label. (Examples: experiences in Chicago; Hawaii; and Montgomery County, Maryland.)
Design labeling and other disclosure policies in ways that encourage homeowners to take action on the basis of the information provided in the label or disclosure. (Examples: the Austin, Colorado, and Vermont programs.)
Develop state or municipal policies for integrating energy efficiency into the real estate system by encouraging collaboration between MLSs and other stakeholders to add common energy-efficiency-related data fields to MLS databases.
Promote data standardization and use of national data standards, including BPI-2101, RETS, and the Appraisal Institute’s G&EEA, whenever possible in all work related to energy efficiency policy. (Examples: Colorado, New York, and Vermont.)
Leverage training and state licensure requirements to ensure that real estate agents, appraisers, and other real estate professionals have adequate training in residential energy efficiency. (Examples: Colorado, Georgia Power.)
3.6. Reference Materials
3.6.1. Key Documents
Policymakers interested in developing labeling, disclosure, and real estate integration strategies will probably find the following documents particularly helpful for providing overviews of the issues involved and offering specific policy recommendations.
Overviews: Cluett and Amann 2013 provides a comprehensive, detailed description of the universe of the mandatory rating and disclosure policies in effect across the U.S. as of 2013. The report also provides a more cursory review of voluntary labeling strategies.
Case studies: Faesy et al. 2014 provides an overview of volunteer labeling initiatives in Connecticut, Massachusetts, Oregon, and Vermont, including a detailed discussion of the issues and trade-offs involved in developing labels.
Stukel et al. 2014 provides two case studies focusing on mechanisms of disclosing information about homes in Chicago and Colorado
NASEO 2014 provides an overview of recent state-level labeling initiatives and summarizes lessons learned from the experience of these programs to date.
How-to guides: Earth Advantage (n.d.), a report and set of recommendations for developing labeling strategies, makes a number of specific recommendations based on extensive research with stakeholders throughout the Pacific Northwest.
CNT Energy and National Home Performance Council 2013 provides a step-by-step guide for integrating information about energy efficiency into the real estate transaction that focuses on documentation of energy efficiency measures, getting information to real estate agents and appraisers, and supporting high-quality training.

September 2015 www.seeaction.energy.gov 41
3.6.2. Online Resources
3.6.2.1.1 Appraising
Appraisal Institute’s Residential Green and Energy Efficient Addendum (G&EEA)
http://www.appraisalinstitute.org/assets/1/7/Interactive820.04-ResidentialGreenandEnergyEffecientAddendum.pdf
YouTube video describing the G&EEA Addendum
https://www.youtube.com/watch?v=o9mBR_cEPS4
Blog on G&EEA
https://adomatis.wordpress.com/2013/03/12/appraisal-institute-green-and-energy-efficient-addendum-update/
3.6.2.1.2 Real Estate
National Association of Realtors Green MLS Implementation Guide
http://greenresourcecouncil.org/sites/default/files/2014%20NAR%20Green%20MLS%20Implementation%20Guide.pdf
3.6.2.1.3 Scoring Systems
U.S. DOE Home Energy Score
http://energy.gov/eere/buildings/home-energy-score
Energy Performance Score
http://www.energy-performance-score.com
HERS Index
https://www.resnet.us/hers-index
3.6.2.1.4 Data Standards
Building Performance Institute Data Standards
http://bpi.org/standards_approved.aspx
3.6.2.1.5 Labeling and Disclosure Initiatives
City of Boulder
https://bouldercolorado.gov/plan-develop/green-building-and-green-points-program
City of Berkeley Building Energy Saving Ordinance
http://www.ci.berkeley.ca.us/EnergyOrdinanceUpdate/
Illinois Home Performance Certificate
http://www.illinoishomeperformance.org/certificate

42 www.seeaction.energy.gov September 2015
LABELING AND DISCLOSURE CONSIDERATIONS
Design of a label for existing homes requires a number of choices about the information to be generated and conveyed. One reason why the market currently features a number of approaches to labeling is that there is no obvious “best” solution for many of these issues: policymakers will need to make choices that involve trade-offs, for example, between accuracy and cost. Similarly, the strategies for communicating the label or other information about the home’s energy performance require difficult choices, for example the disclosure choice between a “mandatory label” design approach and a “voluntary label” design approach.
Mandatory vs. voluntary disclosure: One fundamental issue regarding policies focused on disclosing label information is whether they should be voluntary or mandatory, i.e. whether homeowners should be required to provide information about their home at time of sale or some other time. Mandatory approaches have been appealing to many experts, but to date only a few policies requiring disclosure have been enacted.
Legal authority: Municipalities that choose to require disclosure must ensure that they have the legal authority to do so. In general, “home rule” states grant municipalities’ broad authority over policy, but states without home rule give cities authority only over policy issues identified in the state constitution or deemed necessary for the functioning of the community. Cities in these states may need authorization from the state to pass mandatory disclosure ordinances (see ACEEE 2014: 3).
Information provided: The most fundamental question regarding labeling policy is what to include on the label. A score or rating is a common choice, but some labels choose to provide information about the home’s energy efficiency characteristics to motivate efficiency improvements. Some labeling approaches are now incorporating additional information into the label, ranging from the home’s estimated carbon footprint to information about water consumption, transportation costs, and/or indoor air quality.
Operational vs. asset: If an energy label contains a score or rating, or other information about the home’s energy consumption, the policymaker has a choice as to whether the information is operational or asset-based.
An operational label provides a measure of a home’s actual consumption as indicated by utility/fuel bills or metered data, which is relatively simple and inexpensive to obtain and is simple for consumers to understand. The disadvantage is that the information contained in such reports is highly dependent on occupant behavior, as well as other factors such as weather, and may not provide a good indication of how the home would perform if ownership (or occupancy) changed.
An asset label, by contrast, provides an estimate of a home’s energy consumption based on its physical characteristics, independent of occupant behavior and fluctuations in weather.
51 Because occupant behavior can
have a considerable impact on a home’s total energy consumption, many experts consider an asset rating to be a more appropriate basis for a labeling system. However, an asset rating requires modeling, which requires data about the home and will always have some degree of inaccuracy.
52
The merits of occupational and asset labels has been energetically debated among energy efficiency experts. Many professionals have expressed a preference for asset labels because they remain consistent over time and allow comparison between homes by appraisers.
53 However, the increasing availability of devices capable of tracking a
home’s energy consumption at extremely short intervals and at the level of the device has recently generated new interest in operational labels. If presented appropriately (i.e., in a way that the consumer can easily understand), the two approaches are not mutually incompatible, and some experts have recommended incorporating both into
51 An asset rating is often compared to the miles-per-gallon rating, which indicates a car’s efficiency under laboratory conditions. The actual mileage per gallon will vary, depending on the driver, the driving conditions, the car’s maintenance, and other similar factors.
52 The issue of modeling accuracy has been debated among energy efficiency professionals for years. A great deal of time and money has been spent developing modeling tools, which may yield quite accurate results in the aggregate. Results for any specific home, however, may be off as a result of the large number of factors that can affect consumption and the challenges of collecting data about all of them.
53 For example, the first recommendation in Earth Advantage’s Home Energy Labels policy playbook is that the label be “objective,” which is defined as meaning asset-based (Earth Advantage (n.d): 8–9).

September 2015 www.seeaction.energy.gov 43
labeling systems (for example, see Nadkarni and Michaels 2012: 8, as well as discussion in Cluett and Amann 2013).
Site vs. source: The most simple and intuitive measure of a home’s energy consumption is the energy, in MMBtu or kWh, that the home actually consumes on site, as indicated by electric or gas meters or by bulk fuel bills. However, the processes of generating, transmitting, and distributing energy to the home themselves also consume energy. A label that indicates a home’s source energy consumption calculates not only the consumption at the home (“behind the meter”), but also the consumption involved in getting the energy to the meter in the first place. Source energy may be a more relevant consideration for policymakers interested in greenhouse gas reductions, but research indicates that consumers find site energy more relevant and easier to understand.
Granularity: Different scoring and labeling systems provide different levels of granularity. Several states, including Vermont, Massachusetts, and Oregon, are implementing labels that indicate annual energy consumption in MMBtu, which typically shows a range of 50 to 150. Similarly, the HERS index uses a scale that runs from zero to the high 100s. The Home Energy Score, by contrast, uses a simple 10-point scale. More granularity provides an opportunity to draw more subtle differences between homes, but may be more difficult for consumers to understand, and may suggest false precision.
Price: Labels that include asset ratings or scores can be expensive, although the price varies significantly depending on the approach. HERS ratings may cost $500 to $1,000 or more if provided on a market basis, although utility rebates can lower the cost significantly for homeowners in some areas. Utility bill disclosure, by contrast, can be relatively inexpensive. The EPS and Home Energy Score, discussed below, were both designed in part to provide an accurate but less expensive asset score than the HERS rating: in some jurisdictions the Home Energy Score is now being provided for $75 to $100 (Joan Glickman of the U.S. Department of Energy and Gannate Khowailed of SRA International, personal communication, February 24, 2015; Peter Rusin, Colorado Energy Office, personal communication, February 20, 2015).
Comparability: Many of the existing home labels do not translate easily into one another, or to the labeling system for new homes. The HERS index indicates the home’s relative efficiency on a per-square-foot basis, for example, while the Home Energy Score compares homes based on their total energy consumption. Energy consumption data reflects operational usage, while most scores and ratings are asset-based. Systems for translating one labeling system into another to allow for comparison, for consumers or researchers, is desirable: this goal has proved difficult to achieve, but recently there are some indications that progress is being made, as discussed in the policy design section below.
Timing of disclosure: Disclosure laws and ordinances frequently require that information be disclosed at a particular point in time. The most common point is at the time of sale or, less often, rental: this gives the buyer or renter information to make an informed decision. If disclosure if required at time of sale, it is important to specify the point in the transaction: time of listing versus contract signing, for example. Less often, disclosure is required at a specified time—annual benchmarking disclosure requirements, for example. For new homes, time of permitting is another potential opportunity for disclosure that has yet to be used. (For a more detailed discussion of disclosure timing options, see Cluett and Amann 2013: 4–5.)
Privacy: Disclosure makes public information about a home. It is important for policies to be designed to consider privacy at the time that information about energy efficiency is made public. Pathways to allow homeowners to opt in or opt out may be important in developing consumer support for disclosure initiatives.
Access to data: A number of the disclosure strategies discussed in this chapter depend on utility data about a home’s energy consumption. In practice, accessing clean, accurate data that is usable in a sales transaction or for comparing homes can be challenging, an issue discussed in more detail in Chapter 3. Policymakers implementing labeling and disclosure policies that depend on utility data can work to ensure that the local utilities have or can develop the capacity to provide the necessary data in an appropriate format and a timely manner.

44 www.seeaction.energy.gov September 2015
The Case for Energy Data: Driving Home Performance with Standards and 4.Access
4.1. Introduction
Unlike other energy resources, energy efficiency cannot be measured directly: it can be quantified only through comparison between actual energy use and an estimate of the energy use that would have occurred in the absence of an energy efficiency measure (i.e., measuring “negawatts” rather than kilowatts). There are established methods for measuring, verifying, and evaluating the impact of residential energy efficiency improvements and actions, however, the process is challenging and requires high-quality data. The lack of accessible, low-cost, high-quality data is one of the most significant challenges preventing the energy efficiency industry from growing to scale.
Specifically, estimation or quantification of energy savings typically requires information about the home’s baseline condition, the energy efficiency measures installed, and the home’s energy consumption before and after the upgrade, as well as information about external factors such as seasonal weather patterns and large-scale economic trends. These requirements sound relatively straightforward, but in practice it has proved difficult to systematically collect and analyze this data in an efficient manner. To date, very few stakeholders in the residential energy efficiency industry—program sponsors, program administrators, contractors, or others—have a good, clean, standardized set of data that allows correlation of post-retrofit changes in energy consumption with specific energy efficiency measures implemented in the home.
If this data—home baseline conditions, energy efficiency improvements, and consumption data—could be collected at a low cost for all or most projects, it would allow more accurate and rapid quantification of energy savings, which in turn would:
Provide consumers with better information about their energy consumption to help them make smart energy decisions.
Allow utilities to make better forecasts about contribution of energy efficiency to meeting energy and capacity needs.
Improve the confidence in energy efficiency savings predictions, thereby reducing the risk in financing energy efficiency improvements.
Allow for the sale or integration of energy efficiency in voluntary carbon, capacity, environmental compliance, and other emerging markets by increasing buyer confidence in energy savings.
In general terms, there are three major challenges to collecting the data that allows energy efficiency to be quantified:
The first challenge concerns the limitations of getting consumption data. If a home energy retrofit is completed independent of a utility program, it can be very difficult to access the data, thus limiting program design and scope. This can be addressed through data access policies. This is the subject of Section 4.2 of this chapter.
The second challenge involves the costs of collecting data associated with energy efficiency upgrades. At present, energy-efficiency data is expensive for both contractors and programs to collect, analyze, and disseminate. Strategies to reduce these costs could allow significantly more and better quality data to be gathered. This subject is addressed in Section 4.3 of this chapter.
The third challenge—addressed in Section 4.4—involves the difficulties involved in comparing and analyzing non-standardized upgrade-related data. At present, the data collected about energy efficiency measures is typically specific to a particular program, and is not easily comparable to data about upgrades
September 2015 www.seeaction.energy.gov 45
in other areas. Without standardization in this area, it is almost impossible to develop approaches to quantification that would allow energy efficiency to be monetized.
The chapter concludes with a discussion of the way that data access and data standards policies can create a basis for new evaluation, measurement, and verification (EM&V) protocols for residential upgrades. EM&V is the foundation for better quantification, which is the key to realizing the full potential of energy efficiency as a resource. Inexpensive, high-quality, accessible data could revolutionize EM&V and, if combined with interval data from advanced metering infrastructure (AMI) and “smart” devices, programs could quantify the impact of energy efficiency measures with a high degree of precision.
4.2. Access to Energy Data
Contractors and programs need consumers’ energy consumption data for a number of purposes, including modeling (e.g., for “calibrating” models to actual energy consumption) and EM&V. Monthly billing data is sufficient for many of these purposes, but the interval data generated by AMI
54 devices creates new opportunities for energy
efficiency. Accessing any of this data—either monthly or interval—rapidly, easily, and cost-effectively in an electronic format, however, is challenging.
While some states and public utility commissions (PUCs) have worked to advance consumer access to their energy information, utilities generally do not release the energy data that they collect and manage outside of the monthly bill. A written customer request is generally required to release data, and that request often has to be made on paper, typically using a form provided by the utility. This makes it difficult for a third party to obtain data on behalf of a customer.
Access to accurate, detailed data is also a necessary precondition to expand markets for energy efficiency. Both capacity and carbon markets rely heavily on measured savings, and meter data is crucial for accurately measuring these savings. As discussed above, data from smart devices such as thermostats and some newer appliances can complement meter data to provide even more detailed and reliable energy savings estimates. Many of the potential benefits of smart meter deployment have yet to be realized because the parties that could use the data do not have access to it. Only two states (Texas and California) and the District of Columbia allow direct access to the meter or access via third parties. Accessing this data will be important to understanding overall energy usage and savings.
54 “AMI” refers to the full measurement and collection system that includes meters at the customer site; communication networks between the customer and a service provider, such as an electric, gas, or water utility; and data collection and management systems (http://www.ferc.gov/EventCalendar/Files/20070423091846-EPRI%20-%20Advanced%20Metering.pdf).

46 www.seeaction.energy.gov September 2015
Figure 3. Utility data access map Source: OpenEI, http://en.openei.org/wiki/OpenEI:Utility_data_access_map
4.2.1. Policy Designs
Providing access to utility data is crucial to the future of residential energy efficiency. Utilities, smart device companies, and energy analysts are realizing that a new generation of residential energy users have grown up with smart devices and tools, and expect to be able to manage their money, their dinner reservations, their workouts, and their home’s energy use from a phone or tablet. Policies need to keep up with the technological pace of new homeowners, and use this love of technology to help save energy.
SEE Action’s Customer Information and Behavior Working Group addressed the different approaches being pursued by policymakers in December 2012 in their report A Regulator’s Privacy Guide to Third-Party Data Access for Energy Efficiency. The report notes that state PUCs and legislatures have generally taken the following approaches to data access: “(1) no explicit policy in place, (2) adopted consent requirements that apply to third parties under contract to the utility, (3) customer consent required for certain uses, (4) policies for access to aggregated data” (SEE Action 2012). The SEE Action report lists eight states as having adopted statues or regulations governing third-party access to data: California, Colorado, Oklahoma, Oregon, Texas, Vermont, Washington, and Wisconsin. However, other states including New York and Illinois are actively engaged in efforts to determine what kind of data access they will pursue at the state level.
An overarching policy design obstacle that policymakers must first address is privacy and security concerns. While energy efficiency advocates have noted that many of these concerns are overstated with regard to customer utility data and that some proposed scenarios were somewhat absurd (e.g., break-ins by thieves using publicly available

September 2015 www.seeaction.energy.gov 47
utility data to determine if anyone is home), the concerns did need to be addressed and all agreed that customers must consent to sharing their utility data.
In January 2015, DOE released Data Privacy and the Smart Grid: A Voluntary Code of Conduct, which recommends “high level principles of conduct for both utilities and third parties”; the aim is for utilities and third parties to adopt the code to mitigate concerns related to privacy and security (DOE 2015b).
4.2.2. Implementation History
4.2.2.1.1 Federal Efforts to Improve Data Access
In 2012, the White House launched the national Green Button Initiative to begin addressing the obstacle of inefficient and difficult data access. Green Button is a way for utility consumers to receive easy, secure access to their energy usage information in a consumer- and computer-friendly format: as a “Green Button” on a utility’s website that allows consumers to access and download their information. As of March 2014, over 70 utilities and energy suppliers have committed to participate (Green Button, 2014). Utilities and energy suppliers are projected to provide 30 million households in 17 states
55 and the District of Columbia with access to their energy use
information.
However, progress in providing customers with access to Green Button data has been slow, as utilities remain unconvinced about the benefits of sharing consumer energy data and have little incentive to undertake the effort. Out of the 38 utilities that have committed to participate, only 23 have implemented the initiative thus far (Green Button, 2014). Other obstacles include state privacy and liability laws that prevent customers from sharing their data with third parties, such as contractors (Tweed, 2012). Security concerns and the absence of a federal framework for safe data access also present a hurdle, which is discussed later in this chapter.
In addition to the Obama administration’s Green Button Initiative, Congress has also taken steps to address data access issues. In the 111
th Congress, Rep. Ed Markey (D-MA) introduced H.R. 4860, the Electric Consumer Right to
Know Act, or “e-Know Act.” The purpose of e-Know is to require utilities to make energy consumption data available to their customers or to a customer’s third-party designee, which could be a contractor, energy management company, or smart grid technology provider, among others.
Sen. Mark Udall (D-CO) introduced a similar bill (S.1029) in the 112th
Congress with Sen. Scott Brown (R-MA). In the 114
th Congress, Sen. Markey introduces S.1044, the “Access to Consumer Energy Information Act” or “E-Access
Act,” which directs DOE to release voluntary guidelines to encourage open access to electricity data and to establish model standards for implementation of retail electric energy information access in states. Rep. Peter Welch (D-VT) introduced this bill in the House.
A key aspect of data access policy is the ability for customers to allow third parties, such as energy management services firms, to access their consumption data. A third-party contractor may use a customer’s consumption data as part of an energy efficiency upgrade to help the customer make informed decisions about where to target improvements. A contractor may also show the customer how to understand and use smart meter data, which may result in energy-saving behavior.
A person paying for energy has the right to access their energy data. State legislatures and PUCs can work with utilities and the private sector to ensure that data access is not a barrier to either technological innovation or increased energy efficiency.
55 Arkansas, California, Illinois, Indiana, Kentucky, Louisiana, Maryland, Massachusetts, Michigan, North Carolina, Ohio, Oklahoma, Pennsylvania, Tennessee, Texas, Virginia, and West Virginia.

48 www.seeaction.energy.gov September 2015
4.2.2.1.2 State Leadership to Advance Utility Data Access
Regulated gas and electric utilities, and their state commissioners, have not turned a blind eye to energy use data—particularly because the smart grid can help utilities achieve regulatory energy efficiency and demand response goals, reduce customer service costs, and generate new revenue opportunities, among other benefits. To increase customer support and trust, many utilities have started to develop strategies to educate customers about smart meters.
California has been a policy leader in empowering consumers with access to their electricity usage data. In September 2010, California became the first state to adopt comprehensive privacy rules for customer smart meters (California State Senate 2010). Existing state law prohibited electric and gas utilities that are regulated by a state utility commission from using customer data for any commercial purpose, unless authorized by the customer. However, the law permitted the commission to conduct pilot studies with customers from each utility or electrical corporation to determine the relative value to ratepayers of information, rate design, and metering innovations using approaches specified by the law. The 2010 law repealed the provisions related to pilot studies, prohibiting a utility or electrical corporation from sharing a customer’s gas and electrical consumption data (except in aggregate), or other personally identifiable information, with a third party without prior consent of the customer. A utility using AMI that allows a customer to access their consumption data must provide access to data without requiring the customer to agree to share their data with a third party. Moreover, utilities are prohibited from selling consumption data. If a utility contracts with a third party that allows a customer to monitor their electricity usage, the third party must disclose their intention to use consumption data for secondary commercial purposes to customers, if relevant.
These provisions do not apply to utilities or electrical corporations that are using customer consumption data in aggregate and without personally identifiable information for analysis, reporting, and program management purposes, or to utilities that contract with a third party to implement energy efficiency or demand response programs.
Since 2010, California has enabled some consumers to access real-time home area network data directly from the smart meter, and obtain their data through utility Web portals through implementation of Green Button. Green Button Connect
56 is also being adopted in a limited market. Enabling features for sharing data, like those included
in Green Button Connect, is critical to realization of the demand-side benefits for consumers, as discussed above. Access to data is a precursor to the development of new energy savings devices and the ability for consumers to better understand their energy usage. The old adage “You can’t manage what you don’t measure” is true here, as consumers have neither the tools nor the information to act efficiently. Mission: Data (a new coalition of companies that support access to consumer data and technology innovation fueled by access to granular energy usage data) is driving development of much more powerful energy management tools for consumers, offering novel means to manage their energy use and save money. For example, the California Energy Commission’s Resolution E-4527 establishes a framework for the enablement of 600,000 Home Area Network (HAN) devices before the end of 2013, and an unlimited number of HAN activations beginning in this year (Murray 2014).
How does access to meter data support home performance? Access to real-time data allows new devices to interpret smart meter data to identify the energy used in the home at specific times, with some devices disaggregating the data to give more granular detail about each energy-using device in the home. This plethora of energy data can in some cases provide direct recommendations to consumers—such as adjusting your thermostat to save money, upgrading your refrigerator and other appliances to ENERGY STAR, upgrading your pool pump, etc.
In 2013, San Diego Gas & Electric (SDG&E) launched a program to incentivize customers to buy and install HAN devices to link them to the ZigBee radios inside their smart meters (St. John 2013). This creates a smart meter–to–home connection, which allows homeowners to monitor their energy use directly, rather than relying on the utility
56 California has been one of the only states to move forward with Green Button Connect via the Consumer Data Access proceeding D.13-09-025.

September 2015 www.seeaction.energy.gov 49
to provide data. With these devices, and the direct communication they create, homeowners can receive energy data updates as often as several times a minute, much faster than updates coming from the utility itself.
But California is not the only state acting on data access. Illinois, with widely deployed smart meters, was petitioned by the Citizens’ Utility Board and the Environmental Defense Fund to open a docket on a so-called Open Data Access Framework. The framework states three principles (Munson 2014):
The customer as the principal owner of home energy consumption data, and the utility as the guardian of such data
Customers could have access to their electricity consumption data—in machine-readable formats—in as short intervals as possible, with 15-minute intervals recommended, but never in intervals greater than one-hour.
Utilities could provide data as quickly as possible to customers—real-time if accessed directly from the smart meter, or within an hour if through the internet.
This framework could make Illinois the first state that requires utilities to adopt, at a minimum, a national standard data access protocol that mirrors Green Button Connect.
The Colorado PUC has been engaged since 2013 in amending the rules affecting both electric and gas utilities to require that customer data be accessible to a third party if designated by the state. In the PUC Code of Regulations that governs access to customer information, the amended rule states (Colorado PUC 2014: 3026(d)):
As part of basic utility service, a utility shall provide access to the customer’s standard customer data in electronic machine-readable form, without additional charge, to the customer or to any third-party recipient to whom the customer has authorized disclosure of the customer’s data. Such access shall conform to nationally-recognized open standards and best practices. The utility shall provide access in a manner that ensures adequate protections for the utility’s system security and the continued privacy of the customer data during transmission.
While the Colorado PUC continues to review this regulation, the trend is toward openness.
In March 2013, NV Energy, with DOE’s support, published a handbook to inform utilities about how to develop a smart meter deployment approach that works.
57 The approach is based on the experiences that ComEd, NV
Energy, and SDG&E have had with running successful campaigns to create a “neutral-to-positive customer experience” during their smart meter deployments. In other words, according to the handbook, if a customer’s first experience with smart meters is negative, then they are more likely to distrust the smart meter system and to push back against AMI. The DOE also held a series of peer-to-peer workshops with utilities between 2011 and 2013 to exchange experiences with customer engagement.58 These workshops led to the development of a customer engagement guide that summarizes the key points that emerged from these sessions.
One of the most exciting efforts related to data access is in New York, where the State Energy Plan is underway. The draft 2014 plan states that “to fully realize the benefits of a more competitive market, consumers will need access to transparent data that will enable them to make more informed decisions and markets to work more efficiently and effectively” (New York State Energy Planning Board 2014)
59. Initiatives 10 and 11 in Volume I of the
plan call for “access to energy-related data to support customers’ ability to make educated decisions about clean and efficient energy investments.” The final plan and its implementation could be groundbreaking for data access state policy.
57 http://www.smartgrid.gov/document/nv_energy_smart_meter_deployment_handbook.
58 http://www.smartgrid.gov/Voices .
59 http://energyplan.ny.gov/Plans/2014.aspx.

50 www.seeaction.energy.gov September 2015
4.2.3. Indicators of Success
While the promise of data holds many potential opportunities, there have yet to be comprehensive studies to demonstrate the impacts of access to interval meter data. In theory, the more consumers have access to their data, the more entrepreneurial software and technology companies will learn to help homeowners manage their data, and develop tools for utilities and energy programs to measure and monitor the data. With AMI still in progress, and the most innovative policies in their infancy, claiming victory over energy data is pre-mature. However, we anticipate that success will include:
New technology innovations to measure and display data for homeowners.
New software innovations to analyze, share, and transmit data in useable formats.
Increased homeowner demand for home energy management systems and energy information.
Consumers who know their monthly energy usage as common as their bank account balance.
Selling, banking, and trading energy saving “negawatts” in capacity and carbon markets.
Wifi functionality for all energy-using devices in the home, letting them share data with a monitoring system. “Dumb devices” will go the way of the VCR and the cassette deck.
While these indicators are futuristic, the demand for standardized measurement and the use of data for evaluations and monetization is happening today.
4.3. Data Standardization
4.3.1. Goals
Data standardization is important for the residential energy efficiency industry for four reasons:
It provides programs with a quantifiable basis to advocate for significantly reduce transactional costs.
It provides a basis for effective communication among multiple software systems, and thus multiple organizations or firms.
It can support an infrastructure for quantifying energy efficiency more easily, rapidly and accurately, as discussed later in this chapter.
It allows better research on the impacts of specific energy-saving measures.
The collection, transfer, and analysis of data is currently difficult and expensive for most of the stakeholders involved in residential energy efficiency, including contractors, program administrators, and researchers.
Contractors who participate in energy efficiency programs are typically required to collect and report data about homes’ baseline conditions and energy efficiency measures they install, along with financial data such as audit and measure cost, financing methods, and/or their own administrative costs. The tools that the program provides to the contractor for collecting this data typically impose significant time burdens. Examples of specific challenges include:
The contractor is required to submit data through a low-tech, labor-intensive data collection process such as paper forms.
The contractor is required to enter data into a software tool prescribed by the program for reporting and/or modeling, and then enters much of the same data into other software for business purposes.
The contractor works with multiple programs (e.g. programs sponsored by different utilities), each of which requires different data reporting requirements and tools.
Program administrators face problems and significant expense collecting, storing, and analyzing data. The data that programs receive from contractors is often incomplete and/or poor in quality, in large part as a result of the

September 2015 www.seeaction.energy.gov 51
limitations of the contractors’ tools, as discussed above. The development of the administrative IT systems necessary to store and analyze is typically an expensive and lengthy process that does not always yield the results programs anticipate. As a result, many programs have struggled and invested considerable resources to accomplish necessary IT-related tasks such as quantifying or verifying energy savings resulting from their programs. Programs also have related difficulties in transferring their data to other entities they conduct business with, such as real estate professionals or federal agencies.
Researchers face problems with analyzing data from a single program, because the data is typically inconsistent, incomplete, and of poor quality. These problems are compounded when the research involves data from multiple programs, as the data from each program is not fully comparable to the data from other programs.
Data standardization offers a way to address these problems by advancing four interrelated improvements:
Data standards will significantly reduce data collection, management and migration costs by reducing the need to “reinvent the wheel” each time new IT systems or tools are developed.
Data standards allow the development of “off-the-shelf” solutions that can be customized at a relatively low cost.
Data standards facilitate communication between software systems (and, by extension, different entities) on an industry-wide basis by providing a common vocabulary and transfer protocol.
Data standards create the basis for better analysis by improving the quality and comparability of data within and across programs.
4.3.2. Policy Design(s)
During the past five years, private sector stakeholders and the federal government have launched several complementary initiatives to support data standardization in the energy efficiency industry.
The Building Performance Institute (BPI) has developed a suite of data standards designed to reduce the costs of data collection and transfer. These include:
BPI-2100, “Standard for Home Performance-Related Data Transfer.”
BPI-2200, “Standard for Home Performance-Related Data Collection.”
BPI-2101, “Standard Requirements for a Certification of Completion for Residential Energy Efficiency Upgrades.”
Several additional “use case” data sets currently under development
BPI-2200 and BPI-2100 (often referred to as “Home Performance XML” or “HPXML”) provide a data dictionary and a standard protocol for transferring data from one software system to another, respectively. The data dictionary (BPI-2200) creates a common “vocabulary” for the residential energy efficiency industry, and the data transfer protocol (BPI-2100) provides a basis for communication between software systems.
One of the most significant opportunities for programs and contractors to realize cost savings lies in the use of standard data sets associated with specific “use cases”—that is, specific interactions involved in implementation of an energy efficiency program, such as the assessment (or audit), job completion, quality assurance, or EM&V. These standard data sets are subsets of the overall standard data dictionary (BPI-2200) and can be transferred according to the XML protocol in BPI-2100. The significance of the standard use case data sets is that they allow software vendors can develop off-the-shelf solutions that can be used by multiple programs.
BPI-2101 is the first “use case” data set to be developed by BPI. It identifies a standard set of data about home energy upgrades that programs can transfer to MLS databases. (BPI-2101 utilization is also discussed in Chapter 3).

52 www.seeaction.energy.gov September 2015
BPI is currently developing standard data sets for several of the other use cases listed above, including energy efficiency assessment (or audit), reporting on a completed job, and EM&V.
One particularly interesting potential use for standard data sets is improving national or regional EM&V protocols for quantifying the savings from energy efficiency measures. The present state of EM&V involves quantifying energy efficiency savings well after the fact, typically on the basis of a relatively small number of installations. In the case of whole house upgrades, the impact of specific measures is not always captured. Data standardization can support more accurate and less expensive EM&V by providing more detailed data about upgrades that, combined with more energy consumption data, would allow more rapid and precise quantification of the savings resulting from the entire upgrade and from specific measures such as envelope tightening or installation of new HVAC equipment.
DOE and LBNL have developed a data standard, the Building Energy Data Exchange Specification (BEDES), which provides a data dictionary for both residential and commercial buildings. The organizations that have developed BEDES and the BPI data standards have worked together to ensure that the two standards are aligned, so that the BPI standards are essentially a subset of the BEDES data dictionary focused on the residential retrofit industry.
Standards are only useful to the extent that they are adopted, and their value increases the more broadly they are adopted. States can play an important role in promoting adoption, either through mandates or through encouragement and incentives. Vermont’s experience (described in more detail below under “Implementation History”) in particular suggests a path that states can use to promote data standardization.
It is important for programs to understand that data standards do not require complete uniformity. Even if a jurisdiction or program uses a standard data set, for example, modest changes can still be made without significantly affecting the cost savings associated with adopting the standards.
4.3.3. Indicators of Success
The immediate indicators of success of the implementation of the BPI and/or DOE data standards should include one or more of the following:
Easier and more rapid reporting from contractor software tools into energy efficiency program databanks.
Coordination between multiple programs that allows contractors to use a single software tool and generate a single report when working with several programs.
Consistent, high-quality data about home energy upgrades.
The more significant, longer-term impact of data standards implementation should be cost reductions:
Programs should see lower costs because vendors can deliver a standardized product at lower cost.
Contractors should see lower costs associated with data collection and reporting.
Finally, data standardization should lead to data that is comparable between programs and jurisdictions, resulting in more accurate and detailed evaluations of the effectiveness of programs and energy efficiency measures, and richer research more generally.
4.3.4. Implementation History
Data standards implementation is still in its early stages because the data standards themselves are new: BPI-2100 and BPI-2200 were completed in 2013, BPI-2101 was completed in 2014, and the new BPI “use case” standards and the BEDES specification are still being finalized. However, at this point, several states have implemented the standards, with promising, if preliminary, results described below.

September 2015 www.seeaction.energy.gov 53
Arizona-based electric utility, Arizona Public Service (APS) pioneered the use of the BPI data standards to transfer data from multiple software tools to a central program. The APS Home Performance with ENERGY STAR® program had required participating contractors to use a single modeling tool. Contractors had expressed strong interest in being able to choose a tool that best met their business needs; APS decided to meet this demand by allowing contractors to use any tool that met minimum modeling accuracy criteria and could transfer two standard data sets—one describing the home’s baseline as indicated by the home energy assessment, one describing the home after the energy efficiency measures had been installed—via HPXML to the APS program database.
NYSERDA and California’s Pacific Gas & Electric (PG&E) utility are now implementing similar initiatives, using the same standard data sets used by APS, with minor modifications. One of the modifications made by PG&E, for example, requires that contractors provide data about pool pumps. NYSERDA has also developed a plan to generate a BPI-2101-compliant certificate and transfer select data from the certification information into MLS databases.
Vermont’s approach to data standardization, which builds on these efforts, provides a potential model for state data standardization. As discussed in Chapter 2, in 2013 the state legislature created a framework for voluntary labeling through Act 89. The framework encouraged the state’s four energy efficiency programs, run by Efficiency Vermont, Vermont Gas, NeighborWorks of Western Vermont, and the state’s weatherization assistance program, to deliver a common certificate. In response, a cross-industry group of stakeholders developed an approach that encourages each program to develop the capacity to deliver a certificate that includes site energy, an asset-based indication of the home’s energy consumption (expressed in MMBtu), a Home Energy Score, and a list of energy efficiency improvements in a format consistent with BPI-2101. DOE’s Home Energy Score tool is used to generate the MMBtu number, as well as the Home Energy Score itself. (For more details, see Vermont Energy Labeling Working Group 2013.)
Because each of the Vermont energy efficiency programs uses a different software tool for modeling and data collection, the BPI data standards provide an important mechanism for collecting the data necessary to generate the MMBtu estimate and the Home Energy Score. Vermont stakeholders are currently finalizing the process by which the data will be collected, used to generate a Home Energy Score, and incorporated into a BPI-2101-compliant certificate that displays the home’s energy consumption in MMBtus and the Home Energy Score as well as detailed information about the home.
To date, the main applications of BEDES have involved use of the SEED (the Standard Energy Efficiency Data) platform. SEED is an open-source database, sponsored by DOE, which cities, states, or other entities can use to:
Map and import data from multiple sources
Analyze data
Generate reports
The SEED platform is free, and users are encouraged to customize their instance to meet their needs. Specific instances of SEED databases are controlled by their owners and the data contained in them is private.
SEED is currently being used primarily for benchmarking commercial buildings. Several municipalities with mandatory commercial benchmarking programs, including Austin, New York City, San Francisco, Seattle, and Washington, D.C., helped to test the SEED platform, which was then refined and improved based on their experience. To date, all the applications have focused on large commercial and multifamily properties.
4.3.5. Actual Outcomes (as per Indicators)
Because implementation of the data standards is still in the early stages, there is relatively little data on implementation outcomes. The initial experience of APS’s Home Performance with ENERGY STAR program, which is one of the first programs to implement the BPI HPXML data standards, indicates a real value. The program has

54 www.seeaction.energy.gov September 2015
reported an average 31% reduction in administrative time after switching to the HPXML data standards, as well as a marked increase in contractor satisfaction with the program.
NYSERDA, which has implemented a similar approach on a more limited basis, has received positive feedback from the contractors who have been able to use new modeling tools as a result of implementation of the BPI data standards.
4.3.6. Policy Considerations
Although data standardization can reduce a program’s IT costs, the cost of overhauling data architecture can still be considerable. Good data systems are not easy to set up, and this is particularly true when data needs to be transferred and shared among multiple parties, such as contractors, program administrators, utilities, state energy offices, real estate agents, and others.
60 Implementation of data standards also takes time, particularly when an
existing program’s data infrastructure must be transitioned over to the standards without disrupting day-to-day operations.
A reliable approach is for programs to implement data standards in phases which include an overall plan broken into a number of discrete, manageable steps that yield specific results. The HPXML Implementation Guide (DOE [n.d.]) provides detailed recommendations for developing an implementation plan based on the following steps:
Set goals
Incorporate stakeholder feedback
Identify data needs
Procure/modify program management systems
Design a data validation process
Implement testing protocols and user training
Develop a quality management plan
Another opportunity to keep costs low is to encourage the adoption of data standards when a program is launched and is first developing data infrastructure, and/or when the program significantly overhauls its data architecture. Since IT costs will be incurred anyway at these points; use of the data standards will not increase those costs, and may even reduce them.
Some stakeholders have recommended that implementation of data standards be seen as similar to code implementation: a long-term, market transformation activity that yields lasting benefits.
Vermont’s experience emphasizes the significance of stakeholders in the process. The plan for the certificate and use of the data standards was developed in consultation with representatives from the energy efficiency programs, the state, the PUC, contractors, and real estate agents. This process was crucial for developing support for the certificate, data standards, and implementation strategies to develop the data architecture necessary for this initiative.
4.4. The Data Use-Case: Evaluation, Measurement, and Verification
Quantifying the energy savings from energy efficiency measures implemented in individual homes has historically been a challenge because the savings are often small relative to the home’s total consumption, and because the impact of energy efficiency measures is difficult to distinguish from changes in energy consumption resulting from building occupancy. Reducing the transactional costs associated with accessing utility consumption data would
60 Program administrators may want to take into account Hofstadter’s Law, which suggests that a complex IT project will always take longer than expected, even when Hofstadter’s Law is taken into account.

September 2015 www.seeaction.energy.gov 55
allow more programs to conduct billing analysis, resulting in greater accuracy in quantifying the energy savings from individual homes.
4.4.1. The History and the Emergence of New and Innovative Policy Designs
States currently use a range of different EM&V protocols for determining reduction in energy and carbon consumption through energy efficiency measures, including approaches that involve “deemed” savings, whole-building energy modeling, and bill/consumption analysis. This diversity of methodologies has historically given states flexibility in meeting their needs. However, an increased need for rigor of evaluation methods is emerging as states are looking to use their energy savings as part of a compliance path for carbon regulations or to develop models that deliver measured rather than deemed or predicted savings.
The new generation of smart residential energy efficiency measurement technologies creates a need for new EM&V protocols. Ideally, a range of EM&V protocols would provide options for verifying savings using utility bill analysis, advanced meter data, and credentialed predictions from approved energy modeling tools. While deemed approaches are a useful tool in some cases, the energy efficiency industry would be well served by the development of robust EM&V protocols based on use of pre-retrofit consumption data and, in the case of billing analysis, post-retrofit consumption data. The Uniform Methods Project recommends the use of pre- and post-consumption data in its protocol for whole buildings. However, the protocol does not explore the additional opportunities that are available with the finer-grained data that may come from interval meters (Agnew and Goldberg 2013) and is silent on the use of home energy management systems to further disaggregate that data.
Over the past several years there have been, and continue to be, significant advances in methods to measure and predict energy savings. As noted above, the residential energy efficiency industry has developed a set of EM&V protocols, produced by ANSI-accredited organizations. In a recent test, a large state-regulated program sponsor applied these protocols to actual whole-house program data; the program realized predicted savings at a rate of 90%.
61 While these standards have gained consensus, they have yet to be incorporated into the state-level
technical resource manuals that guide the implementation of energy efficiency programs by regulated utilities.
Policymakers have an opportunity to promote emerging EM&V protocols that can demonstrate improvements in the quality and accuracy of savings whole house predictions. By leveraging existing tools, software accreditation systems, and data aggregation technologies, greater consistency in predicted and realized savings can be established. A move to real and verifiable savings, with data to support the results, is absolutely critical to assist states in planning their initiatives.
There is also significant work underway to advance EM&V protocols that use actual billing data to create a type of energy efficiency “meter,” measuring actual savings achieved (Hastings et al. 2014). To support EM&V protocols that use billing data, it is important that policies be in place that would allow for easy, rapid, and inexpensive transfer of utility data to program sponsors, aggregators, and others who may be assigned to undertake the EM&V of a program. The data access mentioned in the chapter, and the policies the states are pursuing would lead to this important level of granularity.
61 NYSERDA PSD Ex-Post Application of BPI-2400 Standard to Senate Committee - http://psdconsulting.com/improving-accuracy/.
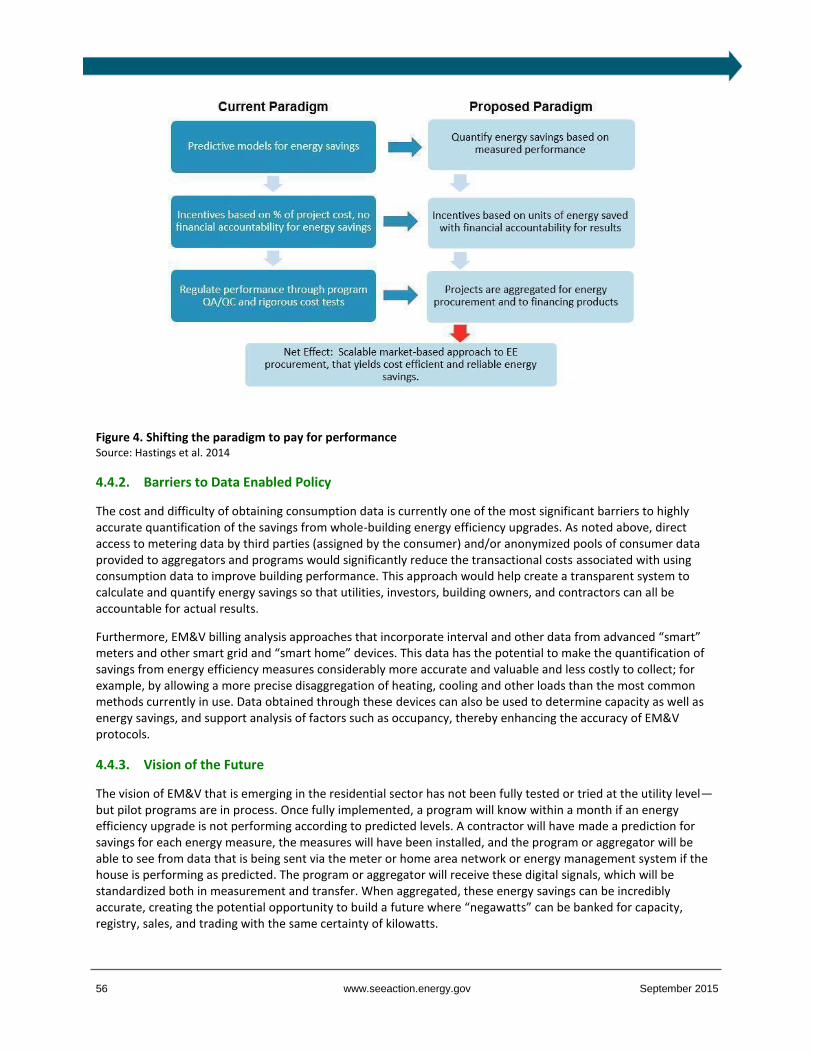
56 www.seeaction.energy.gov September 2015
Figure 4. Shifting the paradigm to pay for performance Source: Hastings et al. 2014
4.4.2. Barriers to Data Enabled Policy
The cost and difficulty of obtaining consumption data is currently one of the most significant barriers to highly accurate quantification of the savings from whole-building energy efficiency upgrades. As noted above, direct access to metering data by third parties (assigned by the consumer) and/or anonymized pools of consumer data provided to aggregators and programs would significantly reduce the transactional costs associated with using consumption data to improve building performance. This approach would help create a transparent system to calculate and quantify energy savings so that utilities, investors, building owners, and contractors can all be accountable for actual results.
Furthermore, EM&V billing analysis approaches that incorporate interval and other data from advanced “smart” meters and other smart grid and “smart home” devices. This data has the potential to make the quantification of savings from energy efficiency measures considerably more accurate and valuable and less costly to collect; for example, by allowing a more precise disaggregation of heating, cooling and other loads than the most common methods currently in use. Data obtained through these devices can also be used to determine capacity as well as energy savings, and support analysis of factors such as occupancy, thereby enhancing the accuracy of EM&V protocols.
4.4.3. Vision of the Future
The vision of EM&V that is emerging in the residential sector has not been fully tested or tried at the utility level—but pilot programs are in process. Once fully implemented, a program will know within a month if an energy efficiency upgrade is not performing according to predicted levels. A contractor will have made a prediction for savings for each energy measure, the measures will have been installed, and the program or aggregator will be able to see from data that is being sent via the meter or home area network or energy management system if the house is performing as predicted. The program or aggregator will receive these digital signals, which will be standardized both in measurement and transfer. When aggregated, these energy savings can be incredibly accurate, creating the potential opportunity to build a future where “negawatts” can be banked for capacity, registry, sales, and trading with the same certainty of kilowatts.

September 2015 www.seeaction.energy.gov 57
4.5. Conclusion
Both access to utility data and the use of national data standards enhance the ease and quality of reporting, provide programs with the ability to aggregate and compare results across programs and states, enable more rapid and accurate EM&V protocols, and reduce the overhead of providing energy efficiency service companies. Considerable public and private investments have already been made in smart meter installation, HEM advancements, and implementing national data standards. The promotion of these policies and standards will assist in the regulation of programs, in setting and improving program performance benchmarks, and in continuous improvement of the accuracy of savings predictions.
4.6. Additional Information and Resources
4.6.1. Data Standards Resources
Building Performance Institute Data Standards
http://bpi.org/standards_approved.aspx
Standard Energy Efficiency Data (SEED)
http://energy.gov/eere/buildings/standard-energy-efficiency-data-platform

58 www.seeaction.energy.gov September 2015
Utility System Opportunities and Challenges 5.
5.1. Introduction
Policymakers who seek to increase the energy efficiency initiatives within their states or municipalities can consider policies that engage the utility system to procure energy efficiency as a resource. Regulated utilities are mandated to meet the energy needs of their customers, and energy efficiency is often the most cost-effective way to meet these needs. However, the utility system’s predominant economic model does not always give utilities the appropriate market incentives and financial mechanisms to consider energy efficiency as a resource.
Policymakers can play an important role in developing a market context that provides utilities with appropriate, market-based incentives and requirements (“carrots and sticks”) that will achieve all cost-effective energy efficiency opportunities, while meeting the needs of all stakeholders, including utilities, ratepayers, and program customers. Specifically, policymakers can establish a regulatory framework that requires and incentivizes utility investment in all energy efficiency sectors, including residential.
The regulatory framework can be modified through policies that accomplish three specific goals:
Mandate that utilities procure energy efficiency through an energy efficiency resource standard (EERS) or through a requirement to procure all cost-efficient energy efficiency.
Address utilities’ disincentives and lack of incentive to produce energy efficiency through decoupling and financial rewards.
Implement best practices in designing cost-effectiveness tests and ensuring that tests are appropriately aligned with the state’s policy goals.
5.2. Energy Efficiency Resource Standards
5.2.1. Goals
If a state or municipality seeks to rapidly increase residential and other energy efficiency programs, one of the most effective policy tools available is an EERS.
62 These policies require utilities to meet a percentage of their
customers’ energy needs by supporting increases in their customers’ energy efficiency over a multi-year period. EERS have proved extremely successful at driving investments in energy efficiency: states that have them have far more energy efficiency savings than states that do not (Downs and Cui 2014: 16). EERS have also encouraged utilities and other stakeholders to view efficiency as a resource for meeting energy and capacity needs.
All EERS have required utilities to create and offer end-use energy efficiency programs, including residential sector programs.
5.2.2. Policy Designs
EERS are typically enacted as state legislation and are administered by the state’s PUC. The key features of a successful EERS include the following four principles:
Targeted at the utility regulated sector: The EERS identifies energy efficiency as a resource for meeting utility customers’ energy needs, to be procured by the utility like other resources.
Mandatory: The EERS establishes binding energy efficiency targets that utilities must meet.
Long-term: Energy efficiency savings are required over a number of years.
Adequately funded: The EERS must identify a funding mechanism(s) sufficient to enable the utilities to meet the required goals.
62 EERS are also known as Energy Efficiency Portfolio Standards (EEPS).

September 2015 www.seeaction.energy.gov 59
EERS often require a utility to achieve a percentage of savings over a baseline of its total sales, from either a previous year’s sales or projected future sales. Annual targets of 1% or 2% of the established baseline sales are common, although a ramp up to 2% to 3% annually is often necessary to meet mandates for all cost-effective efficiency. Annual targets are sometimes coupled with longer-term cumulative targets, such as 15% or 20% savings over a 20-year period. A slightly different approach establishes a target amount of energy saved (e.g., a certain number of GWh per year) with reference to a baseline.
The long-term goals associated with an EERS send a clear signal to market actors (i.e., stakeholders) about the importance of energy efficiency in utility program planning, creating a level of certainty that encourages large-scale, productive investment in energy efficiency technology and services (Gilleo et al. 2014: 15).
Several other policy approaches have effects that are similar to and can complement an EERS. These include:
Requiring utilities to procure all cost-efficient energy efficiency savings.
Establishing utility-specific binding long-term energy efficiency savings targets, rather than for all utilities together.
For the purposes of its annual ranking of energy efficiency programs, ACEEE considers these policy approaches as equivalent to an EERS once multi-year targets have been established, provided that the four principles listed above are incorporated into the policy design (Gilleo et al. 2014).
63 This Guide makes the same assumption.
5.2.3. Indicators of Success
The indicators of success for an EERS are relatively straightforward, and include:
The establishment of ambitious but realistic goals that can be achieved through cost-effective energy efficiency measures.
Provision of funding necessary to achieve these goals.
The creation of utility programs and initiatives that achieve quantified and verified savings equal to or greater than the levels specified by the EERS.
These goals apply equally to alternative approaches to driving energy efficiency procurement, such as an “all cost-effective requirement.”
5.2.4. Implementation History
The first state to enact an EERS was Texas, which in 1999 passed legislation requiring annual savings of 10% of load growth. By 2008, seven states had EERS in place. Since then the number of EERS has grown rapidly: as of April 2015, 24 states are implementing a mandatory EERS. (ACEEE 2015).
The savings levels required by these EERS vary significantly. Texas, despite having passed the first EERS, has maintained low annual targets that amount to approximately 0.1% of total electric sales. Other states require more ambitious targets: six states, for example, have passed EERS that mandate electric efficiency savings totaling 2% or more of total sales from 2013 onward, including Massachusetts (2.6%), Arizona (2.4%), Maryland (2.4%), Rhode Island (2.4%), New York (2.1%), and Vermont (2.0%.). Another 13 states require annual electric savings during the same period between 1% and 2% of total sales. (See Downs and Cui 2014: 12.)
63 Not all studies use ACEEE’s definition. For example, LBNL’s survey of drivers of energy efficiency spending does not consider Renewable Portfolio Standards that allow energy efficiency to count towards total goals because none of the existing policies establish mandatory targets specifically for energy efficiency (see Barbose et al. 2013).

60 www.seeaction.energy.gov September 2015
Only 15 state EERS require gas savings targets, and when they do, the targets are often lower than the electric targets: ranges between 0.5% and 1.5% of annual sales are most common (Downs and Cui 2014: 12).
5.2.5. Actual Outcomes
EERS have had a tremendous impact on the growth of the energy efficiency sector. Production of energy efficiency typically ramps up significantly after a state passes an EERS. To date, most states that have approved an EERS have reached or exceeded their targets. An ACEEE study found that:
In 2012 15 states met or exceeded their electricity savings targets, and 6 others came within 90% of their savings targets for the year. Only one state met less than 80% of its target (Downs and Cui 2014: iv).
Significantly, the states achieving their targets include those with the most ambitious EERS. In 2012, Massachusetts and Vermont achieved savings of greater than 2% of total sales, and several states, including Arizona, Rhode Island, Minnesota, Colorado, Oregon, and California, achieved savings near or above the 1.5% level.
Expressed in kWh and therms, these savings can be significant. In Massachusetts, for example, savings have been driven the Green Communities Act of 2008, which requires utilities to acquire all cost-effective savings. After the second three-year planning cycle mandated by the act ends in early 2016, the savings from electric utility programs will reduce the state’s energy consumption by 6,617 GWh per year, and will reduce summer electric peak load by 614 MW (5% of total peak load) (see Hibbard et al. 2014: 9–10).
Although many commissioners and other stakeholders have expressed concerns about rates, the Massachusetts experience suggests that consumers will not experience dramatic rate increases. For example:
GCA [Green Communities Act] electric EE programs, while funded at a cost to consumers, also save consumers money in two ways. First, the level of EE funded through the GCA EE provision is significant enough to lower regional power demand, thereby lowering the price of power in wholesale markets. Those price reductions affect prices paid by all consumers in Massachusetts and across New England, not just those who install energy efficiency measures in their homes or buildings (i.e., the EE program participants). Second, those consumers that do participate in the EE program (and typically make some level of investment to install EE measures) get the additional benefit of consuming less electricity and therefore save on their monthly electricity bills (Hibbard et al. 2014: 10).
Projections indicate that the Massachusetts Green Communities Act programs, , which include both renewable and efficiency initiatives, will result in lower wholesale prices, which will in turn result in a modest increase in rates averaging about 70 cents per month per consumer (Hibbard et al. 2014: 5).
At the national level, ACEEE found that states with EERS had mandated a total of more than 18 million MWh in savings for 2012, and achieved savings of more than 20 million MWh—about 85% of total U.S. energy efficiency production in 2011 (Downs and Cui 2014: 16).
A 2013 LBNL study of potential growth in energy efficiency identified EERS as the major driver of energy efficiency production through 2025.
64 Specifically, the study estimated that EERS could drive $5.3 billion in utility investments
in energy efficiency by 2025, which is significantly more than the investments driven by integrated resource planning or demand-side management planning (Barbose et al. 2013: 19).
5.2.6. Policy Design Considerations
One significant challenge in establishing and implementing an EERS involves quantifying the energy savings resulting from efficiency measures. Quantifying savings has often posed challenges for utilities, given the inherent difficulty of measuring energy efficiency. In some jurisdictions, the savings claimed by a utility have been challenged by stakeholders.
64 Including all-cost-effective mandates and Renewable Portfolio Standards that include energy efficiency as an allowable resource.

September 2015 www.seeaction.energy.gov 61
To address these challenges, policymakers can ensure that transparent EM&V procedures are established, understood, and agreed on by all key stakeholders. Current EM&V procedures, such as the Universal Methods Project protocols, can establish savings with a high degree of accuracy. New “smart” technologies, including both advanced metering infrastructure (AMI) and consumer-oriented home energy management systems, offer additional ways to increase accuracy while significantly lowering costs. (For a more detailed discussion of this issue, see Chapter 3.)
Accurate quantification of savings not only ensures that the utility is meeting its targets, but also helps commissions and utilities integrate energy efficiency as a resource for meeting a wide range of needs, including energy, capacity, and transmission and distribution (T&D) requirements.
More generally, stakeholders may choose to be engaged in the development of an EERS. Utilities should have an opportunity to comment on the components of an EERS, such as the targets, time frame, and cost-effectiveness tests required. Many states have created formal stakeholder advisory groups to ensure consistent, high-quality input, engagement, and buy-in throughout the implementation of the EERS.
5.3. Solving the Throughput Incentive and Utility Incentives
One of the obstacles to successful implementation of an EERS—and utility sector-generated energy efficiency more generally—is the way that utilities are traditionally compensated. Investor-owned utilities (which provide approximately 75% of the energy in the United States) are highly regulated. Their compensation, which can be a matter of considerable public scrutiny, is typically structured on models developed in the middle of the twentieth century, when regulators sought to encourage investments in generation, transmission, and other physical assets. This financial model creates disincentives for utilities to invest in energy efficiency. And even if these disincentives are addressed, utilities are not necessarily motivated to invest in efficiency in the same way that they are motivated to build new power plants or construct new T&D infrastructure.
U.S. utilities face significant financial disincentives under traditional regulation in pursuing aggressive energy efficiency goals that limit the interest of shareholders and managers. Both are concerned that the pursuit of aggressive energy efficiency savings will result in reduced utility revenues, affecting the utility’s ability to fully recover its fixed costs and ultimately increasing the likelihood that the utility under-achieves its authorized return on equity (ROE), and limited opportunities to expand rate base thereby foregoing earnings-generating investments (Satchwell et al. 2011: 1).
Accordingly, the success of energy efficiency policies in general, and EERS in particular, will be significantly shaped by the extent to which utility incentives can be restructured. Three measures are required to appropriately realign utility incentives to promote energy efficiency savings, which are:
Cost recovery: Allow the utility to recover expenses related to administering energy efficiency programs.
Decoupling: Address the utility’s traditional disincentive to invest in energy efficiency and traditional motivation to increase sales and avoid sales reductions.
Utility incentives, including rewards and penalties: Provide financial motivation for utilities to achieve and exceed energy efficiency goals.
Because most states have established effective program cost recovery mechanisms, this section focuses on decoupling and utility incentives.

62 www.seeaction.energy.gov September 2015
5.3.1. Goals
5.3.1.1.1 Decoupling
Under the traditional model, the more energy a utility supplies, the more revenue it will generate. A commission establishes rates that are based (in simplified terms) on dividing the utility’s “revenue requirement”—that is, its costs and a fair rate of return on its investments, by the quantity of energy that the utility is forecasted to supply Once rates have been established, they do not change until the next ratemaking case.
This model gives the utility a strong financial incentive to maximize its sales between rate cases, because unit revenues are generally higher that incremental unit costs. Because energy efficiency decreases energy consumption, it correspondingly reduces the utility’s total revenues and rate of return, which creates a disincentive for utilities to invest in energy efficiency.
Decoupling policies are designed to sever utility compensation away from a focus on the volume of energy that a utility supplies to its customers. Decoupling mechanisms are developed to adjust utility rates and account for the difference between actual and projected sales. Decoupling also prevents the utility from realizing a surplus when sales exceed projections.
5.3.1.1.2 Utility Incentives
Even if disincentives are addressed, utilities still lack incentives to invest in energy efficiency. Utilities are typically allowed to earn a return on investments in generation, transmission, distribution, and other capital projects, but not on operating expenses. Because energy efficiency is usually considered an operating expense rather than a capital investment, utilities are incentivized to choose supply-side or T&D projects over energy efficiency investments.
To address this issue, a number of states have developed policies that provide utilities with the opportunity to generate additional revenues by successfully implementing energy efficiency programs. The policies vary considerably in their specifics, but typically attempt to link the amount of the incentive with the quantity of energy saved.
5.3.2. Policy Design
5.3.2.1.1 Decoupling
Decoupling involves periodic adjustment of rates to ensure that a utility earns a fixed, predetermined revenue sufficient to cover expenses as well as a set return on investments. The rate adjustment may be an increase or a decrease, depending on whether the energy used by utility customers was more or less than projected. As a result, customers will periodically experience rate increases or decreases. Decoupling typically does not affect rate design, only the rate itself.
Some states have instituted “full” decoupling; designed to better align the utility’s actual revenues with their revenue requirement and in consideration of the energy efficiency investments. Other states have chosen a more limited approach by decoupling only certain aspects of the utility’s operations, such as the effects of weather, reduced usage by existing customers, or the impact of reduced sales from energy efficiency. In general, the “limited” decoupling is more complex to calculate and administer (see RAP 2011: 11–13 for more details.).
The frequency of rate adjustments varies: some decoupling approaches true up rates every month, some annually. New York State makes decoupling adjustments only when the accumulated balance (whether surcharge or refund) reaches a certain threshold. Many states cap the annual adjustment, and make up the rest at a future time so that the impact on consumers is spread out over time.
When developing a decoupling mechanism, policymakers must decide whether the utility’s rate of return should be lowered on the grounds that decoupling reduces the utility’s risk by shielding the utility from losses related to

September 2015 www.seeaction.energy.gov 63
changes in its volume of sales. Some states have reduced the utility’s rate of return by 50 basis points (0.5%); some have chosen not to adjust the rate, and some have selected numbers in between, with 10 basis points (0.1%) being the most common. (See Morgan 2013: 14–15 for a discussion of this issue.)
For a more detailed discussion of other policy considerations involved in the development of a decoupling mechanism, see RAP 2011 and Morgan 2013: 11–12.
Some states use a lost revenue adjustment mechanism (LRAM) as an alternative approach to address the traditional disincentive for utilities to invest in energy efficiency. Such a mechanism allows utility to recover revenues lost as a result of implementation of energy efficiency programs. The LRAM approach is more limited than decoupling because it does nothing to reduce the utility’s overall incentive to increase sales and resist sales reductions. LRAM also requires precise quantification of energy efficiency savings, which may be difficult or expensive for some utilities to achieve. (See Hayes et al. 2011: 3.)
5.3.2.1.2 Utility Incentives
States have developed three general approaches to incentivizing utilities to create energy efficiency:
Shared benefits
Performance targets
Rate of return on program spending
The shared benefit approach is the most common incentive. Shared benefits are typically based on the difference between the cost of generating the energy efficiency and the value of energy savings, as indicated by avoided energy costs. A range of other considerations, such as locally specific valuations or consideration for hard-to-quantify benefits, are often taken into account in the calculation of total benefits (Hayes et al. 2011: 11). Most states place a cap on the incentive that can be paid out; in 2011 ACEEE found that the average incentive cap was 11% of total net benefits.
Performance targets, another relatively common incentive, are often expressed as a percentage or amount of energy saved, and the incentive is often a percentage of total program spending. Targets may be tiered such that the incentive changes according to the utility’s success in meeting energy efficiency savings goals. In its 2011 survey, ACEEE found that performance target incentives were capped at between 4.4% and 12% of total program spending. This approach requires a less intensive accounting for savings than some of the other methods.
A third incentive involves paying a utility a return on its investments in energy efficiency. This approach makes utility investments in efficiency similar to investments in other resources, at least to the extent that it is possible to generate a return on equity for each. In practice, however, these incentives structures are rare: A 2011 ACEEE study identified only two states —Nevada and Wisconsin — that employed this policy approach. In Wisconsin, the utility is allowed to earn the same rate of return on some investments in energy efficiency as it does on other capital investments; in Nevada, the rate of return is based on the utility’s debt-to-equity ratio and capitalized costs (Hayes et al. 2011: 11).
5.3.3. Indicators of Success
5.3.3.1.1 Decoupling
The most basic indicator of success of decoupling is that utilities are made whole for losses resulting from lower-than-projected sales and, conversely, do not benefit from higher-than-projected sales.
A second indicator of success—important but more difficult to quantify—is a shift in utility leadership’s attitudes regarding energy efficiency, such that they no longer view efficiency as incidental to the utility’s core business and/or detrimental to its bottom line.

64 www.seeaction.energy.gov September 2015
Technically, the success of a decoupling mechanism is measured by the extent to which it keeps the utility’s revenues closely in line with costs, reducing the risk of large rate increases or decreases.
5.3.3.1.2 Utility Incentives
One basic indicator of a utility incentive’s success is the extent to which it results in increased production of energy efficiency. A second related indicator is the extent to which the utility is able to collect the incentives by procuring energy efficiency (although a perfect history of achievement may suggest that the goals were too easy to meet.)
As with decoupling, another indication of success is the extent to which utility incentives change utility executives’ attitudes on energy efficiency, such that they view efficiency as an investment opportunity on par with other investments in supply-side, transmission, distribution, or other capital resources.
5.3.4. Implementation History
5.3.4.1.1 Decoupling
As of May 2013, at least one gas utility had been decoupled in 22 states, and at least one electric utility had been decoupled in 15 states (Gilleo et al. 2014: 41). In some of these states, all utilities providing the same fuel (electric or gas) are decoupled, but in other states, some utilities providing a given fuel are decoupled, while others are not. In general, there has been a slow but steady trend toward decoupling, although a few states have instituted and then repealed it.
5.3.4.1.2 Utility Incentives
The 2014 ACEEE State Energy Efficiency scorecard identified 30 states with incentives for electric utilities and 21 states with incentives for gas utilities. This represents a significant increase over a relatively short time span: a 2011 ACEEE study identified only 18 states that had shareholder incentive mechanisms available for IOUs for at least one year (Hayes et al. 2011: 7-8)
5.3.5. Actual Outcomes
5.3.5.1.1 Decoupling
One of the important issues about decoupling is its impact on rates. Theoretically, decoupling should have a significant adverse effect on customer rates, at least in the short term. Research findings indicate, however, that rate impacts have been modest. Most rate adjustments are less than 2% of retail rates: about $2.30 per month for the average electric customer and $1.40 per month for the average natural gas customer (Morgan 2013: 4).
Further, decoupling does not typically result in rate increases. A Graceful Systems LLC study of decoupling across the United States found that decoupling adjustments involved both surcharges and refunds in roughly even proportions (Morgan 2013: 4–5).
Energy efficiency has proven to be one, but not the only or the most important, driver of decoupling rate adjustments. In places where the decoupling mechanism did not include weather-normalization provisions, weather is typically the most significant driver of rate adjustments.
At least in some cases, decoupling insulated utilities from fluctuations in business conditions. The Regulatory Assistance Project cites the case of PG&E, which, as a result of decoupling, maintained steady revenues during a period of rapidly increasing electric costs. (For details, see RAP 2011: 26.)
States with decoupling policies have higher energy efficiency savings, on average, than states without such policies (see Hayes et al. 2011). This is a correlation rather than an indication of causation, but it suggests at minimum that decoupling supports higher levels of energy efficiency spending.

September 2015 www.seeaction.energy.gov 65
Finally, it should be noted that over the longer term, to the extent that decoupling supports utility investment in energy efficiency, it will tend to lower rates, as the less expensive energy efficiency resources allows utilities to avoid investments made with more expensive utility capital.
5.3.5.1.2 Utility Incentives
Incentive policies have successfully encouraged utilities to invest in energy efficiency: in states with incentives, the utilities typically meet or exceed their targets. And when the incentives fall in a range, most utilities achieve maximum savings or savings at the high end of the range (Hayes et al. 2011: iii). One study found that utilities earned an average incentive of about 6% of program costs (Hayes et al. 2011: 11).
Qualitative research suggests that incentives also shape attitudes. In interviews with utility executives, ACEEE found that incentives helped “legitimize” energy efficiency investments, put them on par with other forms of investment, and incorporate them into their long-range planning. Also, some stakeholders suggested that incentives can encourage utilities to focus on providing energy efficiency savings in the most cost-effective strategies possible (Hayes et al. 2011: 13).
In addition to fully aligning efficiency incentives, several respondents indicated that a larger framework of established policies supporting and encouraging efficiency is correlated with more successful shareholder incentive mechanisms. These respondents indicated that shareholder incentives in the context of a larger framework, such as legislation or a state efficiency standard, can reduce controversy, help parties to reach consensus, solidify regulatory authority, and provide regulatory certainty. (Hayes et al. 2011: 13)
There is strong correlation between incentives and energy efficiency savings. In 2011, an ACEEE study found that states with incentives were spending three times as much on energy efficiency as states without them. The top 15 states in the 2014 State Energy Efficiency Scorecard all have both electric and gas incentives (except Hawaii, which has very little natural gas consumption); by contrast, only one of the lowest-ranking 15 states had an energy efficiency incentive (Gilleo et al. 2014: 41–42). And states often see a rapid increase in energy efficiency production shortly after an incentive is instituted. None of these findings indicates that utility incentives cause higher levels of investment in energy efficiency, but they do suggest that incentives are at least supportive of investment.
5.3.6. Policy Design Considerations
5.3.6.1.1 Decoupling
Stakeholders have raised a range of concerns about decoupling. Some have some validity and could be addressed as part of policy design. For example, because decoupling can reduce the need for rate cases, it may decrease the opportunity for public input; this problem can be addressed, however, by requiring rate cases to be held periodically. Some stakeholders have argued that decoupling can reduce a utility’s incentive to restore power after a storm, because the utility’s compensation is no longer linked to the quantity of energy it provides. Many of the other common objections to decoupling, however, such as the theory that decoupling diminishes a utility’s incentive to control costs, or shifts risk to consumers, are based on misunderstandings of how decoupling functions. (For further discussion of these issues, see RAP 2011: 44–50.)
5.3.6.1.2 Utility Incentives
Stakeholders generally agree that utility incentives require clear metrics with an agreed upon methods to measure the metric (see Hayes et al. 2011: 14). Specific EM&V protocols or methods (e.g. those defined by the Uniform Methods Project protocols), determined in advance, help avoid disagreements down the road about the appropriateness of methods used to quantify energy savings. A stakeholder process involving relevant parties can be a helpful way of resolving these challenges.

66 www.seeaction.energy.gov September 2015
Because utility incentives are typically dependent on program impact evaluations, which frequently happen at the end of a program year or program cycle and take time to conduct, there can be a significant delay between the time the incentives are “earned” (i.e., the energy efficiency measures are implemented) and the time they are paid. For many utilities, such delays may significantly reduce the value of the incentives. Technological and software-based solutions, coupled with traditional evaluation methods, can help address some of these timing issues.
5.4. Cost-Effectiveness Testing
5.4.1. Overview
Cost-effectiveness testing represents a significant barrier to the growth of the residential energy efficiency sector.
65 Almost every state with energy efficiency programs uses one or more of the five cost-effectiveness tests
described in the California Standard Practice Manual (CSPM).66
These tests serve an important purpose: to determine whether or not energy efficiency programs represent an appropriate use of ratepayer funds.
67 In
practice, however, almost every state conducts the tests in ways that systematically undervalue energy efficiency.
As a result, in many states, energy efficiency programs, and whole-house residential programs in particular, experience one or more of the following problems:
The programs never progress beyond the general conceptualization stage (i.e. they never get off the drawing board) or the programs are eliminated because they do not clear the screening tests as implemented.
The programs are designed to pass the tests, rather than to encourage consumers to get upgrades or to support contractors in providing these upgrades.
The programs do not include energy-saving measures that are most effective from a building science perspective.
State-specific examples include the following:
In Virginia, advocates and utilities have proposed a number of programs that the commission has not approved because they fail to clear one or more cost-effectiveness tests, including the Ratepayer Impact Measure test.
In Utah, a whole-house upgrade program launched with ARRA funds was discontinued when the stimulus dollars dried up, in part because the utilities that would have been the logical sponsors did not believe the program would clear the cost-effectiveness tests.
In Oregon, rebates for fundamental energy efficiency measures like air sealing and insulation have been eliminated for gas-heated homes because they fail the TRC test.
65 This chapter discusses cost-effectiveness testing in reference to energy efficiency programs; many of the same concepts are relevant both to other demand-side resources (Demand Response (DR), renewables, etc.) and to supply-side resources.
66 The five CSPM tests are the Utility Cost Test (UCT), the Total Resource Cost test (TRC), the Societal Cost test (SCT), the Participant Cost Test, and the Ratepayer Impact Measure (RIM). Of these, the TRC, which compares the costs and benefits of a program to ratepayers and the utility, is the most commonly used to determine whether an efficiency program should be funded. The SCT, which compares the costs and benefits of a program to society as a whole, and the UCT, which compares the costs and benefits of a program to the sponsoring utility, are also used to screen programs in a number of states. The RIM, which is designed to indicate whether utility rates will increase or decrease as a result of a program, is now rarely if ever used as a primary screening tool. The Participant Cost Test is not used as a primary screening tool, although it is used to guide program design. See Figure 2 for a chart on the nature of and inputs for each of the CSPM tests. Additional information about the tests can be found in National Action Plan for Energy Efficiency 2008. http://www.epa.gov/cleanenergy/documents/suca/vision.pdf.
67 Note that supply-side resources are typically subject only to screening only in the sense that the utility will compare resources to determine which provides the appropriate energy at the lowest cost to the utility system. Some utility experts have pointed out that the current cost-effectiveness screening process is appropriate because no other resource requires the same level of participant investment. However, several methods, including the participant cost test, are available to ensure that participants are adequately protected.

September 2015 www.seeaction.energy.gov 67
In New York, the requirement that each whole-house energy upgrade project (as opposed to the program as a whole) pass the TRC test created tremendous business challenges for contractors and created serious logistical challenges for the NYSERDA Home Performance with ENERGY STAR program, which had been growing steadily for a decade until then.
The tests are one of the primary reasons that utilities under-invest in energy efficiency—despite the fact that efficiency is widely recognized as the least-cost energy resource.
Three general problems with the utility cost tests cause this systematic underinvestment:
The CSPM provides only very general guidance on many issues, such as incorporation of benefits and public policy considerations into the tests. As a result, those states that use a test implement CSPM in slightly or significantly different ways, and the result is that there is no single TRC test, but rather 35 or more variations of it. Some variation is necessary, as it is appropriate for states to ensure that the tests meet their policy goals. In many cases, however, the local variants are not fully consistent with the underlying rationale and structure of the text. For example, some states have proposed ruling out consideration of participant benefits in the TRC. This contradicts the underlying logic of the TRC, which, because it includes participant costs, should also take into account the full range of benefits that motivate the participant to incur these costs.
In general, the benefits of an energy efficiency program are much more difficult to quantify than the costs. This is particularly true for participant costs (which are important inputs in the TRC test and the Societal Cost Test, or SCT), but it applies to societal and utility costs as well. By accounting for the full range of costs but not the full range of benefits, energy efficiency is systematically undervalued.
The cost-effectiveness tests, as currently applied, do not take into account the state’s energy-related public policy goals. This omission can distort the test results; for example, if a state has policies that require energy planning to take water conservation into account, these considerations can be incorporated into the cost-effectiveness testing process.
This chapter reviews policy strategies for addressing these problems, beginning with a discussion of best practices and moving to strategies for ensuring appropriate test selection and transparency in test implementation.
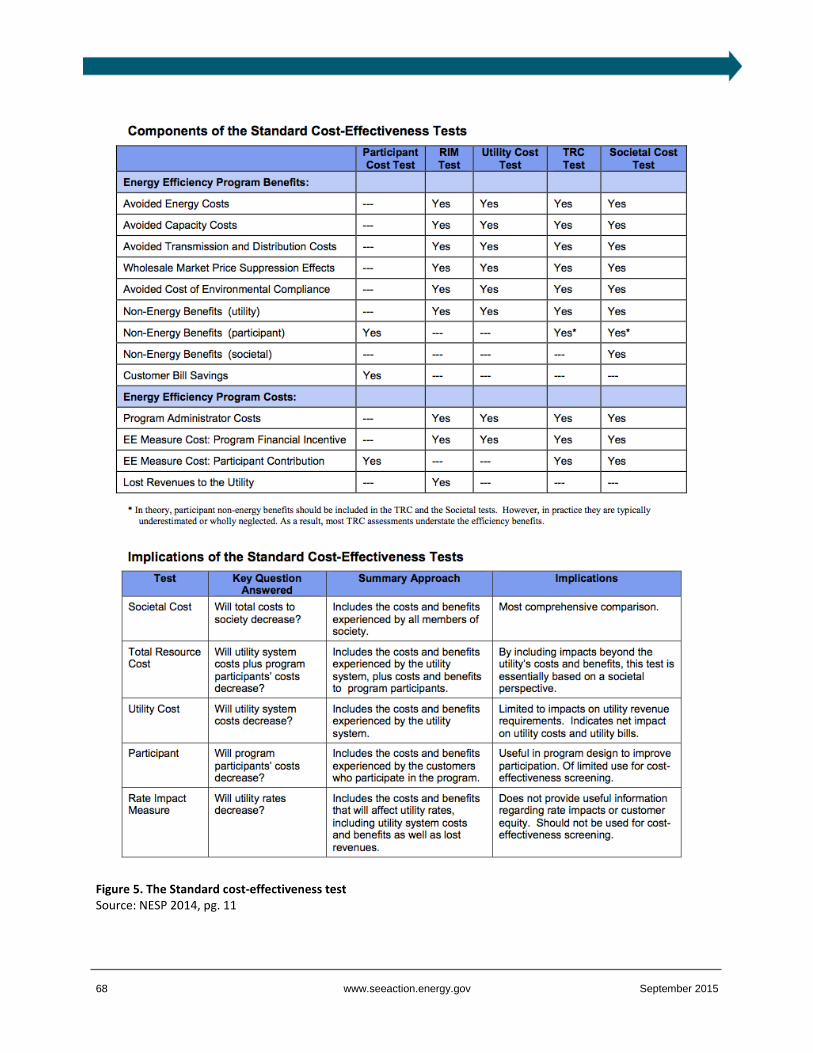
68 www.seeaction.energy.gov September 2015
Figure 5. The Standard cost-effectiveness test Source: NESP 2014, pg. 11

September 2015 www.seeaction.energy.gov 69
5.4.2. Goals
Commissioners and policymakers use cost-effectiveness tests to determine whether to use ratepayer funds or other resources to support an energy efficiency program with resources such as ratepayer funds. The goal of cost-effectiveness testing, accordingly, has traditionally been seen as to provide policymakers with an accurate assessment of whether and to what extent the benefits of an energy efficiency program exceed its costs; the resulting determination provides the basis for decisions about program funding, with the general principle that programs whose benefits exceed their costs should be approved.
Recent discussions by experts have emphasized the importance of putting this traditional approach in the context of the larger goal of cost-effectiveness testing. The overarching purpose of the tests is to give policymakers the best information possible that they can use to make informed decisions on whether the program being tested is in the public interest. This information will generally be framed in terms of a benefit-cost ratio, but it is important to remember that the determination regarding the public interest, rather than the ratio itself, is the ultimate goal of the screening process.
5.4.3. Policy Design
Although commissions often design specific test policies, states and municipalities have a number of opportunities to encourage best practices. In some cases, states have mandated particular test methods or inputs, such as a specific discount rate. However, it is more common for policymakers to encourage strategies for convening and engaging stakeholders.
States can consider broad policy approaches to addressing the limitations of the existing cost-effectiveness testing framework, by including the below features:
Use of best practices in designing and implementing the cost-effectiveness tests.
Ensuring that all other program impacts, including all appropriate benefits as well as costs, are reasonably accounted for.
Ensuring that the test used for cost-effectiveness screening answers the policymakers’ real questions through appropriate choice of test parameters and incorporation of relevant public policy goals.
Ensuring that cost-effectiveness screening methodologies are transparent to stakeholders.
Each of these approaches is detailed below.
5.4.3.1.1 Best Practices
Because the CSPM does not provide clear guidance on many crucial test design issues, the five “standard” tests are implemented in very different ways. Over the past decade, experts in the field have increasingly recommended use of best practices as a way to ensure that specific implementation of the tests remain consistent with the tests’ principles, and provide accurate information about the relative costs and benefits of energy efficiency and other demand-side programs. (See for example Lazar and Colburn 2013; Woolf et al. 2012a and Woolf et al. 2012b.)
The best practices most frequently addressed in the literature include:
Accounting for all avoided costs.
Accounting for all relevant benefits, including non-program impacts (i.e., other program impacts).
Using an appropriate discount rate.
Accounting for spillover and market transformation as well as net-to-gross.
Using appropriate measure lives.

70 www.seeaction.energy.gov September 2015
Accounting for demand reduction induced price effect (DRIPE) where relevant.
Because the issue of accounting for all relevant benefits has particular significance, it is discussed briefly below. The other best practices are briefly summarized in Appendix A.
5.4.3.1.2 Accounting for All Other Program Impacts68
Consideration of the full range of program impacts is the single most important best practice that can be taken into account when implementing cost-effectiveness tests, because failure to consider the full range of program impacts will distort test results and prevent commissioners and other decision-makers from gaining a full and accurate assessment of a program’s cost-benefit ratio.
The principle behind the best practice in this area is to ensure that the full range of a program’s impacts of a program are considered, even if they are difficult to quantify. In practice, most program costs are relatively easy to quantify, while program benefits are difficult, with the result that benefits are systematically undervalued. One particular class of other program impacts, non-energy benefits (NEBs), is particularly significant:
[I]t is becoming increasingly clear that NEBs can have very high value for those making decisions about
efficiency projects and to society as a whole… In fact, for some programs, it appears that these participant NEBs can exceed the energy-related benefits. (SEE Action 2012: 7-23)
Because these benefits are often significant, failure to consider them in the screening process can result in systematically biased and inaccurate results.
69 This issue is particularly important for residential whole-house and
energy efficiency programs because these programs typically involve significant participant costs; in many such programs, the participant pays between 50% and 90% of the total cost of the energy efficiency installations. If the full benefits to the participant are not recognized, these costs may make a residential efficiency program or measure appear cost-ineffective.
Many experts now recognize three broad categories of costs and benefits:
Utility costs and benefits
Participant costs and benefits
Societal costs and benefits70
As a best practice, states that use the Societal or TRC tests may choose to ensure that participant costs and benefits are fully accounted for, and states that use the Societal test may choose to ensure that all Societal costs and benefits are fully accounted for.
5.4.3.1.3 Ensuring That the Tests Give Policymakers the Information They Need
Although the CSPM tests are almost universally used, they do not always give policymakers the information that they need to make informed decisions about programs. To address this issue, the National Efficiency Screening Project (NESP), a national stakeholder group that works to improve cost-effectiveness testing practices, has outlined the limitations of the current tests and proposed a framework to help policymakers and commissioners design a test that avoids the theoretical and practical limitations of the CSPM tests and addresses their state’s energy policy needs.
68 The term “other program impacts” refers to the costs and benefits created by a program that are not related to the energy provided by the sponsor utility. These impacts are often referred to as non-energy benefits (NEBs). However, a program may result in both costs and benefits, so “non-energy impacts” is also used. The term “other program impacts” addresses the fact that in addition to non-energy impacts, a program may have energy-related impacts, such as reducing the use of bulk fuels that are not captured in the sponsor utility’s avoided costs.
69 “Because these benefits are so large, failing to include them in the TRC and SCT can bias regulatory decisions against cost-effective efficiency investments—to the detriment of our economy and society” (Lazar and Colburn 2013: 14).
70 See, for example, SEE Action 2012: 7-20–7-21.

September 2015 www.seeaction.energy.gov 71
NESP identifies the following limitations with the CSPM tests:
The Ratepayer Impact Measure (RIM) test indicates whether rates will rise or fall, but not the extent to which the rates will change or what the total bill impacts will be. As a result, the RIM test could (and often does) fail even when programs have a negligible impact on rates and result in significant aggregate bill savings for consumers.
The Utility Cost Test is relatively simple to implement, and allows the cost of an efficiency program to be compared to the cost of alternative resources to the utility. However, the structure of the test prevents consideration of public policy goals, such as ensuring that low-income households have access to energy saving opportunities or addressing other resource savings goals.
The SCT is the most comprehensive of the CSPM tests, in theory allowing a comparison of all costs and all benefits. In practice, the SCT is difficult to implement because quantification of all benefits in particular is methodologically challenging and expensive. Quantification of participant benefits has been particularly difficult, because consumer motivations are inherently difficult to parse. Without a full accounting of participant benefits, however, the SCT results are misleading because they do not fully account for all benefits.
The TRC suffers from the same general problem of quantification as the SCT: if all benefits, and participant benefits in particular, are not quantified, the test is asymmetrical and provides misleading results. (Note, however, that certain “societal” benefits do not need to be quantified for the TRC.) In addition, because the TRC has a hybrid perspective composed of the utility and ratepayers, it is difficult to draw the line around the appropriate costs and benefits, in that many “societal” benefits benefit ratepayers.
A more general problem with all these tests is that none explicitly addresses the state’s or municipality’s policy goals. Yet commissioners and policymakers who base decisions about efficiency programs on the test results often have a range of policy goals in mind and take these goals into account in making many other types of utility resource decisions.
To address these limitations, NESP has proposed a new approach to cost-effectiveness testing called the Resource Value Framework (RVF). The RVF begins by stating a set of principles that can guide all cost-effectiveness testing:
The Public Interest: The ultimate objective of efficiency screening is to determine whether a particular energy
efficiency resource is in the public interest.
Energy Policy Goals: Efficiency screening practices should account for the energy policy goals of each state.
Symmetry: Efficiency screening practices should ensure that tests are applied symmetrically, where both relevant costs and relevant benefits are included in the screening analysis.
Hard-to-Quantify Benefits: Efficiency screening practices should not exclude relevant benefits on the grounds that they are difficult to quantify and monetize.
Transparency: Efficiency program administrators should use a standard template to explicitly identify their state’s energy policy goals and to document their assumptions and methodologies.
Applicability: The RVF may be applicable for evaluating the costs and benefits of other demand-side and supply-side resources.
Together, these principles provide a framework for ensuring that any of the traditional CSPM tests are conducted according to best practices: in effect, they provide a way of “testing the test” to make sure it is being conducted as accurately as possible. Other best practice documents provide guidance regarding how to implement the RVF’s principles.

72 www.seeaction.energy.gov September 2015
The RVF’s focus on the public interest is particularly important. The RVF suggests that a state’s public interest should be defined by its energy policies, i.e. policies that have a direct or indirect impact on its choice of energy resources. Examples of common energy-related policies include:
Job creation
Water conservation
Carbon emissions reduction
Customer equity
Ensuring that low-income households have access to weatherization and energy saving opportunities
Ensuring that these policy goals are reflected in the tests—for example by incorporating the value of water savings resulting from energy efficiency measures—will help give policymakers crucial information that they need in making decisions about energy efficiency programs.
The RVF proposes two ways to ensure that public policies are adequately accounted for:
If the state uses the CSPM tests, particularly the TRC or SCT, it could ensure that its energy policy goals are taken into consideration in the test.
Alternately, the state may create a new test that provides the information commissioners and policymakers need without relying on expensive quantification of benefits. This approach begins with the utility system costs and benefits, but also includes energy policy goals in the test. This approach gives policymakers an indication as to whether an energy efficiency program is a less expensive way to meet the utility’s energy needs than the lowest-cost alternative; it addresses the primary weakness of the Utility Cost Test—that it does not take public policy goals into account—but does not require the difficult-to-quantify participant and societal benefits necessary for the TRC test and the SCT. (For more information, see NESP 2014.)
In principle, the methods used for cost-effectiveness testing should be transparent to all stakeholders. In practice, it can be difficult for stakeholders to know how specific inputs, such as avoided costs, were derived, or which costs and benefits are being included in the tests.
The RVF includes a template that provides a simple and effective method for making the cost-effectiveness testing process more transparent to stakeholders. The template includes two columns, one for costs and one for benefits, organized according to category (utility, participant, and societal). It also has space for information about a number of other key components of the tests, including the discount rate used and net-to-gross and spillover/market transformation adjustments. (See NESP 2014.)
5.4.4. Indicators of Success
Indicators that a state is successfully providing accurate information that allows policymakers to determine whether an energy efficiency program is in the public interest include:
The design of cost-effectiveness screening test(s) is transparent.
Best practices are used in designing and implementing the test. In particular, the program follows the best practice of symmetry by ensuring that all relevant cost and benefits are accounted for.
The test gives policymakers the information they need to make informed decisions about how energy efficiency programs impact relevant energy-related state policies.
Beyond these best practice considerations, each state should have the latitude to design the test that best meets its needs. One indicator that this goal has been achieved is that the state’s energy policy goals are accounted for in the cost-effectiveness screening process.

September 2015 www.seeaction.energy.gov 73
5.4.5. Implementation History
5.4.5.1.1 Best Practices
Over the past decade, an increasing number of states have adopted the best practices discussed above. Some have made wholesale efforts to systematically improve their cost-effectiveness testing; others have adopted best practices to address specific issues because of stakeholder concerns or market issues.
Avoided Costs
A number of states, such as New York and California, have developed sophisticated methods for calculating avoided costs. In New England and the Pacific Northwest, much of the work is done on a regional basis, which lowers costs for the individual states. In New England, the Avoided Energy Supply Component Study Group commissions a study every two years of the marginal energy supply costs that will be avoided as a result of energy efficiency programs. On the West Coast, the Northwest Planning and Conservation Council develops a plan every five years “to ensure the region’s power supply and acquire cost-effective energy efficiency,” which includes detailed estimates of avoided costs and provides examples of many of the best practices discussed above.
Most states account for avoided T&D costs in the screening tests, but not all; in 2012 ACEEE found that seven out of the 40 states did not consider avoided T&D as an avoided cost (Kushler et al. 2012: 20). States that do consider avoided T&D costs use a number of methodologies for calculating them. Estimated values for the avoided costs vary considerably: in a study of 35 utilities the Mendota Group found values ranging from $0 to over $100, with values between $41 and $60 being the most common (Mendota Group 2014: 13).
Avoided T&D costs is an area in which particularly interesting methodological developments are being made. The most sophisticated approaches for quantifying avoided T&D costs identify specific investments that may be deferred or avoided altogether as a result of energy efficiency savings. In some states and utilities, including Consolidated Edison, Vermont, Detroit Power, MidAmerican, Ameran, PacifiCorp, Nevada Energy, and the Bonneville Power Authority, these studies have been the basis for targeted energy efficiency investments that have succeeded in deferring significant projects. (For a detailed discussion of this issue, see Neme and Gravatt 2015.)
Net-to-Gross, Spillover, and Market Transformation
A number of states make a net-to-gross adjustment to the savings generated by energy efficiency programs, but fail to make similar adjustments for spillover or market transformation. A net-to-gross adjustment takes into account free ridership – i.e., people who use an efficiency program’s incentives or other rebates even though they would have implemented the measures in the absence of those benefits. Spillover is the opposite phenomenon, in which an energy efficiency program inspires people to implement efficiency measures without taking advantage of program benefits. Market transformation is, in effect, spillover on a broad and often permanent basis. Net-to-gross adjustments reduce the energy savings benefits attributed to a program; spillover and market transformation increase them.
One of the problems with the cost-effectiveness tests as currently implemented is that they often take into account net-to-gross but not spillover or market transformation – which effectively introduces another form of asymmetry into the test. However, a number of states have developed ways to address the complicated relationships between these three effects. A 2014 ACEEE study, for example, found that 11 states use gross savings, rather than accounting for net-to-gross, spillover, and market transformation individually. In 2000, for example, the New Hampshire PUC decided that the expense of calculating free ridership and spillover was not justified, and it is now using gross savings on the assumption that the two effectively counterbalance each other. While this methodology may not be perfect, it at least takes into account spillover as well as free ridership (See Kushler et al. 2014: 24.)

74 www.seeaction.energy.gov September 2015
Other states are developing methods for quantifying spillover and market transformation effects. New York State has conducted extensive research on the issue and has issued precedent-setting guidelines for evaluating spillover (NYSDPS and Evaluation Advisory Group 2012). Hawaii now provides a “spillover credit.” Other states, such as California, Indiana, Massachusetts, and Wisconsin, have conducted research on this issue and taken steps to incorporate consideration of spillover in the tests (see Kushler et al. 2014: 18, 19–22 as well as Skumatz, L.; and Vine, E. (2010), Vine (2011), and NMR Group, Inc.; Tetra Tech; and KEMA (2011).
Demand Reduction Induced Price Effect
Of the states with wholesale energy markets where DRIPE is relevant, Connecticut, Delaware, Massachusetts, Rhode Island, and Washington, D.C., now incorporate DRIPE into their cost-effectiveness tests. Maryland and Illinois are currently studying whether to include DRIPE considerations in their tests, and if so, how to quantify it. The AESC New England Avoided Cost studies provide extensive discussion on quantification of DRIPE and are used by the New England states. (See for example Hornby et al. 2013.)
5.4.5.1.2 Accounting for All Relevant Benefits, Including Other Program Impacts
A 2012 ACEEE study of cost-effectiveness screening practices in all 50 states found that 36 states incorporated participant costs in their test. The study also found that only 12 recognized any type of participant benefit, and that most of these 12 looked only at water or other fuel savings.
Only 2 states quantified a benefit for “participant O&M savings,” and none quantified any benefit for things like “comfort,” “health,” “safety,” or “improved productivity” in their primary benefit-cost test. (Kushler et al. 2012: 30, see also 16).
Since the ACEEE study was published, there has been a steady movement toward consideration of other program impacts in the screening tests, as well as increased interest in impacts related to comfort, health, safety, and productivity.
Massachusetts has been particularly rigorous in attempting to incorporate and quantify relevant non-energy impacts. In 2001, as part of the planning required by Massachusetts’ Green Communities Act, the state’s energy efficiency program administrators commissioned a study that quantified all non-energy impacts that could reasonably be attributed to their programs.
71) Both Massachusetts and Rhode Island have adopted many of these
recommendations into their cost-effectiveness tests. (See Massachusetts Program Administrators 2011 for more detail.)
In July 2015 the Maryland Public Service Commission decided to incorporate four other program impacts identified and quantified by Itron, the independent evaluator for the state’s EmPOWER Maryland program. These included business-as-usual value equivalents for air emissions, comfort, commercial operations and maintenance, and utility bill arrearages. (See Public Service Commission of Maryland 2015 and Itron 2014.)
Other states that have begun to incorporate quantifiable program impacts into the tests include Colorado, Oregon, Vermont, Washington, and Washington. Rather than quantify all impacts, Colorado, Iowa, New York, Oregon, Vermont, and Washington currently use adders.
72
In an October 2014 ruling, the Oregon PUC took a different approach to other program impacts. Rather than attempting to quantify the non-energy benefits, the Commission approved an energy efficiency rebate with a benefit-cost ratio of 0.5, feeling there were reasonable grounds to believe that significant non-energy benefits drove customer participation in the program. The Commission chose to approve the program through its power to grant exemptions to programs and measures that, though they may fail to pass the screening tests, could produce
71 For additional information, see pp. 1-5 to 1-8 in: http://www.rieermc.ri.gov/documents/evaluationstudies/2011/Tetra_Tech_and_NMR_2011_MA_Res_and_LI_NEI_Evaluation(76).pdf.
72 In addition, California, Idaho, Oregon, Washington, Wyoming, New Hampshire, New York, and Connecticut use adders specifically for low-income programs.

September 2015 www.seeaction.energy.gov 75
non-energy benefits, result in market transformation, ensure consistency with other DSM programs in the region, are required by law, or are consistent with Commission policy, among other reasons. (See Public Utility Commission of Oregon 2014a and 2014b: 36.)
5.4.5.1.3 Ensuring That the Tests Give Policymakers the Information They Need
Many policymakers and utility experts across the United States have recently expressed concern that the current approach to cost-effectiveness testing does not meet current needs, to the point that the state of California has considering revisiting and revising the CSPM. The coincidence of low natural gas prices and broad interest in ramping up energy efficiency has given these conversations particular urgency in many states. A number of these conversations have focused on whether the TRC test is the most appropriate, given the practical challenges involved in quantifying other program impacts.
In general, states have been exploring three broad responses to this problem. The first involves attempting to address the practical asymmetries of the TRC and SCT by quantifying some or all of the appropriate benefits. Massachusetts has done the most systematic work along these lines, but other states, such as Arkansas, Maryland, and Vermont, have also made significant efforts to assess the most significant non-program impacts, as discussed above.
The second approach has involved changing or modifying the “standard” tests. In the recent decision discussed above, the Oregon commission noted that in practice:
The current construct for cost effectiveness at the Oregon PUC is not strictly the TRC or the UCT. Although Energy Trust is required to report both TRC and UCT benefit cost ratios to the Commission for measures and programs, the Commission uses a customized and flexible approach to determine which measures should be included in energy efficiency portfolios. (Public Utility Commission of Oregon 2014b:32)
As part of this flexible approach, the Oregon PUC has used its discretion to make exemptions for programs that the commission believes have a general economic benefit, but do not pass TRC as currently implemented in Oregon.
A third approach involves changing the primary test. Maryland recently adopted the Societal Cost Test as its primary test, and New York State is considering taking the same approach in order to ensure that all costs and benefits are properly accounted for (see NYSDPS 2014: 46). Washington State took a different approach.
In 2012, the Avista Corporation proposed to suspend its gas energy efficiency programs on the grounds that it could not pass the TRC in the context of low natural gas prices. Instead of following this logic, the Washington Utilities and Transportation Commission opened a docket to investigate the issue, and decided that in practice the TRC was not the appropriate test in this context. The commission found that: “[W]hile a properly balanced TRC is the most appropriate test available, there are significant barriers to achieving this balance since all costs are calculated, but only a limited number of non-energy benefits.”
The Commission concluded:
[W]ith proper quantification of these values, a properly balanced TRC analysis could be possible. Unfortunately, the [Northwest Power Planning] Council does not provide these values for the natural gas utilities, nor does any other similar entity. And it would be unreasonably expensive for a utility to undertake such a study alone. Thus, we are unwilling to allow utilities to end natural gas conservation programs as a result of an unbalanced or incomplete TRC analysis. Any TRC analysis without these values is potentially biased against conservation programs. Accordingly, the UCT (Utility Cost Test) is an acceptable option when a properly balanced TRC is not available. (Spector and Peach 2014: 8-385)
There are, however, some potential long-term problems with this approach, most notably the fact that the UCT does not allow for valuation of low-income programs or contributions to other public policy goals.

76 www.seeaction.energy.gov September 2015
As an alternative to moving from one CSPM test to another, the RVF offers a different approach that allows the best features of the tests—the relative simplicity of the UCT and the more global perspective provided by the SCT and TRC—without requiring the challenges of quantifying participant costs and benefits.
5.4.6. Transparency
A number of states have become increasingly interested in transparency in the cost-effectiveness screening process. The New York State Department of Public Service recently identified transparency as a key principle in the development of the state’s future cost-effectiveness testing framework, for example (NYSDPS 2014: 44). Other states such as Arkansas and Maryland have recently engaged in extremely transparent stakeholder-driven discussions of aspects of the cost-effectiveness tests.
5.4.7. Actual Outcomes
It is difficult to identify a direct relationship between cost-effectiveness tests and energy efficiency outcomes. However, two general observations can be made:
There is a high-level correlation between states that have attempted to apply best practices in cost-effectiveness screening (e.g., Arkansas, Maryland, Massachusetts, New York, Oregon, Rhode Island, Vermont) and states that either have risen rapidly in ACEEE’s annual energy efficiency scorecard (e.g., Arkansas) or states that are already in the scorecard’s top tier (Maryland, Massachusetts, New York, Oregon Rhode Island, and Vermont).
States that have adopted best practices are succeeding with ambitious “all cost-effective” energy efficiency goals. Massachusetts and Vermont are both examples of states where appropriate valuation of energy efficiency allows the state to meet and surpass ambitious efficiency targets.
5.4.8. Policy Design Considerations
5.4.8.1.1 Concerns About Hard-to-Quantify Benefits
In a number of states, stakeholders have expressed concern that the public will perceive incorporation of non-energy benefits into cost-effectiveness screening practices negatively because of the hard-to-quantify nature—as is sometimes said, the “fuzziness”—of the benefits. However, concerns about how non-energy benefits can be accounted for can be addressed:
The science of quantifying these benefits has been in development for more than two decades: it uses methods widely recognized in the social sciences and in other areas of trade and commerce, is conducted with appropriate rigor, and is often peer-reviewed.
The idea that non-energy benefits are the only difficult-to-quantify input in a cost-effectiveness test is inaccurate. Many avoided cost assumptions, such as future gas prices, for example, are also estimates.
The evidence to support many non-energy benefits is so strong that, ignoring them will clearly result in inaccurate test results.
The expense of addressing the hard-to-quantify benefits remains a significant barrier to conducting cost-effectiveness screening according to best practices: even if a state wants to quantify the benefits, it may not have the resources to do so. A staged approach, with the easiest-to-quantify benefits tackled first, an “adder” for hard-to-quantify benefits in early years, and a commitment to address other benefits as resources allow, may be an appropriate way to begin to address the problem. Another strategy would be for several states to partner on studies to develop regional non-energy benefit studies.
Another potential challenge is ensuring that any changes to cost-effectiveness screening practices ensure that low-income energy efficiency programs targeted to low-income households are preserved and supported. These programs provide an important public good—support to vulnerable populations. They also often provide indirect financial benefits to utilities, such as lowered arrearages and shut-off rates. The new methodological tools

September 2015 www.seeaction.energy.gov 77
provided by NESP’s RVF, the Regulatory Assistance Project’s “layer cake” study, and the Northeast Energy Efficiency Partnerships’ cost-effectiveness guidance provide methods for valuing these benefits, and it is important to ensure that they are used.
5.5. Recommendations
To take advantage of the full range of low-cost energy efficiency opportunities, policymakers may wish to consider the following policy options, which summarize much of the discussion above:
Establish an EERS that requires utilities to meet energy efficiency targets.
Establish a decoupling mechanism to eliminate the traditional utility disincentive to invest in energy efficiency.
Put utility investments in energy efficiency on a level with other types of capital investments by allowing incentives for achieving energy efficiency savings.
Ensure that the cost-effectiveness test(s) used address the issues that policymakers and commissioners need to know by incorporating public policy considerations, either through modification of one of the “standard” tests or through the creation of a new test along the lines recommended by the RVF.
Adopt best practices in the implementation of cost-effectiveness tests.
Ensure that all other program impacts, and in particular all relevant hard-to-quantify benefits, are adequately accounted for in the cost-effectiveness testing process.
Ensure that cost-effectiveness test methods are transparent to stakeholders.
5.6. Additional Information and Resources
5.6.1. Best Practice Resources
Best Practices in Energy Efficiency Screening (The National Home Performance Council, 2012)
http://www.homeperformance.org/sites/default/files/nhpc_synapse-ee-screening_final.pdf
Energy Efficiency Cost-Effectiveness Screening: How to Properly Account for “Other Program Impacts” and Environmental Compliance Costs (The Regulatory Assistance Project 2012)
http://www.raponline.org/document/download/id/6149
Recognizing the Full Value of Energy Efficiency (The Regulatory Assistance Project 2012)
http://www.raponline.org/document/download/id/6739
Cost-Effectiveness Screening Principles and Guidelines (Northeast Energy Efficiency Partnership 2014)
http://www.neep.org/cost-effectiveness-screening-guidelines-2014

78 www.seeaction.energy.gov September 2015
Conclusion 6.
A state or local energy plan is not complete without policies to make residential buildings more efficient. Policymakers often target industrial, commercial, and public buildings first because their size (the overall sector size of these group of buildings and in certain instances the individual size of buildings within these groups) allows significant savings from a single upgrade. However, the residential sector is responsible for more than 20% of the nation’s energy consumption, and is crucial to the success of a state or locality’s energy efficiency policies. Homeowners have a vested interest in energy efficiency: they are responsible for maintaining aging buildings, and are motivated to improve the comfort and quality of their properties and to realize bill savings. Collaboration with the residential stakeholders can lead to significant energy savings, while failure to address the residential sector involves political risks, particularly when energy prices fluctuate.
Fortunately, the residential energy efficiency industry has grown and developed in recent years: policymakers now have a broad menu of policy options available to promote residential efficiency. Only five years ago many of the policies discussed in this Guide—including some of the financing, labeling, real estate integration, and data standards policies—were only in conceptual stages and had never been enacted or tested; now many are beginning to show results. This period of rapid growth and evolution continues, and while none of the policies described here provide “silver bullet” solutions, all of them have the potential to promote significant increases in the energy efficiency of residential buildings.
The promising policies discussed in the preceding chapters are listed below for easy reference.
6.1. Lowering Upfront Costs through Incentives and Financing
Consider the amount of public funds available to the project and leverage the market mechanisms that will best achieve the policy goal.
Explore new and innovative market-based incentives.
Consider the energy goals of the state when designing the incentives to ensure that the required measurements are built into the policy design.
Ensure that the energy efficiency program reflects a valid estimate of the number of trained contractors able to undertake the project, program, or policy. If the number of trained contractors are not geographically available in sufficient volumes, the policy needs to incorporate appropriate levels of training.
When considering incentives, size and sustainability does matter—incentives that are too large or too small, or a lack of sustainability, can harm a program’s efficacy.
Be sure to understand the current demand for energy efficiency retrofits and recognize that investment in stakeholder education is needed in order to increase that demand.
6.2. Making the Value of Energy Efficiency Visible in the Real Estate Transaction
Create a system for voluntary labeling that makes an existing home’s energy efficiency and energy-efficient characteristics visible in the real estate transaction.
To the greatest extent feasible, ensure that any labeling systems developed have as much relationship or comparability, as feasible, with existing national, regional, and/or state labeling systems.
Explore use of energy consumption disclosure, either as a stand-alone requirement or in conjunction with a label.
Design labeling and other disclosure policies in ways that encourage homeowners to take action on the basis of the information provided in the label or disclosure.

September 2015 www.seeaction.energy.gov 79
Develop state or municipal policies for integrating energy efficiency into the real estate system by encouraging collaboration between multiple listing services and other stakeholders to add common energy-efficiency-related data fields to MLS databases.
Leverage training and state licensure requirements to ensure that real estate agents, appraisers, inspectors, and other real estate professionals understand the value of residential energy efficiency.
Invest the necessary resources to develop robust data collection and tracking related to labeling and valuation in the real estate transaction.
6.3. The Case for Energy Data Driving Home Performance with Standards and Access
Promote data standardization and use of national data standards, including BPI-2101, RETS (Real Estate Transaction Standard) and the Appraisal Institute G&EEA (Green and Energy Efficiency Addendum) whenever possible in all work related to energy efficiency policy.
Both access to utility data and the use of national data standards support improving EM&V (evaluation, measurement, and verification) and the ease and quality of reporting, the ability to aggregate and compare results across programs and states, and lower overhead for companies seeking to provide energy efficiency services at larger scale. Considerable public and private investments have already been made in smart meter installation, home energy management advancements, and implementing national data standards.
Consider policies to ensure secure access to utility data by third parties designated by the homeowner to receive the data.
6.4. Utility System Opportunities and Challenges
Establish an EERS (energy efficiency resource standard) that requires utilities to meet energy efficiency targets and/or a requirement that utilities procure all cost-effective energy efficiency.
Establish a decoupling mechanism to eliminate the traditional utility disincentive to invest in energy efficiency.
Put utility investments in energy efficiency on a level with other types of capital investments by allowing incentives for achieving energy efficiency savings.
Ensure that the cost-effectiveness test(s) used address the issues that policymakers and commissioners need to know by incorporating public policy considerations, either through modification of one of the “standard” tests or through the creation of a new test along the lines recommended by the Resource Value Framework (RVF).
Ensure that the state or locality’s policy goals are reflected in the cost-effectiveness test used.
Adopt best practices in the implementation of cost-effectiveness tests.
Ensure that all Other Program Impacts, and in particular all relevant hard-to-quantify benefits are adequately accounted for in the cost-effectiveness testing process.
Ensure that cost-effectiveness test methods are transparent to stakeholders.
In developing policy based on this list, policymakers may want to keep in mind the three broad characteristics, identified in the introduction to this Guide, that characterize successful approaches to residential energy efficiency policy development and features that include:
1. Leveraging market mechanisms to ensure that policies or programs are sustainable, and that policy supports the market rather than distorting it.

80 www.seeaction.energy.gov September 2015
2. Promoting standardized approaches to the collection and transfer of data that describes both energy
consumption and building characteristics, with the goals of supporting and easier, more rapid and precise way of quantifying and recording energy efficiency savings, providing a better indication of a building’s energy performance, and tracking metrics such as the incremental value of energy efficiency in real estate sales transactions.
3. Engage the key stakeholders critical to the success of a policy—including contractors, banks, utilities, home owners and homeowner associations, appraisers, or realtors—at the outset to ensure that policies have broad support through the design and implementation phases.
6.5. Keys to Successful Implementation
Several recommendations for effective policy implementation have recurred in each chapter of this report, suggesting that they are particularly significant for achieving successful outcomes. Policymakers can take into account these considerations in designing almost any of the policies described above.
Leverage existing market resources and systems
Drive efficiency with improved data collection, management and migration
Engage stakeholders
6.5.1. Leverage the Power of the Market
Energy efficiency programs tend to be more successful – often considerably more successful – when they leverage existing or nascent markets. Because energy efficiency delivers value to both consumers and utilities, policymakers can aim to support market development to the point that public intervention is no longer required to drive private investments in energy efficiency. In other words, policies can be designed to create market conditions in which (i) the value of energy efficiency is recognized by homeowners to the extent that they pay for improvements without subsidies, and/or (ii) utility incentives are aligned such that they willingly procure energy efficiency by investing funds in incentives or other program-related costs.
Policies can leverage markets in several ways, including:
Integrating energy efficiency into existing markets, as in the case of policies that make the energy-efficient features of a home visible to homebuyers and real estate professionals at the time of sale.
Supporting the development of tools or infrastructure that allow existing markets to function more efficiently, as in the case of the establishment and adoption of residential energy efficiency data standards.
Creating the conditions or infrastructure that facilitate the creation or development of a new market, as in the case of policies that create a new demand for energy efficiency through energy efficiency resource standards, or policies that create a market demand for energy efficiency savings.
It should be noted that in some cases, even after markets for efficiency are fully functioning, it is very likely that there will be a long-term role for the public sector alongside the market. Such roles can include providing financing for low-income households, or financial incentives to support market stakeholders providing of energy efficiency services in hard-to-reach locales such as small rural towns and economically distressed areas.
6.5.2. Drive Efficiency with Data
The second consideration that policymakers can take into account is that data—specifically high-quality, standardized data—will be central to the next generation of energy efficiency policies and programs in the U.S. Every chapter in this Guide underscores the importance of collecting and using high-quality standardized data. This data is critically important for benchmarking and development of metrics to evaluate the impact of policies and to iterate and improve. And in some cases, the collection and analysis of high-quality data is one of the objectives of a

September 2015 www.seeaction.energy.gov 81
policy, as in the case of strategies to support better quantification of energy efficiency. Finally, the adoption of data standards is likely to result in cost reductions for both programs and participating contractors and other firms.
6.5.3. Engage Stakeholders
The third way that policymakers can support policy success is to engage stakeholders. The implementation history of all types of programs demonstrates that stakeholder involvement and buy-in is crucial to enactment and will result in better outcomes. The City of Austin’s precedent-setting energy audit ordinance (described in Chapter 3), for example, was designed with significant input from the local real estate organization, which has played a key role in implementation by training its members. Stakeholder engagement can also be crucial for ensuring that evaluation, measurement and verification (EM&V) protocols are universally recognized as providing an accurate indication of realized savings. And through engagement with home performance industry professions—contractors, relators, auditors, and others—policymakers will learn the specific challenges of their state or locality and develop an appropriate combination of policies that will lead to better and more efficient residential energy performance.
6.6. Towards the Future
Energy markets and prices have fluctuated dramatically over the past decades, but despite the spikes and falls in the price of oil, natural gas, renewable energy, and other fuels, energy efficiency has consistently been the least expensive way to meet the nation’s energy needs. This Guide and the resources it cites are designed to help policymakers navigate the emerging challenges presented by the changing energy price and regulatory landscape, as well as reduced public funding, by giving them the tools to develop policies that will allow them to realize the many potential benefits of making America’s homes more efficient.

82 www.seeaction.energy.gov September 2015
Bibliography 7.
American Council for an Energy-Efficient Economy. (2011). On-Bill Financing for Energy Efficiency Improvements: A Review of Current Program Challenges, Opportunities, and Best Practices. Washington, DC: American Council for an Energy-Efficient Economy.
American Council for an Energy-Efficient Economy. (2014). Residential Energy Use Disclosure: A Guide for Policymakers. Washington, DC: American Council for an Energy-Efficient Economy.
American Council for an Energy-Efficient Economy. (2014). Utility Initiatives: Alternative Business Models and Incentive Mechanisms. Washington, DC: American Council for an Energy-Efficient Economy.
American Council for an Energy-Efficient Economy. (2015). State Energy Efficiency Resource Standards. Washington, DC: American Council for an Energy-Efficient Economy.
Adomatis, S.K. (2013, March 12). Appraisal Institute Green and Energy Efficient Addendum Update. [Web log comment]. Retrieved from https://adomatis.wordpress.com/2013/03/12/appraisal-institute-green-and-energy-efficient-addendum-update/. Accessed on April 5, 2015.
Adomatis, S.K. (2014). Residential Green Valuation Tools. Appraisal Institute.
Agnew, K. & Goldberg, M. (2013). Chapter 8: Whole-Building Retrofit with Consumption Data Analysis Evaluation Protocol. In: Jayaweera, T., and Haeri, H. (eds), The Uniform Methods Project: Methods for Determining Energy Efficiency Savings for Specific Measures. (Subcontract Report NREL/SR-7A30-53827). Golden, CO: National Renewable Energy Laboratory. Retrieved from http://www.nrel.gov/docs/fy13osti/53827.pdf.
Appraisal Institute. (2013). Residential Green and Energy Efficient Addendum. Retrieved from http://www.appraisalinstitute.org/education/education-resources/green-building-resources/.
Arkansas Energy Office. (2014). Loan Loss Reserve Guidelines—2014. Arkansas Economic Development Commission. Retrieved from http://www.naseo.org/Data/Sites/1/aeo-loan-loss-reserve-program-guidelines-1-2-2014.pdf.
Bamberger, L., Avis, E., Busch, C., & Lam, B. (2012). Pulling the Trigger: Increasing Home Energy Savings Using Ordinary Life-Cycle Events to Achieve Cost-effective Upgrades of Existing Residential Buildings. California Clean Energy Fund.
Barbose, G., Goldman, C., Hoffman, I., & Billingsley, M. (2013). The Future of Utility Customer-Funded Energy Efficiency Programs in the United States: Projected Spending and Savings to 2025. Berkeley, CA: Lawrence Berkeley National Laboratory. Prepared for the Office of Electricity Delivery and Energy Reliability: U.S. Department of Energy.
Bell, C., Nadel, S., & Hayes, S. (2011) On-Bill Financing For Energy Efficiency Improvements: A Review Of Current Program Challenges, Opportunities, And Best Practices. (Report Number E118). American Council for an Energy-Efficient Economy.
Borgeson, M., Zimring, M., & Goldman, C. A. (2012). The Limits of Financing for Energy Efficiency. Paper presented at the ACEEE Summer Study.
Brounen, D. & Kok, N. (2010). On the Economics of Energy Labels in the Housing Market. Berkeley, CA: University of California, Berkeley.
Brown, E., Quinlan, P., Sachs, H., & Williams, D. (2002). Tax Credits for Energy Efficiency and Green Buildings: Opportunities for State Action. (Report Number EO21). Washington, DC: American Council for an Energy-Efficient Economy.

September 2015 www.seeaction.energy.gov 83
Building Performance Institute. (2013). BPI-2101-S-2013: Standard Requirements for a Certificate of Completion for Residential Energy Efficiency Upgrades. Retrieved from
http://www.bpi.org/toolsdownloads.aspx?selectedTypeID=1&selectedID=143.
California Public Utility Commission. (2001). California Standard Practice Manual: Economic Analysis of Demand-Side Programs and Projects. California Public Utility Commission.
Chupka, M., Earle, R., Fox-Penner, P., & Hledik, R. (2008). Transforming America’s Power Industry: The Investment Challenge: 2010–2030. Washington, DC: Edison Foundation.
Citigroup Inc. (2015, June 15). Citi and Renew Financial Announce First Ever Energy Efficiency Loan Asset-Backed Security Transaction [Press Release]. Retrieved from http://www.citigroup.com/ citi/news/2015/150615a.htm.
City of Boulder. (2014). City of Boulder Residential Building Guide: Green Building and Green Points Guideline Booklet. Retrieved from https://www.static.bouldercolorado.gov/docs/PDS/forms/902_GP%20Guideline%20Booklet.pdf.
Cluett, R., & Amann, J. (2013). Residential Energy Use Disclosure: A Review of Existing Policies. (Report Number A131). Washington, DC: American Council for an Energy-Efficient Economy.
CNT Energy and National Home Performance Council. (2013). Unlocking the Value of an Energy Efficient Home: A Blueprint to Make Energy Efficiency Improvements Visible in the Real Estate Market.
Colorado Public Utility Commission. (2014). Rules Regulating Electric Utilities. (4 CCR 723-3). Retrieved from https://www.sos.state.co.us/CCR/GenerateRulePdf.do?ruleVersionId=5738&fileName=4%20CCR%20723-3.
Crandall-Hollick, M.L. (2014). Residential Energy Tax Credits: Overview and Analysis. Congressional Research Service.
Desmarais, L.K. (2015). An Early Look at Energy Efficiency and Contributory Value: Case Studies of Residential Properties in the Greater Denver Metro Area. Denver, CO: Colorado Energy Office.
DeVries, C. (2015, Winter). Energy Efficiency Finance Demand Isn’t the Problem, Design Is. State & Local Energy Report.
Downs, A., & Cui, C. (2014). Energy Efficiency Resource Standards: A New Progress Report on State Experience. (Report U1403). Washington, DC: American Council for an Energy-Efficient Economy.
Dunsky, P., Lindberg, J., Schmidt, E., & Faesy, R. (2010). “$300,000, 4 Bedrooms and a ‘B+’ Energy Rating”—Transforming Markets with Mandatory Building Energy Labeling. ACEEE Summer Study.
Earth Advantage. (n.d.). Home Energy Labels: A Policy Playbook. Portland, OR. Earth Advantage.
Elevate Energy. (n.d.). Energy Cost Disclosure in Chicago Residential Listings: Eighteen Months Out. Chicago, IL: Elevate Energy.
Faesy, R., Badger, L., Levin, E., Ferington, D., Finlayson, I., & Lano, J.B. (2014). Residential Building Energy Scoring and Labeling: An Update from Leading States. ACEEE Summer Study on Energy Efficiency in Buildings.
Gilleo, A., Chittum, A., Farley, K., Neubauer, M., Nowak, S., Ribeiro, D., & Vaidyanathan, S. (2014). The 2014 State Energy Efficiency Scorecard (Report number U1408). Washington, DC: American Council for an Energy-Efficient Economy.
Green Button. (2014). http://energy.gov/data/green-button.

84 www.seeaction.energy.gov September 2015
Griffin, A., Kaufman, B., & Hamilton, S. (2009). Certified Home Performance: Assessing the Market Impacts of Third Party Certification of Residential Properties. Earth Advantage Institute.
Hastings, G., Hines, T., Keneipp, F., & Golden, M. (2014). Residential Energy Efficiency 2.0: A Market-Based Approach to Residential Energy Efficiency. Prepared for Efficiency First New York. Retrieved from http://goo.gl/UMGPz1.
Hayes, S., Nadel, S., Granda, C., & Hottel, K. (2011). What Have We Learned From Energy Efficiency Financing Programs? (Report Number U115). Washington, DC: American Council for an Energy-Efficient Economy.
Hayes, S., Nadel, S., Kushler, M., & York, D. (2011). Carrots for Utilities: Providing Financial Returns for Utility Investments in Energy Efficiency (Report U111). Washington, DC: American Council for an Energy-Efficient Economy.
Hibbard, P.J., Tierney, S., & Darling, P. (2014). The Impacts of the Green Communities Act on the Massachusetts Economy: A Review of the First Six Years of the Act’s Implementation. The Analysis Group.
Hornby, R., Chernick, P., White, D., Rosenkranz, J., Denhardt, R., Stanton, E.A., Gifford, J., Grace, B., Chang, M., Luckow, P., Vitolo, T., Knight, P., Griffiths, B., & Biewald, B. (2013). Avoided Energy Supply Costs in New England: 2013 Report. Prepared for the Avoided Energy Supply Component (AESC) Study Group by Synapse Energy Economics. Retrieved from http://greenresourcecouncil.org/sites/default/files/2014%20NAR%20Green%20MLS%20 Implementation%20Guide.pdf.
Itron. (2014). Future Evaluation Research: Development and Application of Select Non-Energy Benefits for the EmPOWER Maryland Energy Efficiency Programs. Silver Spring, MD.
James, L., James, P., McGuckin, A., & Koburger, C.M. (2014). California Joint Utilities Financing Research: Existing Programs Review. The Cadmus Group.
Kok, N. & Kahn, M.E. (2012). The Value of Green Labels in the California Housing Market: An Economic Analysis of the Impact of Green Labeling on the Sales Price of a Home. Washington, DC: U.S. Green Building Council.
Kramer, C. & Faesy, F. (2013). Residential Energy Efficiency Financing: Key Elements of Program Design. Prepared for the Connecticut Fund for the Environment and ENE.
Kushler, M., Nowak, S., & Witte, P. (2012). A National Survey of State Policies and Practices for the Evaluation of Ratepayer-Funded Energy Efficiency Programs (Report U113). Washington, DC: American Council for an Energy-Efficient Economy.
Kushler, M., Nowak, S., & Witte, P. (2014). Examining the Net Savings Issue: A National Survey of State Policies and Practices in the Evaluation of Ratepayer-Funded Energy Efficiency Programs (Report U1401). Washington, DC: American Council for an Energy-Efficient Economy.
Lazar, J., & Baldwin, X. (2011). Valuing the Contribution of Energy Efficiency to Avoided Marginal Line Losses and Reserve Requirements. Montpelier, VT: Regulatory Assistance Project.
Lazar, J., & Colburn, K. (2013). Recognizing the Full Value of Energy Efficiency: What’s Under the Feel-Good Frosting of the World’s Most Valuable Layer Cake of Benefits. Montpelier, VT: Regulatory Assistance Project.
LeBaron, R. & Saul Rinaldi, K. (2014.) Bringing On The Boom and Beating the Bust. Washington, D.C.: National Home Performance Council. Retrieved from http://www.homeperformance.org/sites/ default/files/nhpc_white-paper-bringing-on-the-boom_20130430.pdf.
Massachusetts Program Administrators. (2011). Massachusetts Special and Cross-Sector Studies Area, Residential and Low-Income Non-Energy Impacts (NEI) Evaluation. Prepared by Tetra Tech, Inc.

September 2015 www.seeaction.energy.gov 85
McKinsey & Company, 2009. Unlocking Energy Efficiency In The U.S. Economy. p. 34. Retrieved from http://www.mckinsey.com/client_service/electric_power_and_natural_gas/latest_thinking/unlocking_energy_efficiency_in_the_us_economy.
Mendota Group. (2014). Benchmarking Transmission and Distribution Costs Avoided by Energy Efficiency Investments. Prepared for the Public Service Commission of Colorado.
Morgan, P. (2013). A Decade of Decoupling for U.S. Energy Utilities: Rate Impacts, Designs and Observations. Graceful Systems LLC.
Munson, D. (2014). Household Electricity Data May Be a Click Away for Illinois Residents. Retrieved from http://blogs.edf.org/energyexchange/2014/08/18/household-electricity-data-may-be-a-click-away-for-illinois-residents/.
Murray, M. (2014). Comments of Mission: Data Regarding Program Administrator 2015 Energy Efficiency Investment Proposals (Phase 1). Retrieved from http://www.missiondata.org/s/Mission-Data-EE-Phase-1-Comments.pdf.
NMR Group, Inc., Tetra Tech, & KEMA. (2011). Cross-Cutting Net to Gross Methodology Study for Residential Programs—Suggested Approaches (Final). Prepared for Massachusetts Program Administrators.
Nadkarni, N. & Michaels, H. (2012). A New Model for Disclosing the Energy Performance of Residential Buildings. Cambridge, MA: MIT Energy Efficiency Strategy Project
National Action Plan for Energy Efficiency. (2007). Aligning Utility Incentives with Investment in Energy Efficiency. Prepared for the National Action Plan for Energy Efficiency by Val R. Jensen, ICF International. Retrieved from http://www.epa.gov/cleanenergy/documents/suca/incentives.pdf.
National Action Plan for Energy Efficiency. (2008). Understanding Cost-Effectiveness of Energy Efficiency Programs: Best Practices, Technical Methods, and Emerging Issues for Policymakers. Prepared for the National Action Plan for Energy Efficiency by Energy and Environmental Economics, Inc., and Regulatory Assistance Project. Retrieved from http://www.epa.gov/cleanenergy/documents/suca/cost-effectiveness.pdf.
National Association of Realtors. (2014). Green MLS Implementation Guide.
National Association of State Energy Officials. (2014). Residential Energy Labeling: Strategies for Scalability. Arlington, VA: National Association of State Energy Officials.
National Association of State Energy Officials. (n.d.). Introduction to the Warehouse for Energy Efficiency Loans (WHEEL). Arlington, VA: National Association of State Energy Officials.
Retrieved from http://www.naseo.org/Data/Sites/1/documents/committees/financing/documents/ WHEEL_Primer.pdf.
National Efficiency Screening Project. (2014). The Resource Value Framework: Reforming Energy Efficiency Cost-Effectiveness Screening. Washington, DC: National Efficiency Screening Project.
Neme, C., & Gravatt, J. (2014). Energy Efficiency as a T&D Resource: Lessons from Recent U.S. Efforts to Use Geographically Targeted Efficiency Programs to Defer T&D Investments. The Energy Futures Group for the Northeast Energy Efficiency Partnerships.
Neme, C., & Sedano, R. (2012). U.S. Experience with Efficiency as a Transmission and Distribution System Resource. Montpelier, VT: Regulatory Assistance Project.

86 www.seeaction.energy.gov September 2015
New York State Department of Public Service and Evaluation Advisory Group. (2012). New York Evaluation Plan Guidance for EEPS Program Administrators. First issued August 2008 and updated November 2012.
New York State Energy Planning Board. (2014). 2014 Draft New York State Energy Plan. (Volume 1.) Retrieved from http://energyplan.ny.gov/Plans/2014.
New York State Department of Public Service. (2014, August 22). Developing the REV Market in New York: DPS Staff Straw Proposal on Track One Issues. Filed in Case 14-M-0101: Proceeding on Motion of the Commission in Regard to Reforming the Energy Vision.
Northeast Energy Efficiency Partnerships. (2009). Valuing Building Energy Efficiency Through Disclosure and Upgrade Policies: A Roadmap for the Northeast. U.S. Dunsky Consulting Group.
Northeast Energy Efficiency Partnerships. (2014). Cost-Effectiveness Screening Principles and Guidelines: For Alignment with Policy Goals, Non-Energy Impacts, Discount Rates, and Environmental Compliance Costs. Prepared by Synapse Energy Economics.
Pfleger, W., Pery, C., Hurst, N., & Tiller, J. (2011). Market Impacts of ENERGY STAR® Qualification for New Homes. Boone, NC: North Carolina Energy Efficiency Alliance.
Plympton, P., Boman, S., Logee, T., MacRae, L., Pollock, E., Norton, P., & Hawkin, J. (2008.) Home Performance with ENERGY STAR: Accelerating Energy Efficiency Improvements in Existing Homes. Washington, DC: ACEEE.
Public Utility Commission of Oregon. (2014, August 13.) Staff Report. Re: Energy Trust of Oregon (Docket No. UM 1622) Request Approval of Exceptions to Energy Efficiency Cost Effectiveness Guidelines.
Public Utility Commission of Oregon. (2014, September 23.) Staff Report. Re: Energy Trust of Oregon (Docket No. UM 1622) Request Approval of Exceptions to Energy Efficiency Cost Effectiveness Guidelines.
Regulatory Assistance Project. (2011). Revenue Regulation and Decoupling: A Guide to Theory and Application. Montpelier, VT: Regulatory Assistance Project.
Rockefeller Foundation. (2012). United States Building Energy Efficiency Retrofits: Market Sizing and Financing Models. Retrieved from http://assets.rockefellerfoundation.org/app/uploads/20120301221532/United-States-Building-Energy-Efficiency-Retrofits.pdf.
Satchwell, A., Cappers, P., & Goldman, C. (2011). Carrots and Sticks: A Comprehensive Business Model for the Successful Achievement of Energy Efficiency Resource Standards. Lawrence Berkeley National Laboratory.
Sciortino, M., Nowak, S., Witte, P., York, D., & Kushler, M. (2011). Energy Efficiency Resource Standards: A Progress Report on State Experiences. (Report Number U112). Washington, DC: American Council for an Energy-Efficient Economy.
SEE Action Residential Retrofit Working Group. (2011.) Roadmap for the Home Energy Upgrade Market.
SEE Action. (2011). Using Integrated Resource Planning to Encourage Investment in Cost-Effective Energy Efficiency Measures. Prepared by John Shenot, Regulatory Assistance Project. Retrieved from https://www4.eere.energy.gov/seeaction/system/files/documents/ratepayer_efficiency_irpportfoliomanagement.pdf.
SEE Action. (2012). A Regulator’s Privacy Guide to Third-Party Data Access for Energy Efficiency. DOE/EE-0828. Retrieved from https://www4.eere.energy.gov/seeaction/sites/default/files/pdfs/cib_regulator_privacy_guide.pdf.
SEE Action. (2012). Energy Efficiency Program Impact Evaluation Guide. Prepared by Steven R. Schiller, Schiller Consulting, Inc. Retrieved from http://www.seeaction.energy.gov.

September 2015 www.seeaction.energy.gov 87
SEE Action. (2014 May) Financing Energy Improvements on Utility Bills: Market Updates and Key Program Design Considerations for Policymakers and Administrators. Financing Solutions Working Group.
Senate Bill 1476, An Act to Add Chapter 5 (Commencing with Section 8380) to Division 4.1 of, and to Repeal Section 393 of, the Public Utilities Code, Relating to Public Utilities. 2010-2011 Reg. Sess. (Cal. 2010). Retrieved from http://leginfo.legislature.ca.gov/faces/billNavClient.xhtml? bill_ id=200920100SB1476
Skumatz, L. & Vine, E. (2010). A National Review of Best Practices and Issues in Attribution and Net-to-Gross: Results of the SERA/CIEE White Paper. In: Proceedings of the 2010 ACEEE Summer Study on Energy Efficiency in Buildings.
Spector, A. & Peach, G. (2014). Natural Selection: The Evolution of DSM Valuation and Use of the UCT. In: Proceedings of the 2010 ACEEE Summer Study on Energy Efficiency in Buildings.
St. John, J. (2013). California Expands the Smart Meter to Home Area Network Market. Greentech Grid. Retrieved from http://www.greentechmedia.com/articles/read/california-expands-the-smart-meter-to-home-area-network-market.
St. John, J. (2015). Bidgely’s New Real-Time Energy Disaggregation Tools. Greentech Grid. Retrieved from http://www.greentechmedia.com/articles/read/biddgelys-new-real-time-energy-disaggregation-tools.
Stovall, J., Beldock, J., LeBaron, R., & Saul Rinaldi, K. (2011). Unlocking the Full Value of Green Homes: Why Green Multiple Listing Services are the Key to Residential Energy Efficiency. Washington, DC: National Home Performance Council and Association of Energy and Environmental Real Estate Professionals.
Stuart, E. (2011). The Value of Energy Performance and Green Attributes in Buildings: A Review of Existing Literature and Recommendations for Future Research. Lawrence Berkeley National Laboratory.
Stuart, E. (n.d.). Overcoming Barriers to Valuing Energy Efficiency in Residential Real Estate Transactions: Steps that Energy Efficiency Programs Can Take Now. Lawrence Berkeley National Laboratory.
Stukel, L., Scheu, R., Gamba, C., & Brookstein, P. (2014). Valuing Home Performance Improvements in Real Estate Markets. ACEEE Summer Study on Energy Efficiency Improvements in Buildings.
Thompson, P., Borgeson, M., Zimring, M., Goldman, C., & Kramer, C. (2014, June). “Selling an Energy Efficiency Loan Portfolio in Oregon: Resale of the Craft3 Loan Portfolio to Self-Help Credit Union” (Lawrence Berkeley National Laboratory, LBNL-6663E).
Tweed, K. (2012, May 04). Green Button Changes the Costs of Energy Services. Greentech media. Retrieved from
http://www.greentechmedia.com/articles/read/green-button-changes-the-cost-of-energy-
services
U.S. Department of Energy. (2015a). Advanced Metering Infrastructure and Customer Systems. Retrieved from https://www.smartgrid.gov/recovery_act/deployment_status/ami_and_customer_ systems.html.
U.S. Department of Energy. (2015b). Voluntary Code of Conduct (VUC) Final Concepts and Principles. Retrieved from http://www.energy.gov/sites/prod/files/2015/01/f19/VCC%20Concepts%20and%20Principles%202015_01_08%20FINAL.pdf.
U.S. Department of Energy. (n.d.). Opportunities and Benefits for HPXML Adoption. In: HPXML Implementation Guide. Retrieved from http://hpxmlguide.readthedocs.org/en/latest/program_administrator/opportunities_benefits.html.

88 www.seeaction.energy.gov September 2015
Vermont Energy Labeling Working Group. (2013). Development of a Voluntary Residential Building Energy Label: Report to the Vermont Legislature. Prepared by the Energy Futures Group.
Vine, E. (2011). California’s Market Effect Studies: Key Findings, Lessons Learned, and Future Directions. California Institute for Energy and Environment (CIEE) White Paper. Prepared for California Public Utilities Commission.
Walls, M., Palmer, K., & Gerarden, T. (2013). Is Energy Efficiency Capitalized into Home Prices? Evidence from Three Cities. Washington, DC: Resources for the Future.
Woody, T. (2014, April 18). Wall Street Wants to Lend You Money to Fight Climate Change. Atlantic Monthly (online).
Woolf, T., Malone, E., Neme, C., & LeBaron, R. (2014). Unleashing Energy Efficiency: The Best Way to Comply with EPA’s Clean Power Plan. Public Utilities Fortnightly.
Woolf, T., Malone, E., Takahashi, K., & Steinhurst, W. (2012a). Best Practices in Energy Efficiency Screening: How to Ensure That the Value of Energy Efficiency Is Properly Accounted For. Prepared for the National Home Performance Council.
Woolf, T., Steinhurst, W., Malone, E., & Takahashi, K. (2012b). Energy Efficiency Cost-Effectiveness Screening: How to Properly Account for “Other Program Impacts” and Environmental Compliance Costs. Montpelier, VT: Regulatory Assistance Project.
Woolf, T., Whited, M., Malone, E., Vitolo, T., Hornby, R. (2014). Benefit-Cost Analysis for Distributed Energy Resources. Prepared for the Advanced Energy Economy Institute.
York, D., & Kushler, M. (2011.) The Old Model Isn’t Working: Creating the Energy Utility for the 21st
Century. Washington, DC: American Council for an Energy-Efficient Economy.
Zimring, M., Boreson, M., Todd, A., & Goldman, C. (2013). Getting the Biggest Bang for the Buck: Exploring the Rationales and Design Options for energy Efficiency Financing Programs. Lawrence Berkeley National Laboratory.

September 2015 www.seeaction.energy.gov 89
Appendix A
Use of best practices in conducting energy efficiency screening tests is recommended by a broad range of organizations, including the Regulatory Assistance Project, NESP, and the Northeast Energy Efficiency Partnerships. This appendix provides a short overview of some of the more important practices.
Accounting for All Avoided Costs
The California Standard Practice Manual (CSPM) states that the Utility Cost Test (UCT), the Total Resource Cost test (TRC), the Societal Cost test (SCT) should take into account “the avoided supply costs, the reduction in transmission, distribution, generation, and capacity costs valued at marginal cost for the periods when there is a load reduction” (California Public Utility Commission 2001: 18). Although this guidance appears straightforward, in practice most avoided costs can be calculated in multiple ways, which often involve a trade-off between expense and accuracy. States can choose methods that reflect best practices within their budget constraints.
Some of the best practice issues involved in accounting for avoided costs are described below.
Avoided Costs of Energy and Capacity
All states account for avoided energy and capacity costs in their screening tests, but methods vary. A “capacity and energy” approach, for example, treats variable costs as energy costs and the cost of the next generation plant as fixed costs. This approach can yield variable results, and does not take into account least-cost strategies for addressing peak loads. “Market pricing” approaches, by contrast, separate out the specific need for investment in new generation capacity, and identify the least-cost strategies for meeting peak demand, such as demand-response measures. These latter methods will, in general, provide a more accurate indication of the costs avoided by energy efficiency measures. (For more information, see Lazar and Colburn 2013: 27–29; Woolf et al. 2012a.)
Avoided Costs of Transmission and Distribution (T&D)
Energy efficiency can play an important and sometimes outsized role in preventing or deferring investments in T&D. A 2008 Edison Foundation study forecast that the electric sector alone will need to invest some $880 billion in transmission and generation between 2010 and 2030 (see Chupka et al. 2008: 31). Energy efficiency can reduce the need for these investments (as described in Neme and Sedano 2012: 3–4) by:
Reducing the growth in load in T&D systems through efficiency programs targeting a state or utility service territory (“passive deferral”).
Reducing the need for specific investments as a result of targeted energy efficiency programs (“active deferral”).
In some cases, the energy efficiency interventions will simply delay the investments; in others, they may eliminate the need for the investment at all. Energy efficiency programs’ ability to reduce peak demand can be particularly valuable for reducing the need for specific distribution system investments.
Several methodologies have been developed to assess avoided T&D costs: in general, the more sophisticated methods can capture the benefits of energy efficiency with greater precision, but are more expensive and technically challenging. A number of best practice considerations should be taken into account, such as forecasting. (For an overview of methodological issues, see Lazar and Colburn 2013: 537–538, 539; Woolf et al. 2012a: 25; and Mendota Group 2014.)
The Costs of Compliance with Current and Future Environmental Regulation
Most states take into account the costs that utilities incur to comply with current environmental regulations, such as those regulating nitrogen oxides and sulfur dioxide. As with most other avoided costs, methods for assessing

90 www.seeaction.energy.gov September 2015
these costs vary, and some of the more sophisticated approaches can be considered. (See Lazar and Colburn 2013: 29–32.)
Few states, by contrast, consider the avoided costs of compliance with regulations that are scheduled to come online in the future. These costs can be considered as avoided costs if there is a reasonable possibility that they will be incurred by the utility. (Costs or benefits that accrue to parties other than the utility, such as health benefits, are not avoided costs, and can be considered as participant or societal benefits, as appropriate.) To the extent that there is some uncertainty about the regulations taking effect, the avoided costs can be risk-weighed. As Lazar and Colburn note:
[F]irms subject to environmental regulations can anticipate additional, more stringent regulations in the future and would benefit from planning even before they know the precise details of what will be required. The expectation of future regulation is not mere speculation. Firms can address the uncertainty of future regulatory costs in various ways (e.g., assigning a probability-weighted cost for each risk, assessing a range of possible compliance costs). (Lazar and Colburn 2013: 33)
These future costs are likely to be significant for many utilities as a result of EPA regulations addressing air, water, and toxic waste, including the Mercury/Air Toxics Standard, the 316(b) Water Cooling Rule, and the Wastewater rule, and regulations governing greenhouse gas emissions, such as the new rules designed to regulate carbon emissions under Section 111(d) of the Clean Air Act. Together, these rules will result in significant utility system costs, possibly including plant retirements. (See Lazar and Colburn 2013; Woolf et al. 2012a: 26–29; Woolf et al. 2012b; NEEP 2014: 32–37).
Line Losses
Many states take into account the avoided line losses resulting from the implementation of energy efficiency measures.
73 However, most of these states use system average rather than marginal line losses, so the benefits of
energy efficiency savings are typically not fully accounted for. Marginal line losses—the losses that occur at the time that the energy efficiency savings are realized—are significant because they are much higher than average at times of peak load. A comprehensive Regulatory Advisory Project study estimated marginal line losses at about 150% of system average losses as a rough rule of thumb, although specific savings will vary depending on the size of the load and other factors. Because many energy efficiency measures contribute disproportionately to peak load savings, the line losses avoided are larger than indicated by system average losses. (See Lazar and Baldwin 2011: 4–5, 8; Woolf et al. 2012a: 30).
Marginal line loss calculations and avoided reserve requirements should be an integral part of any evaluation of the benefits of energy efficiency measures. (Lazar and Baldwin 2011: 8)
Appropriate Study Period and Appropriate Measure Lives
Many states have designed cost-effectiveness tests to consider program benefits for only a 15- or 20-year period. Yet many of the benefits of these programs have useful lives for much longer: insulation, for example, may have a useful life of three decades or more. To accurately quantify the benefits of energy efficiency, cost-effectiveness tests should use a 30-year study period. They can also use the best available estimates of the effective useful life of energy efficiency measures, rather than arbitrarily imposing a 15- or 20-year cap on all measures. (See Woolf et al. 2012a.)
Demand Reduction Induced Price Effect
73 States that take line losses into consideration in cost-effectiveness screening include Colorado, Connecticut, Delaware, Illinois, Massachusetts, Michigan, Minnesota, New Hampshire, New York, Oregon, Rhode Island, Vermont, and Wisconsin.

September 2015 www.seeaction.energy.gov 91
Energy efficiency reduces demand for energy. In states with wholesale energy markets, the cost of energy varies with load: prices rise as the required output increases, and fall as it decreases. As a result, reductions in demand caused by implementation of energy efficiency measures lowers the market clearing price, resulting in savings for all utility customers. This savings is usually temporary, as the market reacts to the new demand, but its effect can be experienced for several years. The demand reduction created by energy efficiency programs typically result in very small dollar price reductions for each MWh of savings, but in the aggregate even these small reductions can result in significant savings for consumers in absolute dollars. (See Lazar and Colburn 2013: 42–43; Woolf et al. 2012a.)
Note that demand reduction induced price effect (DRIPE) is only relevant in states with wholesale energy markets, which total fewer than 20.
Discount Rate
The choice of an appropriate discount rate for a particular cost-effectiveness test is a difficult choice because a discount rate can reflect several issues, including:
Cost of capital
Risk
Time value of money
Cost of capital is most frequently taken into account when discount rates are determined: a discount rate reflecting a utility sector’s weighted average capital is one of the most common rates used. This choice typically does not take into account the fact that energy efficiency is typically funded by ratepayer funds, which do not have a cost of capital, and that energy efficiency investments carry a much lower risk than most other utility investments. Energy efficiency investments can reduce utilities’ project risks (the risks associated with capital investments in generation, distribution, transmission, and other infrastructure) and portfolio risks associated with insufficient diversification. Accordingly, for many contexts, a discount rate significantly lower than the utility weighted average cost of capital is approached. As a best practice, the choice of discount rate can at least account for the low-risk nature of energy efficiency investments. (For an extended discussion of these issues, see NEEP 2014: 36–48.)
Net-to-Gross, Spillover, and Market Transformation
Many cost-effectiveness tests include a net-to-gross calculation designed to reduce total savings by an amount equal to the savings incurred by free riders (i.e., participants who would made the energy efficiency improvement even in the absence of a program incentive). Net-to-gross calculations are done in many different ways, and there is no clear national consensus regarding precise methodologies.
Spillover is conceptually the opposite of free ridership: a situation in which a homeowner decides to make an energy efficiency improvement because they were influenced by an energy efficiency program participant or by the program’s marketing, even though they do not take advantage of a program rebate or other incentive. Market transformation is the extension of this phenomenon on a broad scale, such that the purchasing or other efficiency-related activities promoted by a program become broadly adopted. A number of studies have indicated that spillover and market transformation effects can be at least as significant as net-to-gross.
To date, cost-effectiveness tests have been less likely to address spillover and market transformation than net-to-gross. However, there is increasingly broad agreement that if a net-to-gross adjustment is made, spillover and market transformation effects can also be taken into account in the tests. (The principle that net-to-gross, spillover, and market transformation should all be considered in the quantification of net savings was the one issue that a group of experts interviewed by ACEEE unanimously agreed upon.) (See Kushler et al. 2014: 17.)

92 www.seeaction.energy.gov September 2015
Policymakers can draw from a range of existing methods for assessing and quantifying the spillover and market transformation effects of energy efficiency programs. (See Kushler et al. 2014: 29; Woolf et al., 2012a: 44–45.)

This document was developed as a product of the State and Local Energy Efficiency Action Network (SEE Action), facilitated by the U.S. Department of Energy/U.S. Environmental Protection Agency. Content does not imply an endorsement by the individuals or organizations that are part of SEE Action working groups, or reflect the views, policies, or otherwise of the federal government.