a polymeric triple-layered tablet for stratified zero...
TRANSCRIPT

i
A POLYMERIC TRIPLE-LAYERED TABLET FOR STRATIFIED ZERO-ORDER DRUG
RELEASE
KOVANYA MOODLEY
A dissertation submitted to the Faculty of Health Sciences, University of the Witwatersrand,
in fulfilment of the requirements for the degree of Master of Pharmacy
SSuuppeerrvviissoorr::
Professor Viness Pillay
Department of Pharmacy and Pharmacology, University of the Witwatersrand, South Africa
CCoo--SSuuppeerrvviissoorrss::
Dr. Yahya Essop Choonara
Department of Pharmacy and Pharmacology, University of the Witwatersrand, South Africa
Ms. Lisa Claire du Toit
Department of Pharmacy and Pharmacology, University of the Witwatersrand, South Africa
JJoohhaannnneessbbuurrgg,, 22001111
ii
DDEECCLLAARRAATTIIOONN
I, Kovanya Moodley, declare that this dissertation is my own work. It has being submitted for
the degree of Master of Pharmacy in the Faculty of Health Sciences in the University of the
Witwatersrand, Johannesburg. It has not been submitted before for any degree or
examination at this or any other University.
………………………………….
This 28th day of February 2012

iii
RESEARCH OUTPUTS
1. Research Publications
Oral Drug Delivery Systems Comprising Altered Geometric Configurations for Controlled
drug delivery*
Kovanya Moodley, Viness Pillay, Yahya E. Choonara, Lisa C. du Toit, Valence M.K.
Ndesendo, Shivaan Cooppan, Priya Bawa and Pradeep Kumar
*Submitted to the International Journal of Molecular Sciences
Computational Mechanistic Characterization and Drug Release Evaluation of Novel
Polymeric Triple-layered Solid Matrix Configurations for Stratified Zero-order Drug Release*
Kovanya Moodley, Viness Pillay, Yahya E. Choonara, Lisa C. du Toit, Valence M.K.
Ndesendo, Pradeep Kumar, Leith Meyer, Riaz A. Khan and Nthato Chirwa
*Submitted to the Journal of Biocompatible Polymers
2. Conference Outputs
Intonation of diphenhydramine release from a multifaceted tablet configuration. Poster
presented at Academy of Pharmaceutical and Pharmacological Sciences of South Africa, 22-
26 September 2008, Magaliesburg, South Africa.
Kovanya Moodley, Thiresen Govender, Viness Pillay, Yahya E. Choonara and Lisa C. du
Toit.
Development of a Novel Polymeric Triple-layered Solid Matrix for Flexible Zero-order Drug
Release. Poster presented at International Conference of Pharmaceutical and
Pharmacological Sciences, 23-26 September 2009, Potchefstroom, South Africa.
Kovanya Moodley, Poonam Rama, Viness Pillay, Yahya E. Choonara and Lisa C. du Toit.
Composite Polymeric Blends for Potential Zero-order Drug Release Kinetics from a Triple-
layered Tablet Matrix. Poster presented at the American Academy of Pharmaceutical
Sciences conference, November 2009, Los Angeles, USA.
Kovanya Moodley, Viness Pillay, Yahya E. Choonara and Lisa C. du Toit.
Matrix Tablet Configurations for Constant Multiple Drug Delivery. Poster presented at the
APS UKPHARMSCI conference, September 2010, Nottingham, UK.
Kovanya Moodley, Viness Pillay, Yahya E. Choonara and Lisa C. du Toit.

iv
PATENTS
A Polymeric Stratified Drug Release Tablet, University of the Witwatersrand, Kovanya
Moodley, Viness Pillay, Yahya Essop Choonara and Lisa Claire Du Toit
Publication date: 30/07/2010
Patent Application Number: 2010/03744
v
AABBSSTTRRAACCTT
Patient compliance is a major factor in achieving optimal therapeutic outcomes. Pill burden, due to multiple drug therapies, has a great detrimental impact on compliance of the patient. Dose-dependent side-effects, associated with peak-trough plasma fluctuations of drugs, also have a negative impact on patient compliance with drug therapy. It is under these circumstances that zero-order drug release kinetics proves to be ideal. This is due to the lack of peak-trough fluctuations that occur with zero-order drug release, thereby minimizing the side-effects of drug therapy. Furthermore, a drug delivery system that may deliver more than one drug at a time may be beneficial to alleviate the pill burden associated with chronic diseases or specific health conditions. Novel drug delivery systems have been developed that offer zero-order or linear drug release. Amongst such systems are multilayered tablets. However these systems generally offer the delivery of just one drug. The development of a delivery system that is able to deliver up to three drugs in a zero-order manner may prove to be significantly beneficial to greatly increase patient compliance and in turn therapeutic efficacy. The purpose of this study was to design a novel triple-layered tablet (TLT) matrix targeted at achieving stratified zero-order drug release. The central factor for the establishment of the TLT was the selection of ideal and novel polymers that are capable of acting as superior drug release matrices. Modified polyamide 6,10 (PA6,10) and salted-out poly(lactic-co-glycolic acid) (PLGA) were employed as the outer drug-carrier matrices whereas poly(ethylene oxide) (PEO) was used as the middle layer drug matrix. Specialized granulation techniques and direct compression were employed to prepare the TLT matrices. Diphenhydramine HCl, ranitidine HCl and promethazine were chosen as model drugs for the study due to their similar high aqueous solubilities (100mg/mL). Matrix hardness, gel strength, swelling/erosion characteristics, Fourier Transform Infrared spectroscopy, Differential Scanning Calorimetry and in vitro drug release analysis employing High Performance Liquid Chromatography were performed on the TLT matrices in order to determine the physicomechanical and physicochemical nature of the TLT matrices. Computational molecular modeling (CMM) was employed to characterize the formation and dissolution of the TLT matrices. A box-Behnken experimental design was employed that resulted in the generation of 17 design formulations for ultimate optimization. In vivo animal studies were performed in the Large White Pig model to assess drug release behavior of the TLT. Ultra Performance Liquid Chromatography was employed for plasma sample analysis. The PA 6,10 layer provided relatively linear and controlled drug release patterns with an undesirable burst release greater than 15%, which upon addition of sodium sulphate was greatly reduced. The addition of PEO to the salted-out PLGA layer greatly reduced the initial burst release that occurred when salted-out PLGA matrix was used alone. Desirable results were obtained from FTIR, hydration and swelling/erosion analysis. CMM elucidated the possible mechanism of zero-order release from respective layers. Upon completion of the Box-Behnken design analysis, an optimized TLT formulation was established according to the formulation responses selected namely the rate constants and correlation coefficients. The TLT displayed desirable near linear release of all three drugs simultaneously over 24 hours, with approximately 10%, 50% and 90% of the drugs released in 1, 10 and 24 hours. An in vitro drug release comparison performed between the optimized TLT and the commercial tablets currently used, showed an unequivocal display of superiority of the TLT in terms of linear drug release over commercial tablets. A cardiovascular related drug regimen (Adco-simvastatin®, DISPRIN CV® and Tenormin 50®) was applied to the TLT to assess the flexibility of incorporating a range of drugs. The TLT furthermore provided near linear to linear release of the therapeutic regimen over 24 hours and maintained superiority over the commercial tablets. Benchtop Magnetic Resonance Imaging, porosity analysis and Scanning Electron Microscopy was utilized for further introspective characterization of the TLT. In vivo analysis demonstrated a definite control of drug release from the TLT as compared to commercial tablets which further confirmed the advantage of the TLT.

vi
AACCKKNNOOWWLLEEDDGGEEMMEENNTTSS
Foremost to my parents Alan and Shareena Moodley for sacrificing in order to provide for us,
and to my siblings Kody and Siara Moodley for their support.
To my family Mahadevi Reddy, Bathmadevi Naidoo, Gonadevi Anthony, Renu Pramlall,
Peter Moodley and Ajeeth Pramlall for their guidance and support throughout the years.
To my supervisor, Professor Viness Pillay, for his dedication to science and continuous
encouragement to push frontiers.
To my co-supervisors, Dr. Yahya Choonara and Ms Lisa du Toit, for their readiness to offer
help and knowledge which greatly aided my research.
To my mentors Dr. Valence Ndesendo, Ndidi Ngwuluka and Pradeep Kumar for their wisdom
and invaluable inputs to my research.
To my dearest “Majestic” alternate family Yashodan Naidoo, Kavitha Nundkwar, Natanya
Moodley, Narushka Pillay, Vinodhum Pillay, Chantal Koomcaran, Shivaan Cooppan,
Sambarthan Cooppan, Priyen Naidu, Firdaus Nabeemeeah, Rynae Grewan, Janine Carim,
Kiren Pillay, and Taygan Pillay for the fun times and de-stressing sessions as well as the
great support system they have offered me.
To my dear friends: Ameena Wadee, Derusha Frank, Thiresen Govender, Rubina Shaikh,
Yusuf Dawood, Clare Dott, Thomas Tsai, Tasneem Rajan, Latavia Singh, Deshnee Naidoo
and Yasien Docrat for the good times and support they have offered me both on and off
campus.
To my fellow research colleagues: Caragh Murphy, Deshika Reddy, Priya Bawa, Zaheeda
Khan, Pius Fasinu, Steven Mufamadi, Deanne Hazle, Nonhlanhla Masina, Sheri-lee Harrilal,
Samantha Pillay, Nthato Chirwa, Felix Mashingaidze, Ahmed Seedat, Angus Hibbins and
Raeesa Moosa for their advice and utmost willingness to assist me with the challenges I
faced during my studies.
To Sello Ramarumo, Tebogo Chandu, Kleinbooi Mohlabi and Bafana Temba for their
essential assistance with the running of the laboratories.

vii
To the Central Animal Services at the University of the Witwatersrand for their tremendous
knowledge and teachings regarding my in vivo studies.
To the National Research Foundation (NRF) for their financial assistance which was
immensely appreciated.
To the TATA Foundation for awarding me a prestigious scholarship that greatly assisted me
during my studies.
To the staff of the Department of Pharmacy and Pharmacology, Professor Michael
Danckwerts, Professor Sandy Van Vuuren, Mr. David Bayever, Ms. Shirona Naidoo, Ms.
Neelaveni Padayachee, Ms. Sibongile Sibambo, Ms. Neha Singh and Ms. Busi Damane for
their support, assistance and insight.

viii
DEDICATION
This dissertation is dedicated to my parents Alan and Shareena Moodley. Thank you for
providing only the best for me.

ix
TABLE OF CONTENTS
CHAPTER 1
INTRODUCTION
1.1…………Background to the Study-------------------------------------------------------------------------1
1.2…………Rationale and Motivation for this Study------------------------------------------------------3
1.3…………Novelty of the Proposed Triple-layered Tablet---------------------------------------------5
1.4…………Aims and Objectives of the Study-------------------------------------------------------------5
1.5…………Overview of the Dissertation--------------------------------------------------------------------6
CHAPTER 2
REVIEW OF ORAL DRUG DELIVERY SYSTEMS COMPRISING ALTERED GEOMETRIC
CONFIGURATIONS FOR CONTROLLED DRUG DELIVERY
2.1…………Introduction………………………………………………………………………………7
2.2…………Multilayered Tablets for Controlled Drug Delivery…………………………………..9
2.2.1………Geomatrix® multilayer tablet technology…………………………………………….11
2.2.2………Sodas® multilayer tablet technology…………………………………………………11
2.3…………Factors Influencing the Rate of Drug Release from Multilayered Tablets………13

x
2.3.1………Polymers employed in multilayered tablets…………………………………………13
2.3.2………Structure of the multilayered tablet device………………………………………….14
2.4…………Bilayered Tablets………………………………………………………………………15
2.4.1……….VersaTab® bilayered tablet technology……………………………………………..16
2.5…………Triple-layered Tablets…………………………………………………………………17
2.5.1………GeolockTM technology………………………………………………………………….17
2.5.2………Various drug release profiles achievable by triple-layered tablets……………….18
2.6…………Multilayered Osmotic Devices………………………………………………………..20
2.7…………Multilayered Floatable Drug Delivery Systems…………………………………….21
2.8…………Core-in-cup Devices…………………………………………………………………..22
2.9…………Procise® Technology………………………………………………………………….23
2.10………..Donut-shaped Devices for Controlled Drug Delivery……………………………...24
2.11………..Dome Matrix® and “release modules assemblage” Technology…………………26
2.12………..Concluding Remarks………………………………………………………………….27

xi
CHAPTER 3
FORMULATION, DEVELOPMENT AND CHARACTERIZATION OF NOVEL TRIPLE-
LAYERED TABLETS MATRICES FOR ZERO-ORDER DRUG RELEASE
3.1…………Introduction…………………………………………………………………………….29
3.2.1………Materials………………………………………………………………………………...31
3.2.2………Methods…………………………………………………………………………………32
3.2.2.1…....Synthesis of modified polyamide 6,10 using a modified interfacial polymerization
…………….reaction………………………………………………………………………………….32
3.2.2.2…….Synthesis of salted-out PLGA………………………………………………………..32
3.2.2.3…….Fourier Transform Infrared Spectroscopy analysis of components of the Triple-
…………….Layered Tablet formulations for the determination of molecular variations after
…………….compression and hydration…………………………………………………………...32
3.2.2.4…….Differential Scanning Calorimetry and Alternating Differential Scanning
…………….Calorimetry analysis of polymeric material to characterize thermal behavior and
…………….determine the presence of polymer-polymer molecular interactions…………….33
3.2.2.5…….Preparation of TLT formulations……………………………………………………..33
3.2.2.6…….Computational modeling to determine the nature of formation and dissolution
…………….behavior of the TLT……………………………………………………………………34

xii
3.2.2.7…….In vitro dissolution studies for DPH release analysis………………………………34
3.2.2.8…….Determination of matrix swelling and gel strength using textural analysis………35
3.2.2.9…….Assessment of erosion of the modified PA6,10 layer……………………………..35
3.2.2.10…...Determination of matrix hardness…………………………………………………...35
3.2.2.11…..Molecular mechanics simulations…………………………………………………….36
3.3…………Results and Discussion……………………………………………………………….37
3.3.1………Molecular variations after compression of matrices employing Fourier Transform
…………….Infrared Spectroscopy…………………………………………………………………37
3.3.2………DSC and ADSC analysis for the determination of thermal variations and
…………….molecular interactions…………………………………………………………………39
3.3.3………Computational modelling of the formation and dissolution of the Triple-Layered
…………….Tablet……………………………………………………………………………………40
3.3.4………In vitro drug release from the TLT formulations…………………………………….42
3.3.4.1……Assessment of DPH release from the PA6,10 layer………………………………..42
3.3.4.3……DPH release from the s-PLGA layer…………………………………………………43
3.3.4.4……Drug release from the middle PEO layer…………………………………………….44

xiii
3.3.5………Determination of axial and radial swelling and gel strength upon hydration of the
……………TLT formulations………………………………………………………………………..44
3.3.6………Determination of degree of erosion of the PA6,10 layer upon hydration over 24
……………hours in correlation with drug release behavior……………………………………..46
3.3.7………Effect of matrix hardness on drug release behavior……………………………….46
3.3.8………Molecular mechanics assisted model building and energy refinements, influence
…………….of addition of salts on the performance of PA6,10 layer…………………………..47
3.3.9……....Influence of the incorporation of PEO on the performance of the
…………….s-PLGA layer…………………………………………………………………………...51
3.4…………Concluding Remarks………………………………………………………………….52
CHAPTER 4
EXPERIMENTAL DESIGN AND STATISTICAL OPTIMIZATION OF THE TRIPLE-
LAYERED TABLET MATRICES
4.1…………Introduction…………………………………………………………………………….53
4.2………...Materials and Methods………………………………………………………………..54
4.2.1………Materials………………………………………………………………………………...54
4.2.2………Methods…………………………………………………………………………………54

xiv
4.2.2.1…….Determination of appropriate independent formulation variables to explicate
…………….desired responses for the TLT matrices…………………………………………….54
4.2.2.2…….Box-Behnken Experimental Design for the evaluation of drug release from the
…………….TLT matrices……………………………………………………………………………55
4.2.2.3…….Selection of measured formulation responses for the experimental optimization
…………….of TLT formulations……………………………………………………………………56
4.2.2.4……..Preparation of the design formulations……………………………………………..57
4.2.2.6……..High Performance Liquid Chromatographic analysis of in vitro
……………..dissolution samples…………………………………………………………………...57
4.3…………Results and Discussion………………………………………………………..……..60
4.3.1………In vitro drug release analysis of the Box-Behnken Design formulations………...60
4.3.4.1…….DPH rate constants……………………………………………………………………62
4.3.4.2…….RDH rate constants……………………………………………………………………63
4.3.5………Evaluation of correlation coefficients obtained from experimental design
…………….formulations…………………………………………………………………………….64
4.3.5.1…….DPH correlation coefficients………………………………………………………….64
4.3.5.2…….RDH correlation coefficients………………………………………………………….66

xv
4.3.6………Assessment of the experimental and fitted response values calculated for the
……………..experimental optimization of TLT formulations…………………………………….67
4.3.7………Evaluation of residual plots for optimization and subsequent response
…………….optimization of the TLT matrices……………………………………………………..69
4.3.8………Response Optimization………………………………………………………………..75
4.4…………Concluding Remarks………………………………………………………………….78
CHAPTER 5
CHARACTERIZATION AND FURTHER INTROSPECTIVE EVALUATION OF THE
OPTIMIZED TRIPLE-LAYERED TABLET FORMULATION
5.1…………Introduction…………………………………………………………………………….80
5.2…………Materials and Methods………………………………………………………………..81
5.2.1………Materials………………………………………………………………………………...81
5.2.2.1…….Brinell Hardness Number evaluation of the optimized TLT formulation…………81
5.2.2.2…….Morphological surface structure imaging of the optimized TLT formulation
……………..employing Scanning Electron Microscopy………………………………………….81
5.2.2.3…….Porosity analysis of the PA6,10 layer of the optimized TLT formulation………...81
5.2.2.4…….In vitro dissolution testing on SLEEPEZE-PM®, Ranihexal®and Phenergan®…..81

xvi
5.2.2.5…….Application of a therapeutic drug regimen to the optimized TLT formulation…...82
5.2.2.6…….Comparative in vitro dissolution analysis between the conventional therapeutic
…………….regimen formulations and the release of therapeutic regimen drugs from the
…………….optimized TLT formulation…………………………………………………………….82
5.2.2.7…….Benchtop Magnetic Resonance Imaging of TLT performance………………….83
5.3…………Results and Discussion……………………………………………………………….83
5.3.1……….Assessment of BHN…………………………………………………………………..83
5.3.2……….SEM images depicting the PA6,10 layer surface of the
……………..TLT………………………………………………………………………….................84
5.3.3……… Porosity analysis………………………………………………………………………85
5.3.4……….Comparative analysis of drug release behavior from conventional tablets
……………..SLEEPEZE-PM®, Ranihexal®and Phenergan® and
……………..optimized TLT formulation……………………………………………………………85
5.3.5……….Establishment of the efficacy of the TLT for the controlled delivery of a
……………..cardiovascular therapeutic drug regimen…………………………………………..87
5.3.5.1……..Construction of calibration curves…………………………………………………..87
5.3.5.2……..Characterization of drug release behavior after the incorporation of ATN, ASA
……………..and SMV into the TLT………………………………………………………………...88

xvii
5.3.6……….Comparative in vitro dissolution analysis between the conventional therapeutic
……………..regimen tablets and the release of ATN, ASA and SMV from the optimized TLT
……………..formulation……………………………………………………………………………..89
5.3.7……….Benchtop Magnetic Resonance Imaging analysis of the optimized TLT
……………..formulation……………………………………………………………………………..91
5.4…………Concluding Remarks………………………………………………………………….92
CHAPTER 6
IN VIVO ASSESSMENT OF THE TRIPLE-LAYERED TABLET MATRIX IN THE LARGE
WHITE PIG MODEL
6.1…………Introduction…………………………………………………………………………….93
6.2…………Materials and Methods………………………………………………………………..93
6.2.1……….Materials………………………………………………………………………………..93
6.2.2……….Methods………………………………………………………………………………..94
6.2.2.1……..Habituation of pigs prior to drug administration……………………………………94
6.2.2.3…….Administration of the conventional tablets to the Large White Pig model………96
6.2.2.5…….Blood sample collection from the jugular vein catheter port of the Large White
…………….Pig model……………………………………………………………………………….97

xviii
6.2.2.6…….Development of a method for sample analysis employing Ultra Performance
…………….Liquid Chromatography™…………………………………………………………….98
6.2.2.7…….Selection of a suitable method for extraction of ATN, ASA and SMV from plasma
……………..for UPLC analysis……………………………………………………………………..99
6.2.2.8…….Preparation of calibration curves and limit of quantification for ATN, ASA and
…………….SMV in plasma………………………………………………………………………..100
6.2.2.9.........UPLC analysis of drug release after the in vivo administration of Tenormin®,
…………….Adco-Simvastatin 40 and Disprin CV® and the optimized TLT formulation…….100
6.3…………Results and Discussion……………………………………………………………..100
6.3.1………Behavior of pigs after insertion of a jugular vein catheter and after administration
……………of the optimized TLT formulation……………………………………………………100
6.3.2………Validation of selected method for UPLC analysis of plasma samples………….101
6.3.3………Liquid-liquid extraction and assessment of UPLC chromatographic separation
…………….method in plasma……………………………………………………………………102
6.3.4………Calibration curves prepared for the quantitative analysis of ATN, ASA and SMV
…………….in plasma……………………………………………………………………………..103
6.3.5………Assessment of in vivo drug release from Tenormin® 50; DISPRIN CV®100 and
……………Adco-Simvastatin 40………………………………………………………………….104

xix
6.3.6………Assessment of in vivo drug release from the optimized TLT formulation………106
6.4…………Concluding Remarks………………………………………………………………...108
CHAPTER 7
CONCLUSIONS AND RECOMMENDATIONS
7.1. Conclusions……………………………………………………………………………………109
7.2. Recommendations…………………………………………………………………………….110
REFERENCES……………………………………………………………………………………..112

xx
LIST OF FIGURES
Figure 1.1………..Schematic diagram demonstrating peak-to-trough fluctuations and the
……………………effect of zero-order drug release on plasma drug concentration ............... 4
Figure 2.1………..Various polymeric formulations of multilayered tablets and possible drug
……………………release behavior ..................................................................................... 10
Figure 2.2………..A typical Geomatrix® multilayered tablet ................................................. 11
Figure 2.3………..A schematic representation of Sodas® multilayer tablet technology ........ 12
Figure 2.4………..Smartrix® technology .............................................................................. 15
Figure 2.5………..a) VersaTab® bilayered tablet; Profiles depicting VersaTab® bilayered
……………………tablet technology: b) One bioactive-controlled release; c) Two bioactives-
……………………immediate release and controlled release ............................................... 17
Figure 2.6………..A schematic of a triple layered GeolockTM tablet .................................... 18
Figure 2.7………..Schematic depiction of a multilayered osmotic device ............................ 21
Figure 2.8………..Typical geometries of core-in-cup tablets ............................................... 23
Figure 2.9………..a) Aerial schematic of Procise® technology, b) Two-dimensional schematic
……………………of Procise® technology ............................................................................ 24
xxi
Figure 2.10………A schematic of a triple-layered, donut-shaped tablet. ............................. 25
Figure 2.11……....a) Dome matrix® module b) “void” configuration, c) “piled” configuration 26
Figure 3.1………..Schematic diagram of the TLT ................................................................ 34
Figure 3.2………..a) FTIR Spectrum of compressed and non-compressed PA6,10, b) FTIR
……………………spectra of compressed s-PLGA, compressed PEO and combined
……………………compressed s- PLGA and PEO .............................................................. 38
Figure 3.3………..DSC thermograms of a) uncompressed PA6,10, b) compressed PA6,10; c)
……………………uncompressed s-PLGA and d) compressed s-PLGA .............................. 39
Figure 3.4………..DSC and ADSC thermograms of compressed salted-out PLGA and PEO
……………………at a) 0-360°C, b) 0-130°C c) 240-280°C, d) 40-100°C ............................ 40
Figure 3.5………..a) Compressed TLT containing layers of polymer matrices and drug with
……………………intermixed layers; b) Different layering in the compressed tablet formation;
……………………c) disintegration of the compressed TLT in the dissolution medium. ....... 41
Figure 3.6………..Calibration curve for the determination of DPH in a) SGF (pH 1.2, 37°C)
……………………and b) PBS (pH 6.8, 37°C) ..................................................................... 43
Figure 3.7………..DPH release profiles from a) 300mg PA6,10 layer; b) 300mg PA6,10 and
……………………50mg SS ................................................................................................. 43

xxii
Figure 3.8………..Drug release profiles from a) 300mg s-PLGA; b) 50mg s-PLGA: 300mg
……………………PEO ........................................................................................................ 44
Figure 3.9………..DPH release profiles from 350mg PEO, (N=2) ....................................... 44
Figure 3.10………a) Force-distance profile for the s-PLGA layer after 2 hours of hydration in
……………………SGF (pH 1.2, 37°C), b) Force-distance profile generated for s-PLGA layer
……………………after 12 hours of hydration in SGF, c) Force-distance profile generated for
……………………s-PLGA layer after 24 hours of hydration in SGF. ................................... 45
Figure 3.11………Typical force-distance profile for 50mg s-PLGA: 300mg PEO ................. 47
Figure 3.12………Geometrically constrained models of the polyamide-metal ion complexes
……………………derived from molecular mechanics calculations: (a) PA6,10-non energy-
……………………minimized; (b) PA6,10-energy minimized; (c) PA6,10-Ca2+; (d) PA6,10-
……………………Zn2+; and (e) PA6,10-Na+. Color codes for elements are: Carbon (cyan),
……………………Nitrogen (blue) and Oxygen (red), Calcium (yellow), Zinc (brown) and
……………………Sodium (purple). ..................................................................................... 48
Figure 3.13………Schematic of reference Polyamide with intermolecular hydrogen bonds
……………………(top) and Polyamide complexed with ZnSO4 as example (bottom) .......... 50
Figure 3.14………Visualization of optimized geometrical preferences showcasing the s-
…………………….PLGA-PEO complex systems: (a) before and (b) after molecular
…………………….mechanics’ energy refinements. Color codes: s-PLGA (yellow) and PEO
……………………(standard element colors: Carbon (cyan), Nitrogen (blue)
…………………….and Oxygen (red) ................................................................................... 51
xxiii
Figure 3.15………Connolly molecular electrostatic potential surfaces in translucent display
……………………mode showcasing the PLGA-PEO complex systems: (a) before and (b)
……………………after molecular mechanics’ energy refinements. Color codes: PLGA
……………………(yellow) and PEO (red) ........................................................................... 52
Figure 4.1……….Chromatogram depicting the separation peaks of DPH and MP………….58
Figure 4.2………..Calibration curves for DPH quantification in a) PBS (pH 6.8, 37°C) and b)
……………………SGF (pH 1.2, 37°C) ................................................................................ 58
Figure 4.3………..Chromatogram depicting the separation peaks of RDH, PMZ and CP .... 59
Figure 4.4………..Calibration curves for PMZ quantification in a) PBS (pH 6.8, 37°C) and b)
……………………SGF (pH 1.2, 37°C) ................................................................................ 59
Figure 4.5………..Calibration curves for RDH quantification in a) PBS (pH 6.8, 37°C) and b)
……………………SGF (pH 1.2, 37°C) ................................................................................ 60
Figure 4.6………..Drug release profiles of a) DPH; b) PMZ; c) RDH from the design
……………………formulations in PBS (pH 6.8, 37°C) ......................................................... 61
Figure 4.7………..Contour plots of the relationship between rate constant and polymer
……………………concentration for DPH release in SGF (pH 1.2, 37°C) ............................ 63
Figure 4.8………..Contour plots of the relationship between k values and polymer
……………………concentration for RDH release in SGF (pH 1.2, 37°C). ........................... 64

xxiv
Figure 4.9………..Vertical bar chart displaying the average correlation coefficients (R2) of the
……………………design formulations in a) PBS (pH 6.8, 37°C) and b) SGF (pH 1.2, 37°C),
……………………(N=2) ...................................................................................................... 65
Figure 4.10………Contour plots depicting the relationship between the polymer mixtures and
……………………the R2 values of DPH release from the design formulations in PBS (pH 6.8,
……………………37°C) ...................................................................................................... 66
Figure 4.11………Contour plots depicting the relationship between the polymer mixture and
……………………the R2 values of the release of RDH from the design formulations
……………………in PBS (pH 6.8, 37°C) ............................................................................. 67
Figure 4.12………Regression plots for k for a) DPH in SGF (pH 1.2, 37°C), b) DPH in PBS
……………………(pH 6.8, 37°C), c) RDH in SGF and d) RDH in PBS (pH 6.8, 37°C) ..... 68
Figure 4.13……….Regression plots for correlation coefficients (R2 values) for a) DPH in SGF
…………………….(pH 1.2, 37°C), b) DPH in PBS (pH 6.8, 37°C) and c) RDH in SGF and d)
……………………..RDH in PBS (pH 6.8, 37°C) .................................................................. 69
Figure 4.14……….Diagnostic plots showing residual plots for rate constant (k) of DPH
…………………….in PBS (pH 6.8, 37°C) ............................................................................ 70
Figure 4.15……….Diagnostic plots indicating the residual plots for rate constant (k) of RDH
…………………….in PBS (pH 6.8, 37°C). ........................................................................... 70
Figure 4.16……….Diagnostic plots indicating the residual plots for correlation coefficients
……………………..(R2 values) for DPH in PBS (pH 6.8, 37°C) ........................................... 71

xxv
Figure 4.17………Diagnostic plots indicating the residual plots for correlation coefficients (R2
……………………values) for RDH in PBS (pH 6.8, 37°C) ................................................... 71
Figure 4.18………Diagnostic plots indicating the residual plots for rate constants (k) for DPH
……………………in SGF (pH 1.2, 37°C)............................................................................. 72
Figure 4.19………Diagnostic plots indicating the residual plots for rate constants (k) for RDH
…………………….in SGF (pH 1.2, 37°C) ............................................................................ 72
Figure 4.20………Diagnostic plots indicating the residual plots for correlation coefficients (R2
……………………values) for DPH in SGF (pH 1.2, 37°C) ................................................... 73
Figure 4.21………Diagnostic plots indicating the residual plots for correlation coefficients (R2
……………………values) for RDH in SGF (pH 1.2, 37°C) .................................................. 73
Figure 4.22………Optimization plots for rate constants in SGF (pH 1.2, 37°C) ................... 76
Figure 4.23………Optimization plots for rate constants in PBS (pH 6.8, 37°C) ................... 76
Figure 4.24………Drug release profiles of a) DPH; b) RDH and c) PMZ from the optimized
……………………TLT formulation ...................................................................................... 78
Figure 5.1………..Typical SEM images of the PA6,10 layer of the TLT depicting the irregular
……………………surfaces .................................................................................................. 84
Figure 5.2………..Drug release profiles from conventional tablets a) SLEEPEZE-PM®, b)
……………………Phenergan® and c) Ranihexal® ............................................................... 86

xxvi
Figure 5.3………..Calibration curve for ATN in a) PBS (pH 6.8, 37°C) and b) SGF (pH 1.2,
……………………37°C) ...................................................................................................... 87
Figure 5.4………..Calibration curves for ASA in a) PBS (pH 6.8, 37°C) and b) SGF (pH 1.2,
……………………37°C) ...................................................................................................... 87
Figure 5.5………..Calibration curves for SMV in a) PBS (pH 6.8, 37°C) and b) SGF (pH 1.2,
……………………37°C) ...................................................................................................... 87
Figure 5.6………..Drug release profile of ATN from optimized TLT formulation .................. 88
Figure 5.7………..Drug release profile of ASA from optimized TLT formulation .................. 89
Figure 5.8………..Drug release profile of SMV from optimized TLT formulation .................. 89
Figure 5.9………..Drug release profiles of Tenormin® 50 .................................................... 90
Figure 5.10………Drug release profiles of DISPRIN CV®100 .............................................. 90
Figure 5.11………Drug release profiles of Adco-Simvastatin 40 ......................................... 90
Figure 5.12………MRI images of the TLT during dissolution at specific time points ............ 92
Figure 6.1………..Farm unit and housing of pig .................................................................. 94
Figure 6.2………..Daily habituation process of feeding and behavioral learning ................. 94

xxvii
Figure 6.3………..Digital photographs demonstrating a) Oxygen supply to animal after
……………………anaesthetization, b) Monitoring of heart rate, c) administration of injections
……………………and d) shaving of operating area ............................................................ 95
Figure 6.4………..Digital photographs demonstrating a) Catheter to be inserted into jugular
..............................vein, b) exposure of jugular vein for insertion, c) insertion of catheter into
..............................jugular vein, d) stitching up of wound with ports exposed for blood
..............................sampling ................................................................................................ 96
Figure 6.5………..Schematic diagram depicting the number of pigs required and the steps
……………………involved during the in vivo studies .......................................................... 97
Figure 6.6………..Schematic diagram depicting the sequential process the liquid-liquid
……………………extraction procedure selected for the extraction of ATN, ASA and SMV
……………………from plasma ............................................................................................ 99
Figure 6.7………..Chromatogram illustrating the separation peaks of ATN, ASA
……………………and SMV............................................................................................... 101
Figure 6.8………..3D chromatogram of ATN, ASA and SMV ............................................ 102
Figure 6.9………..Chromatogram displaying the separation peaks of ATN, ASA, SMV and
……………………DPH as the internal standard after plasma extraction. .......................... 102
Figure 6.10………Chromatogram displaying the separation peaks of ATN, ASA , SMV and
……………………DPH as the internal standard after plasma extraction ........................... 103

xxviii
Figure 6.11………a) ATN calibration curve in plasma; b) ASA calibration curve in plasma and
……………………c) SMV calibration curve in plasma ....................................................... 103
Figure 6.12……… Comparative plasma drug concentration profiles of optimized TLT versus
……………………..conventional tablets depicting drug release behavior over 24 hours of a)
……………………..ATN versus Tenormin®50 ; b) ASA versus DISPRIN CV® and c) SMV
……………………...versus Adco-simvastatin 40,.……………………………………………...105
Figure 6.13………Plasma drug concentration profile depicting the release behavior over 24
…………………… hours of a) ATN; b) ASA and c) SMV from the optimized
…………………… TLT formulation ................................................................................... 114

xxix
LIST OF TABLES
Table 2.1……..Advantages of Multi-layered tablets over conventional tablets .................... 10
Table 2.2……..Summary of the type of polymers that influence the behavior and release
……………… .characteristics of multilayered tablets ......................................................... 12
Table 2.3……..Summary of various technologies that utilize geometric factors in drug
……………… ...delivery ...................................................................................................... 27
Table 3.1………Quantities of constituents used in the synthesis of polyamide 6,10 ............ 32
Table 3.2…….Quantities of constituents used in preparation of TLT formulations –
………………...assessment of drug release from PA6,10 layer*. ........................................ 34
Table 3.3……..Quantities of constituents used in preparation of TLT formulations –
………………....assessment of drug release from s-PLGA layer*........................................ 34
Table 3.4……..Textural analysis parameters for the assessment of BHN ........................... 36
Table 3.5……..Changes in thickness and diameter of the gel layer after 2, 12 and 24 hours
………………...of hydration of the s-PLGA formulations ..................................................... 45
Table 3.6……..Percentage mass loss of PA6,10 formulations after 2, 12 and 24 hours of
………………...hydration ..................................................................................................... 46
Table 3.7……..BHN for PA6,10 formulations ...................................................................... 47
xxx
Table 3.8…….Calculated energy parameters for the molecular assemblies involving
…………………PA6,10 ....................................................................................................... 49
Table 4.1……..Formulation variables and responses for TLT optimization .......................... 55
Table 4.2…….The Box-Behnken design experimental runs employed to optimize TLT
………………...formulations displaying the possible combinations of polymers and
………………...excipients that were utilized. ....................................................................... 56
Table 4.3……..HPLC conditions for the chromatographic analysis of DPH ......................... 58
Table 4.4…......HPLC conditions for the chromatographic analysis of PMZ and RDH ......... 59
Table 4.5……Rate constants (k values) for the experimental optimization of TLT
………………...formulations ................................................................................................ 62
Table 4.6……..Correlation coefficients (R2 values) for the experimental optimization of TLT
………………...formulations ................................................................................................ 65
Table 4.7……..Targeted response values for TLT optimization in both SGF (pH 1.2, 37°C)
………………...and PBS (pH 6.8, 37°C) .............................................................................. 75
Table 4.8……. The predicted versus experimental values of the measured responses after
………………...optimization ................................................................................................ 77
Table 5.1……..Quantities of drug actives incorporated in to TLT for the evaluation of drug
………………...release of therapeutic regimen.................................................................... 82

xxxi
Table 5.2……..Image acquisition parameters applied during magnetic resonance imaging
………………...using MARAN-iP ......................................................................................... 83
Table 5.3……..Porosity results ........................................................................................... 85
Table 5.4……..Measured responses for the release of therapeutic regimen from optimized
………………...TLT formulation .......................................................................................... 88
Table 6.1……..Method parameters for the simultaneous determination of ATN, ASA and
………………...SMV............................................................................................................ 98

xxxii
LIST OF EQUATIONS
Equation 3.1………Percentage mass loss………………………………………………………35
Equation 3.2………Brinell Hardness Number…………………………………………………..36
Equation 4.1………Peppas model……………………………………………………………….56
Equation 4.2………Rate constant regression equation………………………………………..74
Equation 4.3………Rate constant regression equation………………………………………..74
Equation 4.4………Rate constant regression equation………………………………………..74
Equation 4.5………Rate constant regression equation………………………………………..74
Equation 4.6………Correlation coefficient regression equation………………………………74
Equation 4.7………Correlation coefficient regression equation………………………………75
Equation 4.8………Correlation coefficient regression equation………………………………75
Equation 4.9………Correlation coefficient regression equation………………………………75
1
CHAPTER 1
INTRODUCTION
1.1. Background to the Study
Patient compliance is a major influence of therapeutic outcomes, drug treatment regimens
may become complex as they require the patient to take numerous tablets up to three or four
times a day and this is therefore very influential to therapeutic results. In addition, a large
number of conventional tablets need to be administered up to three or four times a day.
Understandably, treatment regimens that require multiple drugs to be taken often can lead to
non-compliance on the part of the patient (Townsend et al., 2003; Apu et al., 2009; Phutane
et al., 2010; Shivaraj et al., 2010). This poses a significant problem as the majority of
treatment available is in the form of oral drug delivery (Colombo et al., 2009) which is the
most desirable route for drug delivery and is rapidly growing (Phutane et al., 2010).
Decreased patient compliance to treatment regimens is always present and challenging
(Vermeire et al., 2001), this is prevalent with chronic conditions. Non-compliance has proven
to be a serious problem that poses significant financial disadvantages to healthcare.
Pertinent to novel drug delivery technology is the concept of increasing patient compliance
by endeavouring to simplify treatment regimens thereby improving treatment efficacy and
therapeutic success. Developing Drug Delivery Systems (DDS) that reduce the number of
tablets a patient is obliged to take is therefore very appropriate in this regard. Multilayered
tablets that allow for sustained release of more than one drug at a time have been proven to
be useful in addressing this issue (Kohlrausch, 2005).
The current standard, regarding conventional drug therapy, is first-order drug release. Most
of the available drug products administered by and to patients exhibit first-order drug release
kinetics. With first-order kinetics, there is a rapid disintegration of the tablet almost complete
release of the drug active within 2 hours of administration. This results in initial elevated
plasma levels of the drug after administration, followed by an exponential decrease. This
poses a disadvantage as there will be minimal therapeutic efficacy after drug levels drop to a
certain amount or drug toxicity at very high plasma levels (Landgraf et al., 2005). This type of
drug release does not allow for appropriate plasma drug level balance. Peak-to-trough
fluctuations may occur with first-order drug release that can cause dose-dependent side-
effects (Shahiwala et al., 2004). This is poses a significant impediment that may result in a
lack of patient compliance with the treatment regimen due to the side-effects that are
associated with the peak-to-trough fluctuations.

2
Wherever applicable, a DDS should ideally exhibit zero-order drug release kinetics which
allows for a constant quantity of drug to be released over an extended period of time
resulting in uniform and sustained drug delivery (Ayres, 2004). Zero-order drug release can
be used in antibiotic delivery, the treatment of hypertension, pain management,
antidepressant delivery and numerous other conditions that require constant plasma drug
levels (Landgraf et al., 2005).
Multilayered tablets have been developed or patented for simplifying various treatment
regimens. For example, a bilayered tablet containing a statin and aspirin for the treatment of
cholesterol and reducing the risk of a myocardial infarction was developed (Ullah et al.,
1998). The tablet was comprised of two layers, one containing aspirin and the other
containing a statin. The proposed function of the tablet was to minimise the interaction
between the two drugs (Ullah et al., 1998). However the drug release kinetics achieved from
the tablet did not follow zero-order.
There are several challenges that are associated with achieving zero-order drug release from
the outer layers of a multilayered tablet. The outer layers are able to delay the interaction of
the inner layer with the liquid medium by reducing the surface area available for release of
the drug and by decreasing the penetration rate of the solvent (Efentakis et al., 2006). This
results in zero-order drug release from the inner layer. The outer layers therefore are more
exposed to the gastrointestinal environment and more susceptible to changes and
degradation. Control of drug release from the outer layers is therefore challenging.
A coated platform-delivering tablet is described in a patent (Ayres, 2004, US Patent
6720005). Osmotic pumps are very good at providing zero-order drug release; the tablet had
a rigid coating membrane. A laser was used to form a hole (aperture) through the coating.
The tablets presented a lag time of approximately 2 hours prior to drug release due to the
time taken for the gastrointestinal fluids to penetrate the semi-permeable coating membrane.
This device has been widely used in providing zero- order drug release. However, there are
challenges with large scale manufacturing and specialised laser equipment is needed to drill
holes through the coating layer. There are various other problems associated with drug
delivery from osmotic tablets such as cost of manufacture (Dash and Cudworth ll, 1998;
Kaushal and Garg, 2003; Ghosh and Ghosh, 2011).
Central to achieving zero-order kinetics with a DDS is the intimate selection of suitable
polymeric material. There are various polymeric materials that have shown the ability to
control the release of drugs (Peppas, 1997). Examples of these include poly(lactide-co-
glycolide) (PLGA) which is biodegradable, polyethylene oxide (PEO) which is robust and

3
swells, HPMC and poly(acrylic acid) (PAA) which is hydrophilic (Jian-Hwa Guo,copyright
2001-2007). Studies have shown that the main factors affecting the release of drugs are the
geometry of the tablet, the polymers used, as well as method of formulation (Varma et al.,
2004). The suitable use of these polymers as drug carrier matrices is an essential aspect of
controlled drug delivery.
Therefore the aim of this study was to develop a triple-layered tablet (TLT) containing drug in
each polymeric layer with drug release from each layer ideally following zero-order kinetics.
Each layer will contain one drug, therefore offering the delivery of up to three different drugs.
The use of polymers such as PEO, HPMC and PLGA amongst other specialised polymers
capable of providing zero-order drug release was explored for use in the design of the drug
delivery system.
1.2. Rationale and Motivation for this Study
Chronic conditions such as hypertension, tuberculosis, HIV and malaria require multiple drug
therapy. Adherence to therapy in these conditions by patients can be tedious therefore the
TLT system may also be used to deliver drugs in a zero-order fashion all in a single dose
with significant potential to reduce the associated dose-dependent side-effects that are
caused by peak-to-trough fluctuations. The delivery of antidepressants may possibly also be
incorporated into the TLT to provide superior plasma drug level profiles as well as reduced
daily doses. Figure 1.1 illustrates the peak-to-trough fluctuations associated with general
drug administration and the effect of zero-order drug release kinetics on these peak-to-trough
fluctuations.
High blood pressure (hypertension) was the underlying cause of death for 56,561 Americans
in 2006 and a primary or contributing cause of about 326,000 deaths. According to the South
African Hypertensive Society, hypertension is prevalent in 1 in 5 adults. Hypertension is also
a leading cause of death in adults aged over 55. Approximately 7 million people die every
year due to cardiovascular related health conditions. In a recent South African Demographic
and Health Survey, it was presented that 6.1 million South Africans have hypertension or are
taking antihypertensive medication.

4
Figure 1.1: Schematic diagram demonstrating peak-to-trough fluctuations and the effect of zero-order drug release on plasma drug concentration.
Current multilayered drug delivery systems do not offer the flexibility of the delivery of three
drugs in a zero-order manner. Various studies have revealed the development of
multilayered tablet devices for modified drug release. The limitation however is that
essentially, most of the systems developed allow for the controlled release of one drug only.
This usually occurs from the middle drug loaded layer.
Hence, this study proposes a DDS, a polymeric triple layered tablet (TLT) for stratified zero-
order drug release that will desirably lead to better therapeutic outcomes and increase
patient compliance through overcoming the challenges associated with multiple drug
treatment regimens. The main mechanism to achieve this would be providing sustained or
controlled zero-order drug release. In comparison with other multilayered oral drug delivery
systems that have been developed, the TLT would offer zero-order drug release from up to
three tablet layers.
The aim of this study was to therefore develop a polymeric TLT that offers stratified zero-
order drug release for potential use in the treatment of chronic conditions that require
multiple drugs to be delivered in a zero-order manner. The TLT would be superiorly capable
of improving plasma drug levels and allowing the incorporation of up to three drugs in a
single DDS to enhance patient compliance.
The uniform dosing that the TLT may offer would also help to reduce the side-effects
associated with the drugs by reducing peak-to-trough fluctuations. In an attempt to provide
superior control of drug release from the outer layers of the TLT, the drug in the outer layers
were encapsulated into a polymer matrix using direct compression and specialised
granulation techniques. The effects of modifying the geometry and chemistry of the outer
layers of the TLT were essentially explored. The culmination of these factors was intended
for the fundamental zero-order release of each drug. Ideally when the TLT comes into
Peak-to-trough plasma drug level fluctuations
Effect of zero-order drug release on plasma drug concentrations
Plasma Concentration
Time

5
contact with the gastrointestinal environment the polymers will erode away or swell to release
the drug. With polymeric matrices being the elementary backbone to the TLT formulations,
various polymers or polymer combinations and specialized granulation techniques for
example wet granulation were studied and utilized to aid in obtaining drug release in a zero-
order manner from the outer layers of the TLT.
1.3. Novelty of the Proposed Triple-layered Tablet
• The system offers zero-order release of up to three drugs in a stratified manner from
………..a multilayered polymeric tablet.
• Other multilayered systems that have been developed offer zero-order drug release
………..from only one to two layers.
• The use of newly synthesized polyamide 6,10 and salted-out PLGA as rate
………..controlling polymers in the outer layers add to the novelty of the TLT.
• The specialized granulation techniques and other approaches to achieve zero-order
………..drug release from the outer layers enhance the novelty of the triple-layered tablet
………..system.
1.4. Aims and Objectives of the Study
• Selection and synthesis of suitable polymers that may be employed as drug
………..matrices for the outer layers of the proposed TLT.
• To determine the physicochemical (e.g. structural molecular variations) and
………..physicomechanical (e.g. hardness) properties of the polymers.
• To develop a triple-layered tablet comprising formulation techniques such as
………..specialised granulation approaches and direct compression.
• To select suitable drug actives with a high water solubility (>50mg/ml) in order to
………..prove the capability of controlled release of highly water soluble drugs.
• To perform in vitro dissolution studies to determine the drug release kinetics.
• To incorporate a therapeutic drug combination into the optimized TLT to assess the
………..flexibility to control the release of various drug classes.
• To perform in vivo animal studies to assess drug release kinetics and
………..biocompatibility.of the TLT in a suitable animal model.

6
1.5. Overview of the Dissertation
Chapter 1 introduces the challenges experienced in current drug therapies and emphasizes
the rationale for the study. The aims and objectives of the study are also outlined in this
Chapter.
Chapter 2 provides a detailed description of the current and novel drug delivery
developments in terms of geometrically modified oral tablet-like drug delivery systems such
as multilayered tablets. It is a comprehensive literature review that outlines the fields of
innovation involved in developing altered and superior tablet devices for oral drug delivery
and the advantages and shortfalls of such devices.
Chapter 3 contains the preliminary experimental laboratory formulation and development of
a suitable feasible Triple-layered Tablet formulation. It outlines the formulation parameters,
physicochemical and physicomechanical characterization, computational and molecular
modelling and fundamental in vitro drug release analysis.
Chapter 4 demonstrates the structuring of a Box-Behnken experimental design which
involved the selection of suitable formulation responses and complex in vitro drug release
analysis and the statistical optimization of the Triple-layered Tablet.
Chapter 5 exhibits the further essential physicomechanical analysis such as porosity
analysis, Scanning Electron Microscopy imaging and Magnetic Resonance Imaging that was
performed on the optimized TLT. The additional incorporation of a therapeutic drug regimen
into the optimized Triple-layered Tablet is also assessed and comparative analysis with
conventional products is demonstrated.
Chapter 6 is an inclusive analysis of the in vivo drug release testing in the Large White pig
model. The establishment of a suitable protocol for the administration of the Triple-layered
Tablet and blood sampling is also presented.
Chapter 7 provides the conclusions for this study and recommendations for future work.

7
CHAPTER 2
REVIEW OF ORAL DRUG DELIVERY SYSTEMS COMPRISING ALTERED GEOMETRIC
CONFIGURATIONS FOR CONTROLLED DRUG DELIVERY
2.1. Introduction
Modified or controlled release oral drug delivery systems have over the few decades been
shown to offer advantages over the conventional methods (Deshpande, 1996; Green, 1996;
Rubinstein et al., 2007; Abdul and Poddar, 2004; Yu et al., 2009). These include increased
patient compliance (Chien, 1982; Wilding et al., 1991), selective pharmacological action;
reduced side-effect profile and reduced dosing frequency (Fassihi et al., 1995). These
systems may therefore have a significantly beneficial outcome in therapeutic efficacy.
Controlled release offers prolonged delivery of drugs and maintenance of plasma levels to
within a therapeutic range (Singh, 2000; Lingam et al., 2006). Furthermore, by pairing drug
administration rate with drug elimination rate, steady-state plasma levels can be maintained
(Shah et al., 1988; Hardy et al., 2007). Currently most drug delivery systems exhibit first-
order drug release kinetics where the plasma level of the drug is extremely high after
administration and then decreases exponentially. This poses disadvantages such as minimal
therapeutic efficacy due to reduced drug levels; or drug toxicity which can occur at high
concentrations (Landgraf et al., 2005). This type of drug release does not allow for
appropriate plasma drug level balance.
The utilization of geometric principles has been considered and employed in order to modify
drug release behavior from non-linear to zero-order or near zero-order release kinetics
(Brooke et al., 1977; Ford et al., 1987; Sangalli et al., 1993; Siepmann et al., 2000; Wise,
2000; Cobby et al., 2006, Sakamoto et al., 2010). Thus far researchers have attempted to
control dissolution behavior of drug delivery systems by modifying and controlling the
geometry of the employed devices e.g. geometries such as spherical, cylindrical, holed
cylindrical and biconvex devices were developed and investigated (Cao et al., 2001;
Karasulu et al., 2003; Efentakis and Politis, 2006; Martin del Valle et al., 2009).
One of the principles involved in altering the geometry of tablets is to create a constant
surface area for drug release to enable the achievement of zero-order kinetics (Sundy et al.,
2004; Dash et al., 2010). Systems such as multilayered tablets, donut-shaped tablets,
Procise®, Geomatrix® and Smartrix® technologies have been developed employing geometric
manipulations (Conte et al., 1993; Kim, 1999; Wise, 2000; Efentakis, 2006; Yu et al., 2009).
These geometric manipulations may also be employed to develop drug delivery systems for
the treatment of specialized biological conditions where zero-order drug release is not

8
optimal, for example chronotherapy for heart conditions (Survase et al., 2007) or the
scheduled treatment of asthma and inflammation (Losi et al., 2006). Bimodal drug release
may also be desirable with drugs that have variable absorption sites along the gastro-
intestinal tract (Shah, 1988; Gohel et al., 2009). Technologies such as the Dome Matrix®
have shown promise in achieving varied drug release profiles in order to treat specific
conditions (Losi et al., 2006). Dilacor XR™ was developed as an extended release
formulation for the delivery of diltiazem hydrochloride as described by Colombo and co-
workers (2000) where the geometry of the system played an important role in the release
profiles of drugs (Colombo et al., 1989).
In addition, the polymeric materials used to construct these technologies play an important
role in the functioning of these specialised systems (Efentakis, 2006; Martin del Valle et al.,
2009). Thus far, various types of polymers have been investigated for their ability to control
drug release (Brannon-Peppas, 1997; Bernkop-Schnurch et al., 2003; Jones, 2004; Yoo et
al., 2006; Song et al., 2009).
Polymers are the essential drug carriers of multilayered matrix tablets (Efentakis et al., 2006)
and their properties are an important factor in the behavior of these devices. In the past,
polymers that were mainly employed for such purposes were the hydro-polymers (Efentakis
et al., 2006) while currently the employed polymers range from swollen and non-swollen
(Jones, 2004; Efentakis et al., 2006; Herrlich et al., 2009) porous and non-porous (Mueller
and Heiber, 1983; Crotts and Park, 1995; Learoyd et al., 2009) to erodible or non-erodible
polymers (Brannon-Peppas, 1997; Naveen, 2009; Yu et al., 2009).
In general, the mechanisms by which polymers perform their functions are by erosion (Heller,
1987), dissolution and swelling (Harland et al., 1988). Some studies have shown that drug
release from hydrophilic polymer matrices exhibit a typical time-dependent profile for which
the drug release becomes controlled after swelling of the polymer (Lee et al., 1985; Nelson et
al., 1987; Peppas et al., 1989; Wilding et al., 1991; Narasimhan et al., 1997; Conte et al.,
2000).
This chapter thus discusses the application of altered geometric technology and its role in
controlled oral drug delivery, focusing primarily on the types of polymers that have been
employed in developing geometrically modified systems, the interplay of system geometry
and polymeric selection ultimately contributing to the type of drug release patterns that are
attained.

9
2.2. Multilayered Tablets for Controlled Drug Delivery
Mutilayered systems (bilayered, triple-layered or quadruple-layered) are becoming
increasingly recognised as controlled-release drug delivery systems (Yang et al., 1997;
Zerbe et al., 2006). These systems have shown to be advantageous over typical tablet
systems as depicted in Table 2.1. Namdeo (2008) expressed that multilayered tablets have
demonstrated promise, possessing various benefits namely the ability to prevent interactions
between drugs and excipients; providing an array of release profiles in one delivery system
of either the same or different drugs; treatment for conditions that require a regimen of more
than one drug; immediate drug release using a disintegrating monolithic matrix in order to
achieve an initial peak in plasma drug level; delayed drug release using an eroding
monolithic matrix which may deliver another active to another part of the gastrointestinal
tract; providing controlled drug release using a swellable monolithic matrix; provide better
control and regulation of release profiles by retarding initial burst release and providing zero-
order kinetics (Namdeo, 2008).
The advantages make it apparent that multilayered tablets may play a significant role in
future drug delivery trends due to the various capabilities they pose over conventional
systems. It would be beneficial to focus on further modification of these systems for more
improved and comprehensive drug release control that is capable of a larger scope of
application in drug delivery.
Controlled-release multilayered tablets typically involve a drug core layer that is surrounded
by barrier layers that may be made up of hydrophilic swellable polymers such as
hydroxypropylmethylcellulose (HPMC) and poly(ethylene oxide) (PEO) or hydrophobic
polymers such as ethylcellulose (EC) (Abdul et al., 2004.). The barrier layers minimize and
therefore delay the interaction of the gastrointestinal environment with the active core, by
decreasing the surface area available for drug release or by controlling the rate at which the
solvent penetrates the layers (Efentakis et al., 2006). This allows the initial burst release to
be minimized and therefore the drug release can be controlled at a near constant level while
the barrier layers undergo erosion or swelling (Brannon-Peppas, 1997; Yu et al., 2009). The
swollen barrier layers undergo erosion as time goes on, thus increasing the surface area
which ultimately allows more drug to be released. Following the same principle it is possible
to obtain a constant release profile as well as other types of dissolution patterns such as
pulsatile or delayed delivery as well as extended drug delivery depending on the
characteristics of the polymers employed. In either case the system should ideally erode
completely (i.e. leaving no residue in the gastrointestinal tract after the entire amount of drug
is released).

10
Table 2.1: Advantages of Multi-layered tablets over conventional tablets (Adapted from Namdeo, 2008).
Conventional tablet Multilayered matrix tablets
Drug is released in only one kinetic model. May be used to incorporate more than one drug and separate them if any chemical
incompatibilities exist.
If more than one drug is incorporated, there is no way of avoiding chemical incompatibilities.
Drug release behavior is not restricted to one type, this system may offer varied drug release kinetics of the same or different drugs such as
extended and immediate release.
The different types of multilayered tablets designs with varying drug release behavior are
shown in Figure 2.1.
Figure 2.1: Various polymeric formulations of multilayered tablets and possible drug release behavior (adapted from Chidambaram et al., 1998).
There are multilayered tablets that can provide zero-order sustained release where the tablet
consists of either a hydrophilic or hydrophobic core layer with barrier layers that are press
coated to the surfaces of the core layer. This leaves the sides of the core layer exposed. It
Hydrophobic polymeric barrier layers
Hydrophilic polymeric barrier layer swells after infiltration of medium
Hydrophilic swellable drug matrix core
Zero-order drug release
Dissolution Medium
Hydrophobic drug matrix core
Non-linear drug release
Geomatrix®
Hydrophobic drug matrix core
Hydrophobic drug matrix core
d)
b)
a) c)

11
has been shown that, generally, constant drug release can be achieved when both barrier
layers are hydrophilic and the core layer is hydrophobic (Qiu et al., 1998; Abdul et al., 2004).
However, other factors also need to be controlled in order to achieve zero-order drug
release.
2.2.1. Geomatrix® multilayer tablet technology
The Geomatrix® multilayer tablet technology was developed by Conte and co-workers (1993)
for constant drug release. The technology includes triple-layered and bilayered tablets. The
triple-layered tablet which is depicted in Figure 2.2 consists of an active core which is a
hydrophilic matrix layer and two polymeric barrier layers on either side that are hydrophobic
or semi permeable (Kim, 2005; Shionogi Pharma, 2008). The bilayered tablet consists of the
drug layer and one barrier layer (Patel et al., 2007). The barrier layers modify the swelling
rate of the active core and reduce the surface area available for diffusion of drug (Streubel et
al., 2000; Efentakis and Peponaki, 2008). Zero-order drug release can be achieved with the
Geomatrix® system (Yu et al., 2009) however release is limited to one drug.
Figure 2.2: A typical Geomatrix® multilayered tablet (Source: Shionogi Pharma, Inc., 2008).
2.2.2. Sodas® multilayer tablet technology
Sodas® multilayer tablet technology (Figure 2.3) is a multilayer drug delivery system that has
focused on the production of controlled release beads (Elan Drug Technologies, 2010). The
Sodas® technology is characterized by its inherent flexibility that enables the production of
customized dosage forms that respond directly to individual needs such as pain and blood
pressure. The technology essentially leads a pursatile drug release where the drug is
released in pulses that are separated by defined time intervals. Examples of this technology
include Ritalin® LA and Focalin® XR. These formulations are both used to treat Attention
Deficit Hyperactivity Disorder (ADHD). Furthermore, these formulations provide a once-daily
pulsed profile that offers the patient efficacy throughout the day negating the need for taking
the dose during working hours unlike the twice-daily dosing of the conventional immediate
Barrier layers control the surface area diffusion of drug out of the core
A core of HPMC matrix that contains the drug

12
release tablet. Benefits offered by the SODAS® technology include: controlled absorption
with resultant reduction in peak-to-trough ratios, targeted release of the drug to specific areas
within the gastrointestinal tract, absorption independent of the feeding state, suitability for
use with one or more active drug candidates, a facility to produce combination dosage forms,
“sprinkle dosing” by administrating the capsule contents with soft food, once or twice daily
dose resembling multiple daily dose profiles.
Figure 2.3: A schematic representation of Sodas® multilayer tablet technology (adapted from Elan drug technologies, 2010).
The aforementioned studies have provided practical technical ideas in the development of
multilayered tablets depending on the clinical applications of these systems. The studies
have also provided insight on what strategies need to be considered for further application.
Table 2.2 provides the summary of the polymers influencing the behavior and release
characteristics of multilayered tablets. It is observed that there are great variations of
multilayered tablet technologies proving flexibility, which affords possibilities for positive
research betterment. With the intuitive selection of polymers and the appropriate employment
of geometric principles, multilayered tablets may emerge as the future benchmark for the
treatment of chronic diseases. However the difficulties that may occur with the scale up of
more intricate layered drug delivery systems may present as unfavourable to the
pharmaceutical industry. The necessity of specialized equipment may add to the difficulties in
commercialization of these systems.
Table 2.2: Summary of the type of polymers that influence the behavior and release characteristics of multilayered tablets.
Type of polymer used a drug carrier
Type of polymer used in barrier layers
Type/Dimensions of tablet
Drug release achieved
Hydrophilic Hydrophilic Bilayered Extended release Hydrophilc Hydophilic Bilayered Lesser extent of
release retardation Hydophobic Hydrophilic (HPMC K4M) Triple-layered Zero-order release
Hydrophobic (CW) Hydrophobic (CW) Triple-layered Non-linear release
Protective coating
Core granules or crystals
Drug layer
Release control Polymer-2
Release control Polymer-1

13
2.3. Factors Influencing the Rate of Drug Release from Multilayered Tablets
2.3.1. Polymers employed in multilayered tablets
Generally, a multilayered system should initially swell, then gel and ultimately slowly erode
(Abdul, 2004; Yang et al., 2003). A study done by Efentakis and co-workers (2006)
investigated the effect of polymeric substances on drug release. Hydrophilic and swellable
polymers such as HPMC (Methocel K100M), microcrystalline cellulose (MC) and PEO and
the hydrophobic polymer cellulose acetate propionate (CAP) were employed in this study in
which venlafaxine HCl was used as a model drug. The study focused on a core tablet that
contained venlafaxine HCl and Methocel K100M as the drug carrier. Bilayered and triple-
layered tablets were prepared using the core tablet. The bilayer tablet consisted of a core
tablet where one surface was covered with either Cellulose Acetate Pthalate (CAP) or
Methocel E50LV, while both surfaces of the core tablet were covered with both of the
polymers to form the triple-layered tablets. Hydrophilic polymers are employed as drug core
matrices due to their swelling ability (Hongtao et al., 2007; Conti et al., 2007; Li et al., 2008;
Barakat et al., 2009). The release profiles obtained showed that drug release was slower
from the multilayered tablets than from the core tablet alone (Efentakis et al., 2006). When
the core tablet came into contact with the dissolution medium, it swelled and expanded. This
caused an increase in the diffusion path length for the drug and the drug release rate was
therefore reduced. Upon employing HPMC as a barrier layer, the layer swelled concurrently
with the core tablet, merging the core surfaces thereby enveloping part of the core, which
resulted in the limiting of drug transport through the barriers (Efentakis et al., 2006). CAP did
not swell due to its impermeability properties and therefore drug dissolution and the drug
release rate was retarded. The use of HPMC or CAP in the barrier layers showed similar
results in terms of retarding drug release except that HPMC showed slow erosion as
opposed to CAP (Efentakis et al., 2006). HPMC devices, generally, presented with slower
drug release when compared to CAP devices, reason being that they form a more efficient
and solid barrier. Overall, the study showed that the characteristics of the polymers
employed had a significant influence on the release profiles of the tablets although the choice
of polymers employed in the study was conservative. Further research that focuses on the
use of novel specialised polymers that are competent in providing zero-order drug release is
necessitated.
A study performed by Chidambaram and co-workers (1997) assessed the behavior of
layered diffusional matrices for zero-order sustained drug release. Layered tablets were
formulated with a hydrophobic core layer which contained the drug; this layer typically
consisted of 24% pseudoephedrine HCl, 40% carnauba wax and lactose filler. The barrier

14
layers were composed of either hydrophilic (HPMC K4M or K100M or microcrystalline
cellulose (MCC) PH 101) or hydrophobic polymers. Three different types of matrices were
formulated. In the first type, the two barrier layers were hydrophilic, in the second type, one
of the barriers was hydrophobic while the other was hydrophilic and in the third type, the two
barrier layers were both hydrophobic. Results showed that more desirable linear release
profiles were obtained with the first and second type of matrices as depicted in Figure 2a and
d, while the barrier layers in the third system needed to be manipulated in order to achieve
zero-order release kinetics (Chidambaram et al., 1997; Qui et al., 1998). The proposed
mechanism for the zero-order drug release from the first type of matrix was that as the
hydrophilic barriers swelled and eroded the rate of diffusion of drug from the hydrophobic
middle layer decreased (Chidambaram et al., 1997; Yang et al., 1998). According to the
study, the release rate from the lateral surface was influenced by polymer viscosity and
concentration. These factors ultimately influence diffusion path length as well as the diffusion
co-efficient. The use of polymers that possess mechanical or chemical characteristics to
intrinsically alter the geometry, via modification of diffusion path length, of matrices for
controlled release may be an interesting perspective to study for future drug delivery
research.
2.3.2. Structure of the multilayered tablet device
A study undertaken by Efentakis and co-workers (2006) illustrated that the structure of a
DDS plays an important role in its drug release behavior. They found that covering a greater
area of the core tablet by a barrier layer results in the retardation of drug release to a greater
extent, as it forms a more efficient barrier thereby decreasing the drug release rate. Another
study by Efentakis and Peponaki (2008) re-iterated the significance of structure and
geometry of triple-layered tablets with isosorbide mononitrate as a model drug. The weight
and thickness of the barrier layers also had a role in drug release behavior. Chidambaram
and co-workers (1997) established that drug release from the surfaces of the core was
dependent on the thickness of the hydrophilic barrier layers. An investigation by Streubel and
co-workers (2000) looked at bimodal drug release from multilayered matrix tablets. It was
discovered that by increasing the weight of the barrier layers from 50mg to 150mg it resulted
in a more effective retardation of drug release, thus it was concluded that by manipulating the
weight and thickness of the outer layers (Table 2.2) a desirable drug release profile of
individual drugs may be achieved, thus complementing their pharmacokinetic behavior. The
concept of barrier layers have proven to be beneficial in multilayered tablet designs however
converting the barrier layers into additional controlled release drug matrices may prove to be
beneficial for future application (Namdeo, 2008).
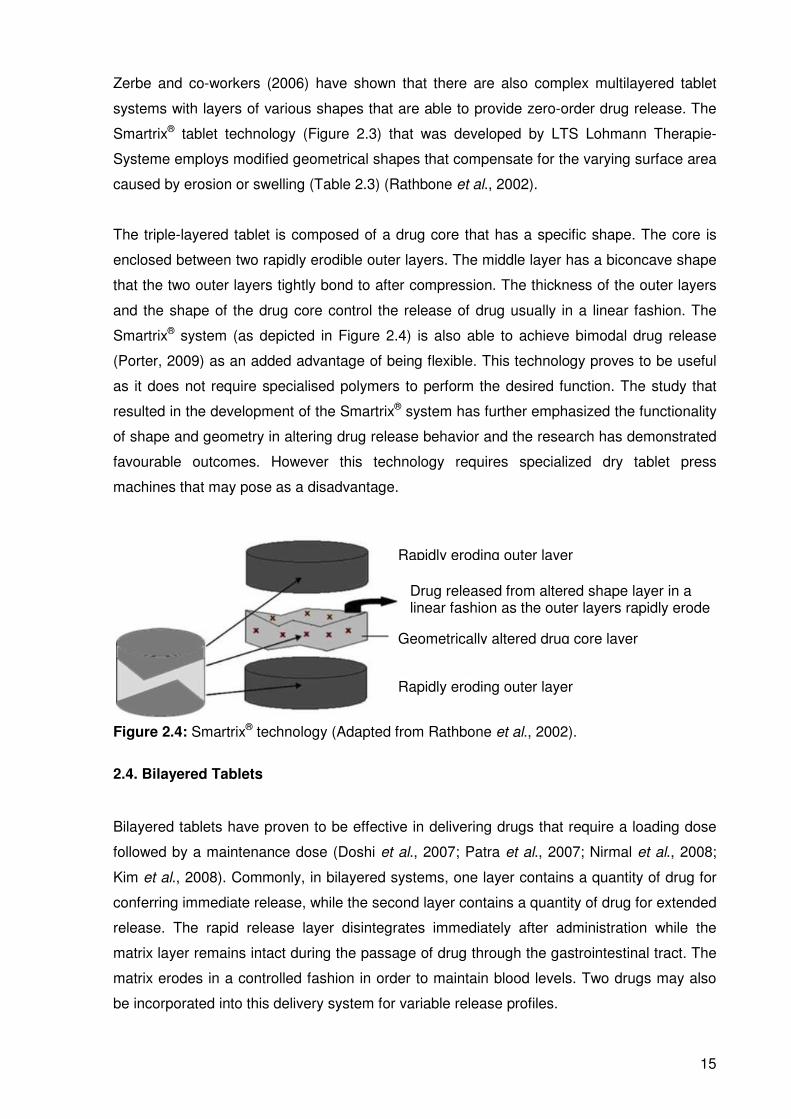
15
Zerbe and co-workers (2006) have shown that there are also complex multilayered tablet
systems with layers of various shapes that are able to provide zero-order drug release. The
Smartrix® tablet technology (Figure 2.3) that was developed by LTS Lohmann Therapie-
Systeme employs modified geometrical shapes that compensate for the varying surface area
caused by erosion or swelling (Table 2.3) (Rathbone et al., 2002).
The triple-layered tablet is composed of a drug core that has a specific shape. The core is
enclosed between two rapidly erodible outer layers. The middle layer has a biconcave shape
that the two outer layers tightly bond to after compression. The thickness of the outer layers
and the shape of the drug core control the release of drug usually in a linear fashion. The
Smartrix® system (as depicted in Figure 2.4) is also able to achieve bimodal drug release
(Porter, 2009) as an added advantage of being flexible. This technology proves to be useful
as it does not require specialised polymers to perform the desired function. The study that
resulted in the development of the Smartrix® system has further emphasized the functionality
of shape and geometry in altering drug release behavior and the research has demonstrated
favourable outcomes. However this technology requires specialized dry tablet press
machines that may pose as a disadvantage.
Figure 2.4: Smartrix® technology (Adapted from Rathbone et al., 2002).
2.4. Bilayered Tablets
Bilayered tablets have proven to be effective in delivering drugs that require a loading dose
followed by a maintenance dose (Doshi et al., 2007; Patra et al., 2007; Nirmal et al., 2008;
Kim et al., 2008). Commonly, in bilayered systems, one layer contains a quantity of drug for
conferring immediate release, while the second layer contains a quantity of drug for extended
release. The rapid release layer disintegrates immediately after administration while the
matrix layer remains intact during the passage of drug through the gastrointestinal tract. The
matrix erodes in a controlled fashion in order to maintain blood levels. Two drugs may also
be incorporated into this delivery system for variable release profiles.
Rapidly eroding outer layer
Drug released from altered shape layer in a linear fashion as the outer layers rapidly erode
Geometrically altered drug core layer
Rapidly eroding outer layer

16
A bilayered tablet for the delivery of propranolol hydrochloride was developed by Patra and
co-workers (2007). These tablets were comprised of an immediate release layer and a
sustained release layer. Sodium starch glycolate was employed as the superdisintegrant in
the rapid release layers of various formulations, while the polymers Eudragit RLPO, Eudragit
RSPO and EC were utilised in the sustained release layers. Drug release studies illustrated
that there was an initial burst release that delivered the loading dose while the rest of the
drug was released over 12 hours in a sustained manner (Patra et al., 2007). The same
concept has been demonstrated in a patent by Kim and co-workers (2008) where the system
provided release of two drugs in different manners. The controlled release layer delivers
metformin while the rapid release layer delivers glimepiride. The controlled release layer is
made up of a mixture of hydrophobic and hydrophilic polymers, while the immediate release
layer is composed of a disintegrant and glimepiride. This further enhances the positive
function of these systems in treating chronic conditions such as hypertension and diabetes.
Nirmal and co-workers (2008) developed a bilayered tablet containing atorvastatin calcium
for immediate release and nicotinic acid for extended release for the concurrent treatment of
hypercholesterolemia. It has been shown that the combination of these two drugs results in
an important reduction of low density lipoprotein cholesterol as well as desirable variations in
high density lipoprotein cholesterol (Nirmal et al., 2008). HPMC K100M was employed as the
polymeric matrix for nicotinic acid and the immediate release layer containing atorvastatin
calcium was formulated using superdisintegrant croscarmellose sodium. Drug release
studies were performed over 12 hours and the results indicated that these tablets were
successful in delivering two types of drugs concurrently (Nirmal et al., 2008). This study was
shown to be valuable for future application in the successful treatment of hypertension.
2.4.1 VersaTab® bilayered tablet technology
A VersaTab® bilayered tablet technology is a tablet that has been devised to result in linear
drug release through controlled erosion (IntelGenx Corp, 2009). The technology designs
tablets with the ability to co-release multiple drugs with different release rates. This
technology is suitable for a large number of bioactives. The tablet is highly versatile with a
broad range of delivery profiles and therefore endowed with improved patient compliance.
Figure 2.5 displays a profile that depicts VersaTab® bilayered tablet technology firstly with
one bioactive that provides controlled release and secondly with two bioactives that provides
immediate release and controlled release (IntelGenx Corp, 2009).

17
Figure 2.5: a) VersaTab® bilayered tablet; Profiles depicting VersaTab® bilayered tablet technology; b) One bioactive-controlled release and c) Two bioactives-immediate release and controlled release (Sourced from: IntelGenx Corp, Innovative Drug Delivery Solutions, 2009).
2.5. Triple-layered Tablets
Triple-layered tablets are comprised of an inner drug core layer which is sandwiched
between two surrounding barrier layers (Abdul, 2004; Namdeo, 2008). These barrier layers
may also contain drug and serve as matrices to release drug in various release patterns
(Namdeo, 2008). The general mechanisms of action of triple-layered tablets include erosion
of matrix layers, creation of a drug concentration gradient, limiting surface area of release of
the swellable matrix by the barrier layers, erosion and swelling of the barrier layers to
achieve a constant area for uniform drug release, as well as modification of the layers
dissolution to achieve pulsatile or alternating release profiles (Efentakis, 2006; Namdeo,
2008).
Triple-layered systems have some rewards in contrast to typical systems due to the varying
release pattern capability, simplicity of manufacturing, enhanced patient compliance,
enhanced safety profile of drug levels and reduced cost.
2.5.1. GeolockTM technology
GeolockTM Technology is a triple-layered tablet that has been devised for chronotherapy
focused-real time oral drug delivery (SkyePharma, 2010). Principally, it is a new clinically oral
drug delivery technology which allows, with a high degree of precision, the timed delivery of
Drug core Polymer layers

18
drugs that employs a press-coating technique. GeolockTM tablet is composed of an active
drug core (middle layer) that is surrounded by two outer protective layers (Figure 2.6). The
inner core can be a single or combination of drugs essentially formulated for either
immediate or modified release.
Drug core
Polymer layers
Figure 2.6: A schematic of a triple layered GeolockTM tablet (Source: SkypePharma, 2010).
2.5.2. Various drug release profiles achievable by triple-layered tablets
It has been shown that both immediate and sustained drug delivery can be obtained through
a single triple-layered tablet (Abdul, 2004). In this case, there is an initial immediate rapid
release of drug, which is followed by a sustained constant drug release. This type of release
could be useful for drugs that need a high plasma concentration immediately for therapeutic
efficacy where zero-order drug release kinetics is not required. Maggi and co-workers (1997)
developed such a system where a quick/slow release of Naproxen was achieved. A multi-
layered controlled release tablet containing naproxen and naproxen sodium salt was
developed by Desai in 1996. The tablet composition included a layer containing naproxen
which offered a delayed release of a granulated form of naproxen and another immediate
release layer that contained naproxen sodium salt. This system was designed to deliver a
prompt therapeutic effect while maintaining the effect for 24 hours (Desai, 1996). This type of
variable release is extremely useful for the delivery of specific drugs that need both rapid and
sustained release. A patent by Iyer and his co-workers (2006) reported on a triple-layered
system that was comprised of a sustained release layer containing methylcobalamin while
the other two immediate release layers each contained an antihypertensive, a lipid regulator
or a serum homocysteine lowering agent providing a valuable combination for the treatment
of hypertension. Compressed mini-tablets were designed for biphasic delivery of drugs with
zero-order release kinetics (Lopes et al., 2006; Iyer et al., 2006). The mini-tablets were
compressed within an outer filling that was composed of MCC PH102 that filled the space
between the minitablets. This outer filling provided rapid drug release while the minitablets
provided prolonged release (Iyer et al., 2006). The mini-tablets specifically were composed of
either HPMC or EC, with a diameter of 2.5mm and an approximate weight of 12mg each.
19
Various formulations that differed in the amount of outer filling and number of mini-tablets
used were prepared. Results showed that the mini-tablets with HPMC showed the most
potential for achieving zero-order drug release. Another patent by Zerbe and co-workers
(2004) presented a multilayer oral system that had a matrix core that contained an NSAID for
sustained release and two surrounding layers each containing an H2–receptor antagonist.
The first layer provided sustained release of the antagonist and the second layer provided a
rapid release of the antagonist. This idea was developed for use in the treatment of
osteoarthritis in people who are more susceptible to developing gastrointestinal adverse
effects such as NSAID-induced ulcers.
Time-programmed or chronotherapeutic drug delivery can also be achieved with multi-
layered tablets (Abdul et al., 2004). With chronotherapy, drug release is governed by time so
that drug is released only when needed. This can be described as pulsatile release rather
than continuous release. This type of delivery may be beneficial for preventing tolerance
arising from the drug as well as in reducing the side-effects. Press coating is a good
technique for producing this type of time-dependent release. With press coating, there are no
specific coating solvents or equipment that is needed and therefore the manufacturing
process is more efficient (Fukui et al., 2000). The core layer is essentially coated with
polymeric barrier layers by compression. The drug is released when the barrier layers either
swell or erode. The coating delays the interaction of the core with the fluid medium, which
causes a lag-time before the drug is released. When the solvent penetrates the core layer,
the core swells and dissolves, this causes the coating shell to break thereby rapidly releasing
the drug (Abdul et al., 2004). This research further confirms the useful flexibility of triple-
layered tablets although the application is often limited to the release of one drug.
It has been demonstrated that bimodal drug release may also be necessary when a non-
uniform drug release rate is desired (Streubel et al., 2000). The mechanism of release
typically involves an initial rapid release, followed by a slower constant release, which is then
followed by another rapid release period. Bimodal drug release may be advantageous in that
the initial rapid release phase which is followed by a slow release phase is able to
compensate for the slow absorption of drug from the stomach and small intestine. More
uniform delivery of drug into the systemic circulation can be achieved because bimodal
release systems increase the rate of drug release when the ability of the body to absorb the
drug decreases. Streubel and co-workers (2000) developed multilayered matrix tablets that
could achieve bimodal drug release rates. Hydroxypropylmethylcellulose acetate succinate
(HPMCAS) was used to form the matrix due to the fact that its solubility varies with pH. It is in
essence water soluble at high pH values and water-insoluble at low pH values. The study

20
aimed at determining the effect of HPMCAS on drug release from the different layers of the
tablet.
The various geometries of triple-layered tablets may be quite useful for controlling the
delivery of highly water soluble drugs. A study by Siahi and co-workers (2005) investigated
the development of triple-layered tablets for the delivery of verapamil hydrochloride in a
controlled manner. The tablets consisted of three layers that were prepared by compressing
polymers which were either natural or semi-synthetic onto the sides of the drug core. HPMC,
acacia and tragacanth were used as drug release delaying layers encompassing the core.
Different formulations containing separate and combined amounts of these polymers were
prepared. The results indicated that when tragacanth was used as a carrier, the release was
better delayed than when acacia was used. Results also showed that the location of the
polymers in the triple-layered tablets had a substantial effect on the release kinetics.
Triple-layer guar gum matrix tablet formulations were developed by Krishnaiah and co-
workers (2002) in which the controlled delivery of aqueous soluble drugs using guar gum as
a carrier was explored. The system was evaluated in terms of the release rate of
trimetazidine dihydrochloride from the matrix. Different concentrations of guar (30%w/w,
40%w/w and 50%w/w) were used to prepare the triple-layered tablets. The guar gum acted as
a release retardant agent. The release rate from these formulations enabled a twice daily
administration of the delivery system (Krishnaiah et al., 2002).
2.6. Multilayered Osmotic Devices
An indented core tablet strategy for preparing monolithic osmotic pumps was developed by
Longxiao and co-workers (2006). The tablet was compressed by a punch using a needle.
The indented core was coated using EC as a semipermeable membrane coating and
polyethylene glycol (PEG) was used as a plasticizer that controlled membrane permeability.
The tablet was developed for the delivery of atenolol and sodium chloride and was used as
an osmotic agent. Results showed that the tablet was capable of delivering the drug
constantly over 24 hours and was not dependent on the agitation or release medium
(Longxiao et al., 2006). This system does not require specialised laser drills to form the
orifices, thus reducing manufacturing costs. The study was useful in attempting to develop a
system that functioned as efficiently as an osmotic pump however in a more feasible and
cost-effective manner.
Longxiao and co-workers (2006) also prepared a bilayer osmotic pump tablet using the
indented core strategy. The model drug used in the study was nifedipine. A modified tablet
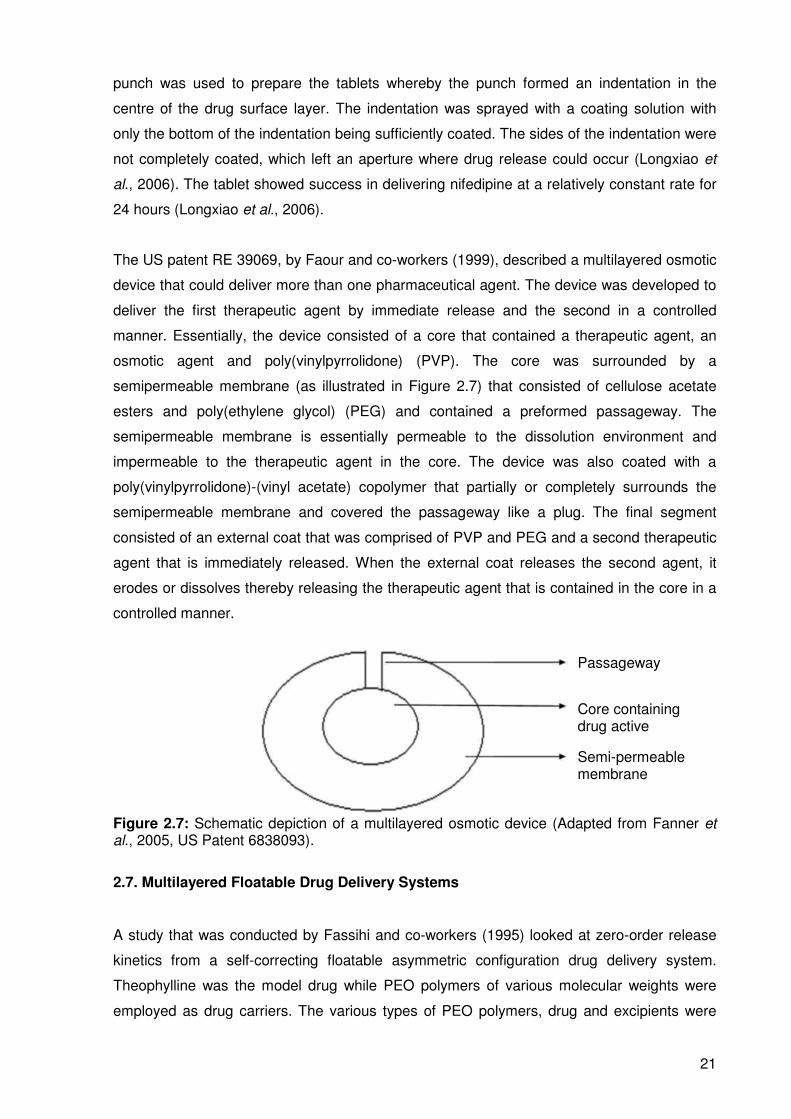
21
punch was used to prepare the tablets whereby the punch formed an indentation in the
centre of the drug surface layer. The indentation was sprayed with a coating solution with
only the bottom of the indentation being sufficiently coated. The sides of the indentation were
not completely coated, which left an aperture where drug release could occur (Longxiao et
al., 2006). The tablet showed success in delivering nifedipine at a relatively constant rate for
24 hours (Longxiao et al., 2006).
The US patent RE 39069, by Faour and co-workers (1999), described a multilayered osmotic
device that could deliver more than one pharmaceutical agent. The device was developed to
deliver the first therapeutic agent by immediate release and the second in a controlled
manner. Essentially, the device consisted of a core that contained a therapeutic agent, an
osmotic agent and poly(vinylpyrrolidone) (PVP). The core was surrounded by a
semipermeable membrane (as illustrated in Figure 2.7) that consisted of cellulose acetate
esters and poly(ethylene glycol) (PEG) and contained a preformed passageway. The
semipermeable membrane is essentially permeable to the dissolution environment and
impermeable to the therapeutic agent in the core. The device was also coated with a
poly(vinylpyrrolidone)-(vinyl acetate) copolymer that partially or completely surrounds the
semipermeable membrane and covered the passageway like a plug. The final segment
consisted of an external coat that was comprised of PVP and PEG and a second therapeutic
agent that is immediately released. When the external coat releases the second agent, it
erodes or dissolves thereby releasing the therapeutic agent that is contained in the core in a
controlled manner.
Figure 2.7: Schematic depiction of a multilayered osmotic device (Adapted from Fanner et al., 2005, US Patent 6838093).
2.7. Multilayered Floatable Drug Delivery Systems
A study that was conducted by Fassihi and co-workers (1995) looked at zero-order release
kinetics from a self-correcting floatable asymmetric configuration drug delivery system.
Theophylline was the model drug while PEO polymers of various molecular weights were
employed as drug carriers. The various types of PEO polymers, drug and excipients were
Passageway
Core containing drug active
Semi-permeable membrane

22
directly compressed into a triple-layer asymmetric floatable device. The core layer contained
theophylline while the outer layers were composed of polymers and excipients in order to
delay the interaction of the core layer with water, thereby delaying and controlling the drug
release. Dissolution studies over 16 hours showed that the entire amount of drug was
released in a zero-order manner with no initial burst release (Fassihi et al., 1995). The
release was dependent on the thickness of the layers and polymers used. Fassihi and co-
workers (2007) also investigated zero-order delivery of alfuzolin hydrochloride via a
gastroretentive system. Triple-layered and bilayered matrices were developed by
compressing PEO, HPMC, sodium bicarbonate, citric acid and PVP. Dissolution studies
demonstrated the ability of the matrices to achieve floatation in pH 2 and pH 6.8 as well as
providing zero-order drug release (Fassihi et al., 2007). This system showed fine potential for
providing enhanced bioavailability and targeted delivery to the small intestine.
A study by Yang and co-workers (1999) proposed a drug delivery system that would be able
to treat Helicobacter pylori-associated gastric ulcers. The system was comprised of a
swellable, asymmetric triple-layered tablet that was also floatable so as to increase the
gastric retention time of the system. The employed rate-controlling polymers were HPMC
and PEO. The core layer of the triple-layered tablet contained the drugs tetracycline and
metronidazole. In vitro studies exhibited a sustained delivery of the two drugs over 6-8 hours,
while the tablet was retained, showing the potential to achieve localized treatment, thereby
improving therapeutic efficacy. This study poses great potential for the essential eradication
of the Helicobacter pylori infection that often results in hospitalization of patients who develop
serious ulcers.
A patent awarded to Doshi and co-workers (2007) described a floatable drug delivery system
that is able to deliver multiple drugs. The system was bilayered and was able to deliver a
drug from one layer immediately, followed by slow and controlled release of another drug
from the other matrix-forming layer. The immediate release layer contained a disintegrating
agent while the matrix-forming layer consisted of a gas generating component and a gelling
agent (Doshi et al., 2007). The aim of this system was to attain a controlled delivery of
fluoroquinolones and to maintain the plasma levels of the drugs within a therapeutic range
with once daily administration.
2.8. Core-In-Cup Devices
Danckwerts (1994) developed a core-in-cup tablet system that was able to provide zero-
order drug release of aqueous-soluble and aqueous-insoluble drugs. The system consisted
of a disc-shaped matrix core that was compression-coated on one surface as well as at the

23
circumference in order to form a cup around the core. Drug was released in a sustained
manner from one stable surface that had a constant surface area. By manipulating the grade,
quantity and exposed surface area of any hydrophilic polymer or mixture of polymers that
erode constantly over time, the core-in-cup compressed tablet is able to deliver a constant
amount of drug over time (Danckwerts, 1994). Results showed that the system was able to
provide zero-order drug release for time intervals between 8 and 23 hours, the time of linear
release was approximately 8 hours when 5%w/w HPMC K4M with caffeine core-in-cup tablets
were produced and approximately 23 hours when 15%w/w HPMC K15M in ibuprofen core-in-
cup tablets were produced. The research that has been conducted on core-in-cup devices
showed several interesting and useful techniques as well as beneficial application in terms of
the solubility of drugs, the flexibility of delivering both aqueous soluble and aqueous insoluble
drugs pose an advantage. Danckwerts and co-workers (1995) studied the effectiveness of
cup tablets of different depths for use in core-in-cup tablets and the optimal formulation in
terms of drug release behavior. They developed a specific punch that is able to change the
depth of the cup tablet, thus allowing it to carry various cores in terms of hardness and mass.
The efficiency of cup tablets with varying depths and the optimal formulation in terms of drug
release were investigated in the study. The cup tablets were composed of 15%w/w carnauba
wax in EC while the core tablets were composed of 5%w/w HPMC K4M in ibuprofen. The
results indicated that Ibuprofen was released at a near zero-order rate for 18 hours for the
cup tablets that had a final depth of 4mm (Danckwerts et al., 1995). Figure 2.8 shows the
typical geometries of core-in-cup tablets.
Figure 2.8: Typical geometries of core-in-cup tablets (Source: Guimarães et al., 2008).
2.9. Procise® Technology
The Procise® device has a specific geometric configuration (as depicted in Figure 2.5) that
controls drug release behavior (Wise, 2000). It is composed of a core which contains
uniformly dispersed drug with a core hole in the middle (Figure 2.9). It has been elucidated
that altering the geometry of the core can vary the drug release kinetics to zero-order or even
first order if desired (as indicated in Table 2.2) (Wise, 2000). The core’s entire surface
besides the surface of the cylindrical face is surrounded by a permeable inactive coat so that

24
drug release occurs solely from the cylindrical area. The device is also able to deliver up to
two drugs simultaneously with varying release profiles (Wise, 2000). This technology further
adds to the varied geometrical systems for flexible and simplified drug delivery.
Figure 2.9: a) Aerial schematic of Procise® technology and b) Two-dimensional schematic of Procise® technology (adapted from Porter, 2009).
2.10. Donut-Shaped Devices for Controlled Drug Delivery
There are various publications dating rather far back that established that zero-order release
kinetics could be achieved from a hemispherical device containing a hole (Cleave, 1966;
Rhine et al., 1980; Hsieh, 1983; Kim, 1995; Kim, 1999; Cheng, 1999; Sundy et al., 2004). A
study by Kim (1995) investigated drug release from uncoated compressed tablets that
contained a single central hole. The impact of the hole size and drug solubility on drug
release was also investigated. The tablets were composed of PEO and had a diameter of
12mm. Theophylline was used as the model drug. The tablets provided zero-order drug
release for approximately 80-90% of the drug followed by a decreased drug release rate
(Kim, 1995). The results also indicated that as the size of the hole increased, the rate of drug
release also increased. Drug solubility proved to be inversely proportional to duration of
linear drug release (Kim, 1995). It was concluded that the donut-shaped PEO tablets with an
aperture were capable of providing zero-order drug release as the effect of surface area on
release kinetics is reduced. The geometric factors that influence the drug delivery of donut-
shaped tablets are presented in Table 2.3.
The hydrophilic polymer-based donut-shaped tablets developed by Kim (1995), exhibited a
disadvantage as they adhered to biological tissues and solids causing dose dumping of the
drug (Kim, 1999). It was due to this reason that Kim (1999), decided to undertake a study on
coated donut-shaped tablets for parabolic and linear drug release. Two types of polymers
namely rapidly erodible and slowly erodible polymers were investigated. Zero-order release
was achieved when the slowly erodible polymers were used and parabolic drug release was
achieved when rapidly erodible polymers were used when diltiazem hydrochloride was
incorporated as a model drug. It was also found that the drug release characteristics
depended on the stirring rate and hole size (Kim, 1999). These tablets did not adhere to
Core surrounded by permeable coat
Matrix core with a hole
a) b)

25
either biological tissues or solids (Kim, 1999), thus proving to be more effective than the
uncoated systems (Kim, 1999). Furthermore, HPMC donut-shaped tablets were developed
and investigated by Cheng and co-workers (1999). Theophylline and diltiazem hydrochloride
were employed as model drugs. Results depicted that zero-order kinetics was achieved for
approximately 90% of the duration of the study (Cheng et al., 1999). An increase in the size
of the centre hole caused an increase in the rate of drug release and a longer duration of
zero-order release (Cheng et al., 1999). A further study was conducted by Kim (2005) on
triple-layered donut-shaped tablets (Figure 2.10) with enteric polymers to evaluate their
controlled release ability. The tablets were prepared by layering three powders and
compressing them with a punch. HPMCAS was the fundamental polymer of the core while
the outer layers were composed of EC. The results showed that the solubility of the drugs
had an effect on release kinetics. The hydrochloride salts of weakly basic drugs had a slower
release rate than neutral drugs (Kim, 2005). Thus, this system is capable of providing zero-
order drug release for drugs with varying solubilities.
A study completed by Sundy and co-workers (2004) developed a novel compression-coated
doughnut-shaped tablet for zero-order sustained release. The tablets were also assessed for
their reproducibility. The tablets were prepared using a uniquely designed punch set.
Hydrophilic and hydrophobic polymers were employed and evaluated as the coating layers.
Caffeine and ibuprofen were used as model drugs as they have different solubilities and
allowed for a comparison of the drug release profiles. Results showed that a coating layer of
HPMC K15M and a core layer of HPMC K4M provided zero-order release of both caffeine
and ibuprofen (Sundy et al., 2004). The tablets also proved to be feasible to manufacture on
a larger scale.
Figure 2.10: A schematic of a triple-layered, donut-shaped tablet (adapted from Kim et al., 2005).

26
2.11. Dome Matrix® and “Release Modules Assemblage” Technology
The dome matrix technology (described in Table 2.3) was developed by Losi and co-workers
(2006). The elementary module (Figure 2.11a) is a swellable matrix device comprising of a
concave base on one end and a convex base on the other end. Losi and co-workers (2006)
also developed the “release modules assemblage” technology which implies the creation of
different drug delivery systems, having various functions by the assemblage of two or more
of the elementary/release modules. Figure 2.11 illustrates the dome matrix modules and
examples of the possible assemblages that may be achieved. The drug release patterns
from these assemblages depended on the manner in which the modules were placed or
attached to each other (Losi et al., 2006). For example, multi-kinetics can be achieved and
the delivery of two drugs in a single unit at a specific time and at a specific rate is also
possible. Two types of assemblages were mentioned in this study; the first was called “piled
configuration” (Figure 2.11c) where the convex base of one module is inserted into the
concave base of another module and the second was called “void configuration” (Figure
2.11b) where the concave base of one module is fixed onto the concave base of another
module creating a space/void between the two modules (Losi et al., 2006). The modules
were compared to flat base matrices in terms of drug release behavior. Buflomedyl pyridoxal
phosphate (BPP) was the model drug used in the study. The results depicted that the
modules did not completely alter the kinetics compared to flat base matrices having the same
weight and composition. However, the dome matrix® had a higher initial release rate.
Figure 2.11: a) Dome matrix® module, b) “void” configuration and c) “piled” configuration (Adapted from Losi et al., 2006).
Convex base
Concave base
“Void” configuration: concave base-concave base
“Piled” configuration: convex base-concave base
Convex base of one module fits into the concave base of another

27
The concave and convex bases themselves exhibited different release patterns, with the
convex base releasing drug faster (Losi et al., 2006). The technology proved to have
potential benefits in terms of providing flexible drug release by increasing the amount of
modules in an arrangement. This technology has various advantages although the
complexity of the systems may be a shortcoming of the system in terms of administration of
the devices to patients. A summary of various technologies that utilize geometric factors in
drug delivery is provided in Table 2.3.
Table 2.3: Summary of various technologies that utilize geometric factors in drug delivery. Technology Design Factors affecting
drug release Type of drug release
Geomatrix® Triple/bi-layered tablet. Type of polymer,
thickness of layers. Zero-order
Smartrix® Triple-layered tablet with
altered shape core layer Shape of core layer. Zero-order
Procise® Uniformly dispersed drug
core containing a hole. Geometry of core Zero-order
Dome Matrix
®/“Release
modules assemblage”
Various arrangements of elementary module
containing a concave base and a convex base
Arrangement of modules, type of
polymer.
Various according to arrangement of
modules
Core-in-cup devices
Disc-shaped core compression coated on
one surface and circumference to form a
cup around it.
Type of polymer, dimensions of core
and cup.
Zero-order
Doughnut-shaped tablets
Single/triple-layered tablets with a central hole/holes
Size and number of holes, type of polymer
Zero-order
Sodas® Multilayered tablet Type of polymer,
thickness of layers. Shape of core layer
Pulsatile release
VersaTab® Bilayered tablet Core drug, polymer
layers Immediate or
controlled release Geolock
TM Triple-layered tablet Polymer layers, single
or combination of drugs in the inner
core
Immediate or modified release
2.12. Concluding Remarks
It has been elucidated that geometrically altered drug delivery systems especially
multilayered tablets have provided various advantages to drug delivery technology. The ease
of manufacture of these systems adds further benefit in terms of cost effectiveness. These
systems therefore show promise for therapeutic use in the future. The technology that these
systems encapsulate, offers valuable knowledge and insight for the inspiration of more
intricate and constructive drug delivery systems for wider applications. Future research may
thus focus further on modifying these systems and using the basic technological principles to
develop novel systems that could be applied in broader and more complicated drug delivery

28
such as in the treatment of more complex diseases with a larger drug regimen that requires
more individualised types of drug release. With the appropriate selection of polymer matrices
and specialised geometries, these systems could be used to deliver more drugs in a more
controlled manner for adequate time periods. The fact that drug delivery systems with altered
geometric configurations (particularly tablets) have shown promising results in drug delivery
technology and the ease of manufacturing is an added advantage to the pharmaceutical
industry.

29
CHAPTER 3
FORMULATION, DEVELOPMENT AND CHARACTERIZATION OF NOVEL TRIPLE-
LAYERED TABLETS MATRICES FOR ZERO-ORDER DRUG RELEASE
3.1. Introduction
Essential to the construction of a Triple-Layered Tablet (TLT) is the consideration of factors
necessary for achieving zero-order drug release from the outer layers. Studies that have
been performed give testimony that it is possible to obtain zero order drug release from the
middle layer of a multilayered tablet due to the uniform area of the exposed surfaces of the
layer allowing for a constant release of drug (Efentakis et al., 2006), it is however difficult to
achieve zero order drug release from the outer layers as the surface area per unit volume
changes therefore causing changes in the diffusion resistances causing changes in the
diffusion path length which changes the diffusion coefficient which changes the flux ultimately
preventing constant amounts of drug to be released. The focus will therefore be on
developing these outer layers to achieve the desired release kinetics.
The basis for overcoming the challenges associated with the outer layer is the intimate
selection of polymers based on their ability to control the rate of drug release by modifying
the physicomechanical and physicochemical properties of the constituents and the geometry
of the outer layers altering the diffusion and erosion kinetics which compensates for changes
in surface area per unit volume resulting in uniform diffusion path lengths and uniform flux
and hence, constant drug release. Polymers such as polyethylene oxide (PEO), PLGA and
other specialised polymers will be assessed for use in the device.
The novelty of the system lies in its potential ability to dramatically increase patient
compliance by markedly simplifying treatment regimens and reducing side effects. The cost
to produce such a system is reduced as the equipment required is cost effective and easy to
acquire. This system will potentially have a beneficial outcome in treatment efficacy.
The use of the Nylons in drug delivery has not been widely investigated. The Polyamides
(Nylons) are materials that are mainly hydrophilic (Barringer et al., 1993) and erodible in
nature (Kydonieus, 1999). These polymers are also hygroscopic (Bronzino, 2000); water
attacks the amorphous regions affecting physical strength.
A study by Torres et al. (1995) formulated microcapsules of a synthetic polyamide that
contained ion-exchange resins employing the interfacial polymerization procedure. Sodium
fluoresceinate was used as a resinate. In vitro release studies showed that the polymeric

30
coat of the polyamide delayed drug release. García-Encina et al. (1993) investigated
polyamide-coated ion exchange resins containing sodium diclofenac. Drug release results
indicated that this formulation provided a more controlled and sustained release of sodium
diclofenac than from the commercial sustained release product of sodium diclofenac.
Theophylline loaded gelispheres that were coated with an aliphatic polyamide was prepared
by Vyas et al. (2000). Results showed that the coating was able to reduce the rate of drug
release and control the rate of release in a pseudo zero-order pattern.
Polyamide 6, 10 variants have been investigated for use in controlled drug delivery (Kolawole
et al., 2007). Monolithic matrices comprising various variants of polyamide 6,10 were
developed and evaluated in terms of drug release behaviour from the matrices. Three
optimized variants were identified, namely the slow release, intermediate release and
controlled release. The controlled release variant showed capability in providing zero-order
release kinetics from a monolithic matrix.
Poly (lactic-co-glycolic acid) (PLGA) has proven in several studies to be suitable for providing
controlled drug release (Song et al., 1997; Pillay et al., 1999; Mittal et al., 2007; Corrigan et
al., 2009) These polymers have a great advantage of being biodegradable (Peppas, 1997).
Pillay et al. (1999) investigated electrolyte- induced heterogeneity as a novel approach to
rate-controlled drug delivery. Swellable polymers, for example, hydroxypropylmethyllcellulose
(HPMC) were used in conjunction with specific electrolytes such as sodium bicarbonate and
pentasodium tripolyphosphate and formulated into monolithic drug delivery matrices. The
results showed that zero-order drug release from these matrices was achievable. The
electrolytes compete with the polymers for water hydration.
Sibambo et al. (2008) performed a study on the development of salted-out PLGA scaffolds
as monolithic drug delivery devices. The results showed that salting-out and crosslinking of
PLGA modified the physicochemical properties of the original PLGA polymer thereby
improving the potential for controlled drug release. The scaffolds showed excellent integrity
in terms of structure and resilience. The bond formation in the PLGA backbone gives the
scaffolds potential for providing zero-order release kinetics.
This chapter investigates the use of these polymers as outer layer drug matrices for
achieving zero-order release kinetics. According to the literature reviewed in Chapter 2, PEO
has been shown to provide controlled drug release as a swellable hydrophilic matrix and was
therefore employed as the middle drug matrix of the TLT.

31
Furthermore, it was decided that the model drug to be employed in the study was one that
possessed a high aqueous solubility. The ability to provide controlled release of a highly
aqueous soluble drug active from the outer layers would certainly be a beneficial
achievement. This is due to the difficulty that this challenge poses (Sandile et al., 2006; Rao
et al., 2010). This may be advantageous for treatment regimens containing three drugs,
minimizing effort in the administration of medication and multiple doses to be compacted into
one dose for maximal therapeutic efficacy. Hence, diphenhydramine (DPH) was the model
drug selected for the study. DPH inherently possesses a high aqueous solubility
(100mg/mL).
Experimental studies involved the preparation of various TLT formulations, with either of the
two novel aforementioned polymers employed as outer layer drug matrices. Drug release
from these matrices was assessed. The effect of matrix hardness, swelling and erosion of
the matrices on drug release behavior was also assessed. Differential scanning calorimetry
was performed to determine the presence of chemical interactions between the various
polymers as well as between the polymers and drug, the presence of drug may sometimes
alter the thermal properties of polymers such as glass transition temperature which may have
an effect on the mechanical properties of the polymer, thus affecting the functioning of the
polymer in terms of drug release (Okhamafe et al., 1989; Wu et al., 1999; Nair et al., 2001).
Fourier Transform Infrared Spectroscopy analysis was also carried out to determine any
molecular variations of the polymers after compression and hydration.
3.2. Materials and Methods
3.2.1. Materials
Hexamethylenediamine (HMD, Mw=116.2g/mol) was purchased from Merck Schuchardt
(Hohenbrunn, Germany). Sebacoyl chloride (SC, 98%, Mw=239.1g/mol) was purchased from
Sigma-Aldrich Co. (Aldrich, Steinheim, Germany), ethylcellulose (EC), diphenhydramine
hydrochloride (DPH) was purchased from Sigma Chemical Company (St Louis, MO, USA).
Polyethylene oxide (Polyox™ WSR 303) (PEO) was purchased from The Dow Chemical
Company (Midland, MI, USA) and poly(lactic-co-glycolic acid) (PLGA, Resomer RG504
50:50; Mw 48,000; i.v. 0.48-0.60dl/g) was purchased from Boehringer Ingelheim Pharma
(Ingelheim, Germany). Sodium chloride, sodium sulphate, calcium chloride and zinc sulphate
were purchased from Rochelle Chemicals (Johannesburg, South Africa). All other reagents
used are of analytical grade and are used as purchased.

32
3.2.2. Methods
3.2.2.1. Synthesis of modified polyamide 6,10 using a modified interfacial
polymerization reaction
The synthesis of polyamide 6,10 (PA6,10), involved the preparation of two solutions namely
the aqueous phase and non-aqueous phase. HMD and sodium hydroxide (NaOH) were
dissolved in de-ionised water (DW) to form the aqueous phase while the non-aqueous phase
was composed of cyclohexane (C-HXN), hexane (HEX) and SC. Table 3.1 contains the
quantities of constituents used in the two phases. The first solution was gradually added to
the second to form two immiscible phases which resulted in a polymeric film being formed at
the interface (i.e. by an interfacial polymerization process). The polymeric film was collected
as a mass by slowly rotating a glass rod at the interface.
Table 3.1: Quantities of constituents used in the synthesis of PA6,10 for controlled drug release.
HMD(g) SC(mL) HEX(mL) DW(mL) C-HXN(mL) NaOH(g)
1.75 0.20 40 10 10 0.4
Upon collection of the polymeric mass, it was thoroughly washed with HXN to remove any
un-reacted SC and then with DW (3×300mL) to remove any un-reacted NaOH. The
polymeric mass was then lightly rolled on filter paper (diameter 110mm, pore size 20µm) to
remove excess solvent and dried to a constant weight at 40°C over 48 hours.
3.2.2.2. Synthesis of salted-out PLGA
Synthesis involved the preparation of a polymeric solution and a salt solution. The polymeric
solution was prepared by dissolving 400mg of PLGA 504 in 15mL of acetone and the salt
solution was prepared by dissolving 1.15g of sodium chloride in 10mL de-ionized water. The
polymeric solution was slowly added to 75mL of the salt solution while constantly stirring.
The mixture was agitated on a magnetic stirrer for half an hour until a white mass of salted-
out PLGA (s-PLGA) was formed.
3.2.2.3. Fourier Transform Infrared Spectroscopy analysis of components of the Triple-
Layered Tablet formulations for the determination of molecular variations after
compression and hydration
The native polymers, compressed polymers, compressed combinations of polymers and
salts as well as hydrated samples were subjected to Fourier Transform Infrared (FTIR)
analysis using a Perkin Elmer Spectrum 100 FT-IR Spectrophotometer (Massachusetts,

33
USA) in order to determine the presence of molecular structural variations that may have
occurred after: i) compression of the polymers, ii) the combination of polymeric materials and
iii) after hydration upon exposure to the dissolution medium. The consequences of the
possible interactions on drug release from the matrices as well as possible interactions on
drug release from the matrices were also evaluated.
3.2.2.4. Differential Scanning Calorimetry and Alternating Differential Scanning
Calorimetry analysis of polymeric material to characterize thermal behavior and
determine the presence of polymer-polymer molecular interactions
Differential Scanning Calorimetry (DSC) was carried out on native polymers, compressed
polymers and compressed polymer combinations using a differential scanning calorimeter
(Mettler Toledo, DSC1, STARe System, Swchwerzenback, Switzerland). Samples were
weighed into aluminium pans and sealed. DSC thermograms were generated over wide
temperature ranges at a rate of 10°C/min. Alternating differential scanning calorimetry
(ADSC) was carried out on the samples at small temperature ranges depending on where
thermal events occurred on the DSC thermograms at a rate of 1°C/min. Samples were
assessed for potential chemical interactions that may have occurred at various temperatures
by assessing changes in glass transition temperature (Tg) and melting points (Tm) of the
polymers and the ultimate effect of these changes on drug release from the TLT.
3.2.2.5. Preparation of TLT formulations
TLT formulations as depicted in Figure 3.1 were prepared by direct compression using a
Carver hydraulic press (Wabash, USA). PA6,10, s-PLGA and PEO were employed to
comprise the three layers. Only one layer was loaded with drug at a time for the purpose of
UV analysis. The effect of the addition of different salts namely sodium sulphate (NaSO4),
calcium chloride (CaCl2) and zinc sulphate (ZnSO4) on the physicomechanical properties of
the matrices and on drug release behavior from the matrices were evaluated. DPH was
directly combined with PA6,10 in the outer layer. The two subsequent layers were not loaded
with drug.
Table 3.2 contains the quantities of constituents used in the various formulations prepared
for comparative analysis of matrix hardness and drug release behavior of the PA6,10 layer.
The same procedure was carried out for the preparation of tablets for assessment of drug
release from the s- PLGA layer where the outer layer was composed of various quantities of
s-PLGA and PEO, Table 3.3 contains the quantities used for these formulations.

34
Figure 3.1: Schematic diagram of the TLT.
Table 3.2: Quantities of constituents used in preparation of TLT formulations – assessment of drug release from PA6,10 layer*.
Experiment PA6,10 (mg) Additives (Salts)
1 200 - 2 300 - 3 350 - 4 250 50mg sodium sulphate 5 250 50mg calcium chloride 6 250 50mg zinc sulphate 7 250 75mg sodium sulphate 8 100 250mg sodium sulphate 9 200 150mg sodium sulphate
10 300 50mg sodium sulphate * All formulations contained 50mg DPH in outer layer. The middle and third layers of every formulation consisted of 350mg PEO and 350mg PA6, 10/salted-out PLGA respectively.
Table 3.3: Quantities of constituents used in preparation of TLT formulations – assessment of drug release from s-PLGA layer*
Experiment Salted-out PLGA (mg) PEO (mg)
1 300 - 2 250 50 3 200 100 4 300 50 5 50 300 6 150 200 7 225 125
* All formulations contained 50mg DPH in outer layer. The middle and third layers of every formulation consisted of 350mg PEO and 350mg PA6, 10/salted-out PLGA respectively.
3.2.2.6. Computational modeling to determine the nature of formation and dissolution
behavior of the TLT
Computational and molecular modeling was employed to characterize the potential
interactions that may occur between the polymeric layers of the matrices at a molecular level
due to compression and to characterize the possible formation, layering and dissolution
behavior of the TLT matrices. Schematic models depicting the compressed layers and matrix
formation and drug/matrix bonding were generated on ACD/I-Lab, V5.11 (Add-on) software
(Advanced Chemistry Development Inc., Toronto, Canado, 2000).
3.2.2.7. In vitro dissolution studies for DPH release analysis
In vitro drug release studies were performed on the different formulations using a USP 25
rotating paddle method in a dissolution apparatus (Caleva Dissolution Apparatus, model
Layer 1: PA6,10+salt+drug
Layer 2: PEO+drug
Layer 3: s-PLGA+PEO+drug

35
7ST; G.B. Caleva Ltd., Dorset, UK) at 50 rpm with 900mL simulated gastric fluid (SGF) (pH
1.2, 37°C) and 900mL phosphate-buffer solution (PBS) (pH 6.8; 37°C). A stainless steel
mesh was used in the dissolution vessels in order to prevent the formulations from floating.
Samples of 5 mL were drawn at predetermined time intervals over a 24 hour period.
3.2.2.8. Determination of matrix swelling and gel strength using textural analysis
The outer s-PLGA-PEO layer was assessed in terms of axial and radial swelling, under
conditions identical to those described for in vitro dissolution testing i.e. tablets were
subjected to analysis in 900mL SGF (pH 1.2, 37°C) and 900 mL PBS (pH 6.8, 37°C) using a
USP 25 rotating paddle method in a dissolution apparatus (Caleva Dissolution Apparatus,
model 7ST; G.B. Caleva Ltd., Dorset, UK) at 50 rpm. The other two layers were coated with
a 10% EC coating which was 5g in 50mL of acetone to prevent them from swelling/eroding in
the dissolution medium.
3.2.2.9. Assessment of erosion of the modified PA6,10 layer
The outer PA6,10 layer was assessed for erosion in terms of percentage mass loss under
the same conditions; the tablets were weighed before testing and dried and re-weighed after
testing. Equation 3.1 was used to calculate percentage mass loss (%ML).
At each time interval the matrices were removed from the apparatus, measured in terms of
swelling size, the gel was subjected to textural analysis in order to determine gel strength
and FTIR analysis in order to determine changes in molecular structure upon hydration and
swelling.
100)(
% ×Μ
Μ−Μ=
I
FIML
Equation 3.1
Where MI is the initial mass of the matrix, and MF is the final mass of the same dried and
partly eroded matrix.
3.2.2.10. Determination of matrix hardness
Formulations were assessed for matrix hardness using a calibrated TA.XTplus Texture
Analyzer (Stable Microsystems, UK). The analyzer was fitted with a steel probe (3.125mm
diameter). The probe was lowered such that the ball made an indentation of predetermined
distance (0.5mm) on the matrix layer. Force-distance profiles were generated for the various

36
formulations and along with the Brinell hardness equation was used to calculate matrix
hardness and Brinell hardness numbers (BHN) (N/mm2). Brinell hardness numbers for
various formulations were obtained using the maximum force of resistance as a variable.
Specific parameters were set for the assessments which are depicted in Table 3.4
Equation 3.2
Where P is the load/applied force (kg), D is the steel ball diameter (mm) and d is the depression diameter (mm).
Table 3.4: Textural analysis parameters for the assessment of BHN Parameter Settings
Pre-Test speed 1mm/s Test speed
Post-test speed Compression force
0.5mm/s 1mm/s
40N Trigger type Auto
Load cell 50kg
3.2.2.11. Molecular mechanics simulations
All modeling procedures and calculations, including energy minimizations in molecular
mechanics, were performed using the HyperChemTM 8.0.8 Molecular Modeling System
(Hypercube Inc., Gainesville, Florida, USA) and ChemBio3D Ultra 11.0 (CambridgeSoft
Corporation, Cambridge, UK). The octamers of s-PLGA and PEO and dimer of PA6,10 were
generated from standard bond lengths and angles employing polymer builder tools using
ChemBio3D Ultra in their syndiotactic stereochemistry as 3D models and were saved in .skc
file format readable to HyperChem 8.0.8.
The models were initially energy-minimized using a MM+ Force Field and the resulting
structures were again energy-minimized using the Amber 3 (Assisted Model Building and
Energy Refinements) Force Field. The conformer having the lowest energy was used to
create the polymer-cation and polymer-polymer complexes. A complex of one polymer
molecule with another was assembled by disposing the molecules in a parallel way, and the
same procedure of energy-minimization was repeated to generate the final models: PA6,10-
Na2+, PA6,10-Ca2+, PA6,10-Zn2+ and s-PLGA-PEO.
Full geometry optimization was carried out in vacuum employing the Polak–Ribiere conjugate
gradient algorithm until an RMS gradient of 0.001kcal/mol was reached. Force field options in
2d-2D- D Dπ 2F=BHN

37
the AMBER (with all hydrogen atoms explicitly included) and MM+ (extended to incorporate
non-bonded cut-offs and restraints) methods were the HyperChem 8.0.8 defaults. For
molecular mechanics calculations, the force fields were utilized with a distance-dependent
dielectric constant scaled by a factor of 1. The 1-4 scale factors were electrostatic 0.5 and
van der Waals 0.5.
3.3. Results and Discussion
3.3.1. Molecular variations after compression of matrices employing Fourier Transform
Infrared Spectroscopy
The analysis on compressed and plain PA6,10 showed no significant differences in terms of
the spectra generated indicating that little/no structural variations occur after compression.
Figure 3.2a exhibits a typical FTIR spectrum of the comparison between non-compressed
and compressed PA6,10. The spectra showed very similar prominent peaks indicating no
significant difference in chemical composition in the different dissolution mediums. The peaks
show: NH stretching (at 3300-3305cm-1); trisubstituted CH stretching (at 3072-3077cm-1);
alkyl CH stretching (at 2852-2922cm-1); strong: pyridyl C-C and C-N stretching (at 1633-
1634cm-1); NH bending (at 1535-1536cm-1); CH2 deformation (at 1465-1467cm-1); CH out-of-
plane deformation (at 679-682cm-1); H – C=O bend in aliphatic aldehydes (at 1418cm-1). A
peak at 1102 is indicative of C-OH stretching possibly due to H-bonding. No structural
interaction was noted between PA 6,10 and sodium sulphate after compression. The same
was noted for s-PLGA. The spectra showed very similar prominent peaks which include: C-H
stretching (at 2920-2952cm-1); C=O stretching (at 1745-1750cm-1); C=C stretching (at 1635-
1636cm-1); – CH3 (at 1452,1465 and 1384cm-1); H-C=O bend in aliphatic aldehydes (at
1341cm-1); C-N stretching (at 1162cm-1); Si-O-C stretching or C-OH stretching (at 1076-
1080cm-1,1084-1095cm-1); C-C stretching (at 948-960cm-1); C-C stretching/C-H bending/C-N
stretching (at 847-869cm-1); out of plane CH deformation (at 840-841cm-1). 1600-1900cm-1
(C=O) bands were noted, which confirm the cross-linking bonds between the salt (sodium
chloride) and oxygen molecules in PLGA, hydrogen bonds, ether bonds (Sibambo et al.,
2008). No molecular interaction was found between PEO and s-PLGA after compression
(Figure 3.2b). This proved that compression and hydration did not affect the inherent nature
of the polymers and drug release from the polymer matrices is attributed to the nature and
characteristics of the polymers.
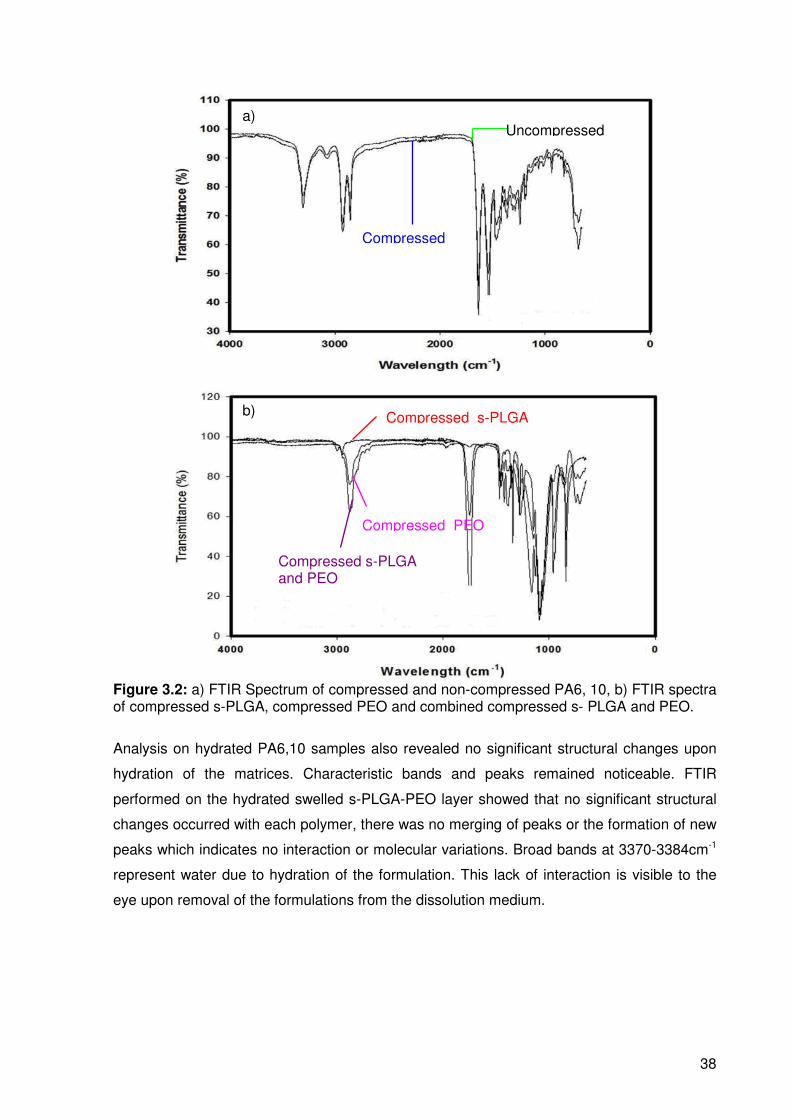
38
Figure 3.2: a) FTIR Spectrum of compressed and non-compressed PA6, 10, b) FTIR spectra of compressed s-PLGA, compressed PEO and combined compressed s- PLGA and PEO.
Analysis on hydrated PA6,10 samples also revealed no significant structural changes upon
hydration of the matrices. Characteristic bands and peaks remained noticeable. FTIR
performed on the hydrated swelled s-PLGA-PEO layer showed that no significant structural
changes occurred with each polymer, there was no merging of peaks or the formation of new
peaks which indicates no interaction or molecular variations. Broad bands at 3370-3384cm-1
represent water due to hydration of the formulation. This lack of interaction is visible to the
eye upon removal of the formulations from the dissolution medium.
b)
a) Uncompressed
Compressed
Compressed s-PLGA
Compressed PEO
Compressed s-PLGA and PEO

39
3.3.2. DSC and ADSC analysis for the determination of thermal variations and
molecular interactions
DSC was carried out on samples in order to determine changes in thermal behavior after
compression as well as after combination with other materials. The thermograms obtained
from the polymers are shown in Figure 3.3. Plain PA6,10 exhibited a thermal transition at
~50°C, which relates to its glass transition temperature which suggests that it is crystalline at
room temperature (25°C). Another transition occurred between 200-220°C which might be
rationalized as the melting point. This was confirmed by the investigations of Kohan (1999).
The thermogram displayed by the compressed PA6,10 displayed the same thermal
transitions occurring as the pure polymer indicating that there is minimal or no variation to
PA6,10 after compression. Compressed PA6,10 also remained crystalline.
Figure 3.3: DSC thermograms of a) uncompressed PA6,10, b) compressed PA6,10; c) uncompressed s-PLGA and d) compressed s-PLGA.
These results establish that no thermal interactions occur which may affect the release of
drug from the matrices which further confirms the FTIR characterization of the polymer. The
presence of interactions may have untowardly affected the release of drug from the matrices.
The compressed combination of PA6,10 and sodium sulphate showed no significant changes
in the thermal behavior of PA6,10 indicating that no chemical interaction occurred between
them.
Melting point
Melting point overlapping with glass transition temperature
Glass transition temperature
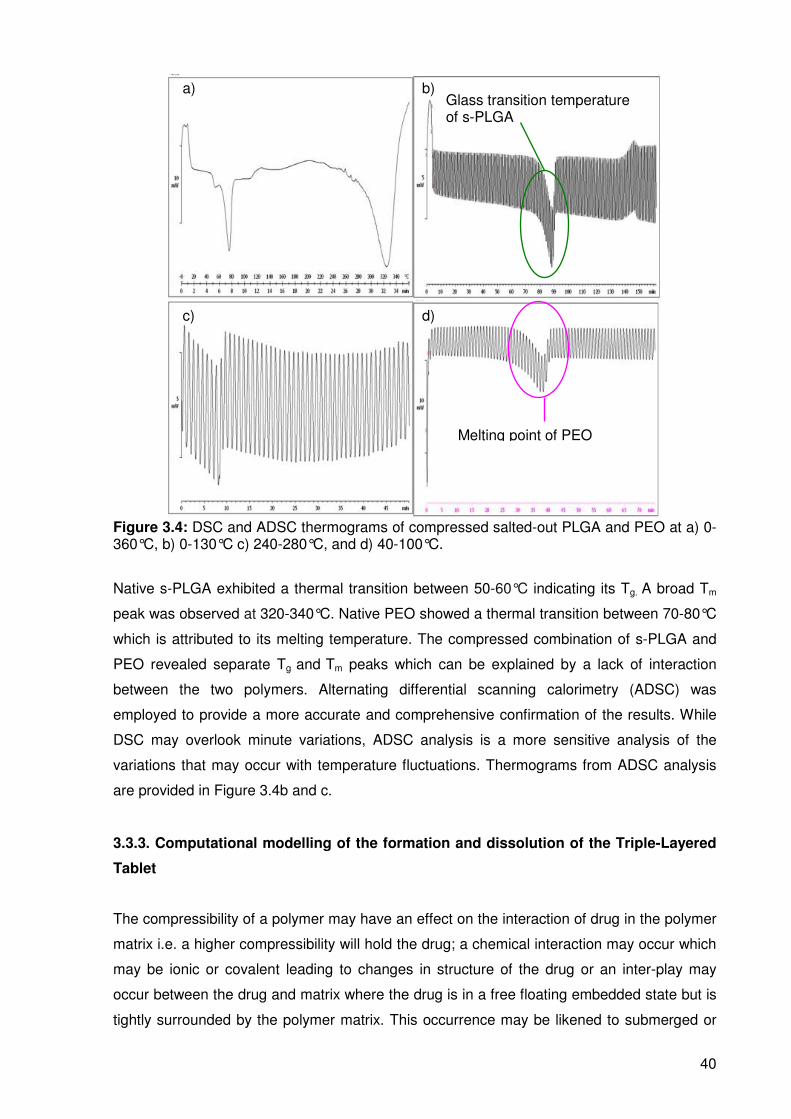
40
Figure 3.4: DSC and ADSC thermograms of compressed salted-out PLGA and PEO at a) 0-360°C, b) 0-130°C c) 240-280°C, and d) 40-100°C.
Native s-PLGA exhibited a thermal transition between 50-60°C indicating its Tg. A broad Tm
peak was observed at 320-340°C. Native PEO showed a thermal transition between 70-80°C
which is attributed to its melting temperature. The compressed combination of s-PLGA and
PEO revealed separate Tg and Tm peaks which can be explained by a lack of interaction
between the two polymers. Alternating differential scanning calorimetry (ADSC) was
employed to provide a more accurate and comprehensive confirmation of the results. While
DSC may overlook minute variations, ADSC analysis is a more sensitive analysis of the
variations that may occur with temperature fluctuations. Thermograms from ADSC analysis
are provided in Figure 3.4b and c.
3.3.3. Computational modelling of the formation and dissolution of the Triple-Layered
Tablet
The compressibility of a polymer may have an effect on the interaction of drug in the polymer
matrix i.e. a higher compressibility will hold the drug; a chemical interaction may occur which
may be ionic or covalent leading to changes in structure of the drug or an inter-play may
occur between the drug and matrix where the drug is in a free floating embedded state but is
tightly surrounded by the polymer matrix. This occurrence may be likened to submerged or
Glass transition temperature of s-PLGA
Melting point of PEO
a) b)
c) d)

41
embedded balls in ice cubes where there is no interaction between the ball and ice matrix.
The additional energy that is supplied due to compression energy is absorbed onto the drug
molecules as well as the polymer matrix may partake in stabilization of the free floating
system. The energy will be released making dissolution faster on contact with the dissolution
medium. The TLT as depicted in Figure 3.5a displays layers of polymers loaded with drug
molecules (circular entities). Intermixed or combined layers that are depicted may occur with
occasional drug entrapments due to heavy compressions applied for the different polymer
layers. Figure 3.5b demonstrates the actual formation of the layers. The first polymer with
drug loaded is compressed followed by the second drug-loaded polymer and finally the third
polymer and drug layering sequentially on one another. The intermixed polymer layers are
also shown which are expected to intermingle due to adhesion. Drug molecules may also
seep into other polymer layers due to high compression forces.
Figure 3.5: a) Compressed TLT containing layers of polymer matrices and drug with intermixed layers; b) different layering in the compressed tablet formation; c) disintegration of the compressed TLT in the dissolution medium.
A predictable approach to the dissolution of the TLT was adopted. There is a high possibility
of the polymer becoming solvated because the compressed polymer will not immediately
Polymeric layer 1
Polymeric layer 2
Polymeric layer 3
Addition of first polymeric layer
Addition of second and third polymeric layer subsequent to precompression of first and second polymeric layer
Precompression of first polymeric layer
Intermixed layer 1
Intermixed layer 2
Intermixed layer
Round shaping of the matrix

42
dissolve out. However, the dissolution medium may interact with the portions of the
compressed polymer strands and the polymer may swell in the case of it being hydrophilic. In
the case of the polymer not being hydrophilic, the dissolution medium may then relax the
compression of the matrix. The relaxation occurs akin to the slow melting of the ice cube
embedded ball model to release the drug from the embedded matrix.
The rate of solvation of the matrix is higher than the rate of disintegration that would be the
slowest to occur. There is initially a slow dissolution of the polymer layer in the dissolution
medium with extremely slow dissolution occurring at the outer curve of the layers and the
intermixed layers. The inner areas of the layer are more prone to dissolution resulting in a
round shaping of the matrix as depicted in Figure 3.5c. The arrows indicate the areas that
are disintegrating in the dissolution medium. This is where the matrix loses a major part of
the polymer matrix and solvated, polymer embedded or chemically conjugated drug. It is
predicted that the less compressible polymer will disintegrate more rapidly thereby releasing
drug faster. The multidirectional dissolution that occurs, leaving the outer edges and
intermixed layers most intact, balances out the release and the cumulative drug release
appears to be linear or near linear.
3.3.4. In vitro drug release from the TLT formulations
3.3.4.1 Assessment of DPH release from the PA6,10 layer
Figure 3.6a and b display the calibration curves constructed for DPH. It was discovered that
using a quantity of 300mg PA6,10 depicted the most desirable, near linear release profile
that could be explained by a more compact matrix, due to the higher packing density making
the matrix more resistant to penetration by the dissolution medium, resulting in more
adequate retardation of drug release as depicted in Figure 3.7a, than with a smaller quantity
of PA6,10. However there was an occurrence of an undesirable initial burst release of drug.
The addition of various salts to the layer was investigated in an attempt to eliminate the initial
burst release. The formulations containing SS (as an additional salt to PA6,10 layer)
demonstrated the highest capability in reducing the burst release and exhibited a linear
release profile with no burst release as shown in Figure 3.7b. Various ratios of PA6,10 to SS
were prepared and the most linear release over 24 hours was achieved with 300mg: 50mg
(Figure 3.7b).

43
Figure 3.6: Calibration curve for the determination of DPH in a) SGF (pH 1.2, 37°C) and b) PBS (pH 6.8, 37°C).
Figure 3.7: DPH release profiles from a) 300mg PA6,10 layer; b) 300mg PA6,10 and 50mg SS (N=2).
3.3.4.3. DPH release from the s-PLGA layer
Direct combination of s-PLGA with DPH exhibited a significant burst release of 6% and total
drug release within 4 hours in SGF (pH 1.2, 37°C) with a 28% burst release in PBS (pH 6.8,
37°C) (Figure 3.8a) and total drug release before 24 hours. This may be due to the possibility
that s-PLGA utilized unaccompanied as a matrix may not be adequate to retard drug release
due to the inability to form a sufficiently compact matrix that may be explained by the
crystalline nature of the polymer. Another contributing factor is that s-PLGA is hydrophobic
(Sibambo et al., 2007) and therefore does not swell. The formulations containing the addition
of PEO to the s-PLGA layer showed more desirable results in terms of a reduced burst
release and a more linear release profile. The proposed rationale for the addition of PEO is
that it increases the elasticity of the layer which allows for a more constant diffusion path
length and a more constant release of drug over time. From the various ratios of s-PLGA to
PEO the results showed that the 50mg: 300mg ratio showed the most desirable release
profile in SGF (pH 1.2, 37°C) and PBS (pH 6.8, 37°C) as can be seen in Figure 3.8b.
a) b)
a) b)
y=1.106x R2= 0.999
y=1.199x R2= 0.995
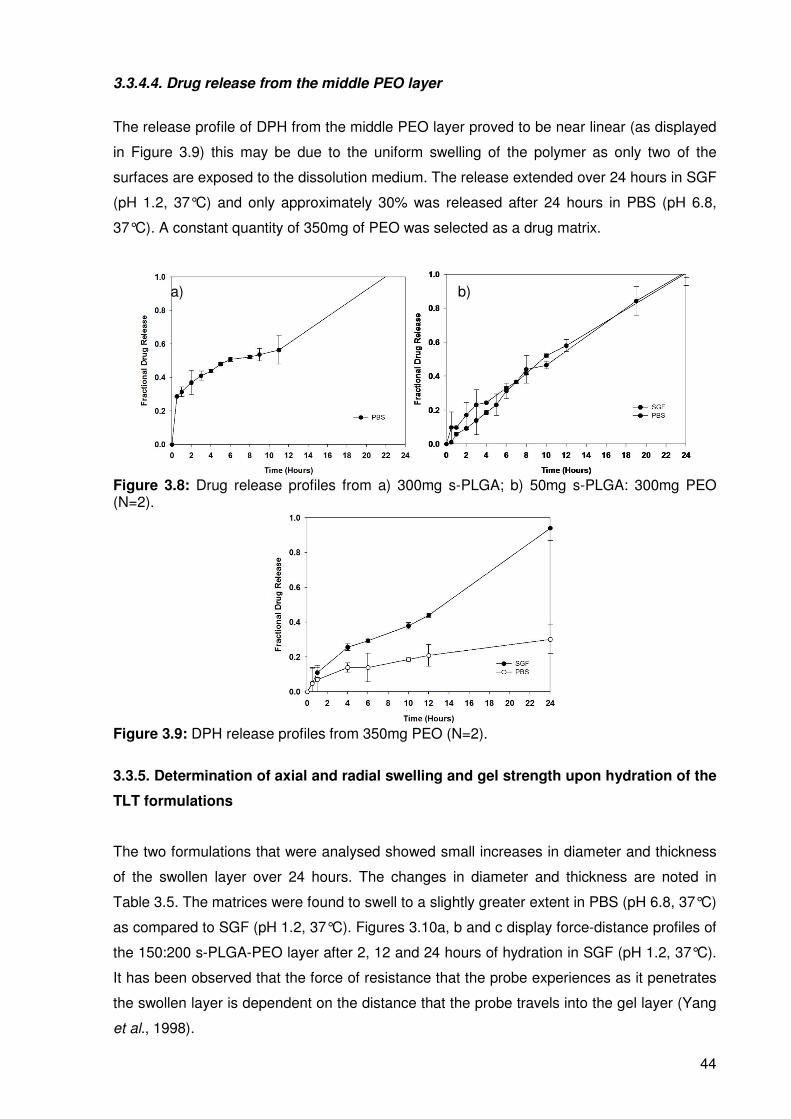
44
3.3.4.4. Drug release from the middle PEO layer
The release profile of DPH from the middle PEO layer proved to be near linear (as displayed
in Figure 3.9) this may be due to the uniform swelling of the polymer as only two of the
surfaces are exposed to the dissolution medium. The release extended over 24 hours in SGF
(pH 1.2, 37°C) and only approximately 30% was released after 24 hours in PBS (pH 6.8,
37°C). A constant quantity of 350mg of PEO was selected as a drug matrix.
Figure 3.8: Drug release profiles from a) 300mg s-PLGA; b) 50mg s-PLGA: 300mg PEO (N=2).
Figure 3.9: DPH release profiles from 350mg PEO (N=2).
3.3.5. Determination of axial and radial swelling and gel strength upon hydration of the
TLT formulations
The two formulations that were analysed showed small increases in diameter and thickness
of the swollen layer over 24 hours. The changes in diameter and thickness are noted in
Table 3.5. The matrices were found to swell to a slightly greater extent in PBS (pH 6.8, 37°C)
as compared to SGF (pH 1.2, 37°C). Figures 3.10a, b and c display force-distance profiles of
the 150:200 s-PLGA-PEO layer after 2, 12 and 24 hours of hydration in SGF (pH 1.2, 37°C).
It has been observed that the force of resistance that the probe experiences as it penetrates
the swollen layer is dependent on the distance that the probe travels into the gel layer (Yang
et al., 1998).
a) b)

45
The profiles obtained show that there is an initial low resistance to penetration at the surface
of the layer and an increased resistance to penetration deeper into the layer indicating an
increase in the gel strength advancing into the swollen layer. The results also indicate that at
a higher degree of hydration, the gel strength decreases with a lower resistance to
penetration by the probe. The formulations did not show a great increase in swelling
especially between 12 and 24 hours therefore in some cases the force of resistance to
penetration did not increase after 24 hours of hydration. Evidently, the formulation with a
higher amount of PEO showed a greater extent of swelling and a higher force of resistance
indicating greater gel strength of that layer.
Figure 3.10: a) Force-distance profile for the s-PLGA layer after 2 hours of hydration in SGF (pH 1.2, 37°C), b) Force-distance profile generated for s-PLGA layer after 12 hours of hydration in SGF (pH 1.2, 37°C) and c) Force-distance profile generated for s-PLGA layer after 24 hours of hydration in SGF (pH 1.2, 37°C).
Table 3.5: Changes in thickness and diameter of the gel layer after 2, 12 and 24 hours of hydration of the s-PLGA-PEO formulations
Ratio (mg)
Dissolution Medium
Diameter (mm)
Thickness (mm)
2hrs 12 hrs 24 hrs 2hrs 12 hrs 24hrs
50 : 300 SGF 16 20 23 5 6 7 150 : 200 SGF 13 18 20 4 5 5.5 50 : 300 PBS 14 22 25 5 7 8 150 : 300 PBS 13 20 21 4 6 7
b) a)
c)
Maximum Force used for gel strength analysis
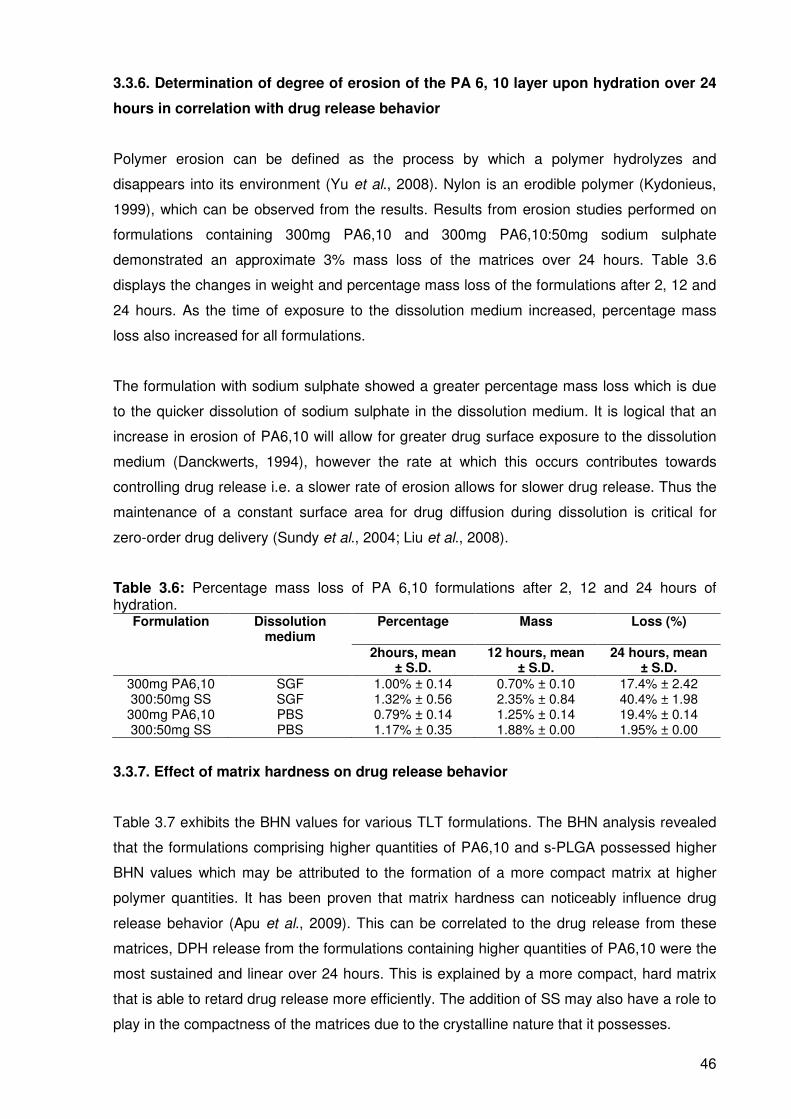
46
3.3.6. Determination of degree of erosion of the PA 6, 10 layer upon hydration over 24
hours in correlation with drug release behavior
Polymer erosion can be defined as the process by which a polymer hydrolyzes and
disappears into its environment (Yu et al., 2008). Nylon is an erodible polymer (Kydonieus,
1999), which can be observed from the results. Results from erosion studies performed on
formulations containing 300mg PA6,10 and 300mg PA6,10:50mg sodium sulphate
demonstrated an approximate 3% mass loss of the matrices over 24 hours. Table 3.6
displays the changes in weight and percentage mass loss of the formulations after 2, 12 and
24 hours. As the time of exposure to the dissolution medium increased, percentage mass
loss also increased for all formulations.
The formulation with sodium sulphate showed a greater percentage mass loss which is due
to the quicker dissolution of sodium sulphate in the dissolution medium. It is logical that an
increase in erosion of PA6,10 will allow for greater drug surface exposure to the dissolution
medium (Danckwerts, 1994), however the rate at which this occurs contributes towards
controlling drug release i.e. a slower rate of erosion allows for slower drug release. Thus the
maintenance of a constant surface area for drug diffusion during dissolution is critical for
zero-order drug delivery (Sundy et al., 2004; Liu et al., 2008).
Table 3.6: Percentage mass loss of PA 6,10 formulations after 2, 12 and 24 hours of hydration.
Formulation Dissolution medium
Percentage Mass Loss (%)
2hours, mean ± S.D.
12 hours, mean ± S.D.
24 hours, mean ± S.D.
300mg PA6,10 SGF 1.00% ± 0.14 0.70% ± 0.10 17.4% ± 2.42 300:50mg SS SGF 1.32% ± 0.56 2.35% ± 0.84 40.4% ± 1.98 300mg PA6,10 PBS 0.79% ± 0.14 1.25% ± 0.14 19.4% ± 0.14 300:50mg SS PBS 1.17% ± 0.35 1.88% ± 0.00 1.95% ± 0.00
3.3.7. Effect of matrix hardness on drug release behavior
Table 3.7 exhibits the BHN values for various TLT formulations. The BHN analysis revealed
that the formulations comprising higher quantities of PA6,10 and s-PLGA possessed higher
BHN values which may be attributed to the formation of a more compact matrix at higher
polymer quantities. It has been proven that matrix hardness can noticeably influence drug
release behavior (Apu et al., 2009). This can be correlated to the drug release from these
matrices, DPH release from the formulations containing higher quantities of PA6,10 were the
most sustained and linear over 24 hours. This is explained by a more compact, hard matrix
that is able to retard drug release more efficiently. The addition of SS may also have a role to
play in the compactness of the matrices due to the crystalline nature that it possesses.

47
Table 3.7: BHN for PA 6,10 formulations. Formulation BHN (N/mm
2) ± S.D.
300mg PA6,10:50mg SS 17.31 ± 1.13 200mg PA6,10: 150mg SS 13.74 ± 0.17 50mg s-PLGA:300mg PEO 11.98 ± 0.47
150mg s-PLGA: 200mg PEO 14.32 ± 0.64
The formulations containing higher quantities of s-PLGA however, did not provide desirable
release of DPH. The higher quantity of PEO was found to be necessary for the uniform
release of DPH. Figure 3.11 shows a typical force-distance profile generated from the
Texture Exponent 32 software (StableMicroSystems, Surrey, UK).
In general, the TLT formulations do not have high BHN values that could be explained by the
low compression force of 3 tons that they are subjected to, although the effect that
compression force had on hardness was found to be modest.
Figure 3.11: Typical force-distance profile for 50mg s-PLGA: 300mg PEO.
3.3.8. Molecular mechanics assisted model building and energy refinements, influence
of addition of salts on the performance of PA6,10 layer
The polyamides display a wide range of physicomechanical properties when complexed
physically, chemically or physicochemically with metal cation in form of metal salts which
mainly rest on their ability to form Lewis acid-base complexes (Mit-uppatham et al., 2004;
Gupta et al., 2009). A generalized molecular mechanics program was used in this study to
compute the energy attributes of PA6,10 and PA6,10-cation conformations. PA6,10
interactions were screened for the three metal cations (Na+, Ca2+ and Zn2+) in an attempt to
corroborate and elucidate the experimentally observed drug release profiles. The cation
probe was moved around the van der Waals surface of the amide chain and the energy
minimized structures following molecular mechanics simulations are depicted in Figure 3.12
Force (N)
Distance (mm)
Max. Force

48
and the possible component binding energies, and the intrinsic molecular attributes to which
they will be responsive, are listed in Table 3.8. The polyamide chain assumed a
intramolecular, tail-head, bonded, ordered structure (Figure 3.12a and b) after geometry
optimization. The cation binding was evident from the presence of binding sites distributed in
ordered arrays and formed between chains (Figure 3.12c, d and e). It is evident from the
energy attributes that PA6,10-Na+ (∆E=-92.02kcal/mol) and PA6,10-Ca2+ (∆E=-62.72kal/mol)
were forming more thermodynamically stable conformers than that of Zn2+ (∆E=-2.29kal/mol).
These energy minimizations were supported both by bonding interactions (angle energy) and
non-bonding interactions (van Der Waals forces). These two energies seem to be
complementary to each other in this case. The bond angle contributions, reference values
assigned to all of the bond angles for the structure may arise from the force between two
instantaneously induced dipoles (London dispersion force) and the resulting steric
adjustment caused due to inclusion of metal ions in the polymer matrix.
Figure 3.12: Geometrically constrained models of the polyamide-metal ion complexes derived from molecular mechanics calculations: (a) PA6,10-non energy-minimized; (b) PA6,10-energy minimized; (c) PA6,10-Ca2+; (d) PA6,10-Zn2+; and (e) PA6,10-Na+. Color codes for elements are: Carbon (cyan), Nitrogen (blue) and Oxygen (red), Calcium (yellow), Zinc (brown) and Sodium (purple).

49
The significant lowering of angle energy [PA6,10-Na+ (∆E~-52kcal/mol) and PA6,10-Ca2+
(∆E~-50kal/mol)] and vdW energy [PA6,10-Na+ (∆E~-40kcal/mol) and PA6,10-Ca2+ (∆E~-
13kal/mol)] demonstrate the efficient fitting of metal ions with aliphatic groups of the polymer
chain. The complexation of these metal ions with polyamide chain may be governed by the
values of the surface coordination number, ionization potential and ionic radius of the metal
cations as described by (Frolov et al., 1999). The metal ion with largest ionic radius may form
a close packed geometry conformation maximally filling the available lattice space (Figure
3.13e). The results obtained demonstrated the importance of the structural features of the
oligosaccharide chains and the steric arrangement of the active groups where the cation-
interaction displays considerable stereospecificity, proper spacing and geometry of the
coordination shell.
Table 3.8: Calculated energy parameters for the molecular assemblies involving PA6,10, s-PLGA and PEO.
Structure Energy (kcal/mol)
Total ∆Ebinding Bond Angle Dihedral VDW ∆Evdw H bond
PA6,10 64.425 -- 1.153 54.931 4.771 3.963 -- -0.391 PA6,10-Zn
2+ 62.135 -2.29 1.076 52.586 8.739 -0.267 -4.23 -0.0003
PA6,10-Ca2+
1.709 -62.72 0.619 4.256 6.361 -9.434 -13.397 -0.093 PA6,10-Na
+ -27.595 -92.02 0.266 2.400 5.439 -35.701 -39.664 0
s-PLGA 2.638 -- 0.288 2.534 0.885 -1.062 -- -0.007 PEO 12.635 -- 0.216 0.985 7.003 4.431 -- -0.001 s-PLGA-PEO 2.571 -25.343 0.639 4.612 18.112 -19.896 -27.696 -0.902 ∆Ebinding = E(Host.Guest) - E(Host) - E(Guest) ∆Evdw = Vdw(HostGuest) - VdW(Host) - VdW(Guest)
This complexation between surface electron-donor groups of the PA6,10 fibre and metal
cations may be responsible for the altered physicomechanical (breaking load) and
physicochemical properties of the fibre (by decreasing or increasing the effective pore size).
It may be too difficult for the drug to be entrapped into the polyamide matrix because of very
high intermolecular bonding between the polymer filaments as shown in Figure 3.13. In this
way, drug may remain outside the matrix and be released as soon as it comes in contact with
dissolution media (high initial burst release). However, addition of metal salts (monovalent or
divalent) may cause breaking of these intermolecular bonds, thereby creating space for the
drug molecules to be embedded into the polymer matrix (Gupta et al., 2009) (Figure 3.13).
Additionally, water being a stronger Lewis base than nylon may cause leaching of salt
molecules creating a porous matrix architecture.

50
Figure 3.13: Schematic of reference polyamide with a) intermolecular hydrogen bonds and b) polyamide complexed with ZnSO4 .
Sodium ions, having larger binding energy and more stabilized complex, may delay the
release culminating in the release of drug to a lesser extent (lowered initial burst release).
This is also evident from the geometrical preferences shown in the polymer salt complexes,
(Figures 3.12c, d and e), where sodium ions are forming a dense matrix structure than
calcium and zinc. Additionally, Mit-uppatham and co-workers described that the viscosity
value of polyamide solutions increases with the addition of monovalent ions such as Na+ and
Li+ (as compared to divalent ions such as Mg2+) due to an increase in the viscoelastic force
(Mit-uppatham et al., 2004). This increase in viscosity may be a determining factor for the
zero-order controlled release profile due to inclusion of Na2SO4. These results in conjunction
with the comparable FTIR spectra of the non-compressed and compressed matrices
indicates that the introduction and removal of salts is a reversible process and does not alter
the final properties of PA6,10.
a)
b)

51
3.3.9. Influence of the incorporation of PEO on the performance of the s-PLGA layer
The energy minimized structures of the s-PLGA-PEO, before and after molecular mechanics
simulations, are depicted in Figure 3.14 and the corresponding connolly molecular surface
structures are demonstrated in Figure 3.15. The possible component binding energies and
the intrinsic molecular attributes to which they will be responsive, are listed in Table 3.8.
Figure 3.14: Visualization of optimized geometrical preferences showcasing the s-PLGA-PEO complex systems: (a) before and (b) after molecular mechanics’ energy refinements. Color codes: s-PLGA (yellow) and PEO (standard element colors: Carbon (cyan), Nitrogen (blue) and Oxygen (red).
Invariant factors common to mathematical description of binding energy and substituent
characteristics have been ignored. It is evident from the energy values that the s-PLGA-PEO
complex is stabilized by a binding energy ∆E≈-25kcal/mol. The global energy minimum was
supported mainly by the van der Waals interactions between the polymer molecules (∆Evdw=-
27.696) due to the presence of aliphatic groups in the polymers. These underlying weak
chemical interactions may not cause a structural change in the polymers but may initiate
aggregation of the aliphatic chains, as both the polymers synthesized are long chain aliphatic
polymers, resulting in localized regions with a density and refractive index different from that
of the bulk polymers. Figures 3.15a and b visualize the comparative molecular surface
preferences of the two polymers before and after the computational refinement. Additionally,
the PEO induced intramolecular hydrogen bonding in s-PLGA (≈100 times more than the
individual polymers) (Figure 3.14b) may influence the hydration process of the PLGA
polymer matrix. The stratified zero-order drug release along with reduced burst release from

52
the s-PLGA-PEO blend layer of TLT formulations is in line with the earlier reported results
involving s-PLGA–PEO polymeric blend films and microparticles by Santander-Ortega et al.
(2010).
Figure 3.15: Connolly molecular electrostatic potential surfaces in translucent display mode showcasing the PLGA-PEO complex systems: (a) before and (b) after molecular mechanics’ energy refinements. Color codes: PLGA (yellow) and PEO (red).
3.4. Concluding Remarks
It was elucidated that the employed novel polymers have shown significant potential as outer
layer drug matrices in the TLT formulations for potential zero-order drug release. Linear
profiles were observed from all three layers of specific formulations. It was determined that
each layer should have a weight of 400mg including 50mg of drug for optimum results. The
ratio of polymers to salt and other polymers were proven to have an effect on the
physicomechanical properties of the matrices and had an influence on drug release behavior.
It is logical that the intimate selection of appropriate polymer and excipient ratios are critical
in achieving the desired drug release outcomes. The Molecular Mechanics simulations
demonstrated that the obtained release pattern may be attributed to the modified matrix
hydration process of PLGA (hydrogen bonding induced by the presence of the PEO) and
continued retarded release of the PEO derivative due to its entanglement with the polyester
chains as was shown in connolly molecular surface architecture. The matrices exhibited
much promise for the controlled delivery of various drugs including those with high water-
solubility. Further research will focus on the optimization of the TLT formulations. It is
apparent that the proposed system potentially offers a significant positive impact on patient
compliance and therefore therapeutic efficacy.

53
CHAPTER 4
EXPERIMENTAL DESIGN AND STATISTICAL OPTIMIZATION OF THE TRIPLE-
LAYERED TABLET MATRICES
4.1. Introduction
The preformulation studies summarized in the previous chapter were essential for identifying
formulation factors (independent variables) used in the optimization of the triple-layered
tablet (TLT) matrices. The independent variables previously mentioned are outlined in this
chapter. It is known that in modern years, chemometric approaches are commonly applied to
the optimization of scientific systems (Ferreira et al., 2007). This approach carries various
advantages such as condensing the amount of experiments and therefore laboratory work
that is required and subsequently a reduction in the amount of chemicals that are used.
Multivariate design of experiments allow for the determination of important interactions
between the different experimental variables that may occur permitting a more accurate
optimization of the systems. An experimental design was employed in the study whereby the
aforementioned variables were varied accordingly in order to evaluate measured responses
of the TLT formulations.
Response surface methodology was opted for while the experimental design was being
executed. This was selected in order to determine the optimal combination of the formulation
constituents. This methodology along with a Box-Behnken design was employed to optimize
the TLT. Hence, the process of optimization that was utilized involved a number of steps that
were conducted in a specific manner which includes developing a design of experiments
utilizing the formulation independent variables, conducting in vitro tests on the formulations
generated in the design of experiments, employing regression analysis to determine the
coefficients of a mathematical model and the forecasting of the dependent variables or
measured responses.
Two new model drugs were introduced to the TLT in order to generate more in depth in vitro
drug release results for ultimate optimization of the TLT. Hence, the aim of this chapter was
to outline the comprehensive in vitro analysis of the Box-Behnken design formulations with
specific focus on the two valid experimental responses that were selected. The results
obtained were aided by specific contour plots and diagnostic plots to assess the relationships
between constituents that may have been established and to assess the efficiency of the
Box-Behnken design.

54
4.2. Materials and Methods
4.2.1. Materials
Ranitidine hydrochloride (RDH), promethazine (PMZ) and chlorpromazine (CP) were
purchased from Sigma Chemical Company (St Louis, MO, USA). HPLC grade Acetonitrile
(ACN) was purchased from Microsep (Johannesburg, South Africa). Potassium dihydrogen
phosphate and methyl paraben (MP) was purchased from Rochelle Chemicals
(Johannesburg, South Africa). All other reagents used are of analytical grade.
4.2.2. Methods
4.2.2.1. Determination of appropriate independent formulation variables to explicate
desired responses for the TLT matrices
Separate factors were chosen for each constituent of the TLT matrices in order to be capable
of generating specific mathematical models per constituent. The most fundamental variables
to be considered were the quantities of PA6,10 and SS in the first layer and s-PLGA and
PEO in the third layer. Thus the independent variables were quantitative in nature.
Patterns were observed with regards to the amount of PA6,10 utilized in the formulation and
the effect of this on drug release behavior from the preformulation studies. These patterns
were quantified and used as upper and lower limit variables for drug release. Further
patterns were noted with the amount of s-PLGA and PEO utilized in the third layer. Thus the
quantities of each individual polymer were allocated upper and lower limits and used as
variables for the optimization of the TLT matrices. For the purposes of this study the
responses selected for optimization were rate constants (k) and correlation coefficients (R2
values). Rate constants were to be obtained corresponding to those of zero-order drug
release kinetics while correlation coefficients were to be maximized in order to obtain an
optimal formulation. Table 4.1 displays the formulation variables and responses with the goal
of TLT optimization. These values were selected according to the desired drug release
profiles from the TLT matrices. The drug release profiles from all the layers would be
required to be linear or near linear (zero-order) for the desired outcome of this study.
Each of the three drugs incorporated into the formulations would need to be released at a
constant rate per a predetermined time interval over 24 hours. This was to be attempted in
the anticipation that as drug is released it is being absorbed in the same ratio and quantity
that it was released. During the preliminary studies, the formulations that essentially

55
displayed similar release profiles to the desired release profiles were selected for further
studies and variable development.
Table 4.1: Formulation variables and responses for TLT optimization. Independent variables Upper limits Lower limits
PA6,10 (mg) 300 100 SS (mg) 150 50
s-PLGA (mg) 300 50 PEO (mg) 300 50 Response Upper limits Lower limits
Rate constant (k) Correlation coefficient (R2)
0.06 1
0.039 0.7
It was noted that the quantity of PA6,10 added to the formulation had a significant impact on
the retardation of drug release from the TLT matrices. It was elucidated that a more
substantial quantity of PA6,10 was required for adequate retardation and control of drug
release from the first layer. The same was noted for the ratio of s-PLGA to PEO in the third
layer. A lower ratio displayed a more desired control of drug release from the third layer.
Thus specific numerical values for the independent variables were selected according to
influence they had on the drug release profiles.
4.2.2.2. Box-Behnken Experimental Design for the evaluation of drug release from the
TLT matrices
A Box-Behnken Experimental Design was generated with experimental runs, essentially,
being the basic backbone of the design. The rationale behind this was fundamentally to
minimize the quantity of experimental runs that would be necessary to collect the optimal
amount of data required for adequate interpretation (Karnachi and Khan, 1996; Chopra et al.,
2007). This was also due to the complex nature of data that would be generated from the
TLT formulations. The design software employed (Minitab® V15, Minitab®, PA, USA) was
used to generate seventeen (17) formulations that would undergo experimental runs. The
variable factors for the experimental runs of the TLT matrices are displayed in Table 4.2. The
experimental (measured) responses that result from the design of experiment stage are
utilized to establish an adequate mathematical model that may explain the relationship of the
variables with the measured outcomes (responses).

56
Table 4.2: The Box-Behnken design experimental runs employed to optimize TLT formulations displaying the possible combinations of polymers and excipients that were utilized. Experiment Layer 1 (outer) Layer 2 (middle) Layer 3 (outer)
s- PLGA (mg) PEO (mg) PEO (mg) PA 6,10 (mg) SS (mg)
1 300 50 350 300 50 2 50 300 350 200 150 3 238 113 350 275 75 4 175 175 350 250 100 5 207 142 350 263 87 6 131 219 350 241 109 7 50 300 350 300 50 8 117 233 350 280 70 9 113 238 350 275 75 10 219 131 350 241 109 11 300 50 350 200 150 12 238 113 350 225 125 13 142 208 350 263 87 14 113 238 350 225 125 15 70 280 350 233 117 16 233 117 350 280 70 17 280 70 350 233 117
4.2.2.3. Selection of measured formulation responses for the experimental
optimization of TLT formulations
The selected measured responses employed for optimization of the TLT formulations were
rate constants (k values) and correlation coefficients (R2 values). The Peppas model
(Equation 4.1.) was utilized to generate rate constants by fitting in the individual values per
design formulation. In vitro drug release data from each of the design formulations were fitted
to the Peppas model (Equation 4.1). It is known that if the value of the exponent (n) is one,
zero-order drug release kinetics is followed. It is due to this that the value of n was fixed at 1
and the ideal rate constant value was obtained. The rate constants for each of the design
formulations were calculated in the same manner.
nkt
M
Mt=
∞
Equation 4.1
Where, Mt is the quantity of drug released at time t; M∞ is the drug loading; k is an
experimentally determined kinetic constant and n is an exponent that depends on the
geometry of system and indicates the release mechanism (Davidson III and Peppas, 1986;
Colombo, 1993).
The k and R2 values were computed for each layer of the TLT formulations i.e. three k and R2
values were calculated per formulation. Table 4.5 lists the k values for each of the design
formulations.

57
4.2.2.4. Preparation of the design formulations
Due to the fact that each layer of the TLT would have to be analyzed separately per design
formulation, a decision was made to incorporate three drugs simultaneously to increase the
efficiency of the study. Upon investigation it was found that ranitidine HCl (RDH) and
promethazine (PMZ) possessed the same aqueous solubility as DPH (100mg/mL). This
proved to be beneficial in further proving the controlled release of highly aqueous soluble
drug actives. Therefore it was decided that a logical simultaneous incorporation of the two
drugs into the TLT was favorable. PMZ was incorporated into the middle PEO layer and RDH
was incorporated into the outer s-PLGA layer. The formulations were prepared by direct
compression as described in Chapter 3, Section 3.2.2.5.
4.2.2.5. In vitro dissolution testing on the Box-Behnken Experimental Design
formulations
In vitro drug release studies were performed on the different formulations using a USP 25
rotating paddle method in a dissolution apparatus (Caleva Dissolution Apparatus, model
7ST; G.B. Caleva Ltd., Dorset, UK) at 50 rpm with 900mL simulated gastric fluid (SGF) (pH
1.2, 37°C) and 900mL phosphate-buffer solution (PBS) (pH 6.8; 37°C). A stainless steel
mesh was used in the dissolution vessels in order to prevent the formulations from floating.
Samples of 5 mL were drawn at pre-determined time intervals over a 24 hour period.
4.2.2.6. High Performance Liquid Chromatographic analysis of in vitro dissolution
samples
Analysis of dissolution samples were carried out on a Waters High Performance Liquid
Chromatography (HPLC) machine (Waters Acquity, Microsep, JHB, South Africa). Adequate
HPLC method conditions were determined and utilized to analyze dissolution samples from
the Box-Behnken design formulations. Various methods were attempted in order to obtain a
chromatographic separation method for the simultaneous determination of all three drugs.
This was necessary as DPH, PMZ and RDH were loaded into the TLT formulations
simultaneously in order to perform dissolution testing. Phosphate buffer solution (PBS) (pH 3,
30°C) and Acetonitrile (ACN) were selected as the mobile phases for the separation method.
A substantial amount of time was utilized in attempting to develop a suitable method. Finally,
an isocratic method (as shown in Table 4.3) for the chromatographic quantification of DPH
was obtained as the determination of all three was not easily achievable. Methylparaben
(MP) was employed as the internal standard (IS) for calibration and analysis. Figure 4.1 is a
chromatogram displaying the separation peaks of DPH and MP. Once the chromatographic

58
method was optimized, calibration curves were prepared by running the standards through
the HPLC column.
Table 4.3: HPLC conditions for the chromatographic analysis of DPH. Parameter Condition
Column Xterra™ RP18, 5µm, 4.6×150mm Mobile phase Acetonitrile/20mM potassium dihydrogen
phosphate pH=3, 35:65 Flow rate 1mL/min
Injection volume 20µl Detection UV 210nm
Column Temperature 30°C
The AUC of DPH and MP were noted for each concentration. The ratio between the AUC of
DPH and MP was plotted against concentration. Figure 4.2a and Figure 4.2b display the
calibration curves for DPH quantification in PBS (pH 6.8, 37°C) and SGF (pH 1.2, 37°C)
respectively.
Figure 4.1: Chromatogram depicting the separation peaks of DPH and MP.
Standard stock solutions ranging between 0-0.1mg/mL of DPH, PMZ and RDH were
prepared both in PBS (pH 6.8, 37°C) and SGF (pH 1.2, 37°C) for the calibration analysis.
The ratio between the area under the curve (AUC) of the three drugs and the IS was plotted
against concentration to produce each calibration curve.
Figure 4.2: Calibration curves for DPH quantification in a) PBS (pH 6.8, 37°C) and b) SGF (pH 1.2, 37°C).
a) b)
y=114.2x R2= 0.995
y=158.3x R2= 0.993

59
Table 4.4 displays the method conditions for the simultaneous determination of PMZ and
RDH.
Table 4.4: HPLC conditions for the chromatographic analysis of PMZ and RDH. Parameter Condition
Column Xterra™ RP18, 5µm, 4.6×150mm Mobile phase Acetonitrile/20mM potassium dihydrogen
phosphate pH=5, gradient method Flow rate 1mL/min
Injection volume 20µl Detection UV 254nm
Column Temperature 30°C
The mobile phases employed were PBS (pH 5) and ACN using a gradient method as shown
in Table 4.4. Chlorpromazine (CP) was employed as the IS for calibration and analysis.
Figure 4.3 is a chromatogram displaying the separation peaks of PMZ, RDH and CP. After
method optimization, calibration curves were prepared. Figures 4.4a and b depict the
calibration curves computed for PMZ in PBS (pH 6.8, 37°C) and SGF (pH 1.2, 37°C)
respectively. Similarly, Figures 4.5a and b depict the calibration curves computed for RDH in
PBS and SGF (pH 1.2, 37°C).
Figure 4.3: Chromatogram depicting the separation peaks of RDH, PMZ and CP.
Figure 4.4: Calibration curves for PMZ quantification in a) PBS (pH 6.8, 37°C) and b) SGF (pH 1.2, 37°C).
b) a)
y=139.97x R2= 0.993
y=127.72x R2= 0.970

60
Figure 4.5: Calibration curves for RDH quantification in a) PBS (pH 6.8, 37°C) and b) SGF (pH 1.2, 37°C).
4.3. Results and Discussion
4.3.1. In vitro drug release analysis of the Box-Behnken Experimental Design
formulations
Figure 4.6a exhibits the release profiles of DPH from all the design formulations in PBS (pH
6.8, 37°C). Drug release results of DPH from the design formulations essentially confirmed
those of the preliminary results where the formulations containing a higher quantity of PA
6,10 provided more linear release profiles of DPH. This trend was noted for most of the
formulations. F1 and F7 displayed the most linear release profiles. Release from PBS (pH
6.8, 37°C) was more desirable than the release from SGF (pH 1.2, 37°C).
b) a)
y=34.81x R2= 0.966
y=28.67x R2= 0.995

61
Figure 4.6: Drug release profiles of a) DPH, b) PMZ and c) RDH from the Box-Behnken design formulations in PBS (pH 6.8, 37°C).
PMZ release from the middle layer was linear in most of the formulations as was noted in the
preliminary studies. This was due to the uniform area of the surfaces that are exposed to the
dissolution medium which allows for a constant diffusion path length. Hence, this is
conducive to a uniform flux and thus a constant release of the drug over a time interval (Yang
and Fassihi, 1997; Abdul and Poddar, 2004). Figure 4.6b displays the drug release profiles of
PMZ from the design formulations. Release from the outer s-PLGA layer proved to be the
most challenging in providing linear release of RDH (Figure 4.6c), F7 showed the most linear
b)
c)
a)
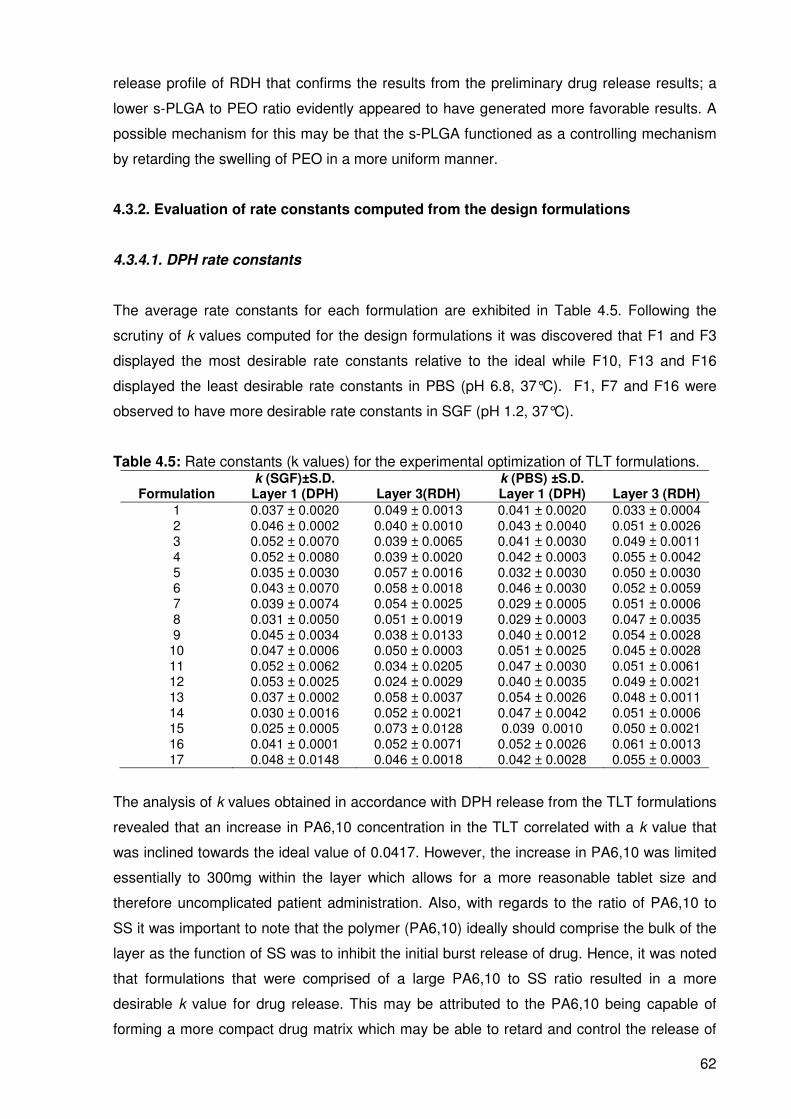
62
release profile of RDH that confirms the results from the preliminary drug release results; a
lower s-PLGA to PEO ratio evidently appeared to have generated more favorable results. A
possible mechanism for this may be that the s-PLGA functioned as a controlling mechanism
by retarding the swelling of PEO in a more uniform manner.
4.3.2. Evaluation of rate constants computed from the design formulations
4.3.4.1. DPH rate constants
The average rate constants for each formulation are exhibited in Table 4.5. Following the
scrutiny of k values computed for the design formulations it was discovered that F1 and F3
displayed the most desirable rate constants relative to the ideal while F10, F13 and F16
displayed the least desirable rate constants in PBS (pH 6.8, 37°C). F1, F7 and F16 were
observed to have more desirable rate constants in SGF (pH 1.2, 37°C).
Table 4.5: Rate constants (k values) for the experimental optimization of TLT formulations. k (SGF)±S.D. k (PBS) ±S.D.
Formulation Layer 1 (DPH) Layer 3(RDH) Layer 1 (DPH) Layer 3 (RDH)
1 0.037 ± 0.0020 0.049 ± 0.0013 0.041 ± 0.0020 0.033 ± 0.0004 2 0.046 ± 0.0002 0.040 ± 0.0010 0.043 ± 0.0040 0.051 ± 0.0026 3 0.052 ± 0.0070 0.039 ± 0.0065 0.041 ± 0.0030 0.049 ± 0.0011 4 0.052 ± 0.0080 0.039 ± 0.0020 0.042 ± 0.0003 0.055 ± 0.0042 5 0.035 ± 0.0030 0.057 ± 0.0016 0.032 ± 0.0030 0.050 ± 0.0030 6 0.043 ± 0.0070 0.058 ± 0.0018 0.046 ± 0.0030 0.052 ± 0.0059 7 0.039 ± 0.0074 0.054 ± 0.0025 0.029 ± 0.0005 0.051 ± 0.0006 8 0.031 ± 0.0050 0.051 ± 0.0019 0.029 ± 0.0003 0.047 ± 0.0035 9 0.045 ± 0.0034 0.038 ± 0.0133 0.040 ± 0.0012 0.054 ± 0.0028
10 0.047 ± 0.0006 0.050 ± 0.0003 0.051 ± 0.0025 0.045 ± 0.0028 11 0.052 ± 0.0062 0.034 ± 0.0205 0.047 ± 0.0030 0.051 ± 0.0061 12 0.053 ± 0.0025 0.024 ± 0.0029 0.040 ± 0.0035 0.049 ± 0.0021 13 0.037 ± 0.0002 0.058 ± 0.0037 0.054 ± 0.0026 0.048 ± 0.0011 14 0.030 ± 0.0016 0.052 ± 0.0021 0.047 ± 0.0042 0.051 ± 0.0006 15 0.025 ± 0.0005 0.073 ± 0.0128 0.039 0.0010 0.050 ± 0.0021 16 0.041 ± 0.0001 0.052 ± 0.0071 0.052 ± 0.0026 0.061 ± 0.0013 17 0.048 ± 0.0148 0.046 ± 0.0018 0.042 ± 0.0028 0.055 ± 0.0003
The analysis of k values obtained in accordance with DPH release from the TLT formulations
revealed that an increase in PA6,10 concentration in the TLT correlated with a k value that
was inclined towards the ideal value of 0.0417. However, the increase in PA6,10 was limited
essentially to 300mg within the layer which allows for a more reasonable tablet size and
therefore uncomplicated patient administration. Also, with regards to the ratio of PA6,10 to
SS it was important to note that the polymer (PA6,10) ideally should comprise the bulk of the
layer as the function of SS was to inhibit the initial burst release of drug. Hence, it was noted
that formulations that were comprised of a large PA6,10 to SS ratio resulted in a more
desirable k value for drug release. This may be attributed to the PA6,10 being capable of
forming a more compact drug matrix which may be able to retard and control the release of

63
DPH in a more superior manner as mentioned in Chapter 3 during preformulation studies.
Figure 4.7 contains typical contour plots depicting the relationship between the rate
constants and polymer concentrations in the TLT matrix for the release of DPH in SGF (pH
1.2, 37°C).
Figure 4.7: Contour plots of the relationship between rate constant and polymer concentration for DPH release in SGF (pH 1.2, 37°C).
4.3.4.2. RDH rate constants
The average k values for each of the design formulation constants are displayed in Table
4.5. Subsequent to analysis it was noted that F8 and F10 displayed the most desirable k
values in comparison to the ideal while F1, F4 and F17 displayed the least desirable k values
in PBS (pH 6.8, 37°C). F2, F3 and F4 displayed the most desirable k values while F6, F13
and F15 displayed the least desirable rate constants in SGF (pH 1.2, 37°C). The analysis of
rate constants obtained according to RDH release from the TLT formulations uncovered
observations revealing that decreased concentrations of s-PLGA in the TLT were associated
with a more desirable rate constant and a lower s-PLGA to PEO ratio exhibited a similar
result. The reason for this detected behavior may be explained by the swelling of PEO which
may provide a constant diffusion path length for RDH to be released as observed during
preformulation in Chapter 3. The s-PLGA was rationalized to facilitate uniform swelling of
PEO. Figure 4.8 contains typical contour plots illustrating the relationship between polymer
concentration and rate constants for RDH release in SGF (pH 1.2, 37°C). The plots illustrate
the significant relationship between PEO and s-PLGA which result in desirable k values in

64
the range of 0.03-0.06 occurring with PEO quantities between 200mg to 350mg and s-PLGA
quantities between 40mg and 50mg.
Figure 4.8: Contour plots of the relationship between k values and polymer concentration for RDH release in SGF (pH 1.2, 37°C).
4.3.5. Evaluation of correlation coefficients obtained from experimental design
formulations
4.3.5.1. DPH correlation coefficients
The average R2 values for each of the design formulations accompanied by standard
deviations are displayed in Table 4.6. In all cases N=2. With the essential aim of establishing
the optimal inclination to linearity, the analysis of R2 values computed from the design
formulations was indeed necessary. It was revealed that F1 and F9 displayed the most
favorable R2 values while F5, F15 and F16 exhibited the least favorable R2 values in SGF
(pH 1.2, 37°C). F1, F3 and F7 displayed the most favorable R2 values while F13 and F16
exhibited the least favorable R2 values in PBS (pH 6.8, 37°C).
Upon analysis, a similar pattern as with the rate constants was noted, that is a greater
quantity of PA6,10 resulting in more linear profiles which is fundamentally in accordance the
most desirable R2 values. The certain instances where a high PA6,10 quantity correlated with
an unfavorable R2 value may be due to experimental or observational error. Figure 4.9
displays vertical bar charts depicting the average R2 values of the experimental design

65
formulations for DPH release a) PBS (pH 6.8, 37°C) and b) SGF (pH 1.2, 37°C). The
favorable behavior of the formulations in PBS (pH 6.8, 37°C) is clearly noticeable in the bar
graphs. A greater tendency towards an R2 value of 1 was evident in PBS (pH 6.8, 37°C) as
opposed to SGF (pH 1.2, 37°C). Figure 4.10 is comprised of contour plots depicting the
relationship between polymer quantities and R2 values. It was observed that the desirable R2
value range of 0.5-1 was achieved with PA6,10 quantities between 250 and 400mg and SS
quantities between 50-150mg.
Table 4.6: Correlation coefficients (R2 values) for the experimental optimization of TLT formulations.
Formulation R2 (SGF) )±S.D. R
2 (PBS) )±S.D.
Layer 1 (DPH) Layer 3 (RDH) Layer 1 (DPH) Layer 3 (RDH)
1 0.984 ± 0.0132 0.704 ± 0.0172 0.938 ± 0.0313 0.606± 0.0527 2 0.606 ± 0.0990 0.816 ± 0.0341 0.782 ± 0.0416 0.607± 0.0811 3 0.622 ± 0.1430 -0.424 ± 0.0930 0.900 ± 0.0132 0.400± 0.0341 4 0.388 ± 0.0220 -0.424 ± 0.0513 0.876 ± 0.0465 0.284± 0.0496 5 -0.512 ± 0.3470 0.298 ± 0.0099 0.687 ± 0.0057 0.733± 0.0863 6 0.384 ± 0.0370 0.631 ± 0.0254 0.629 ± 0.0331 0.438± 0.3385 7 0.410 ± 0.0410 0.414 ± 0.1034 0.908 ± 0.0662 0.725± 0.0100 8 0.808 ± 0.0540 0.057± 0.0084 0.849 ± 0.0522 0.679± 0.0672 9 0.819 ± 0.0142 0.959± 0.2893 0.610 ± 0.0228 0.641± 0.0921 10 0.326 ± 0.0104 0.681± 0.0054 0.690 ± 0.0706 0.275± 0.0577 11 0.275 ± 0.0586 0.576± 0.0552 0.798 ± 0.0153 0.368± 0.1963 12 0.659 ± 0.1380 0.565± 0.1613 0.896 ± 0.0129 0.653± 0.1009 13 0.505 ± 0.0303 0.588± 0.0496 0.024 ± 0.1980 0.739± 0.0494 14 -1.000 ± 0.0087 0.436± 0.1573 0.904 ± 0.0482 0.695± 0.0054 15 -1.144 ± 0.0513 0.818± 0.2563 0.938 ± 0.0317 0.782± 0.1742 16 0.599 ± 0.0419 0.670± 0.1786 -0.403 ± 0.0422 0.594± 0.0578 17 -0.481 ± 0.007 0.247± 0.0392 0.528 ± 0.1564 0.433± 0.0912
Figure 4.9: Vertical bar chart displaying the average correlation coefficients (R2) of the design formulations in a) PBS (pH 6.8, 37°C) and b) SGF (pH 1.2, 37°C), (N=2).
a) b)

66
Figure 4.10: Contour plots depicting the relationship between the polymer mixtures and the R2 values of DPH release from the design formulations in PBS (pH 6.8, 37°C).
4.3.5.2. RDH correlation coefficients
F5, F7 and F13 displayed the most favorable R2 values while F4 and F10 displayed the least
favorable R2 values in PBS (pH 6.8, 37°C). F2 and F9 exhibited the most desirable R2 values
while F3 and F4 exhibited the least desirable R2 values in SGF (pH 1.2, 37°C). As previously
mentioned, this fits in with the pattern observed for the rate constants. A higher PEO to s-
PLGA ratio resulted in more desirable R2 values. The opposite was noted for lower PEO to s-
PLGA. This is owed to the resulting R2 values being very distant to the ideal. Figure 4.11
includes the contour plots illustrating the relationship between polymer concentrations and R2
values for RDH release in PBS (pH 6.8, 37°C) which further substantiates the optimal R2
values in the range of 0.8-1 being achieved within the polymer mixtures containing 300-
350mg PEO and 0-50mg s-PLGA.
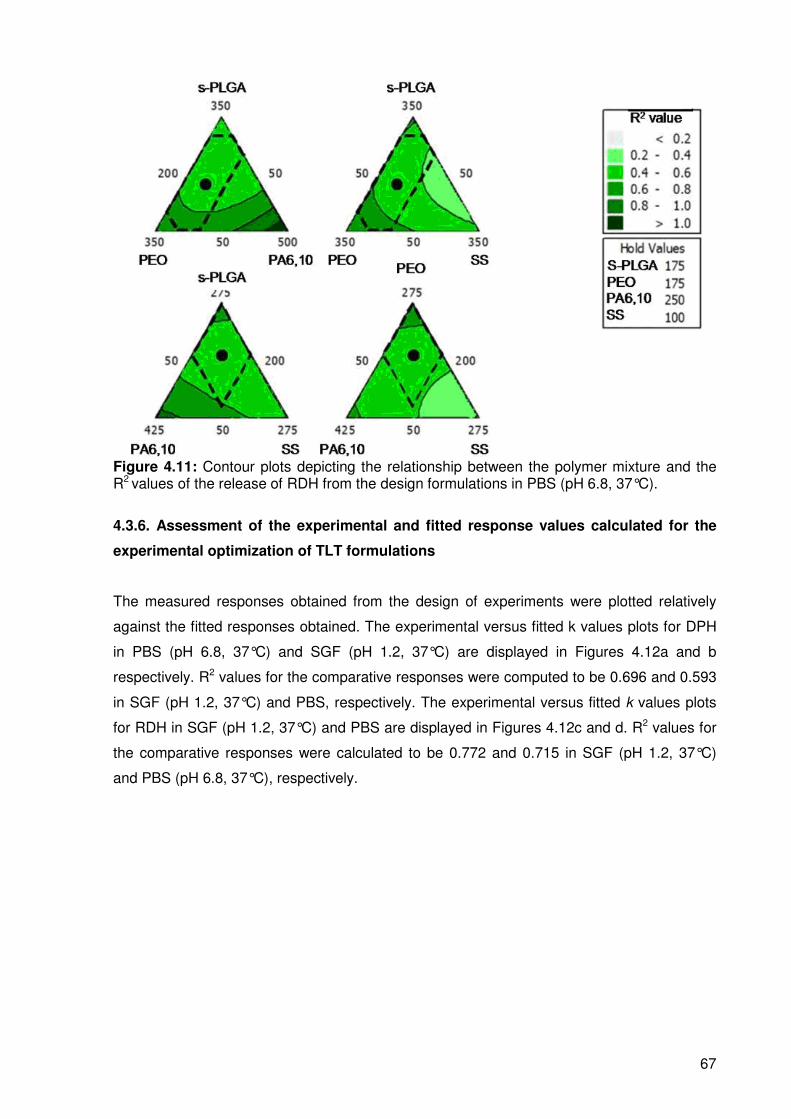
67
Figure 4.11: Contour plots depicting the relationship between the polymer mixture and the R2 values of the release of RDH from the design formulations in PBS (pH 6.8, 37°C).
4.3.6. Assessment of the experimental and fitted response values calculated for the
experimental optimization of TLT formulations
The measured responses obtained from the design of experiments were plotted relatively
against the fitted responses obtained. The experimental versus fitted k values plots for DPH
in PBS (pH 6.8, 37°C) and SGF (pH 1.2, 37°C) are displayed in Figures 4.12a and b
respectively. R2 values for the comparative responses were computed to be 0.696 and 0.593
in SGF (pH 1.2, 37°C) and PBS, respectively. The experimental versus fitted k values plots
for RDH in SGF (pH 1.2, 37°C) and PBS are displayed in Figures 4.12c and d. R2 values for
the comparative responses were calculated to be 0.772 and 0.715 in SGF (pH 1.2, 37°C)
and PBS (pH 6.8, 37°C), respectively.

68
Figure 4.12: Regression plots for rate constants (k) for a) DPH in SGF (pH 1.2, 37°C), b) DPH in PBS (pH 6.8, 37°C), c) RDH in SGF and d) RDH in PBS.
a) b)
c) d)

69
Figure 4.13: Regression plots for correlation coefficients (R2 values) for a) DPH in SGF (pH 1.2, 37°C) b) DPH in PBS (pH 6.8, 37°C), c) RDH in SGF (pH 1.2, 37°C) and d) RDH in PBS (pH 6.8, 37°C).
The plots for experimental versus fitted R2 values for DPH in SGF (pH 1.2, 37°C) and PBS
(pH 6.8, 37°C) are displayed in Figures 4.13a and b. Correlation coefficients of 0.719 and
0.670 were demonstrated for SGF (pH 1.2, 37°C) and PBS (pH 6.8, 37°C) respectively.
Figures 4.13c and d illustrate the experimental versus fitted plots for R2 values of RDH in
SGF (pH 1.2, 37°C) and PBS (pH 6.8, 37°C) with correlation coefficients of 0.532 and 0.597
being obtained for SGF (pH 1.2, 37°C) and PBS (pH 6.8, 37°C) respectively.
4.3.7. Evaluation of residual plots for optimization and subsequent response
optimization of the TLT matrices
Residuals plots may be employed to analyze the fit of regression models in a Box-Behnken
design. These plots can be defined as measuring the variation between the actual observed
responses and the predicted responses. Figures 4.14, 4.15, 4.16, 4.17, 4.18, 4.19, 4.20 and
4.21 display the residual plots for the analysis of the Box-Behnken Experimental Design.
a) b)
d) c)
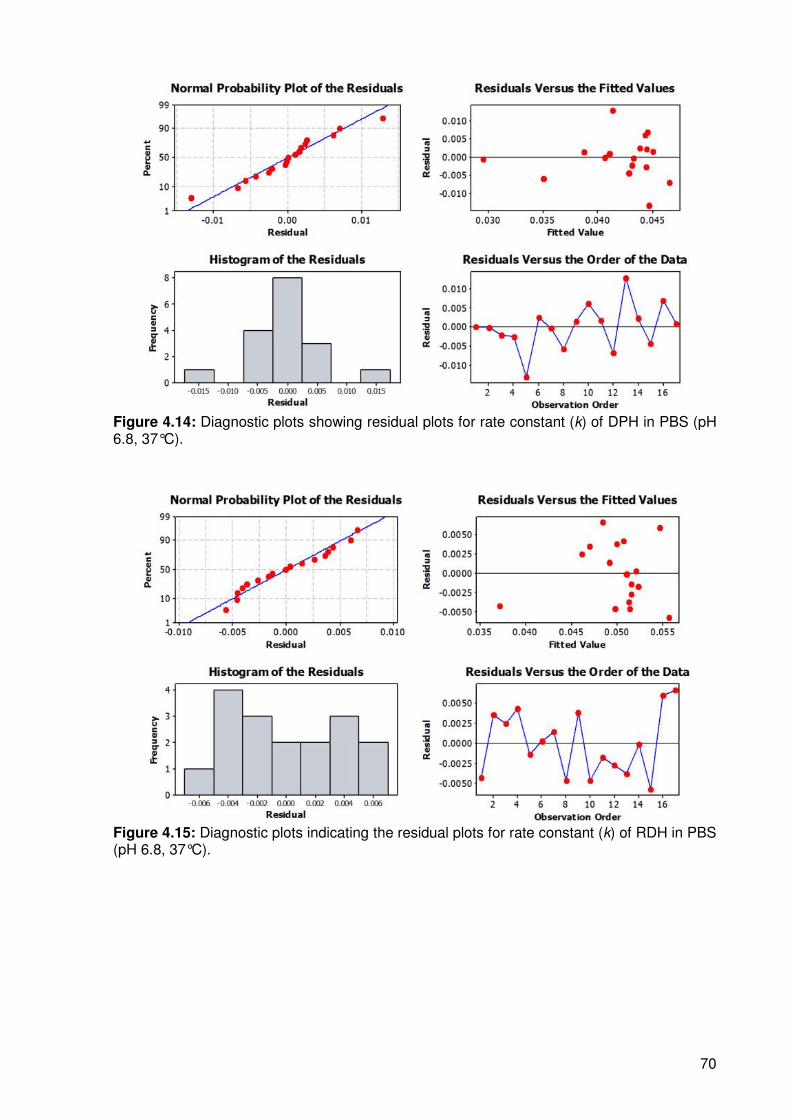
70
Figure 4.14: Diagnostic plots showing residual plots for rate constant (k) of DPH in PBS (pH 6.8, 37°C).
Figure 4.15: Diagnostic plots indicating the residual plots for rate constant (k) of RDH in PBS (pH 6.8, 37°C).

71
Figure 4.16: Diagnostic plots indicating the residual plots for correlation coefficients (R2
values) for DPH in PBS (pH 6.8, 37°C).
Figure 4.17: Diagnostic plots indicating the residual plots for correlation coefficients (R2
values) for RDH in PBS (pH 6.8, 37°C).
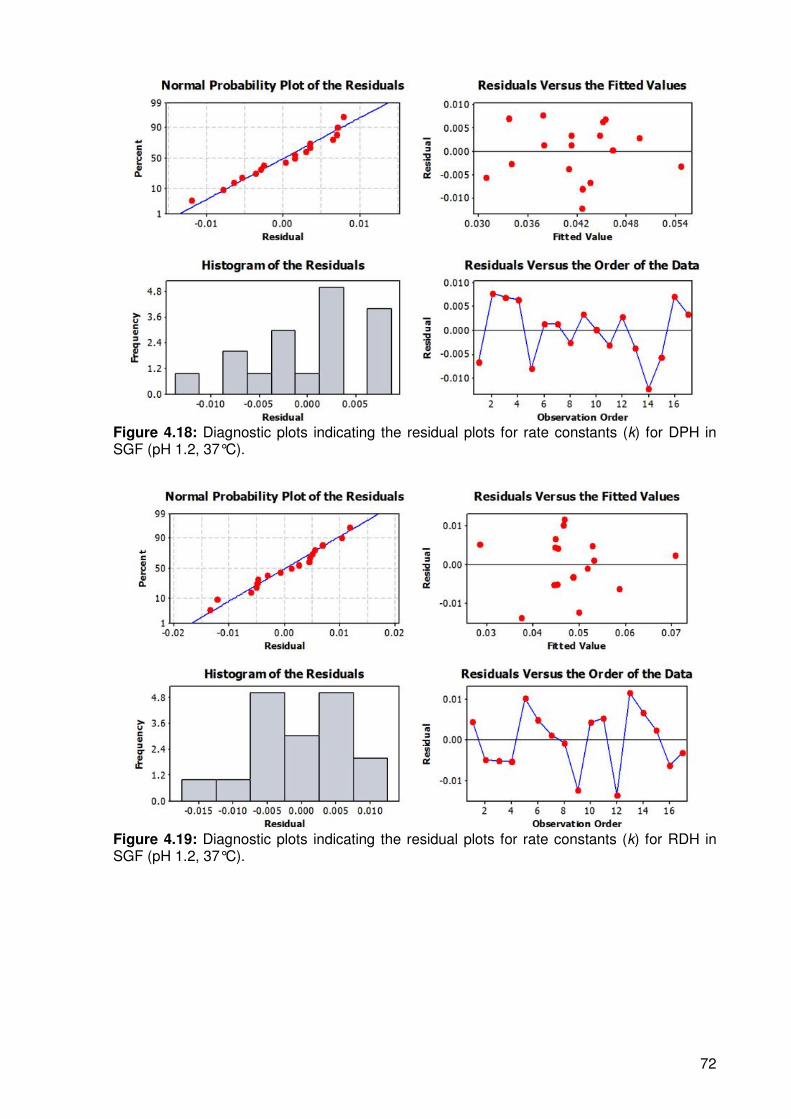
72
Figure 4.18: Diagnostic plots indicating the residual plots for rate constants (k) for DPH in SGF (pH 1.2, 37°C).
Figure 4.19: Diagnostic plots indicating the residual plots for rate constants (k) for RDH in SGF (pH 1.2, 37°C).
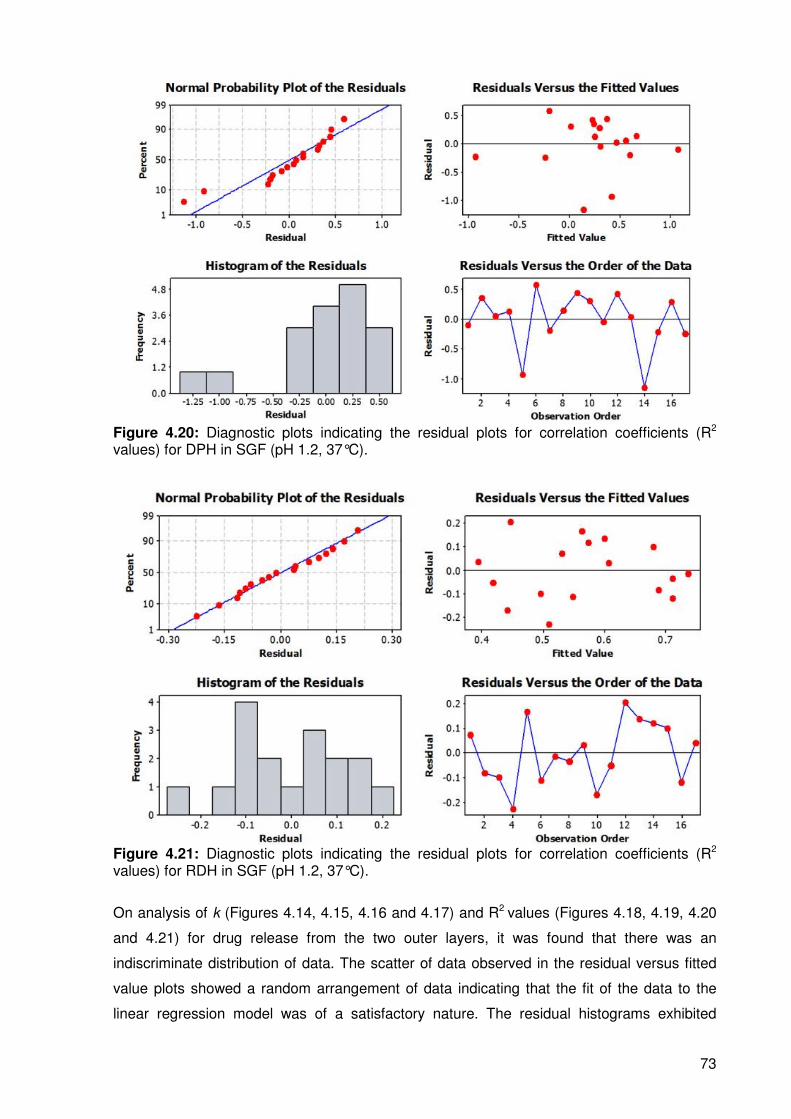
73
Figure 4.20: Diagnostic plots indicating the residual plots for correlation coefficients (R2
values) for DPH in SGF (pH 1.2, 37°C).
Figure 4.21: Diagnostic plots indicating the residual plots for correlation coefficients (R2
values) for RDH in SGF (pH 1.2, 37°C).
On analysis of k (Figures 4.14, 4.15, 4.16 and 4.17) and R2 values (Figures 4.18, 4.19, 4.20
and 4.21) for drug release from the two outer layers, it was found that there was an
indiscriminate distribution of data. The scatter of data observed in the residual versus fitted
value plots showed a random arrangement of data indicating that the fit of the data to the
linear regression model was of a satisfactory nature. The residual histograms exhibited

74
nearly bell-shaped curves with the exception of a few. The presence of a bell-shaped curve
indicates a relatively normal distribution of data. If this shape is not observed, it is indicative
of an aspect of the data that is not accounted for in the model which needs to be identified for
a better outcome. The residual versus observation order plots showed indiscriminate
fluctuations in relation to the centre line which suggests that the error terms did not correlate
amongst one another. The regression equations generated for the two responses for each
layer in both PBS (pH 6.8, 37°C) and SGF (pH 1.2, 37°C) are demonstrated below for k
value (DPH, PBS (pH 6.8, 37°C), Equation 4.2), k value (DPH, SGF (pH 1.2, 37°C), Equation
4.4), k value (RDH, PBS (pH 6.8, 37°C), Equation 4.3), k value (RDH, SGF (pH 1.2, 37°C),
Equation 4.5), R2 value (DPH, PBS (pH 6.8, 37°C), Equation 4.6), R2 value (DPH, SGF (pH
1.2, 37°C), Equation 4.8), R2 value (RDH, PBS (pH 6.8, 37°C), Equation 4.7) and R2 value
(RDH, SGF, Equation 4.9).
[ ] [ ] [ ] [ ]
[ ][ ] [ ][ ]
[ ][ ] [ ][ ]PA6,10PEO4398.0SSPLGAs2778.0
PA6,10PLGAs3455.0PEOPLGAs1059.0
SS2258.0PA6,101035.0PEO0867.0PLGAs0046.0
+−−
−−−+
+−−−=k
Equation 4.2
[ ] [ ] [ ] [ ]
[ ][ ] [ ][ ]
[ ][ ] [ ][ ]PA6,10PEO0893.0SSPLGAs0024.0
PA6,10PLGAs4343.0PLGAs1353.0
SS0388.0PA6,101236.0PEO0217.0PLGAs1359.0
−−−
−−−+
+++−=
PEO
k
Equation 4.3
[ ] [ ] [ ] [ ]
[ ][ ] [ ][ ]
[ ][ ] [ ][ ]PA6,10PEO6487.0SSPLGAs3387.0
PA6,10PLGAs7697.0PLGAs0526.0
SS1327.0PA6,101756.0PEO0762.0PLGAs1364.0
+−+
−+−+
+−−−−=
PEO
k
Equation 4.4
[ ] [ ] [ ] [ ]
[ ][ ] [ ][ ]
[ ][ ] [ ][ ]PA6,10PEO819.0SSPLGAs557.0
PA6,10PLGAs216.1PLGAs058.0
SS058.0PA6,10397.0PEO125.0PLGAs311.0
−−−
−−−+
−++−−=
PEO
k
Equation 4.5
[ ] [ ] [ ] [ ]
[ ][ ] [ ][ ]
[ ][ ] [ ][ ]PA6,10PEO470.18SSPLGAs808.9
PA6,10PLGAs922.29PLGAs280.5
SS318.3PA6,10990.5PEO946.0PLGAs927.6R2
+−+
−+−−
+−−−−=
PEO
Equation 4.6

75
[ ] [ ] [ ] [ ]
[ ][ ] [ ][ ]
[ ][ ] [ ][ ]PA6,10PEO930.4SSPLGAs318.5
PA6,10PLGAs973.8PLGAs637.2
SS407.0PA6,10306.2PEO912.1PLGAs448.3R2
−−−
−−−−
−++−=
PEO
Equation 4.7
[ ] [ ] [ ] [ ]
[ ][ ] [ ][ ]
[ ][ ] [ ][ ]PA6,10PEO469.18SSPLGAs023.13
PA6,10PLGAs610.39PLGAs760.9
SS220.2PA6,10553.9PEO186.2PLGAs464.6R2
+−+
−+−−
−−+−−=
PEO
Equation 4.8
[ ] [ ] [ ] [ ]
[ ][ ] [ ][ ]
[ ][ ] [ ][ ]PA6,10PEO83.1SSPLGAs30.18
PA6,10PLGAs67.13PLGAs12.11
SS69.3PA6,1066.0PEO02.0PLGAs66.7R2
+−−
−−−−
+++−=
PEO
Equation 4.9
4.3.8. Response Optimization
Optimization was executed using Minitab®, V15 (Minitab® Inc, Pennsylvania, USA). The TLT
was optimized in accordance with the dependent variables (measured responses) of k values
and R2 values. The values of the measured responses were targeted within the limits
according to those of the ideal formulation outlined previously. Figures 4.22 and 4.23 exhibit
the ultimate optimization plots for rate constants in SGF (pH 1.2, 37°C) and PBS (pH 6.8,
37°C) displaying a composite desirability of 88.23%.
Table 4.7: Targeted response values for TLT optimization in both SGF (pH 1.2, 37°C) and PBS (pH 6.8, 37°C).
Response Lower Target Upper
k value 0.0350 0.0417 0.0500 R2 value 0.7000 1.0000 1.0000
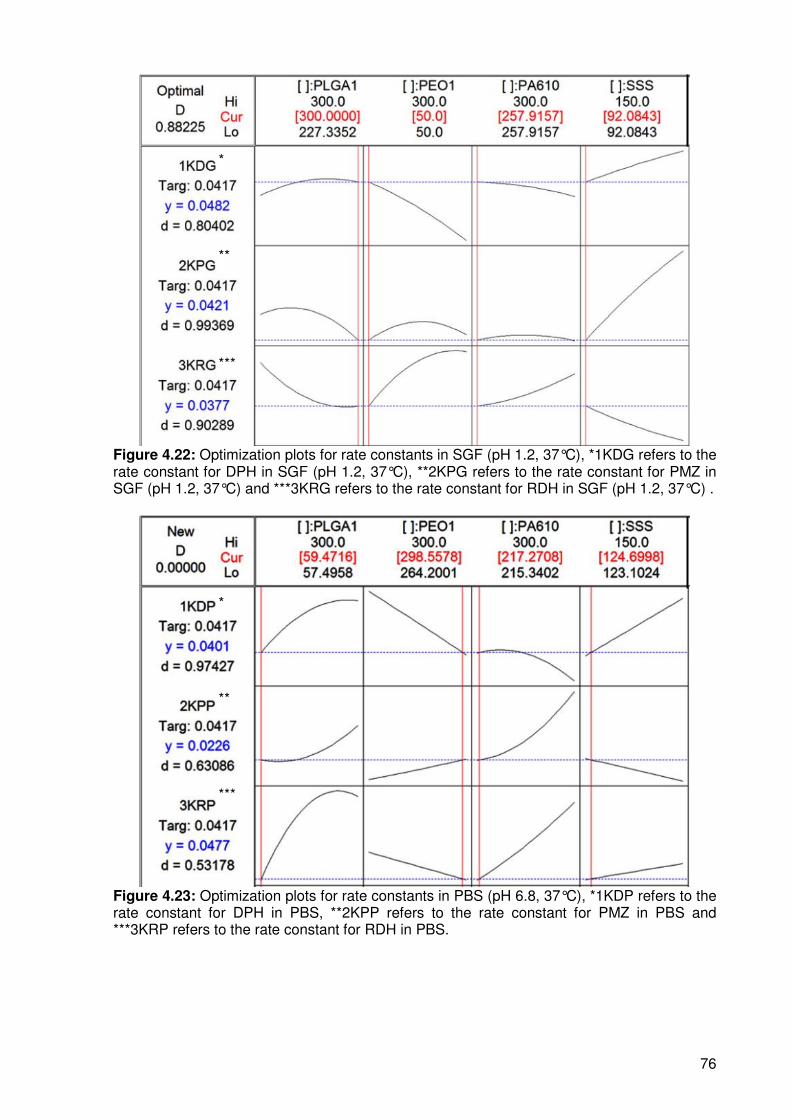
76
Figure 4.22: Optimization plots for rate constants in SGF (pH 1.2, 37°C), *1KDG refers to the rate constant for DPH in SGF (pH 1.2, 37°C), **2KPG refers to the rate constant for PMZ in SGF (pH 1.2, 37°C) and ***3KRG refers to the rate constant for RDH in SGF (pH 1.2, 37°C) .
Figure 4.23: Optimization plots for rate constants in PBS (pH 6.8, 37°C), *1KDP refers to the rate constant for DPH in PBS, **2KPP refers to the rate constant for PMZ in PBS and ***3KRP refers to the rate constant for RDH in PBS.
*
**
***
*
**
***

77
4.3.9. In vitro assessment of the optimized TLT formulation
The two established optimized formulations which were 217.27mg PA6,10: 124.70mg SS
and 59.47mg s-PLGA: 298.56g PEO in PBS (pH 6.8, 37°C)) and 257.92mg PA6,10: 92.98mg
SS and 50mg s-PLGA: 300mg PEO in SGF (pH 1.2, 37°C) were subjected to the same in
vitro dissolution conditions as those from the experimental design. Each optimized
formulation was tested in both SGF (pH 1.2, 37°C) and PBS (pH 6.8, 37°C) once again for a
comprehensive analysis.
After further analysis it was discovered that a combination of the two optimized formulations
provided superior linear release in both SGF (pH 1.2, 37°C) and PBS (pH 6.8, 37°C) which
was more desirable since having one formulation that is capable of providing linear release in
both gastrointestinal environments would fundamentally be more feasible and simple.
The optimal formulation was found to be 257.92mg PA6,10: 92.08mg SS and 59.47g s-
PLGA: 298.56mg PEO with the middle layer having a constant quantity of 350mg PEO. This
was further confirmed by subjecting the formulation to dissolution in a USP 32 Apparatus 3
(Bio-Dis II Release Rate Tester, Vankel Industries). This allowed for automatic changes in
pH environments essentially simulating the potential gastrointestinal transit of the TLT.
Figures 4.24a, b and c demonstrate the drug release profiles achieved from the optimized
formulation. Table 4.8 exhibits the experimental versus predicted responses computed for
the optimized TLT formulation.
Table 4.8: The predicted versus experimental values of the measured responses after optimization.
Response Predicted value Experimental value Desirability
k value DPH (SGF) 0.0482 0.0422 ± 0.005 80.40%
k value DPH (PBS) 0.0401 0.0454 ± 0.012 97.42%
R2 value DPH (SGF) 0.7527 0.8309 ± 0.017 88.76%
R2 value DPH (PBS) 0.9310 0.8354 ± 0.024 89.73%
k value RDH (SGF) 0.0377 0.0481 ± 0.020 90.29%
k value RDH (PBS) 0.0477 0.0601 ± 0.008 53.18%
R2 value RDH (SGF) 0.5297 0.7407 ± 0.035 78.62%
R2 value RDH (PBS) 0.6862 0.4046 ± 0.023 58.96%

78
Figure 4.14: Drug release profiles of a) DPH; b) RDH and c) PMZ from the optimized TLT formulation (N=3).
4.4. Concluding Remarks
TLT matrices were prepared and optimized according to a Box-Behnken Experimental
Design. The influence that the independent variables had on the measured responses was
a)
b)
c)

79
analyzed, resulting in the statistical establishment of an optimized formulation. The optimized
formulation displayed a satisfactory near linear release of the model drugs. The chosen
experimental design proved to be satisfactory yet not optimal for the complex facets of the
said TLT. Further research should focus on establishing a more fitting and comprehensive
statistical analysis for the intricate nature of the TLT.

80
CHAPTER 5
CHARACTERIZATION AND FURTHER INTROSPECTIVE EVALUATION OF THE
OPTIMIZED TRIPLE-LAYERED TABLET FORMULATION
5.1. Introduction
The physicomechanical properties of a drug delivery system may have a significant effect on
drug release behavior. Therefore, it is necessary to assess the physicomechanical
characteristics, and the effects of such characteristics on physicochemical and drug release
performance (Tiwari and Rajabi-Siahboomi, 2008). By assessing the overall structural
characteristics of a formulation, it is possible to gauge the effects of said characteristics on
drug release potential and stability of the formulation.
The stability of the TLT upon storage and under in vivo conditions is extremely significant as
it determines whether the TLT is a feasible system to develop. The presence of pores within
the TLT structure may vastly affect the drug release potential and is therefore another
important analysis that needs to be performed. The physical behavior of the drug delivery
system in the gastrointestinal environment is also a factor that needs to be determined as it
may affect the patient tolerability of the system. When developing such a drug delivery
system, it is necessary to gauge the versatility of drug release capabilities. It would be ideal,
in this instance, that the drug delivery system be capable of acting as a matrix to a variety of
drugs with various structures.
Subsequent to the design and optimization of the TLT, the matters summarized in this
Chapter were further characteristic studies performed to ascertain the flexibility and overall
behavior of the optimized TLT formulation. To begin with, the most logical approach was
established to be the determination of superiority in drug release of the TLT to the
conventional (commercial) drug products in an in vitro setting. This comparison was
performed along with various other investigations, namely, Brinell Hardness Number
evaluation, Scanning Electron Microscopy (SEM) imaging, porosity analysis and Magnetic
Resonance Imaging (MRI). Another fundamental investigation that was conducted was the
application of a therapeutic drug treatment regimen to the optimized TLT formulation.

81
5.2. Materials and Methods
5.2.1. Materials
Atenolol (ATN) and acetylsalicylic acid (ASA) were purchased from Sigma Chemical
Company (St Louis, MO, USA). Simvastatin (SMV) was received as a gift sample from
Adcock-Ingram (Johannesburg, South Africa). SLEEPEZE-PM®, Ranihexal® and Phenergan®
were purchased from Parklane Hospital Pharmacy (Johannesburg, South Africa). All other
reagents used were of analytical grade.
5.2.2.1. Brinell Hardness Number evaluation of the optimized TLT formulation
Matrix hardness evaluation of the optimized TLT formulation was performed as a function of
Brinell Hardness Number (BHN) as per the parameters described in Chapter 3, section
3.2.2.10. This was determined to assess the robustness of the TLT.
5.2.2.2. Morphological surface structure imaging of the optimized TLT formulation
employing Scanning Electron Microscopy
Scanning Electron Microscopy (SEM) was carried out using a Phenom scanning electron
microscope (FEI Company, Hillsboro, Oregon, USA) was employed to produce imaging of
the PA 6,10 layer surface for a holistic characterization and investigation for the presence of
pores.
5.2.2.3. Porosity analysis of the PA6,10 layer of the optimized TLT formulation
Porosity analysis was conducted as a supplementary investigation to determine the presence
of pores and pore size within the PA6,10 layer of the optimized TLT formulation. The
rationale for this analysis is the untoward unhomogenous pores that might develop after
compression (Wu et al., 2005). Surface area and porosity studies were conducted using a
micromeritics ASAP analyzer (Micromeritics ASAP 2020, GA, USA). The procedure involved
the degassing of samples prior to analysis. Degassing functions as a preparation stage to
condition the sample to the appropriate state for analysis. A dissected section of the PA6,10
layer was placed in the sample tube for analysis.
5.2.2.4. In vitro dissolution testing on SLEEPEZE-PM®, Ranihexal®and Phenergan®
In order to authenticate the results achieved by the optimized TLT formulation, it was
necessary to draw a comparison in drug release behaviour between the TLT and the

82
conventional tablets available. The tablets selected were SLEEPEZE-PM® containing
diphenhydramine (DPH), Ranihexal® containing ranitidine (RDH) and Phenergan® containing
promethazine (PMZ). In vitro drug release studies were performed on the tablets using a
USP 25 rotating paddle method in a dissolution apparatus (Caleva Dissolution Apparatus,
model 7ST; G.B. Caleva Ltd., Dorset, UK) at 50rpm with 900mL simulated gastric fluid (SGF)
(pH 1.2, 37°C) and 900mL phosphate-buffer solution (PBS) (pH 6.8; 37°C). A stainless steel
mesh was used in the dissolution vessels in order to prevent the formulations from floating.
Samples of 5 mL were drawn at pre-determined time intervals over a 24 hour period.
5.2.2.5. Application of a therapeutic drug regimen to the optimized TLT formulation
Three cardiovascular related drugs were selected for evaluating the flexibility of the
optimized TLT formulation. Atenolol (ATN) which is a beta-blocker used to treat hypertension
was selected for incorporation into the PA6,10 outer layer; aspirin (ASA) which is used as an
anticoagulant in heart disease was selected for incorporation into the middle PEO layer and
simvastatin (SMV) which is an antihyperlipidaemic drug was selected for incorporation into
the s-PLGA outer layer. These drugs were chosen due to the high frequency with which they
are used in conjunction with each other in cardiovascular related treatment regimens.
Therefore a dosage form in which they all may be administered in a single dose would
essentially be very beneficial in terms of patient compliance.
Table 5.1 indicates the therapeutic quantities incorporated in to the TLT formulation. In vitro
drug release studies were performed as described in Chapter 5, section 5.2.2.4. Ultraviolet
(UV) spectrophotometry was employed to analyze the dissolution samples.
Table 5.1: Quantities of drug actives incorporated in to TLT for the evaluation of drug release of therapeutic regimen.
Drug Layer 1 (PA6,10) Middle layer (PEO) Layer 3 (s-PLGA)
ATN 50mg - - ASA - 100mg - SMV - - 40mg
5.2.2.6. Comparative in vitro dissolution analysis between the conventional
therapeutic regimen formulations and the release of therapeutic regimen drugs from
the optimized TLT formulation
In order to confirm the superior release of ATN, SMV and ASA from the optimized TLT
formulation, conventional drug products Tenormin® 50; DISPRIN CV®100 and Adco-
Simvastatin 40 were subjected to the equivalent in vitro dissolution studies as the optimized
TLT formulation mentioned in Chapter 3, section 3.2.2.7. Calibration curves were constructed
by preparing a stock solution which was serially diluted to prepare five standard solutions
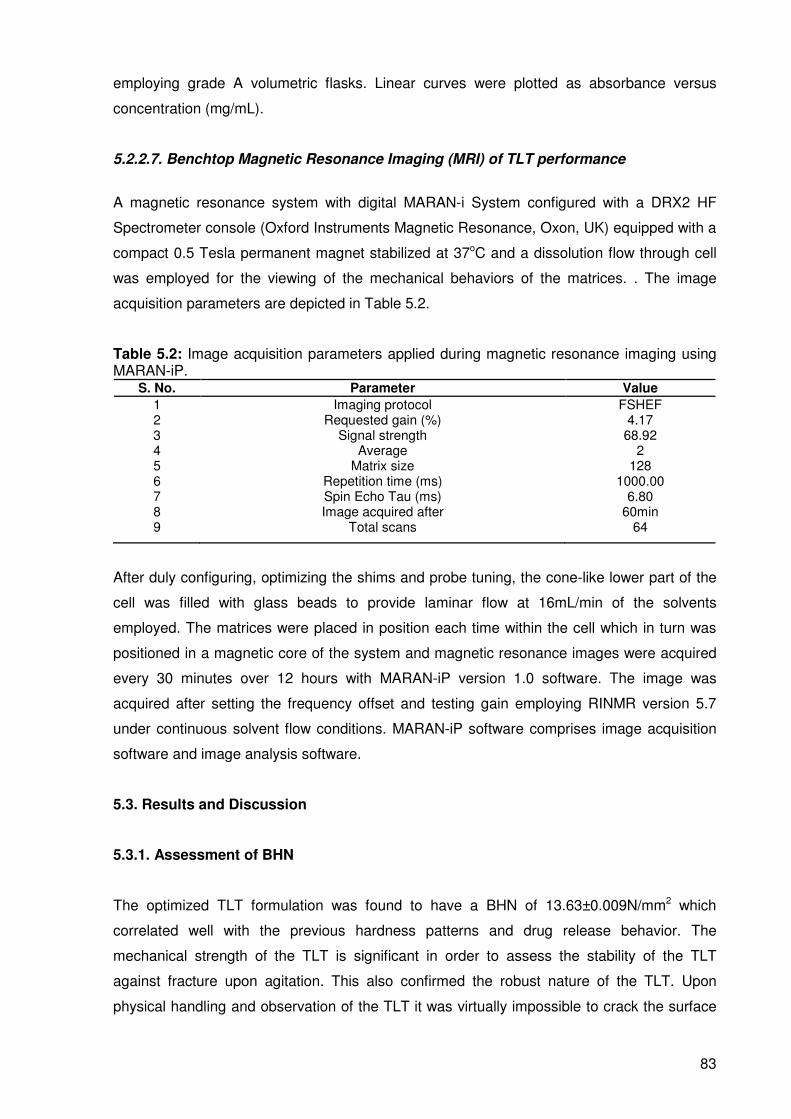
83
employing grade A volumetric flasks. Linear curves were plotted as absorbance versus
concentration (mg/mL).
5.2.2.7. Benchtop Magnetic Resonance Imaging (MRI) of TLT performance
A magnetic resonance system with digital MARAN-i System configured with a DRX2 HF
Spectrometer console (Oxford Instruments Magnetic Resonance, Oxon, UK) equipped with a
compact 0.5 Tesla permanent magnet stabilized at 37oC and a dissolution flow through cell
was employed for the viewing of the mechanical behaviors of the matrices. . The image
acquisition parameters are depicted in Table 5.2.
Table 5.2: Image acquisition parameters applied during magnetic resonance imaging using MARAN-iP.
S. No. Parameter Value
1 Imaging protocol FSHEF 2 Requested gain (%) 4.17 3 Signal strength 68.92 4 Average 2 5 Matrix size 128 6 Repetition time (ms) 1000.00 7 Spin Echo Tau (ms) 6.80 8 Image acquired after 60min 9 Total scans 64
After duly configuring, optimizing the shims and probe tuning, the cone-like lower part of the
cell was filled with glass beads to provide laminar flow at 16mL/min of the solvents
employed. The matrices were placed in position each time within the cell which in turn was
positioned in a magnetic core of the system and magnetic resonance images were acquired
every 30 minutes over 12 hours with MARAN-iP version 1.0 software. The image was
acquired after setting the frequency offset and testing gain employing RINMR version 5.7
under continuous solvent flow conditions. MARAN-iP software comprises image acquisition
software and image analysis software.
5.3. Results and Discussion
5.3.1. Assessment of BHN
The optimized TLT formulation was found to have a BHN of 13.63±0.009N/mm2 which
correlated well with the previous hardness patterns and drug release behavior. The
mechanical strength of the TLT is significant in order to assess the stability of the TLT
against fracture upon agitation. This also confirmed the robust nature of the TLT. Upon
physical handling and observation of the TLT it was virtually impossible to crack the surface

84
of the compressed TLT structure which further supported the mechanical strength of the
optimized TLT.
5.3.2. SEM images depicting the PA6,10 layer surface of the TLT
SEM images of the PA6,10 layer showed irregular surfaces with minimal pores. The lack of
pores observed on a surface image was found to be desirable. This is due to the possibility
that the presence of pores after compression may alter the release of drug from the layer.
The irregular surface may be attributed to the crystalline nature of PA6,10 at room
temperature (25°C) which may have resulted in uneven compression and irregular
distribution of the layer. The presence of such irregularities did not appear to significantly
affect the release of drug from the layer. The reason for the lack of interaction may be the
unhindered and uniform erosion of the PA6,10 layer upon dissolution irrespective of irregular
surface. Upon interaction of the dissolution medium, the relaxation of PA6,10 in the layer
may cancel out the irregular surfaces thereby resulting in uniform erosion and drug release.
Figures 5.1a and b are SEM images obtained on analysis of the surface of the PA6,10 layer.
Figure 5.1: Typical SEM images of a) the PA6,10 layer of the TLT at a lower magnification depicting irregular surfaces and b) the PA6,10 layer of the TLT at a greater magnification.
a) b)

85
5.3.3. Porosity analysis
Porosity analysis was conducted in order to determine the volume of distribution of pores if
pores were found to be present in the optimized TLT. Pore size was also investigated. Table
5.3 shows the resultant values subsequent to analysis using the Barret, Joyner and Halenda
Method (BJH).
Table 5.3: Assessment of pore volume and pore size of the TLT. Parameter Value
Pore Size
Adsorption average pore width 99.7681Å
BJH adsorption average pore diameter 163.958Å
BJH desorption average pore diameter 141.604Å
Pore Volume
BJH Adsorption cumulative volume of pores between 17.000Å and 3000.000Å diameter
0.013191cm³/g
BJH Desorption cumulative volume of pores between 17.000Å and 3000.000Å diameter
0.013085cm³/g
It was discovered that the pores contained in the TLT were chiefly mesoporic within the sizes
of 99.7681Å and 163.958Å in diameter. No micropores were identified. The total pore volume
ranged between 0.0065 and 0.0132cm³/g indicating a decreased pore volume which was
desirable. This is due to the variable influence on drug release behavior that may occur in the
presence of large pores. Therefore the lack of large pores is advantageous so as to not
hinder drug release behavior.
5.3.4. Comparative analysis of drug release behavior from conventional tablets
SLEEPEZE-PM®, Ranihexal®and Phenergan® and optimized TLT formulation
In vitro dissolution results revealed that the optimized formulation profile depicted a
significant superior release of DPH, PMZ and RDH as compared to the respective
conventional tablets. The optimized TLT achieved extended controlled release of all three
drugs over 24 hours while the disintegration times of SLEEPEZE-PM® tablets, Ranihexal®
tablets and Phenergan® tablets were approximately 1 hour, 1 hour and 30 minutes
respectively. Figures 5.2a, b and c illustrate the drug release profiles of the conventional
tablets.
Furthermore, the erratic spiked concentrations due to an immediate burst release are also
noted from the conventional products. This is exactly what the TLT aims to rectify wherever

86
applicable. By decreasing the initial rapid release of drug the TLT may thus decrease the
potential of increased plasma drug levels that may lead to unwanted side-effects or toxicity.
The rate constant (k) values calculated from the release profiles of SLEEPEZE-PM® tablets,
Ranihexal® tablets and Phenergan® tablets were 1.3824, 1.3693 and 1.4701 respectively.
The correlation coefficients (R2 values) generated from the release profiles were established
to be 0.344, 0.366 and -0.340 respectively. The measured responses achieved by the
conventional tablets further confirm the vast variance to controlled release patterns. This
unmistakeable difference solidifies the controlled release capability of the TLT.
Figure 5.2: Drug release profiles from conventional tablets a) SLEEPEZE-PM®, b) Phenergan® and c) Ranihexal® in PBS (pH 6.8, 37°C).
a) b)
c)

87
5.3.5. Establishment of the efficacy of the TLT for the controlled delivery of a
cardiovascular therapeutic drug regimen
5.3.5.1. Construction of calibration curves
Correlation coefficients (R2 values) were calculated to be more than 0.96 for all plots.
Figures 5.3, 5.4 and 5.5 display the calibration curves prepared for ATN, ASA and SMV
respectively in SGF (pH 1.2, 37°C) and PBS (pH 6.8, 37°C).
Figure 5.3: Calibration curve for ATN in a) PBS (pH 6.8, 37°C) and b) SGF (pH 1.2, 37°C).
Figure 5.4: Calibration curves for ASA in a) PBS (pH 6.8, 37°C) and b) SGF (pH 1.2, 37°C).
Figure 5.5: Calibration curves for SMV in a) PBS (pH 6.8, 37°C) and b) SGF (pH 1.2, 37°C).
a) b)
a) b)
a) b)
y=3.8443x R2= 0.998
y=3.8451x R2= 0.999
y=2.7524x R2= 0.999
y=2.612x R2= 0.999
y=57.91x R2= 0.995
y=57.106x R2= 0.996

88
5.3.5.2. Characterization of drug release behavior after the incorporation of ATN, ASA
and SMV into the TLT
Drug release results obtained after dissolution studies showed desirable linear or near linear
release profiles of all three drugs. Table 5.4 contains the respective k values and R2 values
obtained from the release of ATN, ASA and SMV from the optimized TLT formulation.
Release of ATN from the TLT revealed that only half the loaded dose was released after 24
hours in PBS (pH 6.8, 37°C) (Figure 5.6) while the entire loaded dose was released in SGF
(pH 1.2, 37°C). The k values obtained for the release of ATN were 0.0219 in PBS (pH 6.8,
37°C) and 0.0413 in SGF (pH 1.2, 37°C). The R2 values computed were 0.8851 and 0.9983
IN PBS (pH 6.8, 37°C) and SGF respectively.
Table 5.4: Measured responses for the release of therapeutic regimen from optimized TLT formulation (in all cases N = 3).
Drug k values (SGF) ± S.D.
k values (PBS) ± S.D.
R2 values (SGF)
± S.D. R
2 values
(PBS) ± S.D.
ATN 0.0413 ± 0.0036 0.0219 ± 0.0025 0.9983 ± 0.0095 0.8851 ± 0.1074
ASA 0.0423 ± 0.0005 0.0416 ± 0.0000 0.9343 ± 0.0267 0.8966 ± 0.0233
SMV 0.0350 ± 0.0009 0.0363 ± 0.0004 0.9487 ± 0.0059 0.9358 ± 0.0472
In terms of the release of ASA from middle PEO layer, a prolonged linear profile was
obtained as displayed in Figure 5.7. Approximately 80% and 90% of the loaded dose was
released after 24 hours in PBS (pH 6.8, 37°C) and SGF (pH 1.2, 37°C) respectively. The
release of SMV from the s-PLGA outer layer displayed a similar linear extended release over
24 hours as illustrated in Figure 5.8. Near linear release profiles were noted in both SGF (pH
1.2, 37°C) and PBS (pH 6.8, 37°C). The fundamental presence of solid evidence of a
controlled release pattern of the three drugs from the TLT authenticates potential of the TLT
to provide linear or near linear release of a variety of drugs.
Figure 5.6: Drug release profile of ATN from optimized TLT formulation in SGF (pH 1.2, 37°C) and PBS (pH 6.8, 37°C).

89
Figure 5.7: Drug release profile of ASA from optimized TLT formulation in SGF (pH 1.2, 37°C) and PBS (pH 6.8, 37°C).
Figure 5.8: Drug release profile of SMV from optimized TLT formulation in SGF (pH 1.2, 37°C) and PBS (pH 6.8, 37°C).
5.3.6. Comparative in vitro dissolution analysis between the conventional therapeutic
regimen tablets and the release of ATN, ASA and SMV from the optimized TLT
formulation
Comparative results revealed that almost 100% of the drug was released in 0.5 to 1 hour for
all three conventional tablets. Figures 5.9, 5.10 and 5.11 are drug release profiles of
Tenormin® 50, DISPRIN CV®100 and Adco-Simvastatin 40 respectively. The rapid dissolution
and burst release from the conventional tablets further supported the superiority of the TLT in
terms of controlled and sustained release of the treatment regimen.

90
Figure 5.9: Drug release profiles of Tenormin® 50 in SGF (pH 1.2, 37°C) and PBS (pH 6.8, 37°C).
Figure 5.10: Drug release profiles of DISPRIN CV®100 in SGF (pH 1.2, 37°C) and PBS (pH 6.8, 37°C).
Figure 5.11: Drug release profiles of Adco-Simvastatin 40 in SGF (pH 1.2, 37°C) and PBS (pH 6.8, 37°C).

91
5.3.7. Benchtop Magnetic Resonance Imaging analysis of the optimized TLT
formulation
The pattern that was displayed throughout the images at different time points was the
ultimate disappearance of the middle PEO and lower s-PLGA cores due to the progressive
swelling that occurs and the disappearance of the inner core (black area in images) due to
erosion and decreasing intactness of the upper PA6,10 layer in the dissolution medium over
24 hours. A very clear succession is noticed (in Figure 5.12) with the increase in size of the
lower two layers and the slight decrease in length and thickness of the upper layer. Figure
5.12 displays the images of the TLT at various time points during progressive dissolution
study.
At 0.5 hours 6% of ATN was released, subsequently after an hour 8% of ATN was released.
The data retrieved from MRI analysis shows a miniscule decrease in width and thickness of
the outer layer between 0.5 and 1 hour. The change of size is associated with the
disappearance of the core (black) of the PA6,10 layer. After 4 hours it was found that
approximately 16% of ATN was released, this was associated with a marked variation in
thickness of the PA6,10 layer. At 6 hours approximately 20% of ATN was released with a
small change in thickness and width of the PA6,10 layer. At 10 hours, it was found that 26%
of ATN was released with a noticeable decrease in thickness and width of the PA6,10 layer.
After 12 hours, 30% was released with a further slight reduction of the PA6,10 layer. After 24
hours, it was found that almost 50% of ATN was released with a large decrease of substance
of the PA6,10 layer.
At 0.5 hours 8% of ASA was released, which correlated with an increase in swelling and
diameter of the middle PEO layer after 0.5 hours. After 1 hour, 10% of ASA was released
noted with a further increase in diameter of the PEO layer. At 4 hours, almost 30% of ASA
was released which was expected after a large increase in diameter swelling of the PEO
layer. After 6 hours, 38% of ASA was released with a slight change of diameter from 4 hours.
By 12 hours of dissolution time, almost 50% of ASA was released which was associated with
a large increase in swelling and diameter of the PEO layer. At the end of 24 hours, 90% of
ASA was released with a complete disappearance of the drug core and a large increase in
diameter and swelling of the middle PEO layer. The release of SMV from the lower s-
PLGA/PEO layer followed a similar trend to that if ASA, this was also noted with the
same pattern of swelling and increase in diameter of the layer over 24 hours.

92
Figure 5.12: MRI images at specific time points displaying the swelling and erosion characteristics of the TLT during dissolution in PBS (pH 6.8, 37°C).
5.4. Concluding Remarks
The holistic analysis of the optimized TLT formulation generated data that confirms the
robustness of the TLT. Porosity analysis cancelled out the presence of undesirable
micropores after compression. Furthermore the TLT displayed excellent capability for
controlling and prolonging drug release as compared to the conventional antihistamine
tablets selected. The significant application of the cardiovascular treatment regimen to the
TLT articulated the flexibility of the TLT to different drug actives as well as achieving a
significantly desirable release of the selected therapeutic drug regimen. Retrospective
analysis indicates that the TLT may be very beneficial for the positive treatment of chronic
conditions.
0 hours
6 hours 4 hours
1 hour 0.5 hours
10 hours
12 hours 18 hours 24 hours

93
CHAPTER 6
IN VIVO ASSESSMENT OF THE TRIPLE-LAYERED TABLET MATRIX IN THE LARGE
WHITE PIG MODEL
6.1. Introduction
The use of appropriate animal models is undoubtedly an advantageous instrument for the
determination of suitable therapeutic approaches for disease states in humans. In vivo
studies provide useful and relevant information on the biocompatibility of treatment types,
tolerance, drug release behavior and plasma drug levels in a biological environment. Large
white pigs were selected for the in vivo assessment of the triple-layered tablet (TLT)
matrices.
The Large White Pig model is undoubtedly advantageous over other animal models such as
rats and mice for a more authentic validation and correlation of data analysis with human
dosage. One of the major reasons for this, apart from the larger size of the animal, is the
allowance for more frequent blood sampling in pigs than in rats or mice which only allow for
daily blood sampling intervals. With more frequent blood sampling, a further comprehensive
ability to identify and quantify altered or controlled drug release is essentially possible. It has
been established that pigs have a similar gastrointestinal anatomy and physiology to humans
(Oberle et al., 1994; Anderson et al., 2002). Furthermore, pigs are omnivores and their
digestive characteristics would allow for a sufficient analogous comparison to humans.
Another factor is the fact that pigs have been used in cardiovascular research (Crick et al.,
1998) which further confirms the application of such animals to in vivo analysis. The
unequivocal widespread use of the pig model for drug delivery analysis ethically, further
makes the selection of the Large White Pig model for the assessment of the TLT valid. Thus,
this chapter involves the in vivo administration of the conventional drug products and the
optimized TLT matrix formulation containing atenolol (ATN), aspirin (ASA) and simvastatin
(SMV), for the assessment of the performance and tolerability of the TLT in the Large White
Pig model.
6.2. Materials and Methods
6.2.1. Materials
Solvents used for UPLC–MS/MS measurements were of UPLC grade, and all other reagents
were of analytical grade. Double deionized water was obtained from a Milli-Q system, (Milli-
Q, Millipore, Johannesburg, South Africa). Control blank pig plasma was supplied by healthy

94
donors. HPLC grade Acetonitrile (ACN) was purchased from Microsep (Johannesburg, South
Africa). Approval was received from the Animal Ethics Committee for the use of healthy
Large White pigs in the in vivo release study. French gauge double lumen 35cm catheters
(CS-28702) were purchased from Arrow Deutschland GmbH (Erding, Germany). Heparin
vials (5000iu/5mL) and isotonic saline (1L) bags were purchased from Milpark Hospital
Pharmacy (Johannesburg, South Africa). Pre-filters employed in the study were Acrodisc®
13mm 0.2µm filters obtained from Life sciences (Johannesburg, South Africa). A BEH Shield
RP18, 1.7µm, 2.1×100mm column was obtained from Waters Corporation (Milford, MA,
USA).
6.2.2. Methods
6.2.2.1. Habituation of pigs prior to drug administration
Healthy female Large White pigs were employed in the study. Pigs were housed in a farm
unit and maintained under a 12 hour light dark cycle and fed a commercial diet. Figure 6.1 is
a digital photograph showing the farm unit and housing of the pigs and the daily habituation
process. Figure 6.4 displays the number of pigs required for the study. Habituation was
necessary prior to in vivo studies in order to reduce the challenges associated with handling
the animals for administration of formulations and blood sampling. The habituation involved
visiting the animals twice a day and feeding them foods such as nuts and raisins.
Figure 6.1: Farm unit, housing, daily habituation process of feeding and behavioural learning of the Large White Pig model.
6.2.2.2. Surgical implantation of a chronic catheter into the left jugular vein of the pigs
It was established that the most efficient way to sample blood from the pigs was to insert a
catheter into the left jugular vein. The procedure was performed by the chief veterinarian and
the supporting staff of the Central Animal Services (CAS) at the University of the
Witwatersrand. This method was chosen as it caused the least amount of distress to the

95
animal as opposed to the previous blood sampling method which involved drawing of blood
from the marginal ear vein of the pigs. The pigs were anaesthetized and then transported to
the operating room and prepared for surgery. The preparation prior to surgery involved
administering injections of antibiotics and analgesic agents and shaving of the operating site
around the jugular vein. The animals were under anaesthesia and constant oxygen supply
for the duration of the procedure which was performed under aseptic conditions.
Figure 6.2: Digital photographs demonstrating a) Oxygen supply to animal after anaesthetization, b) Monitoring of heart rate, c) administration of injections and d) shaving of operating area.
Figures 6.2a, b, c and d are digital photographs demonstrating the preparation for surgical
procedure involved. In brief, the procedure began with an incision made to the left lateral
aspect of the neck in order to expose the jugular vein. Once the vein was isolated, the
catheter was inserted 10cm into the lumen of the vein. The lumen of the catheter was then
sutured to the wall of the vein ensuring security. The remaining aspect of the catheter was
then placed subcutaneously with the ports exposed via an outlet made around the dorsal
area of the scapula. The wound was subsequently sutured and the ports were fastened with
sutures to the skin. Figure 6.3a is a digital photograph of the 7 French gauge double lumen
35cm catheter to be inserted into the left jugular vein during surgery. Following the procedure
a ten day waiting period was necessary to allow the surgical wound to heal. During the
waiting period, between each dosing of the animals and after each blood sample taken for
the entire duration of the study, the catheters were flushed with 10mL of heparin in saline
(5000i.u./L) twice a day to ensure that the catheters did not become blocked and that ease of
blood sampling was achievable.
b) a)
b) a)
c) d) c)

96
Figure 6.3: a) Catheter to be inserted into jugular vein, b) exposure of jugular vein for insertion, c) insertion of catheter into jugular vein and d) stitching up of wound with ports exposed for blood sampling.
6.2.2.3. Administration of the conventional tablets to the Large White Pig model
The dosing procedure was carried out in conjunction with the animal technicians at the CAS.
The animals were injected with Ketamine HCl (40mg/kg) via the jugular vein catheter for
anaesthetization. Once the animal was under anaesthesia it was moved to an open area and
maintained under anaesthesia by topical procaine HCl (0.5%) and oxygenated. The animal
was then lifted into an upright position and an intragastric tube was inserted via the mouth of
the animal down into the gastric region. The conventional tablets (Tenormin® 50; DISPRIN
CV®100 and Adco-Simvastatin 40) were placed at the end of the tube and flushed down with
a small quantity of water simultaneously. The animal was then laid down and carried to the
pen where it was then closely observed for proper breathing until the anaesthesia wore off
and it was conscious and mobile.
6.2.2.4. Administration of the optimized TLT formulations to the Large White Pig model
The procedure was carried out in the same way as that of the conventional dosage forms
previously after a 3-day washout period allowing for more accurate and uncontaminated
results.
a)
c) d) c)
b)

97
6.2.2.5. Blood sample collection from the jugular vein catheter port of the Large White
Pig model
Blood samples for time point 0 hours were drawn prior to administration of the conventional
dosage forms and TLT formulations to the pigs. Subsequent to administration and allowing
for the anaesthesia to wear off, blood samples (5mL) were drawn from the jugular vein
catheter ports at time intervals of 0; 2; 4; 6; 8; 10; 12; 16; 20 and 24 hours into heparin lined
glass blood vials . Plasma was separated by centrifugation for 15 minutes at 3000rpm and
stored at -70°C until analysis. Figure 6.4 is a schematic diagram depicting the entire in vivo
study sequential that was carried out.
Figure 6.4: Schematic diagram depicting the number of pigs required and the steps involved during the in vivo studies.

98
6.2.2.6. Development of a method for sample analysis employing Ultra Performance
Liquid Chromatography™
Ultra performance liquid chromatography (UPLC) was the technique utilized to determine the
concentration of the model drugs in the plasma retrieved at the different time points. It is a
renowned technique employed for the separation of compounds by means of peak
identification using stationary phase column particles with a size below 2.5µm (Dongre et al.,
2008). The fundamental concept is the running of samples through a column coupled with a
PDA detector for the ultraviolet absorbance of the compounds. The utilization of column
particles that are below 2.5µm results in a betterment of column efficiency. This subsequently
leads to increased resolution of peaks and speedy analysis of samples (Jerkovich et al.,
2003, Krishnaiah et al., 2010).
The Waters Acquity Ultra Performance Liquid Chromatography (UPLC) system (Waters,
Milford, MA, USA) with a PDA detector was utilized in the study. The machine was equipped
with a binary solvent manager that contained three lines (A, B1 and B2) for the flow of mobile
phase solvents. Line A was for the exclusive use of inorganic solvents while lines B1 and B2
were for the exclusive use of organic solvents such as methanol and ACN. Separation was
achieved on an Acquity UPLC C18 column (50×2.1mm, i.d., 1.7µm particle size, Waters). A
method for the simultaneous determination of ATN, ASA and SMV was investigated; this
involved the selection of appropriate mobile phases, flow rate, wavelength and injection
volume.
After a series of attempts a suitable method to separate all three of the drugs was achieved.
The mobile phases employed were 0.01%v/v orthophosphoric acid (OPA) and acetonitrile
(ACN). An isocratic method with the ratio of 65:35 (OPA: ACN) proved to be the most
adequate at separating the drugs. Table 6.1 displays the separation method selected for the
three drugs. Diphenhydramine (DPH) was selected as the internal standard for quantification.
Mobile phases were prepared and filtered through 0.22µm Millipore filters and placed on the
machine with the appropriate solvent flow lines placed in the two mobile phases. The initial
step to UPLC analysis is priming the machine which includes washing of the pumps and
lines. Two types of washing occurred, a weak wash (90%V/V de-ionized water and 10%V/V
ACN) and a strong wash (10%V/V de-ionized water and 90%V/V ACN). Once the priming
process is complete (2 cycles of 10 minutes each), the column must be equilibrated to the
selected separation method, this constitutes loading the method on to the software and
allowing the mobile phases to flow through the column while the environment of the column
is changed according to the method.
Table 6.1: Method parameters for the simultaneous determination of ATN, ASA and SMV.

99
Parameter Condition
Mobile Phase 0.01% OPA and ACN (65:35) isocratic gradient Flow rate 0.5mL/min
Injection volume 5µL Wavelength 210nm
Column Temperature 40°C
6.2.2.7. Selection of a suitable method for extraction of ATN, ASA and SMV from
plasma for UPLC analysis
After various attempts at solid phase extraction (SPE) and liquid-liquid extraction for the
adequate extraction of all three drugs from the plasma, SPE proved to be the least feasible
option as it did not provide an adequately measurable result. As a result, the more optimal
liquid-liquid extraction was further investigated. Liquid-liquid extraction involves the
separation of different compounds according to their different affinities to solvents. The basic
principle is the addition of a liquid solvent to another liquid solution containing the compound
requiring separation (Muller et al., 2008). During method development, blank plasma was
spiked with the three drugs and IS. The method that was developed involved the addition of
ACN to plasma and subsequent centrifugation (Optima® LE-80K, Beckman, USA) and
reconstitution. ACN was employed due to its effective deproteinating capability and the high
solubility of all four drugs in ACN. Figure 6.5 is a schematic describing the sequential
process of liquid-liquid extraction of ATN, ASA, SMV and DPH.
Figure 6.5: Schematic diagram depicting the sequential process the liquid-liquid extraction procedure selected for the extraction of ATN, ASA and SMV from plasma.

100
6.2.2.8. Preparation of calibration curves and limit of quantification for ATN, ASA and
SMV in plasma
A standard stock solution (A) of 1mg/mL ATN, ASA and SMV was prepared. A second stock
solution (B) of 0.1mg/mL was prepared from A. A micropipette was used to spike the blank
plasma with specific quantities of ATN, ASA and SMV for calibration. A standard
concentration of DPH was added to the different calibration samples followed by the
extraction procedure described in Chapter 6, section 6.2.2.7. UPLC analysis was
subsequently performed.
6.2.2.9. UPLC analysis of drug release after the in vivo administration of Tenormin®,
Adco-Simvastatin 40 and Disprin CV® and the optimized TLT formulation
Once the suitable UPLC separation and plasma extraction procedures were optimized and
subsequent to the preparation of calibration curves for the three drugs, it was necessary and
feasible to run the plasma samples obtained from the in vivo animal study. The samples
were prepared by spiking 500µL of plasma from each time point with a known concentration
of IS and performing the extraction procedure mentioned in Chapter 6, section 6.2.2.7. Once
the samples were prepared they were filtered in to ANSI482mL UPLC vials for analysis.
UPLC analysis was carried out according to the UPLC separation method selected and
mentioned in Chapter 6, section 6.2.2.6.
6.3. Results and Discussion
6.3.1. Behavior of pigs after insertion of a jugular vein catheter and after
administration of the optimized TLT formulation
On the actual day of the surgical procedure where the catheters were inserted in to the
jugular vein of the pigs, the pigs displayed no changes in behavior from prior to the surgical
procedure. Subsequent to the wearing off of anaesthesia the animals displayed the usual
levels of activity and appetite as previously experienced. The quantity of time required for
them to get back on their feet and walk around was not lengthy. The blood sampling
procedure was not complex or time consuming, further proving the feasibility of the use of the
catheter. The administration of the TLT showed no adverse effects to the pig substantiating
the biocompatibility of the system orally. The pigs displayed normal behavior in terms of
activity and appetite, blood sampling after administration of the TLT was normal as well.
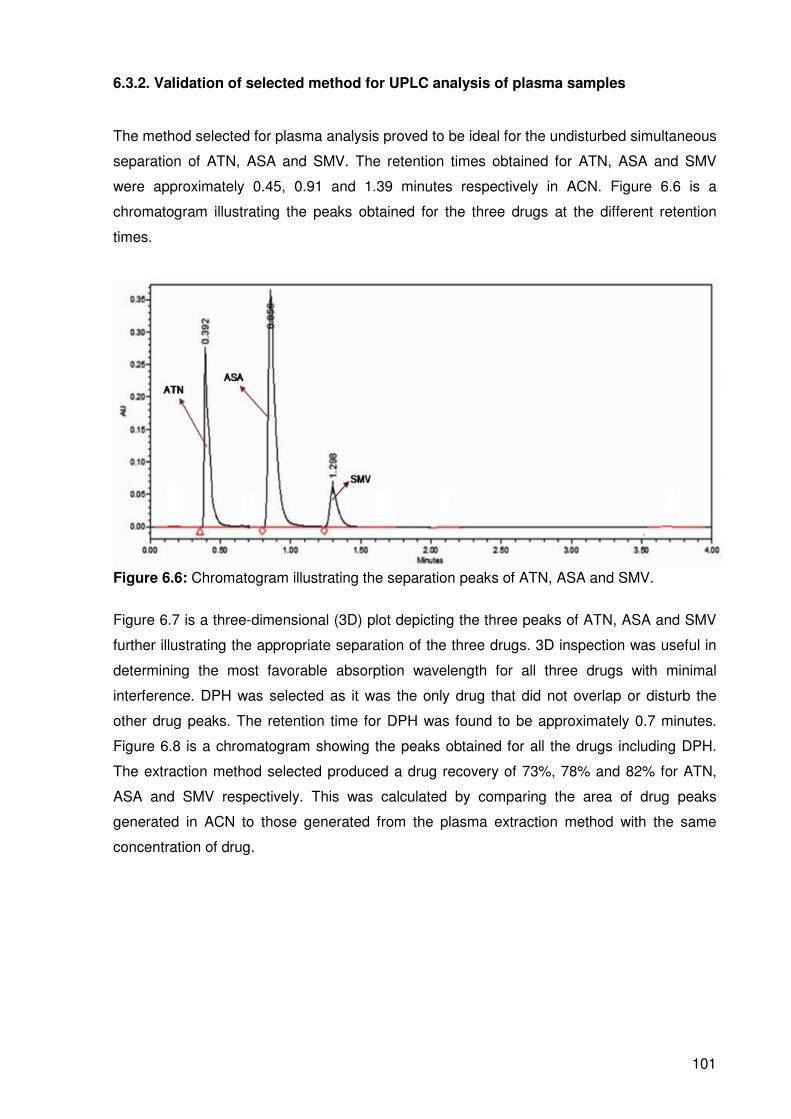
101
6.3.2. Validation of selected method for UPLC analysis of plasma samples
The method selected for plasma analysis proved to be ideal for the undisturbed simultaneous
separation of ATN, ASA and SMV. The retention times obtained for ATN, ASA and SMV
were approximately 0.45, 0.91 and 1.39 minutes respectively in ACN. Figure 6.6 is a
chromatogram illustrating the peaks obtained for the three drugs at the different retention
times.
Figure 6.6: Chromatogram illustrating the separation peaks of ATN, ASA and SMV.
Figure 6.7 is a three-dimensional (3D) plot depicting the three peaks of ATN, ASA and SMV
further illustrating the appropriate separation of the three drugs. 3D inspection was useful in
determining the most favorable absorption wavelength for all three drugs with minimal
interference. DPH was selected as it was the only drug that did not overlap or disturb the
other drug peaks. The retention time for DPH was found to be approximately 0.7 minutes.
Figure 6.8 is a chromatogram showing the peaks obtained for all the drugs including DPH.
The extraction method selected produced a drug recovery of 73%, 78% and 82% for ATN,
ASA and SMV respectively. This was calculated by comparing the area of drug peaks
generated in ACN to those generated from the plasma extraction method with the same
concentration of drug.

102
Figure 6.7: 3D chromatogram of ATN, ASA and SMV.
Figure 6.8: Chromatogram illustrating the separation peaks of ATN, ASA and SMV with DPH as the internal standard.
6.3.3. Liquid-liquid extraction and assessment of UPLC chromatographic separation
method in plasma
Subsequent to the elucidation of the feasibility of the separation technique in ACN, it was
then investigated for the separation of the drugs in plasma. A sample was prepared by
spiking blank plasma with ATN, ASA, SMV and DPH. This mixture was then vortexed to
allow for drug binding to the plasma. The extraction procedure described previously was then
followed and the sample was injected for UPLC analysis. After UPLC analysis, it was
observed that the process proved to be adequate in providing separate peaks of all four
drugs with slightly shifted retention times. Figure 6.9 is a chromatogram displaying the four
drug peaks after plasma extraction.

103
Figure 6.9: Chromatogram displaying the separation peaks of ATN, ASA, SMV and DPH as the internal standard after plasma extraction.
6.3.4. Calibration curves prepared for the quantitative analysis of ATN, ASA and SMV
in plasma
Figures 6.10a, b and c are the calibration curves obtained in plasma for ATN, ASA and SMV
respectively. The calibration ranges selected were 0-50000ng/mL for all three drugs.
Figure 6.10: a) ATN calibration curve in plasma; b) ASA calibration curve in plasma and c) SMV calibration curve in plasma.
b)
c)
a)
y=0.0005x R2=0.992
y=0.0007x R2=0.996
y=0.00005x R2=0.997
DPH
ATN
ASA
SMV
104
6.3.5. Assessment of in vivo drug release from Tenormin® 50; DISPRIN CV®100 and
Adco-Simvastatin 40
The ultimate aim of the in vivo study was to develop a comparison in drug release behavior
between the conventional dosage forms and the optimized TLT formulation. An adequate
comparison was necessary in vivo following the confirmation of a superior release from the
TLT in vitro. Figure 6.11a, b and c contains the drug release profiles of Tenormin® 50;
DISPRIN CV®100 and Adco-Simvastatin 40 respectively in plasma. For Tenormin® 50 it was
noted that there was an initial significant ascension of plasma concentration after 2 hours,
with peak plasma concentrations (Cmax= 816ng/mL) being reached at approximately 4 hours.
This was followed by a swift reduction of plasma concentration for a further 8 hours.
With DISPRIN CV®100, a similar trend was observed with an increase of plasma
concentration until a Cmax of 2439ng/mL was reached at 8 hours followed by a steady
descent of plasma concentration. The Adco-Simvastatin 40 release profile displayed much
more miniscule plasma concentrations as compared to those of the previous two
conventional tablets. The Cmax of 13.5ng/mL was reached at 6 hours after administration.
Thus it can be confirmed that for all three conventional tablets, most of the drug was
released by an initial burst before 8 hours after administration. This may due to the lack of
controlling mechanisms present in the conventional tablets which are compressed powders
of the drugs in question coupled with formulation excipients. Although large standard
deviations were noticed, the pattern of drug release was found to be consistent.

105
Figure 6.11: Plasma drug concentration profile depicting the release behavior over 24 hours of a) Tenormin® 50; b) DISPRIN CV®100 and c) Adco-Simvastatin 40 (N=5).
a)
b)
c)
Tenormin®50
DISPRIN CV®100
Adco-Simvastatin 40

106
6.3.6. Assessment of in vivo drug release from the optimized TLT formulation
The stark comparative difference in drug release profiles between the conventional tablets
and the optimized TLT formulation was immediately noted as illustrated in Figures 6.12a, b
and c. With ATN, a gradual release of drug was noted at the onset. This steady increase in
plasma concentration reached a Cmax of 4443ng/mL after 2 hours. The plasma levels
subsequently decreased at the end of 24 hours. For ASA, a Cmax of 4195ng/mL was reached
only at 24 hours, which was preceded by a steady increase in plasma concentration.
A similar pattern was observed with SMV, Cmax (21ng/mL) was reached only 20 hours after
administration. The very low therapeutic levels of the drugs that were reached may be due to
the in vivo absorption and distribution characteristics of the drugs. According to literature,
simvastatin has an overall low systemic oral bioavailaility (Bellosta et al., 2004) which is
confirmable with the low Cmax of SMV that was obtained. Also, depending on the storage of
the plasma that was collected, slight degradation of drug may have occurred even though
temperature storage of -70°C was maintained.
A prolonged release over a minimum 12 hours was achieved with all three drugs indicating a
significant improvement on controlling plasma levels of each drug. The vast variance of TLT
release profiles to that of the conventional tablets further authenticates the in vitro results
obtained.

107
Figure 6.12: Comparative plasma drug concentration profiles of optimized TLT versus conventional tablets depicting drug release behavior over 24 hours of a) ATN versus Tenormin®50 ; b) ASA versus DISPRIN CV® and c) SMV versus Adco-simvastatin 40 (N=5).
a)
b)
c)
Tenormin® 50
TLT
DISPRIN CV®100 TLT
TLT
Adco-simvastatin 40

108
6.4. Concluding Remarks
The aim of the in vivo study was to assess the drug release capability of the TLT in
comparison to the conventional tablets Tenormin® 50; DISPRIN CV®100 and Adco-
Simvastatin 40. The pig proved to be a feasible model for the study with the insertion of
jugular vein catheters greatly improving the efficiency of the study. After completing the study
and UPLC analysis of data, it was confirmed that the TLT formulation did in fact display a
largely superior release profile in terms of sustained and controlled drug release to that of the
conventional tablets. The TLT also displayed a lack of sharp plasma concentration
fluctuations as compared to the conventional tablets. Although the release profile was less
than desirable in comparison to in vitro study results, which may be attributed to first pass
metabolism and erratic absorption of the drugs from the gastrointestinal tract, the TLT
showed capability in controlling the plasma concentrations of the drugs. Further research
may focus on developing more accurate analysis methods that may better qualify the TLT in
vivo.
109
CHAPTER 7
CONCLUSIONS AND RECOMMENDATIONS
7.1. Conclusions
It is evident that new developments allowing for improved and cheaper treatment outcomes
are essential in terms of modern healthcare. Seeing as though it is becoming increasingly
difficult and expensive to develop novel drug molecules (Wen and Park, 2010), more
prominence is being given to developing novel ways of delivering existing drugs. Due to the
reality that pharmaceutical companies are faced with increasing challenges as a result of the
higher cost of starting up product lines and decreased market shares (Lee, 2007), there is a
decreased accomplishment of developing novel pharmaceutical drug actives. Therefore,
developing advanced drug delivery technologies may allow for the extension of the use of
existing pharmaceutical drug actives. The requirement of these novel pharmaceutical
concepts is due to the prominent therapeutic failures that occur as a result of non compliance
of the patient to multiple drug treatment regimens. The possible motives of non compliance
have been elucidated to be pill burden and dose-dependent side-effects that occur with
various multi-drug treatment regimens. Difficulty comprehending drug administration
instructions also plays a role in failed therapeutic results especially with complex drug
regimens that require a variety of tablets to be taken at various time intervals per day. As a
result of these short comings, health resources are wasted leading to economic
consequences. For example non-compliance with cardiovascular and antidiabetic medication
is a sizeable problem.
Furthermore, the management of numerous infectious diseases such as Tuberculosis and
HIV/AIDS is still limited due to poor treatment compliance (Munro et al., 2007), this adds to
the disease burden worldwide. The discovery and establishment of novel drug delivery
systems that work effectively and efficiently to reduce dose dependent side-effects and pill
burden is yet to be adequately fulfilled.
The crucial ambition of this research was to develop an oral triple-layered tablet system for
the controlled zero-order delivery of any suitable therapeutic regimen, which is equipped to
hold up to three drug actives with the focal-point honing in on the improvement of patient
compliance and reduction of the occurrence of dose-dependent side-effects. The
administration of one tablet once per day is understandably easier to comprehend by the
patient than three tablets three times a day. The novelty of the proposal lies in the linear
release of three different drugs from one TLT. This allowed for a constant amount of drug
entering the blood stream reducing dose-dependent side-effects.

110
In vitro studies involved preliminary experimentation whereby novel polymers were
synthesized and employed as drug matrices. TLT formulations were subjected to extensive
in vitro release studies to assess the capability of providing zero-order release of all three
water-soluble drugs. BHN as a measure of matrix hardness was another essential factor in
determining the robustness of the TLT.
The Box-Behnken design was utilized in the TLT optimization process which focused on the
drug release characteristics. Rate constants (k values) and correlation coefficients (R2
values) were employed as the measured responses for 17 formulations. A solitary
formulation was selected as the optimized formulation and the release profile of the three
drugs were corroborated.
In addition, a novel drug regimen that comprised atenolol (50mg), simvastatin (40mg) and
aspirin (100mg) was applied to the optimized TLT; in vitro drug release of this regimen was
also assessed to determine the flexibility of the TLT to provide zero-order release of a
cardiovascular therapeutic drug combination.
Furthermore, in vivo studies were performed on the optimized TLT. The TLT was
administered to pigs and drug-release profiles were generated according to the concentration
of drugs in plasma at predetermined time intervals. Results from in vivo studies showed a
definite difference of plasma profiles between conventional tablets Tenormin®, DISPRIN CV®
and Adco-simvastatin 40 and the optimized TLT formulation. The release was markedly
noted to be more controlled and provided near zero-order to zero-order release. Thus, the
TLT provided some degree of sustained and controlled release of the therapeutic regimen.
The TLT developed in the study showed flexibility in providing zero-order release of different
drugs. Although a cardiovascular regimen was employed, the TLT is not limited to this. It may
be applied to the delivery of various and appropriate disease treatment regimens. The oral
administration of the TLT may therefore reduce the pill burden and dose-dependent side-
effects of different treatment regimens.
7.2. Recommendations
With oral drug delivery being the least invasive mode of therapy, it can be concluded that
more comprehensive research should be conducted to develop more efficient and applicable
oral drug delivery systems utilizing existing drugs. Improved and dynamic drug delivery
systems may prove to have a significant positive effect on patient therapeutic outcomes. The
synthesis of “smart” polymers as drug matrices could be further analyzed and optimized to

111
decrease research time while increasing efficiency. The application of a gastro-retentive
aspect to the TLT may prove to be advantageous for controlled release of Narrow Absorption
Window drugs. This may also pose an advantage in providing controlled release of drugs for
an extended period greater than 24 hours.
Although the in vivo animal study model proved to be efficient, it may be limited in the results
that are computed from it. The reason for this may be the altered behavior of the TLT in a pig
model according to a specific diet. Also, the molecular absorption of drug molecules from the
gastrointestinal tract into plasma may need to be adequately investigated which is difficult in
such a setting. Further emphasis should therefore be given to comprehensive in vivo
analysis. Research should aim to develop modern techniques that allow for uncomplicated
administration with minimal to no distress to the animals. Analytical techniques to best
identify in vivo pharmacokinetic behavior and imaging may also be investigated and
improved.

112
REFERENCES
Abdul, S., Poddar, S.S., 2004. A flexible technology for modified release of drugs:multi
layered tablets, Journal of Controlled Release, 97, 393-405.
Anderson, D.L Bartholomeusz, F.D., Kirkwood,I.D., Chatterton, B.E., Summersides, G.,
Penglis, S., Kuchel, T., Sansom, L., 2002. Liquid Gastric Emptying in the Pig: Effect of
Concentration of Inhaled Isoflurane, The Journal of Nuclear Medicine, 43(7), 968-971.
Andjelić, S.; Yuan, J.; Jamiolkowski, D.D.; Diluccio, R.; Bezwada, R.; Zhang, H.;Mijovic, J.,
2006. Hydrophilic absorbable copolyester exhibiting zero-order drug release. Pharmaceutical
Research, 23, 821-834.
Apu A.S.; Pathan, A.H.; Shrestha, D.; Kibria G.; Jalil, R., 2009. Investigation of in.vitro
release kinetics of carbamazepine from Eudragit RS PO and RL PO matrix tablets, Tropical
Journal of Pharmaceutical Research, 145-152.
Ayres J.W., 2004. Coated, Platform generating tablet, US Patent, 6 720 005.
Ayres, J.W., 2004. Coated, platform-generating tablet, US Patent, 6 733 784.
Barakat, N.S.; Elbagory, I.M.; Almurshedi, A.S., 2009. Controlled-release carbamazepine
matrix granules and tablets comprising lipophilic and hydrophilic components. Drug Delivery,
16, 57–65.
Barringer L.F., Ledford W.T., 1993. Polymers having enhanced hydrophilicity and thermal
regulated properties and process of producing the same, (WO/1993/025749).
Bellosta, S., 2004. Safety of Statins, focus on clinical pharmacokinetics and drug
interactions, Circulation, 109, 50-57.
Bernkop-Schnürch A., 2005. Mucoadhesive systems in oral drug delivery, Drug Discovery
Today, 2, 83-87.
Bronzino J.D., 2000. The biomedical engineering handbook, CRC Press, ISBN 084930461X,
9780849304613, 39-10.

113
Brooke, D.; Walshkuhn, R.J., 1977. Zero-order drug delivery system: Theory and preliminary
testing, Journal of Pharmaceutical Sciences, 66, 159-162.
Cao, X.; Lai, S.; Lee, L.J., 2001. Design of a self-regulated drug delivery device, Biomedical
Microdevices, 3, 109-118.
Cheng, K.; Zhu, J.; Song, X.; Sun, L.; Junhong, Z., 1999. Studies of
hydroxypropylmethylcellulose donut-shaped tablets, Drug Development and Industrial
Pharmacy, 25, 1067-1071.
Cheng, P.; Chen, M.; Udipi, K., 2010. Dry diazeniumdiolation methods for producing nitric
oxide releasing medical devices. US Patent Application, 20100159119.
Chidambaram, N.; Porter, W.; Flood, K.; Qui, Y., 1998. Formulation and characterisation of
new layered diffusional matrices for zero-order sustained release. Journal of Controlled
Release, 52, 149-158.
Chien, T.W., 1982. Fundamentals of controlled-release drug administration. In Novel Drug
Delivery Systems; Swarbrick, J., Ed.; Marcel Dekker Inc: New York, USA, 465–574.
Chopra, S.K., 2002. Drug Delivery Systems Based on Geometric Configuration. In Modified-
Release Drug Delivery Technology; Rathbone, M.J., Hadgraft, J., Roberts, M.S., Eds.;
Marcel Dekker: New York, USA, 35–48. DOI: 10.1201/9780203910337.
Chopra, S.K., 2002. Drug Delivery Systems Based on Geometric Configuration. In Modified-
Release Drug Delivery Technology; Rathbone, M.J., Hadgraft, J., Roberts, M.S., Eds.;
Marcel Dekker: New York, USA, 35–48. DOI: 10.1201/9780203910337.ch4.
Chopra, S., Motwani, S.K., Iqbal, Z., Talegaonkar, S., Ahmad, F.J., Khar, R.K., 2007.
Optimisation of polyherbal gels for vaginal drug delivery by Box-Behnken statistical design.
European Journal of Pharmaceutics and Biopharmaceutics, 67, 120-131.
Cleave, J.P., 1965. Some geometrical considerations concerning the design of tablets.
Journal of Pharmacy and Pharmacology, 17, 698-702.
Cobby, J.; Mayersohn, M.; Walker, G.C., 1974. Influence of shape factors on kinetics of drug
release from matrix tablets I: Theoretical. Journal of Pharmaceutical Scences, 63, 725–732.

114
Colombo, P., 1993. Swelling-controlled Release in Hydrogel Matrices for Oral Route,
Advanced Drug Delivery Reviews, 11(1–2), 37–57.
Colombo, P.; La Manna, A.; Conte, U., 1989. System for the controlled-rate release of active
substances, US Patent, 4839177.
Colombo, P.; Sonvic, G.; Colombo, G.; Bettini, R., 2009. Novel platforms for oral drug
delivery, Pharmaceutical Research, 26(3), 601-610.
Conte U, Maggi L., Colombo P, Manna L., 2005. Multilayered hydrophilic matrices as
constant release devices, Journal of Controlled release, 26, 39-47.
Conte, U.; Maggi, L., 2000. A flexible technology for the linear, pulsatile and delayed release
of drugs allowing for easy accommodation of difficult in vitro targets, Journal of Controlled
Release, 64, 263-268.
Conti, S.; Maggi, L.; Segale, L.; Ochoa Machiste, E.; Conte, U.; Grenier, P.; Vergnault G.,
2007. Matrices containing NaCMC and HPMC: 2. Swelling and release mechanism study,
International Journal of Pharmaceutics, 333, 143-151.
Corrigan, O.I., Li, X., 2009. Quantifying drug release from PLGA nanoparticulates, European
Journal of Pharmaceutical Sciences, 37, 477-485.
Crick, S.J., Sheppard, M.N, Ho, S.Y., Gebstein, L., Anderson, R.H., 1998. Anatomy of the pig
heart: comparisons with normal human cardiac structure, Journal of Anatomy, 193, 105-119.
Crotts, G.; Park, T.G., 1995. Preparation of porous and nonporous biodegradable polymeric
hollow microspheres, Journal of Controlled Release, 35, 91-105.
Danckwerts, M.P., 1994. Development of a zero-order release oral compressed tablet with
potential for commercial tabletting production, International Journal of Pharmaceutics, 112,
37-45.
Dash, A.K., Cudworthll, G.C., 1998. Therapeutic applications of implantable drug delivery
systems, Journal of Pharmacological and toxicological methods, 40 (1), 1-12.

115
Dash, S.; Murthy, P.N.; Nath, L.; Chowdhury, P., 2010. Kinetic modeling on drug release
from controlled drug delivery systems. Acta Poloniae Pharmaceutica Drug Research, 67,
217-223.
Davidson III, G.W.R. and Peppas, N.A. 1986. Relaxation-Controlled Transport in P(HEMA-
co-MMA) Copolymers, Journal of Controlled Release, 3, 243–258.
Desai, S., 1996. Multilayer Controlled Release Tablets Containing both naproxen and
naproxen sodium salt, Euopean Patent, 0656776.
Deshpande, A.A.; Rhodes, C.T.; Shah, N.S.; Malick, A.W., 1996. Controlled-release drug
delivery systems for prolonged gastric residence: An overview, Drug Development and
Industrial Pharmacy, 22, 531-539.
Dongre, V.G., Karmuse, P.P., Rao, P.P., Kumar, A., 2008. Development and validation of
UPLC method for determination of primaquine phosphate and its impurities, Journal of
Pharmaceutical and Biomedical Analysis, 46(2), 236-242.
Doshi, M.M.; Joshi, M.D.; Mehta, B.P., 2007. Pharmaceutical composition for controlled drug
delivery system, US Patent, 7 157 100.
Efentakis M, Politis S., 2006. Comparative evaluation of various structures in polymer
controlled drug delivery systems and the effect of their morphology and characteristics on
drug release, European Polymer Journal, 42, 1183-1195.
Efentakis, M.; Peponaki, C., 2008. Formulation study and evaluation of matrix and three-
layer tablet sustained drug delivery systems based on carbopols with isosorbide mononitrate.
AAPS PharmSci, 9, 917-923.
Elan drug technologies, 2010. Spheroidal drug absorption system (SODAS®).
http://www.elandrugtechnologies.com/oral_controlled_release/sodas [accessed August 26,
2010].
Faour, J.; Mayorga, J., 2006. Multi-layered osmotic device. US Reissued Patent, RE39069.
Fassihi, R.; Yang, L., 1998. Controlled release drug delivery system. US Patent, 5 783 212.
Ferreira, S.L.C., Bruns, R.E., Ferreira, H.S., Matos, G.D., David, J.M., Brandão, G.C., da
Silva, E.G.P., Portugal, L.A., dos Reis, P.S., Souza, A.S., dos Santos, W.N.L., 2007. Box-

116
Behnken design: An alternative for the optimization of analytical methods. Analytica Chimica
Acta, 597, 179-186.
Flanner, H.H.; Mcknight, L.C.; Burnside, B.A., 2005. System for osmotic delivery of
pharmaceutically active agents, US Patent, 6838093.
Ford, J.L.; Rubenstein, M.H.; McCaul, F.; Hogan, J.E.; Edgar, P.J., 1987. Importance of drug
type, tablet shape and added diluents on drug release kinetics from
hydroxypropylmethylcellulose matrix tablets, International Journal of Pharmaceutics, 40, 233-
234.
Frolov, S.V., Artemov, A.V. and Kiryukhin, S.M., 1999. Properties of polyamide fibres
treated with Aqueous solutions of metal salts, Fibre Chemistry, 31, 95-98.
Fukui, J.; Uemura, K.; Kobayashi, M., Studies on applicability of press-coated tablets using
hydroxypropylcellulose (HPC) in the outer shell for timed-release preparations, Journal of
Controlled Release, 68, 215-223.
Gallardo, A.; Rodríguez, G.; Aguilar, M.R.; Fernández, M.; San Román, J., 2003. A Kinetic
model to explain the zero-order release of drugs from ionic polymeric drug conjugates:
Application to AMPS−Triflusal-Derived polymeric drugs, Macromolecules, 36, 8876–8880.
Garcia-Encina, D., Torres, B., Seijo, Vila Jato J.L., 1993. In vivo evaluation of nylon-coated
diclofenac-resin complexes, Journal of Controlled Release, 23, 201–207.
Ghosh, T., Ghosh, A., 2011. Drug delivery through osmotic systems-an overview. Journal of
Applied Pharmaceutical Science, 2011, 1(2), 38-49.
Gohel, M.C.; Nagori, S.A., 2009. A novel colonic drug delivery system of ibuprofen. Asian
Journal of Pharmaceutics, 3, 233-239.
Green, P.G., 1996. Iontophoretic delivery of peptide drugs, Journal of Controlled Release,
41, 33-48.
Guimarães, G.G.; Katsuki, G.I.; Zanardo, N.D.; Ribeiro, D.A.; Cavalcanti, O.A., 2008.
Evaluation of pectin-HPMC as compression coating. I - A study of the swelling properties of
coated tablet, Revista Brasiliera Ciencias Farmaceuticas, 44, 133-141.

117
Guo J.H., Carbopol polymers for pharmaceutical drug delivery applications, Drug Delivery
Technology. Retrieved 15 February 2008, http://www.drugdeliverytech.com/cgi-
bin/articles.cgi
Gupta, A., Saquing, C.D., Afshari, M., Tonelli, A.E., Khan S.A. and Kotek, R., 2009. Porous
nylon-6 fibers via a novel salt-induced electrospinning method, Macromolecules, 42, 709-
715.
Hardy, I.J.; Windberg-Baarup, A.; Neri, C.; Byway, P.V.; Booth, S.W.; Fitzpatrick, S., 2007.
Modulation of drug release kinetics from hydroxypropyl methyl cellulose matrix tablets using
polyvinyl pyrrolidone, International Journal of Pharmaceutics, 337, 246-253.
Harland, R.S.; Gazzaniga, A.; Sangalli, M.E.; Colombo, P.; Peppas, N.A., 1998.
Drug/polymer matrix swelling and dissolution, Pharmaceutical Research, 5, 488-494.
Heller, J.; Pangburn, S.H.; Penhale, D.W.H., 1987. Use of bioerodible polymers in self-
regulated drug delivery systems, In Controlled-Release Technology, Pharmaceutical
Applications; Lee, P.I., Good, W.R., Eds.; ACS Symposium Series: Washington DC, USA,
172–187.
Herrlich, S.; Ziolek, S.; Hoefemann, H.; Zengerle, R.; Haeberle, S., 2009. Adjustable diffusion
barrier for controlled drug release in spastic and pain therapy, In: 4th European conference of
the international federation of medical and biological engineering, 22, 2368-2371.
Hongtao, L.; Xiaochen, G.U., 2007. Correlation between drug dissolution and polymer
hydration: A study using texture analysis, International Journal of Pharmaceutics, 342, 18-25.
Hsieh, D.S.T.; Rhine W.D.; Langer, R., 1983. Zero-order controlled release polymer matrices
for micro and macromolecules, Journal of Pharmaceutical Sciences, 72, 17–22.
IntelGelx Corp., 2009. Innovative Drug Delivery Solutions.
http://www.intelgenx.com/_assets/pdf/Rodman-Renshaw-Sept-2009.pdf [accessed August
26, 2010].
Iyer, K.; Jha, R.J.; Saoji, D.G., 2006. Cardiovascular therapeutic combinations, WIPO Patent
Application, WO/2006/085128.
Jerkovich, A.D.; Mellors, J.S.; Jorgensen, J.W., 2003. The use of micrometer-sized particles
in ultrahigh pressure liquid chromatography, LC-GC North America, 21, 600-610.

118
Karnachi, A.A., Khan, M.A., 1996. Box-Behnken design for the optimization of formulation
variables of indomethacin coprecipitates with polymer mixtures, International Journal of
Pharmaceutics, 131 (1), 9-17.
Kaushal, A.M., Garg, S., 2003. An update on osmotic drug delivery patents, Pharmaceutical
Technology, 38-97.Kim, C.J., 1995. Compressed donut-shaped tablets with zero-order
release kinetics. Pharmaceutical Research, 12, 1045–1048.
Kim, C.J., 1999. Release kinetics of coated, donut-shaped tablets for water soluble drugs,
European Journal of Pharmaceutical Sciences, 12, 237-242.
Kim, C.J., 2000. Coated tablet with long term parabolic and zero-order release kinetics, US
Patent, 6110500.
Kim, C.J., 2005. Controlled release from triple layer, donut-shaped tablets with enteric
polymers, AAPS PharmSci, 6, 429-436.
Kim, S.W.; Jun, S.S.; Jo, Y.G.; Koo, J.S.; Jun, Y.S., 2008. Combination formulation with
controlled release comprising metformin and glimepiride, WIPO Patent Application,
WO/2008/050987.
Kohan M. I., 1999. Polymer Data Handbook. Oxford University Press Inc, Oxford.
Kohlrausch A., 2005. Multilayer tablet patent, US Patent, 20050186274.
Kolawole O.A., Pillay V., Choonara Y.E., 2007. Novel polyamide 6, 10 variants synthesised
by modified interfacial polymerization for application as a rate-modulated monolithic drug
delivery system, Journal of Bioactive and Compatible Polymers, 22, 218-313.
Krishnaiah, C.H., Reddy, R., Kumar, R., Mukkanti, K., 2010. Stability-indicating UPLC
method for determination of Valsartan and their degradation products in active
pharmaceutical ingredient and pharmaceutical dosage forms, Journal of Pharmaceutical and
Biomedical Analysis, 53(3), 483-489.

119
Krishnaiah, Y.S.R.; Karthikeyan, R.S.; Gouri Sankar, V.; Satyanarayana, V., 2002. Three-
layer guar gum matrix tablet formulations for oral controlled delivery of highly soluble
trimetazidine dihydrochloride, Journal of Controlled Release, 81, 45-56.
Kydonieus A.F., 1991. Treatise on controlled drug delivery: fundamentals, optimization,
applications, Informa Healthcare, Eds: Marcel Dekker: New York, USA.
Landgraf W, Li N.H, Benson J.R., 2005. New polymer enables near zero order release of
drugs, Drug Delivery Technology, 5(2), 48-55.
Learoyd, T.P.; Burrows, J. L.; French, E.; Seville, P.C., 2009. Sustained delivery by leucine-
modified chitosan spray-dried respirable powders, International Journal of Pharmaceutics,
372, 97-104.
Lee, P.I., 1985. Kinetics of drug release from the hydrogel matrices, Journal of Controlled
Release, 2, 277-288.
Lee, R.J., 2008. Modern drug discovery and development-GTCbio’s Third Annual Summit
conferene report, IDRUGS, 11, 101-104.
Lewis G., 2001. Properties of crosslinked ultra-high-molecular-weight polyethylene,
Biomaterials, 22, 371-401.
Li, H.; Hardy, R.J.; Gu, X., 2008. Effect of drug solubility on polymer hydration and drug
dissolution from polyethylene oxide (PEO) matrix tablets, AAPS PharmSci, 9, 437-443.
Lingam, M.; Ashok, T.; Venkateswarlu V; Rao Y.M., 2006. Design and evaluation of a novel
matrix type multiple units as biphasic gastroretentive drug delivery systems, AAPS
PharmSci, 9, 1253-1261.
Liu, Q.; Fassihi, R., 2008. Zero-order delivery of a highly soluble, low dose drug alfuzosin
hydrochloride via gastro-retentive system, International Journal of Pharmaceutics, 348, 27–
34.
Longxiao, L..; Xiangning, X., 2008. Preparation of bilayer-core osmotic pump tablet by
coating the indented core tablet, International Journal of Pharmaceutics, 352, 225-239.

120
Longxiao, L.; Binjie, C., 2006. Preparation of monolithic osmotic pump system by coating the
indented core tablet, European Journal of Pharmaceutics and Biopharmaceutics, 64, 180-
184.
Lopes C.M., Lobo J.M.S., Pinto J.F., Costa P., 2006. Compressed mini-tablet as a biphasic
delivery system, International Journal of Pharmaceutics, 303, 93-100.
Losi, E.; Bettini, R.; Santi, P.; Sonvico, F.; Colombo, G.; Lofthus, K.; Colombo, P.; Peppas,
N.A., 2006. Assemblage of novel release modules for the development of adaptable drug
delivery systems, Journal of Controlled Release, 111, 212-218.
Maggi, L.; Shepard, T.; Rochdi, M.; Grenier, P.; Halbeisen, S.; Zimmer, R.; Conte, U. ,1997.
A simulation approach for efficient development of a naproxen Geomatrix Quick/Slow
formulation. In: Proceedings of the 24th International Symposium on Controlled Release of
Bioactive Materials, Stockholm, Sweden, 327–328.
Martin del Valle, E.M.; Galan, M.A.; Carbonell, R.G., 2009. Drug delivery technologies: The
way forward in the new decade, Industrial and Engineering Chemistry Research, 48, 2475–
2486.
Mittal, G., Sahana, D.K., Bhardwaj, V., Ravi Kumar, M.N.V., 2007. Estradiol loaded PLGA
nanoparticles for oral administration: Effect of polymer molecular weight and copolymer
composition on release behavior in vitro and in vivo, Journal of Controlled Release, 119, 77-
85.
Mit-uppatham, C., Nithitanakul, M. and Supaphol, P., 2004. Ultrafine electrospun
polyamide-6 fibers: effect of solution conditions on morphology and average fiber
diameter, Macromolecular Chemistry and Physics, 205, 2327-2338.
Müller, E., Berger, R., Blass, E., Sluyts, D. and Pfennig, A. 2008. Liquid–Liquid Extraction, In:
Ullmann's Encyclopedia of Industrial Chemistry, Eds: Wiley-VCH Verlag GmbH & Co. KgaA,
online, DOI: 10.1002/14356007.b03_06.pub2.
Mueller, K.F.; Heiber, S.J., 1985. Crosslinked, porous polymers for controlled drug delivery,
US Patent, 4 548 990.
Munro, S.A., Lewin, S.A., Smith, H., Engel, M.E., Fretheim, A., 2007. Patient adherence to
tuberculosis treatment: A systematic review of qualitative research, PLoS Medicine, 4(7),
e238.doi:10.1371/journal.pmed.0040238.

121
Nair, K.C.M., Thomas, S. and Groeninckx, G. 2001. Thermal and dynamic mechanical
analysis of polystyrene composites reinforced with short sisal fibres, Composites Science
and Technology, 61, 2519-2529.
Namdeo, B., 2008. Barrier layers in multilayered tablets, Express Pharma.
www.expresspharmaonline.com/20080731/research03.shtml. [accessed October 24, 2010.]
Narasimhan, B.; Langer, R., 1997. Zero-order release of micro and macromolecules from
polymeric devices: the role of the burst effect, Journal of Controlled Release, 47, 13–20.
Naveen, R., 2009. Biodegradable Polymers in Controlled Drug Delivery. Pharmainfo.net.
http://www.pharmainfo.net/raghanaveen/biodegradable-polymers-controlled-drug-delivery.
[accessed on May 03, 2010]
Nelson, K.G.; Smith, S.J.; Bennet, R.M. 1987. Constant-release diffusion systems: rate
control by means of geometric configuration. In Controlled-Release Technology,
Pharmaceutical Applications; Lee, P.I., Good, W.R., Eds.; ACS Symposium Series:
Washington DC, USA, 324–340.
Nirmal, J.; Saisivam, S.; Peddanna, C.; Muralidharan, S.; Godwinkumar, S.; Nagarajan, M.,
2008. Bilayer tablets of Atorvastatin calcium and Nicotinic acid: Formulation and evaluation,
Chemical and Pharmaceutical Bulletin, 56, 1455-1458.
Oberle, R.L., Das, H., Wong, S.L., Chan, K.K., Sawchuk, R.J., 1994. Pharmacokinetics and
metabolism of diclofenac sodium in Yucatan miniature pigs, Pharmaceutical Research, 11(5),
698-703.
Okhamafe A., York P., 1989. Thermal characterization of drug/polymer and
excipient/polymer interactions in some films coating formulation, Journal of Pharmacy and
Pharmacology, 41, 1-6.
Patel, V.M.; Prajapati, B.G.; Patel, M.M., 2007. Formulation, evaluation, and comparison of
bilayered and multilayered mucoadhesive buccal devices of propranolol hydrochloride. AAPS
PharmSci, 8, Article 22.
Patra, C.N.; Kumar, A.B.; Pandit, H.K.; Singh, S.P.; Devi, M.V., 2007. Design and evaluation
of sustained release bilayer tablets of propranolol hydrochloride. Acta Pharmaceutica, 57,
479-89.

122
Peppas L.B., 1999. Polymers in controlled drug delivery, Medical Plastics and biomaterials
Magazine.
Peppas, N.A.; Sahlin, J.J., 1989. A simple equation for the description of solute release: III.
Coupling of diffusion and relaxation, International Journal of Pharmaceutics, 57, 162-172.
Phutane P.; Shidhaye S.; Lotlikar, V.; Ghule, A.; Sutar, S.; Kadam, V., 2010. In vitro
evaluation of novel sustained release microspheres of glipizide prepared by the emulsion
solvent diffusion-evaporation method, Journal of Young Pharmacists, 2(1), 35-41.
Pillay V., Fassihi R., 1999. Electrolyte induced compositional heterogeneity: A novel
approach for rate-controlled oral drug delivery, Journal of Pharmaceutical Sciences, 88,
1140-1148.
Porter, S.C., 2009. Novel Drug Delivery: Review of current trends with oral solid dosage
forms, American Pharmaceutical Review, 85, 28-35.
Pryce Lewis, W.E.; Rowe, C.W.; Cima, M.J.; Materna, P.A., 2010. System for
manufacturing controlled release dosage forms, such as zero-order release profile dosage
form manufactured by three-dimensional printing, US Patent, 7820201.
Qiu, Y.; Chidambaram, N.; Flood, K., 1998. Design and evaluation of layered diffusional
matrices for zero-order sustained-release, Journal of Controlled Release, 51, 123-130.
Rao, N.G.R., Yadav, A., Kulkarni, U., 2010. Formulation and evaluation of zero-order release
glipizide bilayer matrix tablets using natural and synthetic polymers, International Journal of
Current Pharmaceutical Research, 2(1), 34-42.
Reed, R.C.; Dutta, S.; Liu, W., 2009. Once-daily dosing is appropriate for extended-release
divalproex over a wide dose range, but not for enteric-coated, delayed-release divalproex:
Evidence via computer simulations and implications for epilepsy therapy. Epilepsy Research,
87, 260-267.
Rhine, W.D.; Hsieh, D.S.T.; Langer, R., 1980. Polymers for sustained macromolecule
release: procedures to fabricate reproducible delivery systems and control release kinetics,
Journal of Pharmaceutical Sciences, 69, 265-270.

123
Rosca I.D., Watarib F., Uob M., 2004. Microparticle formation and its mechanism in single
and double emulsion solvent evaporation, Journal of controlled release, 99, 271-280.
Rubinstein, A.; Friedman, M.; Baluom, M.; Tirosh, B., 2007. Controlled release oral drug
delivery system, US Patent, 7189414.
Sakamoto, J.H.; van de Ven, A.L.; Godin, B.; Blanco, E.; Serda, R.E.; Grattoni, A.; Ziemys,
A.; Bouamrani, A.; Hu, T.; Ranganathan, S.I.; De Rosa, E.; Martinez, J.O.; Smid, C.A.;
Buchanan, R.M.; Lee, S.Y.; Srinivasan, S.; Landry, M.; Meyn, A.; Tasciotti, E.; Liu, X.;
Decuzzi, P.; Ferrari, M., 2010. Enabling individualized therapy through nanotechnology.
Pharmacological Research, 62(2), 57-89.
Sandile, M.K., Roderick, B.W., 2006. Evaluation of rate of swelling and erosion of verapamil
(VRP) sustained release matrix tablets, Drug Development and Industrial Pharmacy, 32,
1139‐1148.
Sangalli, M.E.; Conte, U.; Gazzaniga, A.; La Manna, A., 1993. Inert monolithic device with
central hole for constant release. In Proceedings of International Symposium of Controlled
Release Bioactive Materials, 20, 316-317.
Santander-Ortega, M.J., Csaba, N., González, L., Bastos-González, D., Ortega-Vinuesa J.L.,
2010. Protein-loaded PLGA–PEO blend nanoparticles: encapsulation, release and
degradation characteristics, Colloid and Polymer Science, 288, 141-150.
Sershen, S.; West, J., 2002. Implantable, polymeric systems for modulated drug delivery,
Advanced. Drug Delivery Reviews, 54, 1225-1235.
Shah, A. C., 1988. Design of oral sustained release drug delivery systems: in vitro / in vivo
Considerations. In Oral Sustained Release Formulation Design and Evaluation; Yacobi A.,
Halperin-Walega E., Eds.; Pergamon: New York, USA, 35–56.
Shahiwala, A.; Misra, A., 2004. Pulmonary absorption of Liposomal Levonorgestrel, AAPS
PharmSci, 5(1), E13.
Shionogi Pharma, Inc. 2008. Once a day Sular® (Nisoldipine) with Geomatrix® delivery
system for the treatment of hypertension. http://www.sular.com/html/geomatrix.html
[accessed August 24, 2010].

124
Shivaraj, A.; Selvam, R.P.; Mani, T.T.; Sivakumar, T., 2010. Design and evaluation of
transdermal drug delivery of ketotifen fumarate, International Journal of Pharmaceutical and
Biomedical Research, 1(2), 42-47.
Siahi, M.R.; Barzegar-Jalali, M.; Monajjemzadeh, F.; Ghaffar, I.F.; Azarmi, S., 2005. Design
and evaluation of 1- and 3-layer matrices of verapamil hydrochloride for sustaining its release,
AAPS PharmSci, 6, 626-632.
Sibambo S., Pillay V., Choonara Y.E., 2008. A Novel Salted-out and Subsequently
Crosslinked Poly(Lactic-co-Glycolic Acid) Polymeric Scaffold Applied to Monolithic Drug
delivery, Journal of Bioactive and Compatible Polymers, 23, 132-152.
Siegel, S.; Winey, K., 2008. Long-Term Delivery Formulations and Methods of Use Thereof,
US Patent Application, 20080305140.
Siepmann, J.; Streubel, A.; Peppas, N.A., 2002. Understanding and predicting Drug delivery
from hydrophilic matrix tablets using the “Sequential Layer” Model, Pharmaceutical Research,
19, 306-314.
Singh, B.N.; Kim, K.H., 2000. Floating drug delivery systems: an approach to oral controlled
drug delivery via gastric retention, Journal of Controlled Release, 63, 235-259.
SkyePharma, 2010. A chronotherapy focused-real time oral drug delivery.
http://www.skyepharma.com/ [accessed August 26, 2010].
Song, C.X., Labhasetwar, V., Murphy, H., Qu, X., Humphrey, W.R., Shebuski, R.J., Levy,
R.J., 1997. Formulation and characterization of biodegradable nanoparticles for intravascular
local drug delivery, Journal of Controlled Release, 43, 197-212.
Song, F.; Zhang, L.; Yang, C.; Yan, L., 2009. Genipin-crosslinked casein hydrogels for
controlled drug delivery, International Journal of Pharmaceutics, 373, 41-47.
Streubel, A.; Siepmann, J.; Peppas, N.A.; Bodmeier, R., 2000. Bimodal drug release
achieved with multi-layer matrix tablets: transport mechanisms and device design, Journal of
Controlled Release, 69, 455-468.
Sundy, E.; Danckwerts, M.P., 2004. A novel compression-coated doughnut-shaped tablet
design for zero-order sustained release, European Journal of Pharmaceutical Sciences, 22,
477-485.

125
Survase, S.; Kumar, N., 2007. Pulsatile drug delivery: Current scenario, Current Research
and Information on Pharmaceutical Science, 8, 27-33.
Tiwari, S.B., Rajabi-Siahoomi, A.R., 2008. Extended-release oral drug delivery technologies:
monolithic matrix systems, Methods in Molecular Biology, 437, 217-243.
Torres, D., Garcia-Encina, G., Seijo, B. and Vila-Jato, J.L.,1995. Formulation and in vitro
evaluation of HPMCAP-microencapsulated drug-resin complexes for sustained release of
diclofenac, International Journal of Pharmaceutics, 121, 239-243.
Townsend A., Hunt K., Wyke S., 2003. Managing multiple morbidity in mid-life: a qualitative
study of attitudes to drug use, British Medical Journal, 327, 7419.
Ullah, Ismat, Jain, Nemichand B., 1998. Pharmaceutical composition containing a
combination of a statin and aspirin and method.
Vandamme, T.F.; Ellis, K.J., 2004. Issues and challenges in developing ruminal drug delivery
systems, Advanced Drug Delivery Reviews, 56, 1415-1436.
Varelas, C.G.; Dixon, D.G.; Steiner, C.A., 1995. Zero-order release from biphasic polymer
hydrogels, Journal of. Controlled Release, 34, 185-192.
Varma M.V.S., Kaushal A.M., Garg A., Garg S., 2004. Factors Affecting Mechanism and
Kinetics of Drug Release from Matrix-Based Oral Controlled Drug Delivery Systems,
American Journal of drug delivery, 2(1), 43-57.
Varum, F.J.O.; Merchant, H.A.; Basit A.W., 2010. Oral modified-release formulations in
motion: The relationship between gastrointestinal transit and drug absorption, International
Journal of Pharmaceutics, 395, 1-2, 26-36.
Vermeiren, E.; Hearnshaw, H.; Van Royen, P.; Denekens, J., 2001. Patient adherence to
treatment: three decades of research. A comprehensive review, Journal of Clinical Pharmacy
and Therapeutics, 26, 331-342.
Vyas S. P., Sood A., Venugopalan P., Venkatesan N., 2000. Preparation and characterisation
of microencapsulated gelospheres for controlled oral theophylline delivery, Journal of
Microencapsulation, 17, 767-775.
Wen, H., Park, K., 2010. Oral Controlled Release Formulation Design and Drug Delivery:
Theory to Practice, Hoboken, N.J.: Wiley©

126
Wilding, I.R.; Coupe, A.J.; Davis, S.S., 1991. The role of gamma scintigraphy in oral drug
delivery, Advanced Drug Delivery Reviews, 7, 87-117.
Wu C., McGinity J.W., 1999. Non-traditional plasticization of polymeric films, International
Journal of Pharmaceutics, 177, 15-27.
Wu, Y.S., Frijlink, H.W., van Vliet, L.J., Stokroos, I., van der Voort Maarschalk, K., 2005.
Location-Dependent Analysis of Porosity and Pore Direction in Tablets, Pharmaceutical
Research, 22(8), 1399-1405.
Yang, L., Fassihi, R., 2000. Zero-order release kinetics from a self-correcting floatable
asymmetric configuration drug delivery system, Journal of Pharmaceutical Sciences, 85, 170-
173.
Yang, L., Venkatesh, G., Fassihi, R., 1997. Compaction simulator study of a novel triple-layer
tablet matrix for industrial tabletting, International Journal of Pharmaceutics, 152, 45-52.
Yang, L.; Eshragh, J.; Fassihi, R., 1999. A new intragastric delivery system for the treatment
of Helicobacter pylori associated gastric ulcer: in vitro evaluation, Journal of Controlled
Release, 57, 215-222.
Yang, L.; Johnson, B.; Fassihi, R., 1998. Determination of continuous changes in the gel layer
thickness of poly(ethylene oxide) and HPMC tablets undergoing hydration: A textural analysis
study, Pharmaceutical Research, 15, 1902-1906.
Ye I.M.; Karasulu, H.; Ertan, G., 2003. Different geometric shaped hydrogel theophylline
tablets: statistical approach for estimating drug release, Il Farmaco, 57, 939-945.
Yoo, J.W., Dharmala, K., Lee, C.H., 2006. The physicodynamic properties of mucoadhesive
polymeric films developed as female controlled drug delivery system, International Journal of
Pharmaceutics, 309, 139-145.
Yu, D.; Branford-White, C.; Ma, Z.; Zhu, L.M.; Li, X.Y.; Yang, X.L., 2009. Novel drug delivery
devices for providing linear release profiles fabricated by 3DP, International Journal of
Pharmaceutics, 370, 160-166.
127
Yu, R., Chen, H., Chen, T., Zhou, X., 2008. Modeling and simulation of drug release from
multi-layer biodegradable polymer microstructure in three dimensions. Simulation Modelling
Practice and Theory, 16, 15–25.
Zerbe H.G.; Krumme, M., 2002. Design Characteristics and Release Properties of a Novel
Erosion-Controlled Oral Delivery System. In Modified-Release Drug Delivery Technology;
Rathbone, M.J., Hadgraft, J., Roberts, M.S., Eds.; Marcel Dekker: New York, USA, 59-76.
DOI: 10.1201/9780203910337.ch6
Zerbe, H.G.; Szabo, P., 2006. Oral dosage formulation. US Patent Application, 20060127478.