a portable programming interface for performance evaluation...
TRANSCRIPT

A Portable Programming Interface for Performance Evaluation on Modern Processors? S. Browne*, J Dongarra+ , N. Garner*, G. Ho*, P. Mucci* Abstract The purpose of the PAPI project is to specify a standard application programming interface (API) for accessing hardware performance counters available on most modern microprocessors. These counters exist as a small set of registers that count events, which are occurrences of specific signals and states related to the processor’s function. Monitoring these events facilitates correlation between the structure of source/object code and the efficiency of the mapping of that code to the underlying architecture. This correlation has a variety of uses in performance analysis including hand tuning, compiler optimization, debugging, benchmarking, monitoring and performance modeling. In addition, it is hoped that this information will prove useful in the development of new compilation technology as well as in steering architectural development towards alleviating commonly occurring bottlenecks in high performance computing.
1 Introduction For years collecting performance data on applications programs has been an imprecise art. The user has had to rely on timers with poor resolution or granularity, imprecise empirical information on the number of operations performed in the program in question, vague information on the effects of the memory hierarchy, etc. Today hardware counters exist on every major processor platform. These counters can provide application developers valuable information about the performance of critical parts of the application and point to ways for improving the performance. Performance tool developers can use these hardware counters to develop tools and interfaces that users can insert into their applications. The current problem facing tool developers is that access to these counters is poorly documented, unstable or unavailable to the user level program. The focus of PAPI is to provide an easy to use, common set of interfaces that will gain access to these performance counters on all major processor platforms, thereby providing application developers the information they may need to tune their software on different platforms. Our goals are to make it easy for users to gain access to the counters to aid in performance analysis, modeling, and tuning.
? This work was partially supported by NASA Ames Research Center, ERDC MSRC under prime contract #DAHC94-96-C-0002, by ARL MSRC under prime contract #DAHC94-96-C-0010, by ASC MSRC under prime contract #DAHC94-96-C-0005, and by NSF PACI under Cooperative Agreement #ACI-9619019. * Computer Science Department, University of Tennessee, Knoxville, TN 37996 + Computer Science Department, University of Tennessee, and Oak Ridge National Laboratory

PAPI provides two interfaces to the underlying counter hardware: a simple, high level interface for the acquisition of simple measurements and a fully programmable, thread safe, low level interface directed towards users with more sophisticated needs. The low level interface manages hardware events in user defined groups called EventSet. The high level interface simply provides the ability to start, stop and read the counters for a specified list of events. PAPI attempts to provide portability across operating systems and architectures wherever possible and reasonable to do so. PAPI includes a predefined set of events meant to represent a lowest common denominator of a ‘good’ counter implementation. The intent being that the same tool would count similar and possibly comparable events when run on different platforms. If the programmer chooses to use this set of standardized events, then the source code need not be changed and only a recompile is necessary. However, should the developer wish to access machine specific events, the low level API provides access to all available native events and counting modes.
In addition to raw counter access, PAPI provides the more sophisticated functionality of user callbacks on counter overflow and hardware based SVR4 compatible profiling, regardless of whether or not the operating system supports it. These features provide the necessary basis for any source level performance analysis software. Thus for any architecture with even the most rudimentary access to hardware performance counters, PAPI provides the foundation for truly portable, source level, performance analysis tools based on real processor statistics.
2 Discussion of PAPI Metrics Through interaction with the high performance computing community including vendors and users, the PAPI developers have chosen a set of hardware events deemed relevant and useful in tuning application performance. This section provides justification for the choice of the PAPI predefined events and discusses how performance data collected about these events can be used to optimize the performance of applications. The complete list of PAPI predefined events can be found in Appendix A. These events may differ in their actual semantics on different platforms, and all events may not be present on all platforms. However, it is hoped that most of these events will be made available in the future on all major HPC platforms to improve the capability for tuning applications across multiple platforms. The predefined events include accesses to the memory hierarchy, cache coherence protocol events, cycle and instruction counts, and functional unit and pipeline status. Each of these areas is discussed in greater detail below, along with a discussion of how the metrics in each area relate to application performance tuning. Background on architectural issues discussed in this section can be found in [3,7]. Because modern microprocessors have multiple levels in the memory hierarchy, optimizations that improve memory utilization can have major effects on performance. Levels of the memory hierarchy range from small fast register memory to larger slower levels of cache memory to still larger and slower main memory. Different levels of cache

memory may have separate instruction and data caches or may consist of a unified cache that buffers both instructions and data in the same cache. Most modern microprocessors have two levels of cache, although some now have three levels (e.g., three levels are optional with the Compaq EV5 and EV6 architectures). A load or store instruction generates a memory addressing process which first attempts to locate the addressed memory item in the L1 cache. If the item is present in the L1 cache, the result is an L1 cache hit. If the item is not present, the result is an L1 cache miss and an attempt is next made to locate the item in the L2 cache, with the result being an L2 cache hit or miss. The operating system uses main memory as a cache for a larger virtual address space for each process and translates between virtual addresses used by a program and the physical addresses required by the hardware. Memory is divided into blocks called pages. To keep the overhead of address translation low, the most recently used page addresses are cached in a translation lookaside buffer (TLB). When a program references a virtual address that is not cached in the TLB, a TLB miss occurs. If in addition the referenced page is not present in main memory, a page fault occurs. The latency of data access becomes greater with each level of the memory hierarchy, with a miss at each level multiplying the latency by an order of magnitude or more. For example, the latencies to different levels of the memory hierarchy for the MIPS R10000 process in the SGI/Cray Origin 2000 are shown in Table 1 [4]. CPU register 0 cycles L1 cache hit 2 or 3 cycles L1 cache miss satisfied by L2 cache hit 8 to 10 cycles L2 cache miss satisfied from main memory, no TLB miss
75 to 250 cycles
TLB miss requiring only reload of TLB 2000 cycles TLB miss requiring virtual page to be loaded from backing store
Hundreds of millions of cycles
Table 1. Latencies to different levels of the memory hierarchy for the MIPS R10000 processor in the SGI/Cray Origin 2000 The L1 and L2 cache hit rates indicate how cache friendly a program is, and these rates can be derived from PAPI metrics. The L1 data cache hit rate is calculated as
1.0 – (PAPI_L1_DCM / (PAPI_LD_INS + PAPI_SR_INS)) The L2 data cache hit rate is calculated as
1.0 – (PAPI_L2_DCM / PAPI_L1_DCM) Values of 0.95 or better for these hit rates indicate good cache performance. The PAPI metrics for level 1 and level 2 load and store misses (PAPI_L1_LDM, PAPI_L1_STM, PAPI_L2_LDM, PAPI_L2_STM) can provide information on the relative read and write cache performance.

A large number of data TLB misses (PAPI_TLB_DM) indicates TLB thrashing, which occurs when data being accessed are spread over too many pages and TLB cache reuse is poor. TLB thrashing can be fixed by using cache blocking or data copying or, when supported by the operating system, telling the operating system to use larger page sizes. For SMP environments, PAPI assumes a four-state MESI cache coherence protocol (possible states: modified, exclusive, shared, and invalid). In a cache-coherent SMP, the system signals to a CPU when the CPU needs to maintain the coherence of cache data. An intervention is a signal stating that some other CPU wants to use data from a cache line that the CPU receiving the signal has a copy of. The other CPU requests the status of the cache line and requests a copy of the line if it is not the same as memory. An invalidation is a signal that another CPU has modified a cache line that this CPU has in its cache and that this CPU needs to discard its copy. A high number of cache line invalidations (PAPI_CA_INV) is an indicator of cache contention. The CPU that produces the high count is being slowed because it is using data being updated by a different CPU. The CPU doing the updating will be generating a high number of PAPI_CA_SHR events. Thus a large number of PAPI_CA_SHR events also indicates that the program is being slowed by memory contention for shared cache lines. In an SMP, each processor has its own TLB, but page tables may be shared. IF a processor changes a page table entry that another processor may be using, the first processor must force the second processor to flush its TLB. This notification that a page table entry has changed is called a translation lookaside buffer shootdown (PAPI_TLB_SD). A large number of PAPI_TLB_SD events indicates memory contention for the same page table entries. PAPI metrics include counts of the various types of instructions completed, including integer, floating point, load, and store instructions. Because floating point operations may be undercounted due to counting a floating point multiply add (FMA) as a single instruction, a separate count of FMA instructions completed (PAPI_FMA_INS) has been included so that the floating point operation count can be adjusted accordingly if necessary. The store conditional instruction is used to implement various kinds of mutual exclusion, such as locks and semaphores. Store conditionals (PAPI_CSR_TOT) should never be a significant portion of program execution time. A small proportion of failed store conditional instructions (PAPI_CSR_FAL) is to be expected when asynchronous threads use mutual exclusion. However, more than a small proportion indicates some kind of contention or false sharing involving mutual exclusion between asynchronous threads. Other types of synchronization instructions, such as fetch and increment, are included under the count for synchronization instructions completed (PAPI_SYC_INS). A high number of synchronization instructions may indicate an inefficient algorithm. Pipelining is used to make CPUs faster by overlapping the execution of multiple instructions, thus reducing the number of clock cycles per instruction. The overlap among instructions is called instruction-level parallelism. Superscalar processors can issue multiple instructions per clock cycle and thus depend on a variety of static and

dynamic instruction scheduling techniques to maximize processor throughput. These techniques include software optimizations like software pipelining, loop unrolling and intraprocedural analysis in addition to post-RISC architectural changes like speculative execution, branch prediction and VLIW with predication. The net result is that while pipelining is implemented in hardware, it’s full benefit can only be realized through appropriately designed software. A stall occurs when an instruction in the pipeline is prevented from executing during its designated clock cycle. Stalls cause the pipeline performance to degrade from the ideal performance. Stalls may occur because of resource conflicts when the hardware cannot support all possible combinations of instructions in the overlapped execution, because of data or control dependences, or because of waiting for access to memory. PAPI includes events for measuring how heavily the different functional units are bein gused (PAPI_BRU_IDL, PAPI_FXU_IDL, PAPI_FPU_IDL, PAPI_LSU_IDL). A functional unit is idle if it has no work to do, as opposed to being stalled if it has work to do but cannot because of any of a variety of reasons. Data for these events provides information about the ‘mix’ of operations in the code. Several of the PAPI metrics allow detection of when and why pipeline stalls are occurring PAPI_MEM_SCY, PAPI_STL_CYC, PAPI_STL_CCY, PAPI_FP_STAL). Because pipelining is for the most part beyond the control of the application programmer, the PAPI metrics relevant to pipelining are mainly intended to provide performance data relevant to compiler writers (e.g., for use in compiler feedback loops). However, the application programmer may be able to use pipeline performance data, together with compiler output files, to restructure code application code so as to allow the compiler to do a better job of software pipelining. The application programmer may also find it useful to look at pipelining performance data when experimenting with different compiler options. Letting an instruction move from the instruction decode stage of the pipeline into the execution stage is called instruction issue. An instruction is completed once all logically previous instructions have completed, and only then is its result added to the visible state of the CPU. Because of speculative execution, a mispredicted branch can cause instructions that have been executed but not completed to be discarded. Resource contention can cause instructions to be issued more than once before being completed. Normally branch mispredictions and reissues are rare, and the number of issued instructions (PAPI_TOT_IIS) should correspond fairly closely to the number completed (PAPI_TOT_INS). A high number of mispredicted branches (PAPI_BR_MSP) indicates that something is wrong with the compiler options or that something is unusual about the algorithm. If the number of issued instructions greatly exceeds the number completed, and the count of mispredicted branches remains low, then the load/store pipeline is likely experiencing resource contention, causing load and store instructions to be issued repeatedly. Ratios derived from a combination of hardware events can sometimes provide more useful information than raw metrics. Two ratios defined as PAPI metrics are floating point operations completed per second (PAPI_FLOPS) and total instructions completed per second (PAPI_IPS). Another useful ratio is completed operations per cycle
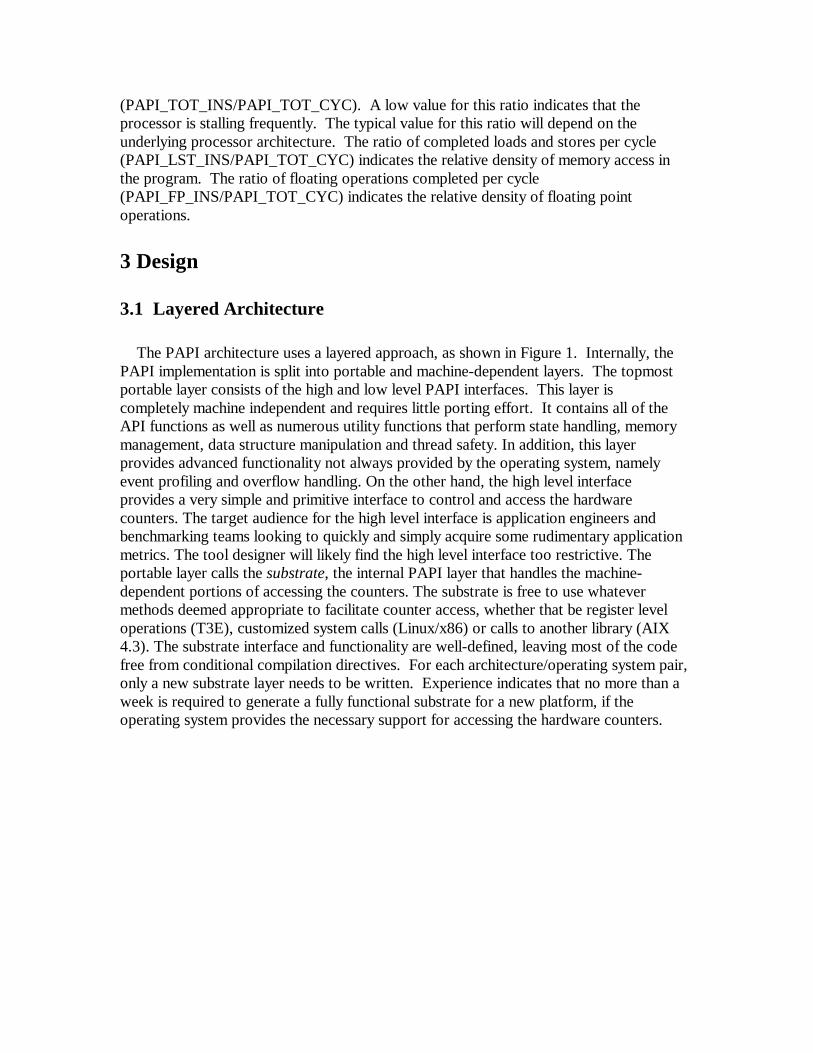
(PAPI_TOT_INS/PAPI_TOT_CYC). A low value for this ratio indicates that the processor is stalling frequently. The typical value for this ratio will depend on the underlying processor architecture. The ratio of completed loads and stores per cycle (PAPI_LST_INS/PAPI_TOT_CYC) indicates the relative density of memory access in the program. The ratio of floating operations completed per cycle (PAPI_FP_INS/PAPI_TOT_CYC) indicates the relative density of floating point operations. 3 Design 3.1 Layered Architecture The PAPI architecture uses a layered approach, as shown in Figure 1. Internally, the PAPI implementation is split into portable and machine-dependent layers. The topmost portable layer consists of the high and low level PAPI interfaces. This layer is completely machine independent and requires little porting effort. It contains all of the API functions as well as numerous utility functions that perform state handling, memory management, data structure manipulation and thread safety. In addition, this layer provides advanced functionality not always provided by the operating system, namely event profiling and overflow handling. On the other hand, the high level interface provides a very simple and primitive interface to control and access the hardware counters. The target audience for the high level interface is application engineers and benchmarking teams looking to quickly and simply acquire some rudimentary application metrics. The tool designer will likely find the high level interface too restrictive. The portable layer calls the substrate, the internal PAPI layer that handles the machine-dependent portions of accessing the counters. The substrate is free to use whatever methods deemed appropriate to facilitate counter access, whether that be register level operations (T3E), customized system calls (Linux/x86) or calls to another library (AIX 4.3). The substrate interface and functionality are well-defined, leaving most of the code free from conditional compilation directives. For each architecture/operating system pair, only a new substrate layer needs to be written. Experience indicates that no more than a week is required to generate a fully functional substrate for a new platform, if the operating system provides the necessary support for accessing the hardware counters.
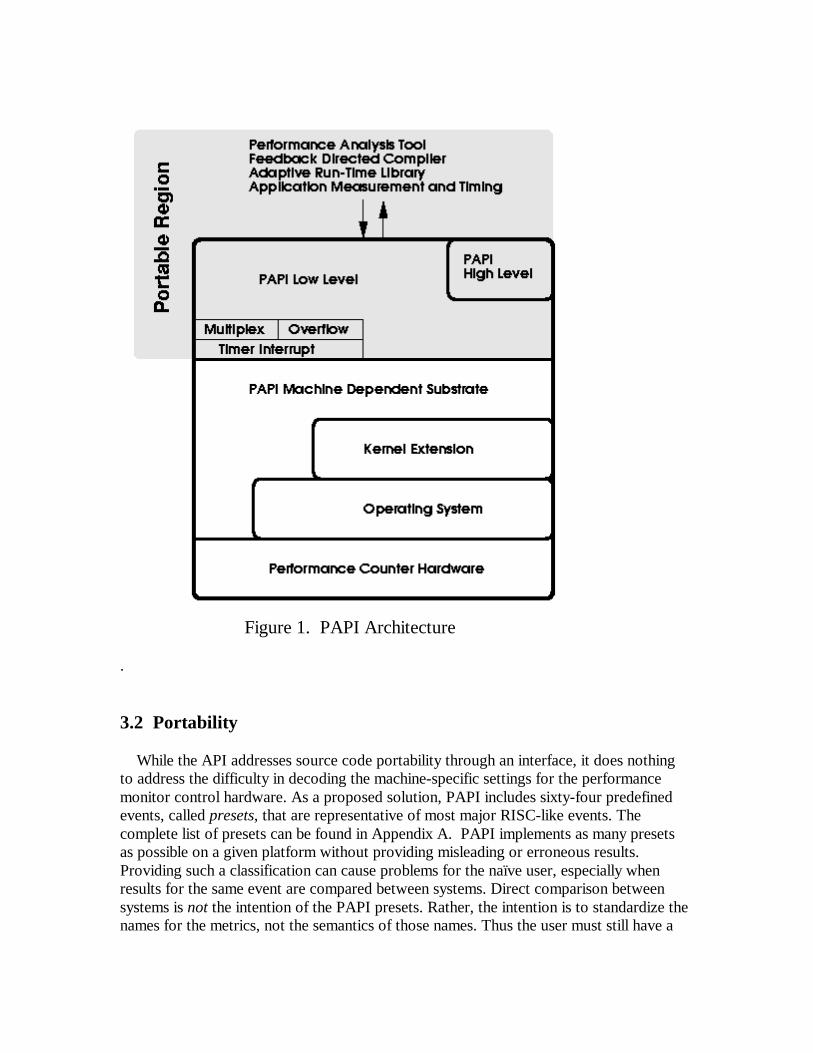
Figure 1. PAPI Architecture . 3.2 Portability While the API addresses source code portability through an interface, it does nothing to address the difficulty in decoding the machine-specific settings for the performance monitor control hardware. As a proposed solution, PAPI includes sixty-four predefined events, called presets, that are representative of most major RISC-like events. The complete list of presets can be found in Appendix A. PAPI implements as many presets as possible on a given platform without providing misleading or erroneous results. Providing such a classification can cause problems for the naïve user, especially when results for the same event are compared between systems. Direct comparison between systems is not the intention of the PAPI presets. Rather, the intention is to standardize the names for the metrics, not the semantics of those names. Thus the user must still have a

working knowledge about the processor under study in order to make sense of the performance data. 3.3 EventSets PAPI provides an abstraction from particular hardware events called EventSets. An EventSet consists of events that the user wishes to count as a group. There are two reasons for this abstraction. The first reason is efficiency in accessing the counters through the operating system. Most operating systems allow the programmer to move the counter values in bulk without having to make a separate system call for each counter. By exposing this grouping to the user, the PAPI library can greatly reduce its overhead when accessing the counters. This efficiency is especially important when PAPI is used to measure small regions of code inside loops with large iteration counts. The second reason for EventSets is that users can evolve their own specialized counter groupings specific to their application areas. In practice, most users have an understandably difficult time relating a single counter value to the performance of the region of code under study. More often than not, the relevant performance information is obtained by relating different metrics to one another. For example, the ratio of loads to level 1 cache misses is often the dominant performance indicator in dense numerical kernels. EventSets are managed by the user through the use of integer handles which helps simplify inter-language calling interfaces. The use of EventSets has been freed from as many programming restrictions as possible. The user is free to allocate and use any number of them as long as the substrate can provide the required resources. Multiple EventSets may be used simultaneously and may share counters. If the user tries to add more events to an EventSet than are simultaneously countable on the underlying platform, PAPI returns an appropriate error code, unless the user has explicitly enabled software multiplexing. PAPI also returns an error code if the user attempts to use an EventSet that is not in the proper state. 3.4 Multiplexing Most modern microprocessors have a very limited number of events than can be counted simultaneously. This limitation severely restricts the amount of performance information that the user can gather during a single run. As a result, large applications with many hours of run time may require days or weeks of profiling in order to gather enough information on which to base a performance analysis. This limitation can be overcome by multiplexing the counter hardware. By subdividing the usage of the counter hardware over time, multiplexing presents the user with the view that many more hardware events are countable simultaneously. This unavoidably incurs a small amount of overhead and can adversely affect the accuracy of reported counter values. Nevertheless, multiplexing has proven useful in commercial kernel level performance counter interfaces like SGI’s IRIX 6.x. Hence, on platforms where the operating system or kernel level counter interface does not support multiplexing, PAPI plans to provide the capability to multiplex through the use of a high resolution interval timer. To prevent naïve use of multiplexing by the novice user, the high level API can only access those

events countable simultaneously by the underlying hardware, unless a low level call has been used to explicitly enable multiplexing. 3.5 User Callbacks on Threshold One of the most significant features of PAPI for the tool writer is its ability to call user-defined handlers when a particular hardware event exceeds a specified threshold. This is accomplished by setting up a high resolution interval timer and installing a timer interrupt handler. For systems that do not support counter overflow at the operating system level, PAPI uses SIGPROF and ITIMER_PROF. PAPI handles the signal by comparing the current counter value against the threshold. If the current value exceeds the threshold, then the user’s handler is called from within the signal context with some additional arguments. These arguments allow the user to determine which event overflowed, how much it overflowed, and at what location in the source code. Using the same mechanism as for user-programmable overflow handling, PAPI also guards against register overflow of counter values. Each counter can potentially be incremented multiple times during a single clock cycle. This fact combined with increasing clock speeds and the small precision of some physical counters means that counter overflow is likely to occur on platforms where 64-bit counters are not supported in hardware or by the operating system. For such cases, PAPI implements 64-bit counters in software using the same mechanism as for user-specified overflow dispatch. 3.6 Statistical Profiling Statistical profiling is built upon the above method of installing and emulating arbitrary callbacks on overflow. Profiling works as follows: when an event exceeds a threshold, a signal is delivered with a number of arguments. Among those arguments is the interrupted thread’s stack pointer and register set. The register set contains the program counter, the address at which the process was interrupted when the signal was delivered. Performance tools such as UNIX prof extract this address and hash the value into a histogram. At program completion, the histogram is analyzed an associated with symbolic information contained in the executable. What results is a line-by-line account of where counter overflow occurred in the program. GNU prof in conjunction with the –p option of the GCC compiler performs exactly this analysis using process time as the overflow trigger. PAPI aims to generalize this functionality so that a histogram can be generated using any countable event as the basis for analysis. PAPI provides support for execution profiling based on any counter event. The PAPI_profil() call creates an histogram of overflow counts for a specified region of the application code. In the exact manner of UNIX profil(), the identified region is logically broken up into equal size subdivisions. Each time the counter reaches the specified threshold, the current subdivision is identified and its corresponding hash bucket is incremented.

Because the overflow process is emulated at a relatively coarse grain, PAPI runs the risk of falsely identifying regions of code as the cause of large numbers of overflows. To alleviate some of these problems, the developers of PAPI are experimenting with a variety of statistical methods to recover additional useful data including range compression of the histogram, randomization of the timer interval, and weighting the increments. 3.7 Thread Support As very large SMP’s become ever more popular in the HPC community, fully thread-aware performance tools are becoming a necessity. This necessity presents a significant challenge to the PAPI development team, due largely to the variety of thread packages. As with any API, the interface must be re-entrant, because any number of threads may simultaneously call the same PAPI function. This means that any globally writeable structures must be locked while in use. This requirement has the potential of increasing overhead and introducing large sections of machine dependent code to the top layer. PAPI has only one global data structure, which keeps track of process wide PAPI options and thread specific pointer maps. Fortunately, this structure is only written by two API calls that are almost exclusively used during the initialization and termination of threads and the PAPI library. A second problem is the accuracy of event counts as returned by threads calling the API. In order to support threaded operation, the operating system must save and restore the counter hardware upon context switches among different threads or processes. The PAPI library must keep thread-specific copies of the counter data structures and values. In addition, the PAPI library detects existing or new threads when they call a PAPI function and initializes the necessary thread-specific data structures at that time. There are some threading API’s that hide the concept of user and kernel level threads from the user. Pthreads and OpenMP are the most striking examples. As a result, unless the user explicitly binds his or her thread to a kernel thread (sometimes called a Light Weight Process, or LWP), the counts returned by PAPI may not necessarily be accurate. Pthreads permits any ‘Pthread’ to run on any LWP unless previously bound. Unbound user level threads that call PAPI will most likely return unreliable or inaccurate event counts. Fortunately, in the batch environments of the HPC community, there is no significant advantage to user level threads and thus kernel level threads are the default. For situations where this is not the case, PAPI developers have plans to incorporate simple routines to facilitate binding by the user. 3.8 Accuracy of Performance Counter Data Although PAPI attempts to introduce as little overhead as possible and thus perturb application performance to only a minor degree, some perturbation is inevitable and has yet to be measured. Counts produced for various PAPI metrics may vary from one run to another of the same program on the same inputs on some architectures, due to contention for resources with other applications or the operating system. The vendor-provided counter interfaces may occasionally have bugs that cause inaccurate reporting of

hardware counter data. More study is needed to determine the accuracy of performance counter data measured by PAPI. With its portable interface to hardware counters, PAPI actually provides a good framework for conducting statistical studies of the reliability and consistency of this data. 4 Performance Counter Implementations 4.1 Pentium Pro/II/III on Linux v2.0, v2.2 This platform was the first one targeted for a variety of reasons, including access to the kernel source code and the simplicity of the counters. The counters on the Pentium Pro and Pentium II/III are one 64-bit cycle counter and two 40-bit general purpose counters. The Pentium Pro and Pentium II/III have identical counter sizes and event codes. Erik Hendriks had written a performance counter kernel extension for Beowulf that provided an excellent framework on which to hang additional functionality. Some of the features added to the kernel patch include the ability to reset the cycle counter, faster configuration and access, process/thread inheritance and support for Linux kernel versions outside the main tree. 4.2 SGI/MIPS R10000/R12000 on IRIX 6.x This platform has one of the best vendor-provided counter interfaces, and the counter interface is well-documented[]. PAPI chose to implement the IRIX substrate using the ioctl() interface to the /proc filesystem. There are several advantages to the SGI platform that made some aspects of PAPI easier to implement, such as kernel level multiplexing and internally supported overflow handling. The MIPS R10000 and R12000 have two 32-bit counters which support a total of 31 different events. For PAPI, there were two main problems with this platform. The first problem was that there is no way to write to the counters, which means that PAPI cannot reset the counters by zeroing them. This API routine was therefore implemented in the substrate by emulating zeroing of the counters through bookkeeping. The second problem is that a process may have access to the counters taken from it by the kernel. Once a process has acquired the counters, the same process may not reacquire them. When access to the counters has been given to another process, the values cannot be trusted and the process should be restarted. PAPI will detect a change in counter ownership and will exit with an error message. 4.3 IBM Power 604/604e/630 on AIX 4.3 The IBM 604/604e/630 substrate is built over the pmtoolkit, which is a proprietary kernel extension for AIX 4.3 that supports a system and kernel thread performance monitor API[9]. pmtoolkit adds support to AIX for optional Performance Monitor (PM) contexts which are extensions of the regular processor and thread contexts and include one 64-bit counter per hardware counter and a set of control words. The control words define what events get counted and when counting is on or off. The November 1999 release of the pmtoolkit includes event tables for the 604, 604e, 630, and 630+. The 604

has two counters, the 604e has four counters, and the 630 and 630+ processors both have eight counters. Architectural issues for the IBM POWER3 which uses the 630 processor may be found in [1]. 4.4 Compaq Alpha EV4/5/6 on Tru64 Unix The pfm pseudo-device is the interface to the Alpha on-chip performance counters under Tru64 Unix. The interface consists of a set of ioctl() calls. The Tru64 kernel must be rebuilt to configure the pfm pseudo-device into it. The EV4 CPU (21064, 21064A, 21066, and 21068 processors) has two counters. The EV5 (21164, 21164A, 21164PC) has three counters. The EV6 (21164) has two counters. The EV4, EV5, and EV6 counters can be independently programmed. The EV67 counters are not completely independent. Any one statistic may be selected, or one of the following pairs may be selected: (cycles0, replay); (retinst, cycles1); (retinst, bcachemisses). 4.5 Cray T3E, EV5 on Unicos/mk The T3E contains a large number of modified EV5 processors arranged in a three dimensional torus. Each processor in the system runs a slimmed down version of the operating system Unicos/mk, a derivative of the Mach microkernel. Access to the EV5’s three performance counters is achieved through customized assembly routines provided by SGI/Cray. These routines make calls to the PAL code, microcode set up by the manufacturer to handle low level operations. While this interface is very small, it is programmable enough to support the necessary functionality in PAPI. The main problem on the T3E is that the performance registers are not accumulated by the PAL code into 64 bit quantities and thus this accumulation must be performed by PAPI. Furthermore, the Unicos/mk scheduler may migrate a job to another CPU. In that case, PAPI’s only valid course of action is to detect the fault and inform the user. 5 Tools 5.1 Display of PAPI Performance Data The PAPI project has developed two tools that demonstrate graphical display of PAPI performance data in a manner useful to the application developer. These tools are meant to demonstrate the capabilities of PAPI rather than as production quality tools. The tool front ends are written in Java and can be run on a separate machine from the program being monitored. All that is required for real-time monitoring and display of application performance is a socket connection between the machines. The first tool, called the perfometer, provides a runtime trace of a chosen PAPI metric, as shown in Figure 2 for floating operations per second (PAPI_FLOPS). This particular example illustrates how calls to PAPI routines at the beginnings and ends of procedures can provide information about the relative floating point performance of those

procedures. The same display can be generated for any of the PAPI metrics. For example, Figure 3 shows a display of the L1 cache hit rate.
Figure 2. Perfometer displaying MFLOPs

Figure 3. Perfometer displaying the L1 cache hit rate. The second tool, called the profometer, provides a histogram that relates the occurrences of a chosen PAPI event to text addresses in the program, as shown in Figure 4 for L1 data cache misses. Again, the same display can be generated for any of the PAPI metrics. Future plans are to develop the capability of relating the frequency of events to source code locations, so as to allow the application developer to quickly locate portions of the program that are the source of performance problems.
Figure 4. Profometer display L1 data cache misses 5.2 Integration with Other Tools Visual Profiler, or vprof, is a tool developed at Sandia National Laboratory for collecting statistical program counter data and graphically viewing the results on Linux Intel machines[8]. vprof uses statistical event sampling to provide line-by-line execution profiling of source code. vprof can sample clock ticks using the profil system call. The vprof developer has added support for PAPI so that vprof can also sample the wide range of system events supported by PAPI. A screenshot showing vprof examination of both profil and PAPI_TOT_CYC data is shown in Figure 5.

Figure 5. vprof displaying profil and PAPI_TOT_CYC data SvPablo is a graphical source code browser and performance visualizer that has been developed as part of the University of Illinois’ Pablo project[5,6]. SvPablo supports automatic instrumentation of HPF codes with Portland Group’s HPF compiler and interactive instrumentation of C and Fortran programs. During execution of an instrumented code the SvPablo library maintains statistics on the execution of each instrumented event on each processor and maps these statistics to constructs in the original source code. The current version of SvPablo includes support for the MIPS R10000 hardware performance counters. The next version of SvPablo, being developed at the IBM Advanced Computing Technology Center, has integrated support for PAPI. Screenshots of SvPablo displays of PAPI metrics are shown in Figures 6 and 7.

Figure 6. SvPablo source code browser displaying PAPI metrics

Figure 7. SvPablo statistics displays showing PAPI data DEEP from Pacific-Sierra Research stands for Development Environment for Parallel Programs. DEEP provides an integrated interactive GUI interface that binds performance, analysis, and debugging tools back to the original parallel source code. DEEP supports Fortran 77/90/95, C, and mixed Fortran and C in Unix and Windows 95/98/NT environments. DEEP supports both shared memory (automatic parallelization, OpenMP) and distributed memory (MPI, HPF, Data Parallel C) parallel program development. A special version of DEEP called DEEP/MPI is aimed at support of MPI programs. DEEP provides a graphical user interface for program structure browsing, profiling analysis, and relating profiling results to source code. DEEP developers are incorporating support for PAPI so that statistics for the standard PAPI metrics can be viewed and analyzed from the DEEP interface. A screenshot of the DEEP/MPI interface displaying PAPI data for L2 cache misses is shown in Figure 8.

Figure 8. DEEP/MPI displaying PAPI data for L2 cache misses 5 Related Work 5.1 PCL The Performance Counter Library (PCL) is a common interface for accessing performance counters built into modern microprocessors in a portable way[2]. PCL supports query for functionality, start and stop of counters, and reading the current values of counters. Performance counter values are returned as 64-bit integers an all supported platforms. Performance counting can be down in user mode, system mode, or user-or-system mode. PCL supports nested calls to PCL functions to allow hierarchical performance measurements. However, nested calls must use exactly the same list of events. PCL functions are callable from C, C++, Fortran, and Java. Similar to PAPI, PCL defines a common set of events across platforms for accesses to the memory hierarchy, cycle and instruction counts, and the status of functional units, and translates these into native events on a given platform where possible. PAPI additionally defines
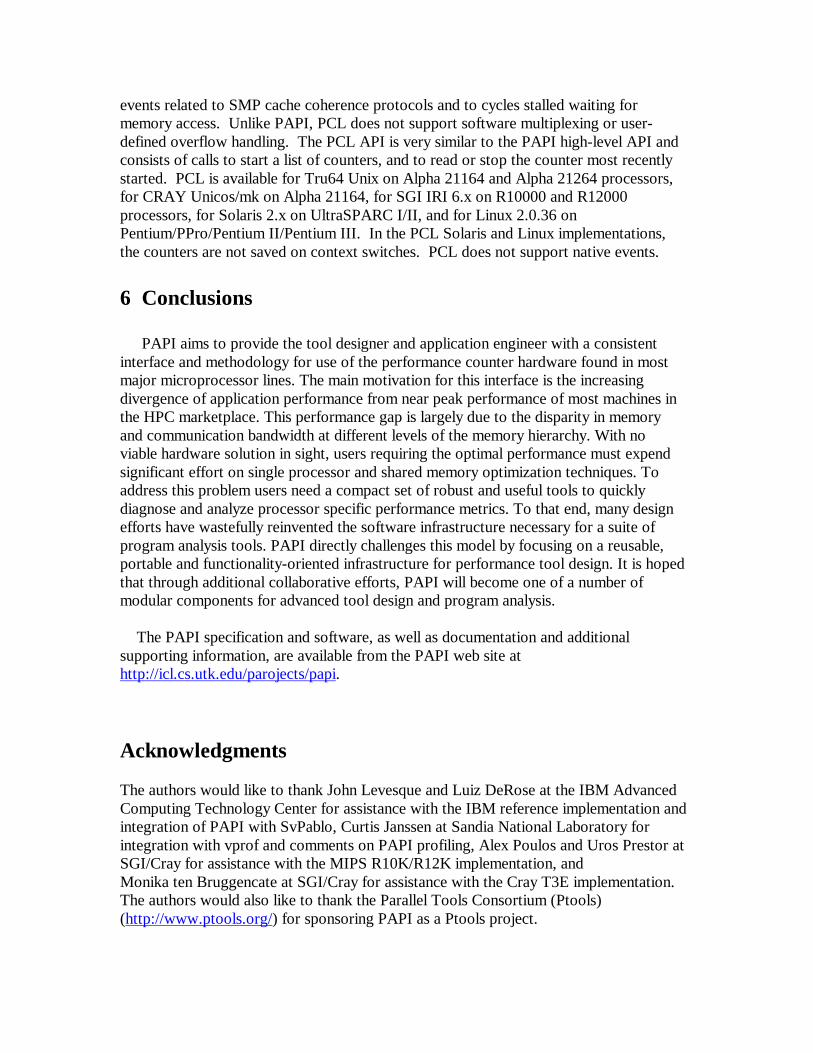
events related to SMP cache coherence protocols and to cycles stalled waiting for memory access. Unlike PAPI, PCL does not support software multiplexing or user-defined overflow handling. The PCL API is very similar to the PAPI high-level API and consists of calls to start a list of counters, and to read or stop the counter most recently started. PCL is available for Tru64 Unix on Alpha 21164 and Alpha 21264 processors, for CRAY Unicos/mk on Alpha 21164, for SGI IRI 6.x on R10000 and R12000 processors, for Solaris 2.x on UltraSPARC I/II, and for Linux 2.0.36 on Pentium/PPro/Pentium II/Pentium III. In the PCL Solaris and Linux implementations, the counters are not saved on context switches. PCL does not support native events. 6 Conclusions PAPI aims to provide the tool designer and application engineer with a consistent interface and methodology for use of the performance counter hardware found in most major microprocessor lines. The main motivation for this interface is the increasing divergence of application performance from near peak performance of most machines in the HPC marketplace. This performance gap is largely due to the disparity in memory and communication bandwidth at different levels of the memory hierarchy. With no viable hardware solution in sight, users requiring the optimal performance must expend significant effort on single processor and shared memory optimization techniques. To address this problem users need a compact set of robust and useful tools to quickly diagnose and analyze processor specific performance metrics. To that end, many design efforts have wastefully reinvented the software infrastructure necessary for a suite of program analysis tools. PAPI directly challenges this model by focusing on a reusable, portable and functionality-oriented infrastructure for performance tool design. It is hoped that through additional collaborative efforts, PAPI will become one of a number of modular components for advanced tool design and program analysis. The PAPI specification and software, as well as documentation and additional supporting information, are available from the PAPI web site at http://icl.cs.utk.edu/parojects/papi. Acknowledgments The authors would like to thank John Levesque and Luiz DeRose at the IBM Advanced Computing Technology Center for assistance with the IBM reference implementation and integration of PAPI with SvPablo, Curtis Janssen at Sandia National Laboratory for integration with vprof and comments on PAPI profiling, Alex Poulos and Uros Prestor at SGI/Cray for assistance with the MIPS R10K/R12K implementation, and Monika ten Bruggencate at SGI/Cray for assistance with the Cray T3E implementation. The authors would also like to thank the Parallel Tools Consortium (Ptools) (http://www.ptools.org/) for sponsoring PAPI as a Ptools project.

References [1] Stephan Andersson, Ron Bell, John Hague, Holger Holthoff, Peter Mayes, Jun Nakano, Danny Shieh, and Jim Tuccillo. POWER3 Introduction and Tuning Guide. IBM, October 1998. http://www.redbooks.ibm.com [2] Rudolph Berrendorf and Heinz Ziegler. PCL – the Performance Counter Library: A Common Interface to Access Hardware Performance Counters on Microprocessors, Version 1.3. http://www.fz-juelich.de/zam/PCL/ [3] Mark Brehob, Travis Doom, Richard Enbody, William H Moore, Sherry Q. Moore, Ron Sass, Charles Severance, “Beyond RISC – The Post-RISC Architecture”, Michigan State University Department of Computer Science, Technical Report CPS-96-11, March 1996. [4] David Cortesi, Origin 2000 and Onyx2 Performance Tuning and Optimization Guide. Document Number 007-3430-002, Silicon Graphics Inc., 1998. http://techpubs.sgi.com/ [5] Luiz DeRose and Daniel A. Reed. “SvPablo: A Multi-Language Perfomrance Analysis System”, Proceedings of the 1999 International Conference on Parallel Processing, September 1999, pp. 311-318. [6] Luiz DeRose, Ying Zhang, and Daniel A. Reed. “SvPablo: A Multi-Language Performance Analysis System”, 10th International Conference on Computer Performance Evaluation – Modeling Techniques and Tools – Performance Tools’98, pp. 352-355. Palma de Mallorca, Spain, September 1998. http://vibes.cs.uiuc.edu/ [7] John L. Hennessy and David A. Patterson. Computer Architecture: A Quantitative Approach, second edition. Morgan Kaufmann, 1996. [8] Curtis L. Janssen. The Visual Profiler, Version 0.4, October 1999. http://aros.ca.sandia.gov/~cljanss/perf/vprof/doc/README.html [9] Luc Smolders. System and Kernel Thread Performance Monitor API Reference Guide, Version 0.5. IBM RS/6000 Division, May 1999. Appendix A. PAPI Standard Event Definitions Memory hierarchy access events PAPI_L1_DCM Level 1 data cache misses
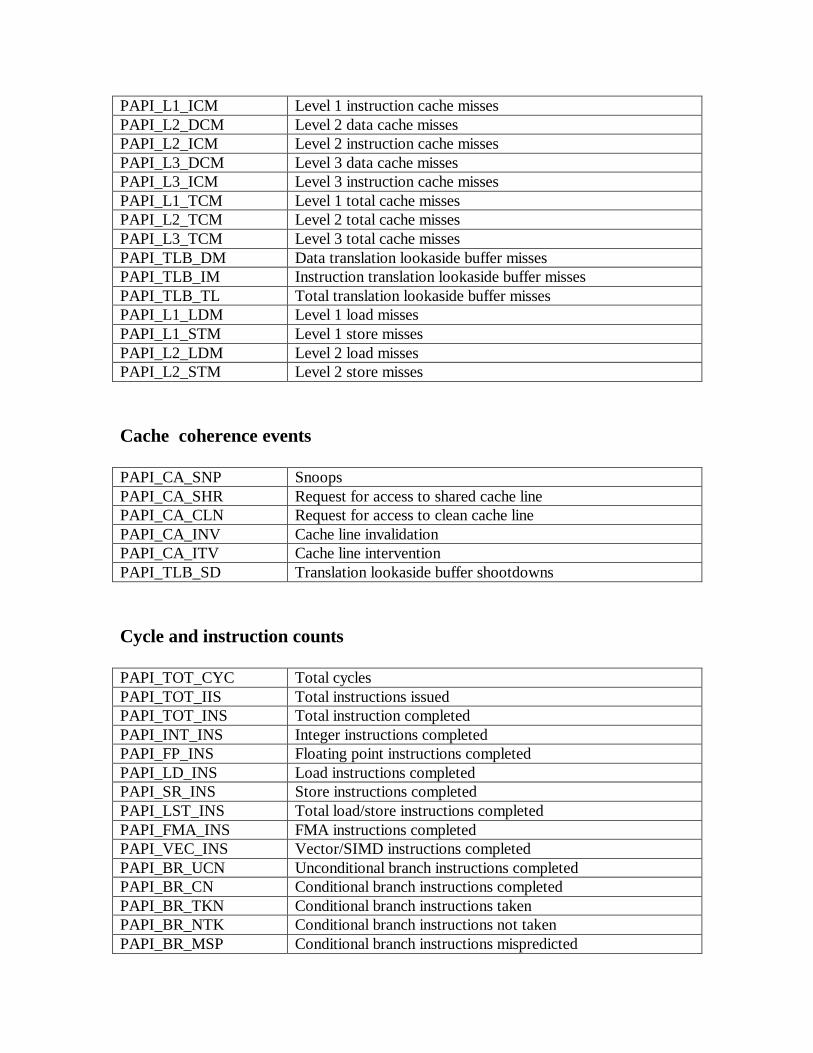
PAPI_L1_ICM Level 1 instruction cache misses PAPI_L2_DCM Level 2 data cache misses PAPI_L2_ICM Level 2 instruction cache misses PAPI_L3_DCM Level 3 data cache misses PAPI_L3_ICM Level 3 instruction cache misses PAPI_L1_TCM Level 1 total cache misses PAPI_L2_TCM Level 2 total cache misses PAPI_L3_TCM Level 3 total cache misses PAPI_TLB_DM Data translation lookaside buffer misses PAPI_TLB_IM Instruction translation lookaside buffer misses PAPI_TLB_TL Total translation lookaside buffer misses PAPI_L1_LDM Level 1 load misses PAPI_L1_STM Level 1 store misses PAPI_L2_LDM Level 2 load misses PAPI_L2_STM Level 2 store misses Cache coherence events PAPI_CA_SNP Snoops PAPI_CA_SHR Request for access to shared cache line PAPI_CA_CLN Request for access to clean cache line PAPI_CA_INV Cache line invalidation PAPI_CA_ITV Cache line intervention PAPI_TLB_SD Translation lookaside buffer shootdowns Cycle and instruction counts PAPI_TOT_CYC Total cycles PAPI_TOT_IIS Total instructions issued PAPI_TOT_INS Total instruction completed PAPI_INT_INS Integer instructions completed PAPI_FP_INS Floating point instructions completed PAPI_LD_INS Load instructions completed PAPI_SR_INS Store instructions completed PAPI_LST_INS Total load/store instructions completed PAPI_FMA_INS FMA instructions completed PAPI_VEC_INS Vector/SIMD instructions completed PAPI_BR_UCN Unconditional branch instructions completed PAPI_BR_CN Conditional branch instructions completed PAPI_BR_TKN Conditional branch instructions taken PAPI_BR_NTK Conditional branch instructions not taken PAPI_BR_MSP Conditional branch instructions mispredicted

PAPI_BR_PRC Conditional branch instructions correctly predicted PAPI_BR_INS Total branch instructions completed PAPI_CSR_FAL Failed store conditional instructions PAPI_CSR_SUC Successful store conditional instructions PAPI_CSR_TOT Total store conditional instructions PAPI_SYC_INS Synchronization instructions completed PAPI_FLOPS Floating point instructions completed per second PAPI_IPS Instructions completed per second Functional unit and pipeline status events PAPI_BRU_IDL Cycles branch units are idle PAPI_FXU_IDL Cycles integer units are idle PAPI_FPU_IDL Cycles floating point units are idle PAPI_LSU_IDL Cycles load/store units are idle PAPI_MEM_SCY Cycles stalled waiting for memory access PAPI_MEM_RCY Cycles stalled waiting for memory read PAPI_MEM_WCY Cycles stalled waiting for memory write PAPI_STL_CYC Cycles with no instruction issue PAPI_FUL_ICY Cycles with maximum instruction issue PAPI_STL_CCY Cycles with no instruction completion PAPI_FUL_CCY Cycles with maximum instruction completion