a practical guide on apa style for quantitative research
TRANSCRIPT

A Practical Guide on APA Style for
Quantitative Research Students
November 2017
Theresa L. Dell-Ross
Department of Educational Policy Studies
Georgia State University
1
Table of Contents
About this Guide ............................................................................................................................. 2
Manuscript Structure & Content: Results and Discussion Sections ............................................... 3
Results Section DOs .......................................................................................................... 3
Results Section DON’Ts ................................................................................................... 3
Discussion Section ............................................................................................................ 3
The Mechanics of Style: Punctuation ............................................................................................. 4
Punctuation DOs ................................................................................................................ 4
Punctuation DON’Ts ......................................................................................................... 4
The Mechanics of Style: Capitalization .......................................................................................... 4
Capitalization DOs ............................................................................................................ 4
Capitalization DON’Ts ..................................................................................................... 5
The Mechanics of Style: Italics ....................................................................................................... 5
Italics DOs ......................................................................................................................... 5
Italics DON’Ts ................................................................................................................... 5
The Mechanics of Style: Numerals, Number Words, and Decimal Numbers ................................ 6
Numerals ............................................................................................................................ 6
Number Words ................................................................................................................... 6
Decimal Numbers .............................................................................................................. 6
Other Number Considerations .......................................................................................... 7
The Mechanics of Style: Metrication .............................................................................................. 7
The Mechanics of Style: Statistical and Mathematical Copy ......................................................... 7
The Mechanics of Style: Equations ................................................................................................ 8
Displaying Results .......................................................................................................................... 9
General Guidance .............................................................................................................. 9
Tables ................................................................................................................................. 9
Table Notes ...................................................................................................................... 10
Figures .............................................................................................................................. 10

2
About this Guide
The American Psychological Association (APA; 2010) provided very specific guidelines for
styling research reports in a manner consistent with a large proportion of published literature
because
uniform reporting standards make it easier to generalize across fields, to more
fully understand the implications of individual studies, and to allow techniques of
meta-analysis to proceed more efficiently. Also, decision makers in policy and
practice have emphasized the importance of understanding how research was
conducted and what was found. A set of comprehensive reporting standards
facilitates this understanding. (p. 21)
This guide is intended to help students learn to report quantitative research results in APA style
by summarizing the most critical elements of the 6th edition APA guidelines as they relate to
reporting empirical and methodological studies. Of course, there is no substitute for “the real
thing,” so readers are referred to the official APA Manual for in-depth coverage of the APA style
requirements: American Psychological Association. (2010). Publication Manual of the
American Psychological Association (6th ed.). Washington, DC: Author.
This guide is intended to supplement—not replace—the APA Manual and will, therefore, make
reference to elements of the Manual that students may want to examine more closely. The order
of content presentation is maintained, as well as many of the headings, in order to facilitate ease-
of-use for students.
3
Manuscript Structure & Content: Results and Discussion Sections
Results Section DOs
Report all results, including nonsignificant results and results that did not support the
hypotheses.
Report all effect sizes, including small effects.
Report sample sizes, frequency counts, means, and standard deviations/variances by cell.
Report variance/covariance (or correlation) matrices as appropriate.
Provide participant recruitment details if applicable. Include participant starting counts,
attrition (and known or suspected reasons for this attrition), changes of participant
assignment to treatments or groups, and final counts. Be sure to include baseline data for
participants.
Describe whether the interventions were administered as originally intended and, if not, the
reason(s) for any changes. Disclose any adverse events that may have affected the results.
Quantify and explain data missingness, including possible sources and causes. Clearly
identify the method(s) used to address data missingness (e.g., listwise deletion).
When null hypothesis significance testing is used, report the appropriate statistic (e.g., F, t,
χ2), the associated degrees of freedom, the exact p-value, the confidence interval, and the
effect size (preferably in the original units of measure or a standardized unit) and direction.
As noted in the APA Manual (2010), “when point estimates (e.g., sample means or
regression coefficients) are provided, always include an associated measure of variability
(precision), with an indication of the specific measure used (e.g., the standard error)” (p. 34).
For multilevel models, include summary statistics at each level of aggregation.
Results Section DON’Ts
Do not omit results that are in opposition to the stated hypotheses.
Do not provide explanations or citations for basic statistical methods unless (a) others may
question the use of the method in this particular context or for this particular purpose or (b)
the method is being modified in a methodological study.
Discussion Section
The Discussion section should begin with a direct statement as to whether the study’s hypotheses
were rejected or retained. (If the hypotheses were rejected, offer possible explanations as to why
this occurred.) Whereas the Results section provides a factual account of the study’s outcomes,
the Discussion section is where the authors provide interpretation and evaluation of the
outcomes, giving consideration to “(a) sources of potential bias and other threats to internal
validity, (b) the imprecision of measures, (c) the overall number of tests or overlap among tests,
(d) the effect sizes observed, and (e) other limitations or weaknesses of the study” (APA, 2010,
p. 35). The author(s) should pay attention to the theoretical, clinical, and/or practical
consequences of the results, comparing and contrasting the results to results of similar studies.
Acknowledge the generalizability (external validity) of the study’s findings and any questions or
problems that arose during the study; these may indicate future research directions for the field.

4
The Mechanics of Style: Punctuation
Punctuation DOs
Use a comma to separate digits in large numbers, except as noted in the “Numbers” section
below. Example: 1,000,000
Use parentheses around numbers that label equations. Example: a + b = c (1)
Use parentheses to enclose statistics. Example: (p = .041)
Use parentheses to enclose degrees of freedom. Example: F(2, 78) = 4.35
Use brackets for confidence intervals. Example: 95% CI [-2.96, 1.22]
Use a slash (/) to clarify a relationship between two words or sets of words if one of the
elements already contains a hyphen (e.g., classification/similarity-judgment condition). If
neither element contains a hyphen, use a hyphen (or short dash) to connect them (e.g., test-
retest).
Punctuation DON’Ts
Do not put a space around colons in ratios. Example: 34:27
Do not put a space after the periods in Latin abbreviations. Examples: i.e. and e.g.
Do not use periods with capitalized abbreviations and acronyms. Examples: USA, HLM, and
SEM
Do not use periods with metric and nonmetric measurement abbreviations (e.g., ft, mm, and
kg). There is one exception: inches. A period must be used for the abbreviation of inches
(in.) so that it is not mistaken for the word in.
Do not use quotation marks with Likert scale labels; use italics instead. Example: The scale
ranged from 1 (strongly disagree) to 5 (strongly agree).
Do not use quotation marks for the introduction of technical terms. Example: The term
identity formation has had different operational definitions across studies.
Do not use parentheses to enclose other parentheses. If nesting is required, use brackets. If
multiple sets of enclosures are required, use ( ) first, [( )] next, and {[( )]} last.
Do not use brackets to set off statistics that already include parentheses; separate the sentence
from the first statistic with a comma. If there are additional statistics, separate them with
commas as well. Example: Results were nonsignificant, F(2, 17) = 3.16, p = .124.
The Mechanics of Style: Capitalization
Capitalization DOs
Capitalize all major words in headings and subheadings, unless this conflicts with the APA
guidelines for headings and subheadings. In that case, capitalize the first word and proper
nouns only.
“Capitalize exact, complete titles of published and unpublished tests. Words such as test or
scale are not capitalized if they refer to subscales of tests” (APA, 2010, p. 103).
5
“Capitalize names of derived variables within a factor or principal components analysis. The
words factor and component are not capitalized unless followed by a number” (APA, 2010,
p. 104). Example: Mathematics Achievement (Factor 3)
“Capitalize nouns followed by numerals or letters that denote a specific place in a numbered
series” (APA, 2010, p. 103), with one exception noted below. Examples:
On Day 4 of Intervention 1
as shown in Table 5
as can be seen in Figure 2
the list in Chapter 4
Capitalization DON’Ts
Do not capitalize names of theories, models, statistical procedures, or hypotheses.
Do not capitalize nouns referring to the pages of books or the rows/columns of tables.
Do not capitalize nouns that precede a variable. Examples: trial n, item x
“Do not capitalize effects or variables unless they appear with multiplication signs” (APA,
2010, p. 104). Examples:
a large effect of gender
algebraic reasoning, spatial reasoning, and computation variables
a 2 × 4 × 3 (Gender × Age × Intervention) design
Do not capitalize names of conditions or groups in experiments, unless identified by a letter
or number. Examples: control group; Conditions A and B
The Mechanics of Style: Italics
Italics DOs
Use italics for letters that are used as statistical symbols or algebraic variables. Examples:
Cohen’s d
SD
a + b = c + d
Use italics for anchors of a scale. Example: The scale ranged from 1 (strongly disagree) to 5
(strongly agree).
Italics DON’Ts
Do not use italics for trigonometric terms (e.g., sin, tan, and log).
Do not use italics for nonstatistical subscripts to statistical terms. Example: Fmax / SA + SB
Do not use italics for Greek letters (e.g., β and α). [Caution: Microsoft Word’s equation
editor italicizes Greek letters by default.]

6
The Mechanics of Style: Numerals, Number Words, and Decimal Numbers
Numerals
Numerals are used for:
numbers 10 and above
fractions, decimals, ratios, percentiles, and quartiles
numbers that represent statistical or mathematical functions (e.g., divided by 4, 7 times as
many)
numbers located in the abstract of the paper
numbers located in a graphic
numbers that denote a specific place in a series (e.g., Grade 2, Table 3, row 9)
numbers that precede a unit of measure (e.g., a 4-yd touchdown, less than 10 g)
numbers that represent time (except as noted below), dates, ages, scores, points on a scale,
and exact sums of money
Number Words
Number words are used for:
numbers less than 10
the number of days, months, and years
numbers that start a sentence, title, or text (sub)heading
common fractions (e.g., one fifth of the class, a two-thirds majority)
cases of universally accepted usage (e.g., the Twelve Apostles, Five Pillars of Islam)
Use a combination of numerals and words to express back-to-back modifiers (e.g., 3 two-way
interactions, ten 7-point scales) and ordinal numbers (e.g., first, second, third). If readability
suffers, use words for both (e.g., the first two items).
Decimal Numbers
Use a zero in front of the decimal point if the statistic can exceed 1. Examples: 0.23 cm;
Cohen’s d = 0.70
Do not use a zero in front of the decimal point if the statistic cannot exceed 1. This includes
correlations, proportions, and levels of statistical significance. Examples: r = .15; p = .371
When reporting decimal numbers, “as a general rule, fewer decimal digits are easier to
comprehend than more digits; therefore, in general, it is better to round to two decimal places
or to rescale the measurement (in which case effect sizes should be presented in the same
metric) . . . . As a rule, when properly scaled, most data can be effectively presented with two
decimal digits of accuracy” (APA, 2010, pp. 113-114).
“Report correlations, proportions, and inferential statistics such as t, F, and χ2 to two
decimals” (APA, 2010, p. 114).
Report exact p values with an equal sign (e.g., p = .031) to either two or three decimal places,
except for p values less than .001, which are reported as p < .001. [Note: Be very careful
when reporting p values from the output of statistical software! Software programs are
designed to round results. If p is reported as 0 or 1, it is very likely that it was rounded to 0

7
or 1, not that the result was exactly 0 or 1. If your output shows a p value of 0 or 1, report p
< .001 or p > .999 to be safe.]
Be consistent in the use of decimal places. If the standard deviation is reported to two
decimal places in one part of the paper, all standard deviations in the paper should be
reported to two places. If all standard deviations are reported to two places, then consider
reporting all other statistics to two places, unless there is a good reason not to.
Other Number Considerations
Use a comma to separate digits in numbers (e.g., 1,000,000), except for the following: page
numbers, binary digits, serial numbers, degrees of temperature, acoustic frequency
designations, and degrees of freedom.
To form plurals of numbers, add s or es, without an apostrophe (e.g., twos, fives, 1820s).
Negative numbers should be indicated using a hyphen, with a space in front of it but no space
behind it (e.g., -4.17).
The Mechanics of Style: Metrication
APA uses the metric system whenever possible. If non-metric units are used, report the
metric equivalent in parentheses immediately after the non-metric measurement. Example: 3
ft (0.91 m) long
Use metric abbreviations in tables.
Do not make metric abbreviations plural.
Use a space between a symbol and the number to which it refers, except for measurement of
angles. Examples: 4.5 m, 12 °C, 45° angle
The Mechanics of Style: Statistical and Mathematical Copy
When reporting confidence intervals, use the format “95% CI [LL, UL],” where LL is the
lower limit and UL is the upper limit. If a sequence of confidence intervals is provided and
the level of confidence is the same for each, you only have to write “95% CIs” one time.
Example: 95% CIs [2.33, 5.21], [4.88, 6.69], and [5.98, 9.00]
Use the statistical term, not the symbol, in the main text. Example: The groups’ standard
deviations ranged from 1.03 to 7.66.
Use a capital N for the total sample size and a lowercase n for sizes of subsets of the total
sample.
Use boldface font for names of matrices.
Use spaces between numerals and symbols (e.g., a + b = c).
If a subscript and a superscript are used simultaneously, they should be stacked directly on
top of each other; in Microsoft Word 2013, there is an option in the Equation Editor to do

8
this. If the subscript and superscript cannot be stacked, then type the subscript first and the
superscript second, except if the superscript is a prime symbol (in which case the order is
reversed).
The Mechanics of Style: Equations
“Punctuate all equations, whether they are in the line of text or displayed (i.e. typed on a new
line), to conform to their place in the syntax of the sentence” (APA, 2010, p. 123).
Place short and simple equations in the line of the text as long as they do not project above or
below the line. If multiple sets of parentheses are required for in-line equations, use ( ) first,
[( )] next, and {[( )]} last.
Display on a new line (a) complex equations and (b) simple equations that will be referred to
throughout the text. Type the equation number in parentheses near the right margin. To refer
to the equation later in the text, write “Equation” and the numeral assigned to it. Example:
Using Equation 3, the resulting value is 7.32.
9
Displaying Results
General Guidance
Tables and figures may be used to enhance your paper. Figures include charts, graphs,
photographs, drawings, and illustrations. Tables and figures should be used only when they are
the most effective means of communicating information. Each table and figure should be
labeled with Arabic numerals (e.g., Table 1, Table 2) in the order that they are referred to in the
text. If the table or figure is in the appendix, label it with the letter corresponding to the
appendix (i.e. Appendix A, Appendix B, etc.) and the numeral representing its order of
appearance in that appendix (e.g., Figure A1, Figure C4).
There are some general guidelines for tables and figures to keep in mind. Position elements that
are to be compared in close proximity. Carefully consider font size and resolution, as readers
must be able to discern the elements of the tables and figures without the use of magnification.
Be sure that each table and figure is self-contained; the reader should be able to understand the
message of each without any additional information. Most importantly, remember that you must
have permission of the copyright holder to reproduce tables and figures; when doing so, add a
note giving credit to the original author.
Tables
The APA Manual includes a “Table Checklist” on page 150.
Refer the reader to tables in the text. Example: The means of group performance are
displayed in Table 3.
Tables may be either single- or double-spaced.
Tables include horizontal borders/rules only; they do not include vertical borders. Limit the
number of horizontal borders to the minimum necessary for readability. Include borders at
the top, the bottom, and under all headers and spanners.
Keep tables concise.
If tables contain duplicate rows or columns, consider combining them.
When creating multiple tables, be consistent in terminology, layout, titles, and headings.
Make sure that titles are brief but informative. The title may be used to explain abbreviations
used in the table (e.g., Hit and False-Alarm (FA) Proportions in Experiment 2).
Capitalize the major words and proper nouns in table titles.
Each column must have a heading, including the first column. Headings should be brief,
thereby reducing the column width.
In headings, capitalize the first word, proper nouns, and the first word after a colon or em
dash.
In table headings, use the symbol % to save space.
Leave a table cell empty if the data are not applicable. However, if the data were not
collected or not reported, put a dash in the cell and explain the dash in a general table note.
(For correlation matrices, use a dash in the cells on the diagonal, but do not write an
explanation.)
10
Point estimates (e.g., means, correlations, regression slopes) should be accompanied by
confidence intervals. Be sure to indicate the confidence level (e.g., 95%), and use this level
consistently throughout the paper. Report confidence intervals in separate columns or in
brackets.
Standard abbreviations and symbols can be used without explanation in tables. For non-
standard abbreviations, explain the abbreviation in the title (if appropriate) or in a table note.
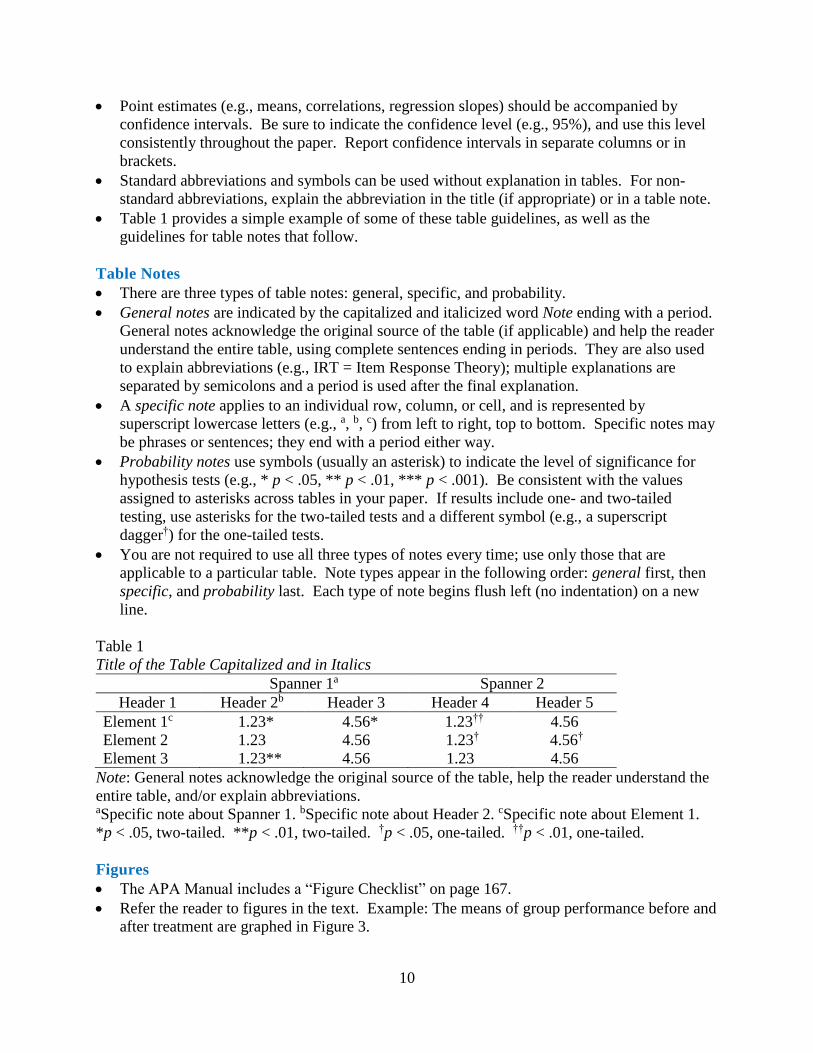
Table 1 provides a simple example of some of these table guidelines, as well as the
guidelines for table notes that follow.
Table Notes
There are three types of table notes: general, specific, and probability.
General notes are indicated by the capitalized and italicized word Note ending with a period.
General notes acknowledge the original source of the table (if applicable) and help the reader
understand the entire table, using complete sentences ending in periods. They are also used
to explain abbreviations (e.g., IRT = Item Response Theory); multiple explanations are
separated by semicolons and a period is used after the final explanation.
A specific note applies to an individual row, column, or cell, and is represented by
superscript lowercase letters (e.g., a, b, c) from left to right, top to bottom. Specific notes may
be phrases or sentences; they end with a period either way.
Probability notes use symbols (usually an asterisk) to indicate the level of significance for
hypothesis tests (e.g., * p < .05, ** p < .01, *** p < .001). Be consistent with the values
assigned to asterisks across tables in your paper. If results include one- and two-tailed
testing, use asterisks for the two-tailed tests and a different symbol (e.g., a superscript
dagger†) for the one-tailed tests.
You are not required to use all three types of notes every time; use only those that are
applicable to a particular table. Note types appear in the following order: general first, then
specific, and probability last. Each type of note begins flush left (no indentation) on a new
line.
Table 1
Title of the Table Capitalized and in Italics
Spanner 1a Spanner 2
Header 1 Header 2b Header 3 Header 4 Header 5
Element 1c 1.23* 4.56* 1.23†† 4.56
Element 2 1.23 4.56 1.23† 4.56†
Element 3 1.23** 4.56 1.23 4.56
Note: General notes acknowledge the original source of the table, help the reader understand the
entire table, and/or explain abbreviations. aSpecific note about Spanner 1. bSpecific note about Header 2. cSpecific note about Element 1.
*p < .05, two-tailed. **p < .01, two-tailed. †p < .05, one-tailed. ††p < .01, one-tailed.
Figures
The APA Manual includes a “Figure Checklist” on page 167.
Refer the reader to figures in the text. Example: The means of group performance before and
after treatment are graphed in Figure 3.

11
Use figures only if they convey additional information that (a) is not presented in the text and
(b) would not be presented more effectively with a table.
Use color and/or shading only if absolutely necessary.
Make figures clear, concise, and consistent (e.g., use the same scale for each graph, if
appropriate).
Make sure the graphic is large enough for its elements to be discernible.
Use legends, symbols, and shading that can be easily differentiated, especially when
presented in black and white.
Use a simple font such as Arial, Futura, Helvetica, or Sans Serif from 8-point to 14-point.
The figure should have a border.
The figure title should include acknowledgements, if any.
The figure title should include probability levels if statistical significance is indicated.
Capitalize the first word and proper nouns in figure titles.
Capitalize major words in legends, and place legends inside the figure borders.
All elements within the figure, as well as the scale, should be labeled and explained
(including axes).
In figure legends, use the symbol % to save space.
Figure notes provide any additional necessary information, including units of measurement,
symbols, and abbreviations that are not included in the legend or axis labels.
Distinguish between error bars and confidence intervals. If error bars are shown, report the
type of error displayed (e.g., standard error of the mean); if confidence intervals are shown,
report the confidence level (e.g., 95%).
Figure 1 provides a simple example of some of these guidelines.