a preliminary analysis of the economics of using ... · a preliminary analysis of the economics of...
TRANSCRIPT
ORNL/TM-2006/014
A Preliminary Analysis of the Economics of Using Distributed Energy as a Source
of Reactive Power Supply
April 2006 Prepared By: F. Fran Li John Kueck Tom Rizy Tom King Oak Ridge National Laboratory and Energetics Incorporated 901 D Street, SW Suite 100 Washington, DC 20024

A Preliminary Analysis of the Economics of Using ORNL/TM-2006/014 Distributed Energy as a Source of Reactive Power Supply
DOCUMENT AVAILABILITY
Reports produced after January 1, 1996, are generally available free via the U.S. Department of Energy (DOE) Information Bridge:
Web site: http://www.osti.gov/bridge Reports produced before January 1, 1996, may be purchased by members of the public from the following source:
National Technical Information Service 5285 Port Royal Road Springfield, VA 22161 Telephone: 703-605-6000 (1-800-553-6847) TDD: 703-487-4639 Fax: 703-605-6900 E-mail: [email protected] Web site: http://www.ntis.gov/support/ordernowabout.htm
Reports are available to DOE employees, DOE contractors, Energy Technology Data Exchange (ETDE) representatives, and International Nuclear Information System (INIS) representatives from the following source:
Office of Scientific and Technical Information P.O. Box 62 Oak Ridge, TN 37831 Telephone: 865-576-8401 Fax: 865-576-5728 E-mail: [email protected] Web site: http://www.osti.gov/contact.html
This report was prepared as an account of work sponsored by an agency of the United States Government. Neither the United States government nor any agency thereof, nor any of their employees, makes any warranty, express or implied, or assumes any legal liability or responsibility for the accuracy, completeness, or usefulness of any information, apparatus, product, or process disclosed, or represents that its use would not infringe privately owned rights. Reference herein to any specific commercial product, process, or service by trade name, trademark, manufacturer, or otherwise, does not necessarily constitute or imply its endorsement, recommendation, or favoring by the United States Government or any agency thereof. The views and opinions of authors expressed herein do not necessarily state or reflect those of the United States Government or any agency thereof.
This work was sponsored by the Department of Energy’s Office of Energy Efficiency and Renewable Energy, Distributed Energy Program. Prepared by Oak Ridge National Laboratory, P.O. Box 2008, Oak Ridge, Tennessee 37831-6285, managed by UT-Battelle, LLC, for the U.S. Department of Energy under contract DE-AC05-00OR22725.

A Preliminary Analysis of the Economics of Using Distributed Energy as a Source of Reactive Power Supply First Quarterly Report for Fiscal Year 2006 PREPARED FOR:
The U.S. Department of Energy PREPARED BY:
F. Fran Li John Kueck Tom Rizy Tom King Oak Ridge National Laboratory and Energetics Incorporated 901 D Street, SW Suite 100 Washington, DC 20024 APRIL 2006

A Preliminary Analysis of the Economics of Using Distributed Energy as a Source of Reactive Power Supply 5/26/2006
i Energetics Incorporated
EXECUTIVE SUMMARY Reactive power supply
is essential for reliable operation of the electric transmission
system. Inadequate supply of reactive power can contribute to voltage collapse, as demonstrated in several recent major power outages. In examining the causes of the August 14, 2003 Northeast blackout, the U.S.-Canada Power System Outage Task Force found that “insufficient reactive power was an issue.”1 Reactive power is one of a class of non-energy power system operating needs collectively known as ancillary services. Other ancillary services include regulation, synchronized and non-synchronized reserves, and Black Start Service. Reactive power is unique among other ancillary services in that it must be delivered throughout the transmission system in close proximity to load centers. Reactive power is provided by an array of generation and network devices, including generators, capacitors, synchronous condensers, static VAR compensators, and Static Synchronous Compensators (STATCOMs). Distributed energy devices also have the capability of producing reactive power and voltage support.2 Intuitively, there seems to be a good match between the requirement for reactive power supplies near load centers and the availability of distributed energy near or at customer loads. The statistics support the intuition that there is tremendous potential for distributed energy to be used for reactive power support. Over 10,000 MVAR of reactive power capability is estimated to be located close to the load. For comparison purposes, the entire New England Independent Service Operator has approximately 12,000 MVAR of available reactive power capacity. While the potential for distributed energy based reactive supply is great, presently the costs are higher than other readily available technologies, such as capacitors. However, not all these technologies provide the same kind of reactive support. Distributed energy based reactive supply can provide dynamic support capabilities that static devices like capacitors cannot match. Furthermore, industry experts believe that supplying reactive power from synchronized distributed energy sources can be 2 to 3 times more effective than providing reactive support in bulk from longer distances at the transmission or generation levels. Evaluating the economics of reactive power compensation is complex. There are no standard models or analysis tools. There are no fully functioning markets for reactive power in the U.S., so data on costs and benefits is difficult to find. It is an emerging area of analysis that is just beginning to attract attention of researchers and analysts. This is not surprising, given that the revenue flow associated with reactive power is less than 1% of the total US electricity market. However, the importance of reactive power as a component of a reliable power grid is not measured by its market share of power
1 See U.S.-Canada Power System Outage Task Force, Final Report on the August 14, 2003, Blackout in the United States and Canada: Causes and Recommendations, at 18 (April 2004). 2 Some examples of distributed energy are gas turbines, microturbines, reciprocating engines, and fuel cells.
A Preliminary Analysis of the Economics of Using Distributed Energy as a Source of Reactive Power Supply 5/26/2006
ii Energetics Incorporated
system sales. The role of reactive power in maintaining system reliability, especially during unforeseen system contingencies, is the reason for the growing interest by regulators and system operators alike in alternative reactive power supplies. To study the economic benefits of using distributed energy for reactive support service, it is necessary to know the capabilities of these distributed energy devices, their cost, and the possible revenue stream from consumers of reactive power services. The cost of providing reactive power includes capital costs as well as operating costs, such as fuel costs and operating expenses. Although the capital costs of capacitors and other static devices are much lower than for generators and network VAR devices, a static device is far less functional as it cannot adapt to rapid changes during system contingencies. Institutional arrangements for obtaining reactive power supplies include: (i) pay nothing to generators, but require that each generator be obliged to provide reactive power as a condition of grid connection; (ii) include within a generator’s installed capacity obligation an additional requirement to provide reactive power, with the generator’s compensation included in its capacity payment; (iii) pay nothing to generators (or include their reactive power obligations as part of their general capacity obligation), but compensate transmission owners and load serving entities for the revenue requirements of transmission-based solutions; (iv) determine prices and quantities for both generator-provided and transmission-based solutions through a market-based approach such as a periodic auction (for reactive power capability) or an ongoing spot market (for short-term reactive power delivery); and (v) centrally procure (likely on a zonal basis) reactive power capability and/or supplies according to a cost-based payment schedule set in advance. Currently there are no distributed energy devices receiving compensation for providing reactive power supply. However, some small generators have been tested and have the capability to be dispatched as a source of reactive power supply. There are also some instances, typically in urban centers where there is an imbalance between loads and reactive power supplies, where distributed energy based reactive service show competitive payback periods compared to other technologies. Several concerns need to be met for distributed energy to become widely integrated as a reactive power resource.
The overall costs of retrofitting distributed energy devices to absorb or produce reactive power need to reduced.
A mechanism is needed for ISOs/RTOs to be able to procure reactive power from the customer side of the meter, where distributed energy resides.
Novel compensation methods are needed to encourage the dispatch of dynamic resources close to areas with critical voltage issues.
A Preliminary Analysis of the Economics of Using Distributed Energy as a Source of Reactive Power Supply 5/26/2006
iii Energetics Incorporated
TABLE OF CONTENTS Executive Summary ..................................................................................................................... i
List of Acronyms ......................................................................................................................... v
Acknowledgements.................................................................................................................... vi
1. Introduction ............................................................................................................................1 1.1 Scope..............................................................................................................................1 1.2 Background .....................................................................................................................2 1.3 Methodology....................................................................................................................4
2. Distributed Energy Installations in the U.S. Electric Grid.........................................................5 2.1 Today’s DE Technologies................................................................................................6
3. Cost of Devices for Producing Reactive Power ......................................................................8 3.1 Pure Reactive Power Compensators................................................................................8 3.2 Generation Devices.........................................................................................................9 3.3 Demand Side Devices ...................................................................................................11 3.4 Transmission Devices ...................................................................................................11 3.5 Distributed Energy Resources with Oversized Generators or Inverters .........................12 3.6 Adjustable Speed Drives ...............................................................................................13
4. Reactive Power Provision Methods ......................................................................................14 4.1 RTOs/ISOs and Regional Reliability Councils in North America ....................................14 4.2 Institutional Arrangements for Reactive Power Compensation ......................................15 4.3 Compensation for Reactive Power Provision.................................................................17
4.3.1 United States.......................................................................................................17 4.3.2 VAR Working Groups ..........................................................................................19
4.4 Power Factor as a Proxy for Reactive Power Compensation.........................................21 4.5 Reactive Power Value ...................................................................................................22
5. Case Studies of Reactive Supply .........................................................................................24 5.1 Economic Analysis Methodologies ................................................................................24 5.2 Examples of Small Generators Receiving Reactive Compensation ...............................25 5.3 Synchronous Generators as an Alternative to Capacitors to Supply Reactive Power
for Growing Utilities .......................................................................................................27 5.4 Reactive Power Payments to a Large Generator...........................................................30
6. Economics of Hypothetical Examples...................................................................................36 6.1 Potential Economics of Reactive Service Support from Distributed Energy ...................36 6.2 Oversizing the Generator of a Distributed Energy Resource .........................................38 6.3 Oversizing the Inverter of a Distributed Energy Device..................................................39 6.4 Using Adjustable Speed Drives to Supply Reactive Power at West Point ......................40 6.5 Indirect Benefits of Reactive Power Supply ...................................................................42
7. Conclusions .........................................................................................................................45
APPENDIX A. Converting a Distributed Energy Device into a Synchronous Condenser ...........47
APPENDIX B. Additional Information on ISOs/RTOs ................................................................50
APPENDIX C. Overseas Reactive Power Compensation Practices ..........................................55

A Preliminary Analysis of the Economics of Using Distributed Energy as a Source of Reactive Power Supply 5/26/2006
iv Energetics Incorporated
APPENDIX D. MISO Ancillary Services Schedule 2 Pricing for Reactive Power and Voltage Control ......................................................................................................................................59
APPENDIX E. Description of a Voltage Collapse Diagnostic Software......................................61 Table of Figures Figure 1. Real Power and Reactive Power Relationship .............................................................2 Figure 2. Total Installed Capacity by DE Technology Smaller than 5 MW ...................................7 Figure 3. Average Costs of Reactive Power Technologies..........................................................9 Figure 4. 44.5 kVA Generator D Curve Source: SSS Clutch Company .....................................10 Figure 5. NERC Regional Coordinating Councils ......................................................................15 Figure 6. World Map of Reactive Compensation for Generators ...............................................21 Figure 7. Sample Power Factor Penalties for Various Utilities by Region..................................22 Figure 8. Generators under 10MW Qualified for Capacity Payments in ISO-NE .......................26 Figure 9. Average Power Factor at Lenoir City Utilities Board from August 2004 to July 2005 ..28 Figure 10. Payback Period for Distributed Energy Device Conversion to Synchronous
Condensers.......................................................................................................................37 Figure 11. A simple one-line power system...............................................................................42 Figure A-1. Elements of Basic SSS Clutch Source: SSS Clutch................................................47 Figure A-2. External View of an SSS Clutch System.................................................................48 Figure E-1. Reactive Reserves of Subnetworks in the Base Case ............................................62 Figure E-2. Reactive Reserves of Subnetworks after the Contingency......................................63 Figure E-3. Reactive Reserves of Subnetworks with Distributed Generation after the
Contingency ......................................................................................................................63 Figure E-4. Reactive Reserves of Subnetworks with Voltage Controlled Distributed Generation
after the Contingency ........................................................................................................64 Table of Tables Table 1. Number of Installed Distributed Energy Units Smaller than 5 MW .................................6 Table 2. Regional Comparison of ISO/RTO Arrangements for Reactive Power Compensation.20 Table 3. Summary of Reactive Power Value .............................................................................23 Table 4. Generators Receiving Capacity Payments ..................................................................27 Table 5. Cost Benefit Comparison between Capacitors and Synchronous Condensers ............29 Table 6. Total Reactive Cost of the Generator and Exciter........................................................31 Table 7. Reactive Power Fixed Costs Associated with the Ontelaunee Facility .........................32 Table 8. Generator and Transformer Losses.............................................................................33 Table 9. Summary of Some Approved FERC Filings for Generation Voltage Support ...............35 Table 10. Incremental Costs of Oversizing the Generator .........................................................38 Table 11. Equipment Rating for 3 Reactive Power Ratings .......................................................39 Table 12. Cost for additional MVAR Capability..........................................................................40 Table A-1. SSS Clutch Installations for Synchronous Condensing in the U.S............................48 Table A-2. Economic Justification for Clutch Retrofit.................................................................49 Table C-1. Regional Comparison of International Arrangements for Reactive Power
Compensation...................................................................................................................55
A Preliminary Analysis of the Economics of Using Distributed Energy as a Source of Reactive Power Supply 5/26/2006
v Energetics Incorporated
LIST OF ACRONYMS AVR ....................Active Voltage Regulators CHP ....................Combined Cooling, Heating and Power DE.......................Distributed Energy ECAR..................East Central Area Reliability Coordination Agreement ERCOT ...............Electric Reliability Council of Texas FACTS................Flexible AC Transmission Systems FERC..................Federal Energy Regulatory Commission FRCC..................Florida Reliability Coordinating Council GSU....................Generator Step-up Transformer IPP......................Independent Power Producer ISO......................Independent System Operator LSE.....................Load Serving Entity MAAC .................Mid-Atlantic Area Council MAIN...................Mid-America Interconnected Network MAPP..................Mid-Continent Area Power Pool MRO ...................Midwest Reliability Organization MWh ...................Megawatt-hour NERC..................North American Electricity Reliability Council NPCC..................Northeast Power Coordinating Council ORNL..................Oak Ridge National Laboratory PF .......................Power Factor PV.......................Photovoltaic RPS ....................Renewable Portfolio Standards RTO ....................Regional Transmission Organization SERC..................Southeastern Electric Reliability Council SPP.....................Southwest Power Pool TO.......................Transmission Owner WECC.................Western Electricity Coordinating Capacity

A Preliminary Analysis of the Economics of Using Distributed Energy as a Source of Reactive Power Supply 5/26/2006
vi Energetics Incorporated
ACKNOWLEDGEMENTS This report was prepared by Energetics Incorporated under contract DE-AC05-00OR22725 solicitation number 6400004866 to the Oak Ridge National Laboratory. The report was prepared by Brian Marchionini and Ndeye K. Fall with Fran Li, John Kueck, Tom Rizy and Tom King of Oak Ridge National Laboratory. Over several months, a number of representatives were contacted from American Electric Power, Southern California Edison, Consolidated Edison, American Superconductor, U.S. Department of Energy National Laboratories, and the ISOs/RTOs. Useful ideas and suggestions were also received from Morgan Hendry, Dave Hadleman, Dave Bertagnolli, Craig Dunn, Rudy Perez, Robert Schlueter, Dale Bradshaw, and Steve Wolford. Finally, we acknowledge the technical input and organizational suggestions of Grayson Heffner and Rich Scheer.
A Preliminary Analysis of the Economics of Using Distributed Energy as a Source of Reactive Power Supply 5/26/2006
1 Energetics Incorporated
1. INTRODUCTION 1.1 Scope The objective of this report is to evaluate the potential of distributed energy (DE) in providing reactive power support to the North American power grid. DE can provide the needs of a local load directly and/or inject reactive power into the power grid to support voltage. Cost data is required of reactive power compensation devices, payments made to reactive power providers, and penalties charged to retail customers. Performing such an evaluation is complex, as the application of DE in providing network services is novel. For purposes of this report, distributed energy includes such devices as microturbines, industrial gas turbines, fuel cells, reciprocating engine generators, and photovoltaics, which are often installed at or near electrical loads. These resources can be controlled to correct the current phase angle and eliminate reactive power flow. They can also be controlled to regulate local voltage. Some distributed energy devices contain synchronous generators, which can be directly connected to the local power system, and some, such as fuel cells or microturbines, must be interfaced to the local power system through an inverter. Similar to a synchronous generator, the inverter can also be designed and controlled to “inject” reactive power locally and regulate voltage. The use of inverters for reactive power supply will also be investigated in this report. The benefits of DE are well defined in other documents and will not be discussed in this report.3 Similarly, this report will not discuss the barriers to distributed energy, given the excellent resources currently available.4 A novel methodology for reactive power supply is through the use of adjustable speed drives. These technologies have been primarily used to modulate the speed of fluid and air in pumps and fans to increase energy efficiency instead of using shunt valves and dampers. Adjustable speed drives are not a new technology by themselves, but during the writing of this report, it was learned that they can be configured to regulate power factor. The potential of adjustable speed drives for reactive power supply is not part of the scope of this project, but warrants further exploration. Reactive power from DE offers the potential to provide reactive power compensation on a distributed and dynamic basis corresponding to the dynamic and spatial variation of reactive power needs. Intuitively, it seems there is a good match between the requirement for reactive power compensation to be provided adjacent or near to load pockets and the growth and availability of distributed energy located at or near customer loads. This report will evaluate the potential for distributed energy to play a larger role than at present in relieving voltage stability problems due to reactive power dispatch and shortfall problems throughout the U.S. electric grid.
3 http://www.nrel.gov/docs/fy03osti/34636.pdf; http://www.eere.energy.gov/de/pdfs/der_benefits.pdf 4 Case Studies of Interconnection Barriers and their Impact on Distributed Power Projects, NREL, July 2000, http://www.nrel.gov/docs/fy00osti/28053.pdf

A Preliminary Analysis of the Economics of Using Distributed Energy as a Source of Reactive Power Supply 5/26/2006
2 Energetics Incorporated
1.2 Background Total power is derived of two components, real power and reactive power. Real power runs motors and lights lamps while reactive power supports the voltages that must be controlled for system reliability. You need both of these components for alternating current systems. An analogy to describe this relationship uses the flight of an airplane. The distance a plane travels from one point to another is analogous to real power. The plane must reach a certain altitude, the reactive power, to find a smooth line of air to travel within and to avoid undulations in the topography. While the height the plane flies at doesn’t do any useful work to get the passengers to their destination, it is a necessary component of airline travel. Similarly, reactive power is a necessary component in electricity flow through the grid. Figure 1 shows a depiction of this relationship.
Reactive power can be positive or negative depending on whether current peaks before or after voltage. Examples of inductive loads are devices that have motors such as fans and pumps, but also transformers, and fluorescent light ballasts. Reactive power flow can cause increased losses and excessive voltage sags, leading to potential voltage collapse and blackout of a power system. Reactive power is measured in volt-amperes reactive or VAR and can be either “lagging” where current lags voltage, (corresponding to inductive reactance) or “leading” where current leads voltage, (corresponding to capacitive reactance). Invariably the electric system is lagging, or generating too much inductive reactance, which must be compensated with capacitance. Reactive power supply, or voltage support/control, is just one of several services that are provided as an ancillary requirement to the everyday operation of regional power transmission systems and wholesale power markets. Other necessary services, collectively called Ancillary Services, include Spinning Reserve, Regulation, and Contingency (or Supplemental) Reserve.5 It is variously estimated that providing this
5 Creating Competitive Markets for Ancillary Services, Eric Hirst and Brendan Kirby, ORNL CON. 448, October 1997, http://www.ornl.gov/sci/btc/apps/Restructuring/con448.pdf; Frequency Regulation Basics and Trends, December 2004, ORNL/TM-2004/291, Brendan J. Kirby, http://www.ornl.gov/~webworks/cppr/y2001/rpt/122302.pdf
Figure 1. Real Power and Reactive Power Relationship
A Preliminary Analysis of the Economics of Using Distributed Energy as a Source of Reactive Power Supply 5/26/2006
3 Energetics Incorporated
bundle of ancillary services costs the equivalent of 10 to 20% of the delivered cost of electric energy primarily because of the very high cost of regulation service.6 Unlike most ancillary services, reactive power supply must be provided locally in direct proportion to the distribution of load across a network and the proximity between generators and load centers. Reactive power can be produced from either static or dynamic sources. Static sources are typically transmission and distribution equipment, such as capacitors at substations out on the network, and their cost has historically been included in the revenue requirement of the transmission owner (TO), and recovered through cost-of-service rates. By contrast, dynamic sources are typically energy equipment, including generators capable of producing both real and reactive power, and synchronous condensers, which produce only reactive power. This energy equipment may be owned either by TOs or independent entities.7 The total reactive power supply needed to maintain voltage stability generally varies as a function of the transmission line loading, with heavily loaded lines requiring more reactive power. This variability makes it necessary for ISOs and RTOs to constantly adjust for the reactive power needs of the electric grid. As part of their grid security responsibilities, system planners will prepare contingency studies to model the electric grid system under a broad range of conditions to ensure that the grid has adequate reserves when transmission lines or generators are down, or loading is very high. Normally, power systems are operated to handle the loss of a major generator or transmission line (N-1 contingency). Provisions for supplying ancillary services in the electric grid, including reactive power, have become considerably more complicated with the advent of wholesale market deregulation and creation of regional grid organizations including ISOs and RTOs. Entities that generate electric power are different from those that transmit it from one area to the other, and different again from the entities that purchase power wholesale and resell it to retail consumers. Regardless of ownership, power cannot be transmitted and delivered over long distances without sufficient reactive power supply to maintain voltage stability along its path. Another difficulty is the fact that electric power doesn’t necessarily flow along contracted flows and follows the path of least conductor impedance. Arrangements for ensuring sufficiency of reactive power as a planning proposition and an operational requirement are the shared responsibility of regional reliability councils under the North American Electricity Reliability Council’s (NERC) regional councils, regional ISO/RTOs, balancing authorities, and load-serving entities. Topical interest in voltage support and reactive power compensation issues increased considerably as a result of the August 2003 Northeast black-out, which identified failure of the Load Serving Entities (LSE) to monitor and manage reactive reserves for various contingency conditions as a causative element.8 Based on this analysis the Federal Energy Regulatory Commission (FERC) staff undertook a more detailed analysis of 6 Allocating Costs of Ancillary Services: Contingency Reserves and Regulation, June 2003, ORNL/TM-2003/152, Eric Hirst and Brendan Kirby, http://www.ornl.gov/sci/btc/apps/Restructuring/tm2003_152.pdf 7 Principles for Efficient and Reliable Reactive Power Supply and Compensation, FERC Staff Report, Docket No. AD-05-01-1000, February 2005, http://www.ferc.gov/EventCalendar/Files/20050310144430-02-04-05-reactive-power.pdf 8 U.S.-Canada Power System Outage Task Force Final Report on the August 14, 2003 Blackout in the United States and Canada: Causes and Recommendations, Joint US-Canada Power System Outage Task Force, April 2004., p. 17, ftp://www.nerc.com/pub/sys/all_updl/docs/blackout/ch1-3.pdf
A Preliminary Analysis of the Economics of Using Distributed Energy as a Source of Reactive Power Supply 5/26/2006
4 Energetics Incorporated
reactive power compensation issues, an effort that recently culminated in release of a report entitled Principles for Efficient and Reliable Reactive Power Supply and Compensation.3 As a complement to these previous efforts, Oak Ridge National Laboratory (ORNL) is evaluating the conditions necessary to create an effective market for reactive power and the role DE can play in this market to strengthen the U.S electric grid.9 1.3 Methodology This economic study started by determining the potential of distributed energy devices in the United States (Chapter 2). It also necessitated a thorough literature review and phone and e-mail interviews with generators, transmission owners, and industry experts to establish existing forms of reactive power costs and performance data (Chapter 3). Chapter 4 illustrates the data collected from representatives of Regional Transmission Operators (RTOs) and Independent System Operators (ISOs) to ascertain payments made for reactive power supply. Utility websites were also explored to determine various levels of power factor correction penalties. Once cost and compensation data were collected, a thorough search was conducted to establish case studies of distributed energy based reactive power supply, which is outlined in Chapter 5. A detailed example of the reactive power revenue requirement for a large generator is also documented. The economics of hypothetical examples were then developed and are explained in Chapter 6. Specifically outlined are the necessary payments for reactive power from distributed energy to be cost competitive. Finally, the major conclusions of the report were summarized in Chapter 7.
9 J. Kueck, B. Kirby, L. Tolbert, T. Rizy, "Tapping Distributed Energy Resources", Public Utilities Fortnightly, September 2004, pages 46-51
A Preliminary Analysis of the Economics of Using Distributed Energy as a Source of Reactive Power Supply 5/26/2006
5 Energetics Incorporated
2. DISTRIBUTED ENERGY INSTALLATIONS IN THE U.S. ELECTRIC GRID
Distributed energy offers potential solutions to many of the nation's most pressing energy and electric power problems, including blackouts, energy security concerns, power quality issues, tighter emissions standards, transmission bottlenecks, difficulties in locating large new energy facilities, and the desire of energy users for greater control over energy reliability and energy costs. The Department of Energy’s “Grid 2030” vision document6 articulates a future scheme/configuration for the power grid in which a fully automated power delivery network monitors and controls every customer and node, ensuring a two-way flow of electricity and information between the power plant and the appliance, and all points in between. This grid of the future would include extensive distributed generation and storage systems, along with distributed intelligence, broadband communications, and self-healing capability, as essential components.10 The 2030 Vision document specifically foresees a network of micro and mini grids in which advances in DE systems and hydrogen energy technologies enable the dual use of transportation vehicles for stationary power generation. For example, hydrogen powered vehicles would provide electricity to the local distribution system when parked in the garage at home or at work. There is a considerable variety of DE systems currently in place, and this variety will no doubt increase as new technologies specifically developed for distributed applications become more economical and thus more commonplace. Table 1 summarizes the mix of DE technologies currently in place (as of 2004). This mix is likely to change considerably over the next 20 years, as more and more renewable and other advanced DE technologies are added to the grid. Among the policy and regulatory developments that will likely increase the adoption of DE is Renewable Portfolio Standards (RPS). A total of 18 states, representing 40% of the U.S. electric load, have developed RPS with the goal of diversifying their electricity sources and reducing greenhouse gas emissions. States such as California, Hawaii, New York and Maine have goals of producing a minimum of 20% of their electricity generation from renewables by 2010. The U.S. Department of Energy has set a goal of having 92 GW of Combined Heat and Power (CHP) generation by 2010. As most renewable-based power production comes from DE systems, these goals have helped put DE at the forefront of federal and state R&D efforts.
10 Grid 2030, A National Vision of Electricity’s Second 100 Years, U.S. Department of Energy, Office of Electric Transmission and Distribution, July 2003
A Preliminary Analysis of the Economics of Using Distributed Energy as a Source of Reactive Power Supply 5/26/2006
6 Energetics Incorporated
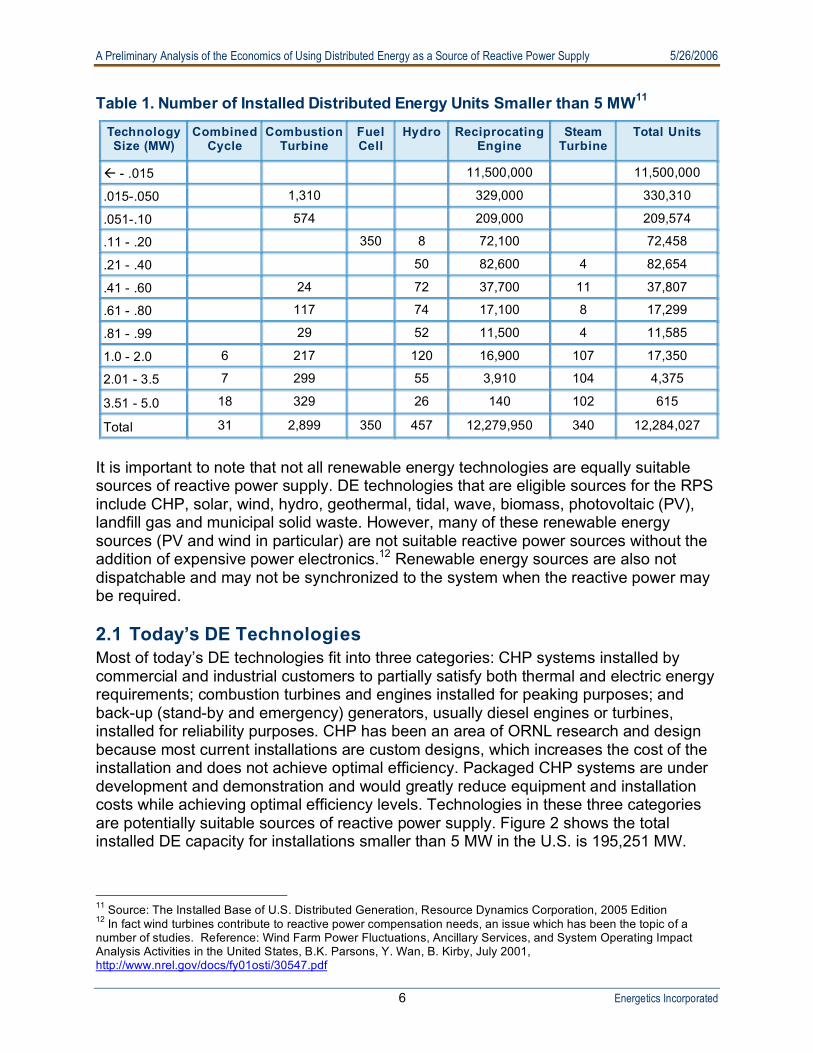
Table 1. Number of Installed Distributed Energy Units Smaller than 5 MW11 Technology Size (MW)
Combined Cycle
Combustion Turbine
Fuel Cell
Hydro Reciprocating Engine
Steam Turbine
Total Units
- .015 11,500,000 11,500,000
.015-.050 1,310 329,000 330,310
.051-.10 574 209,000 209,574
.11 - .20 350 8 72,100 72,458
.21 - .40 50 82,600 4 82,654
.41 - .60 24 72 37,700 11 37,807
.61 - .80 117 74 17,100 8 17,299
.81 - .99 29 52 11,500 4 11,585
1.0 - 2.0 6 217 120 16,900 107 17,350
2.01 - 3.5 7 299 55 3,910 104 4,375
3.51 - 5.0 18 329 26 140 102 615
Total 31 2,899 350 457 12,279,950 340 12,284,027
It is important to note that not all renewable energy technologies are equally suitable sources of reactive power supply. DE technologies that are eligible sources for the RPS include CHP, solar, wind, hydro, geothermal, tidal, wave, biomass, photovoltaic (PV), landfill gas and municipal solid waste. However, many of these renewable energy sources (PV and wind in particular) are not suitable reactive power sources without the addition of expensive power electronics.12 Renewable energy sources are also not dispatchable and may not be synchronized to the system when the reactive power may be required. 2.1 Today’s DE Technologies Most of today’s DE technologies fit into three categories: CHP systems installed by commercial and industrial customers to partially satisfy both thermal and electric energy requirements; combustion turbines and engines installed for peaking purposes; and back-up (stand-by and emergency) generators, usually diesel engines or turbines, installed for reliability purposes. CHP has been an area of ORNL research and design because most current installations are custom designs, which increases the cost of the installation and does not achieve optimal efficiency. Packaged CHP systems are under development and demonstration and would greatly reduce equipment and installation costs while achieving optimal efficiency levels. Technologies in these three categories are potentially suitable sources of reactive power supply. Figure 2 shows the total installed DE capacity for installations smaller than 5 MW in the U.S. is 195,251 MW.
11 Source: The Installed Base of U.S. Distributed Generation, Resource Dynamics Corporation, 2005 Edition 12 In fact wind turbines contribute to reactive power compensation needs, an issue which has been the topic of a number of studies. Reference: Wind Farm Power Fluctuations, Ancillary Services, and System Operating Impact Analysis Activities in the United States, B.K. Parsons, Y. Wan, B. Kirby, July 2001, http://www.nrel.gov/docs/fy01osti/30547.pdf

A Preliminary Analysis of the Economics of Using Distributed Energy as a Source of Reactive Power Supply 5/26/2006
7 Energetics Incorporated
Reactive power-capable DE, for the purposes of this report, is defined as electricity generation sources ranging between 1 and 5 MW, synchronously connected to local distribution or transmission networks, and capable of manual or automatic adjustment to operate at a lagging or leading power factor.13 It is estimated that 10% of the 195,251 MW is capable for VAR support; this is discussed later in the report.
13 As with larger generators, the leading technology by far in DE installations of less than 1 MW is reciprocating engines used for emergency units. The total number of installed DE units smaller than 1 MW is 12,284,027 including 12,279,950 reciprocating engines. DE installations statistics will not include large scale renewable electricity production, including wind farms. 14 Graph includes DE Installations smaller than 5 MW only; Source: The Installed Base of U.S. Distributed Generation, Resource Dynamics Corporation, 2005 Edition 15 The Installed Base of U.S. Distributed Generation, Resource Dynamics Corporation, 2005 Edition
Reciprocating Engine,
190,889 MW
Combined Cycle,
108 MWFuel Cell, 70 MW
Combustion Turbine,
2,662 MW
Hydro, 578 MWSteam Turbine, 944 MW
Combined Cycle Combustion Turbine Fuel Cell Hydro Reciprocating Engine Steam Turbine
Figure 2. Total Installed Capacity by DE Technology14 Smaller than 5 MW15

A Preliminary Analysis of the Economics of Using Distributed Energy as a Source of Reactive Power Supply 5/26/2006
8 Energetics Incorporated
3. COST OF DEVICES FOR PRODUCING REACTIVE POWER
Reactive power devices can be characterized as dynamic or static depending on their location and functionality. Static reactive power supply is most commonly found embedded in the distribution system and provided by capacitors, load tap changers on transformers, and reactors. However, static reactive power supply cannot respond to load changes rapidly. This is the primary disadvantage of static reactive reserves and the reason that the dynamic reactive reserves attract increasing research interests. Also, these types of devices are lumpy in that they provide step changes in compensation rather than a continuous change. Dynamic reactive power may be provided by devices in the following three categories:
Pure reactive power compensators such as synchronous condensers and solid-state devices such as static VAR compensators (SVC), static compensators (STATCOM), D-VAR, and SuperVAR. They are typically considered as transmission service devices.
Distributed energy resources with oversized generators or inverters to provide a broader range of reactive power. These DERs include diesel engine generators, fuel cells, microturbines, etc. Conventionally, they are purchased to provide backup real power (MW) supply under emergency with a limited range of reactive power output. To increase the capability of supplying reactive power, some upgrades are necessary such as oversizing the generator for diesel engine generators and oversizing the inverters for fuel cells and microturbines. These resources are considered generation service or demand-side service depending on ownership and sizes.
Adjustable speed drives to supply reactive power. Adjustable speed drives (ASD) are energy saving devices that can be also used to supply a broader range of leading or lagging reactive power. ASDs can still provide full torque without a reduction in service if they are designed to carry extra current. Like customer-owned DER, ASDs are also a demand-side service.
3.1 Pure Reactive Power Compensators The cost of providing reactive power includes capital costs as well as operating costs, including fuel costs and operating expenses. Capital costs of static power sources such as capacitors are much lower than the capital costs of dynamic sources such as the SVC or D-VAR; however, a static device will solely supply or absorb reactive power in set increments or quantity. The cost of providing reactive power from non-generating reactive power devices is basically their capital cost and O&M expense, as they have no fuel requirements.
A Preliminary Analysis of the Economics of Using Distributed Energy as a Source of Reactive Power Supply 5/26/2006
9 Energetics Incorporated
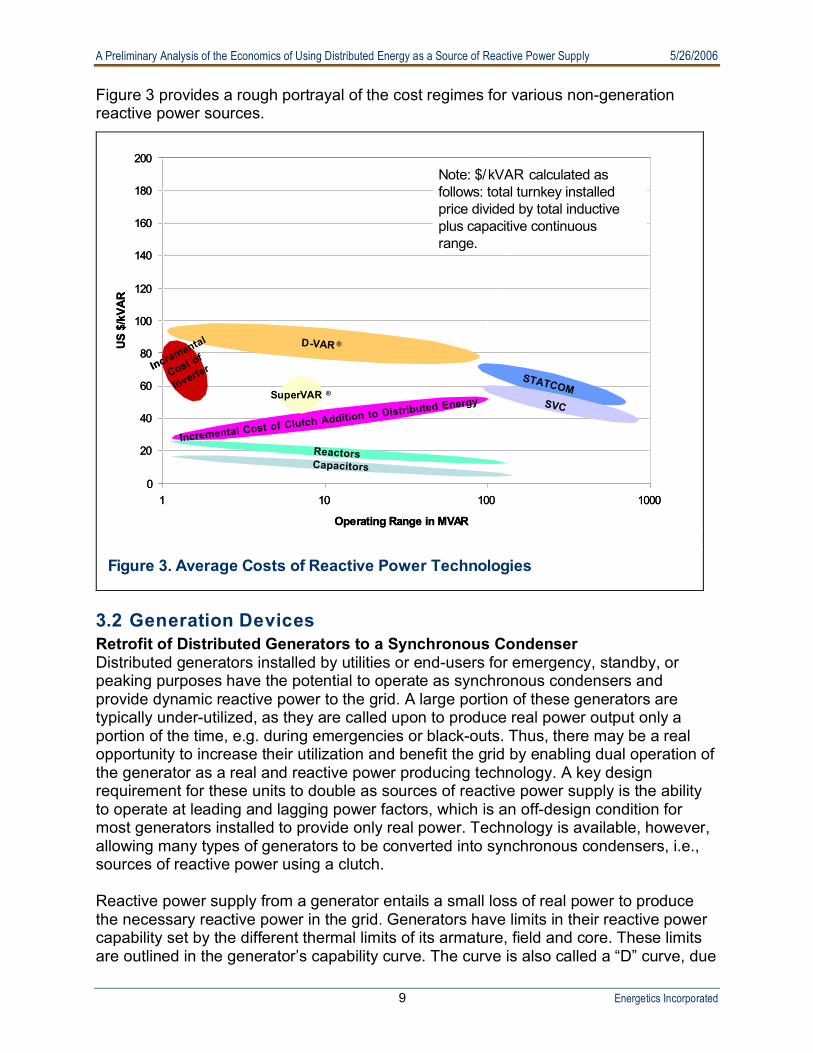
Figure 3 provides a rough portrayal of the cost regimes for various non-generation reactive power sources.
3.2 Generation Devices Retrofit of Distributed Generators to a Synchronous Condenser Distributed generators installed by utilities or end-users for emergency, standby, or peaking purposes have the potential to operate as synchronous condensers and provide dynamic reactive power to the grid. A large portion of these generators are typically under-utilized, as they are called upon to produce real power output only a portion of the time, e.g. during emergencies or black-outs. Thus, there may be a real opportunity to increase their utilization and benefit the grid by enabling dual operation of the generator as a real and reactive power producing technology. A key design requirement for these units to double as sources of reactive power supply is the ability to operate at leading and lagging power factors, which is an off-design condition for most generators installed to provide only real power. Technology is available, however, allowing many types of generators to be converted into synchronous condensers, i.e., sources of reactive power using a clutch. Reactive power supply from a generator entails a small loss of real power to produce the necessary reactive power in the grid. Generators have limits in their reactive power capability set by the different thermal limits of its armature, field and core. These limits are outlined in the generator’s capability curve. The curve is also called a “D” curve, due
0
20
40
60
80
100
120
140
160
180
200
1 10 100 1000
Operating Range in MVAR
US
$/k
VA
R
Reactors
STATCOM
SVC
D-VAR ®
Capacitors
Note: $/kVAR calculated as follows: total turnkey installed price divided by total inductive plus capacitive continuous range.
Incremental Cost of Clutch Addition to Distributed EnergySuperVAR ®
Incremental
Cost of
Inverter
Figure 3. Average Costs of Reactive Power Technologies
A Preliminary Analysis of the Economics of Using Distributed Energy as a Source of Reactive Power Supply 5/26/2006
10 Energetics Incorporated
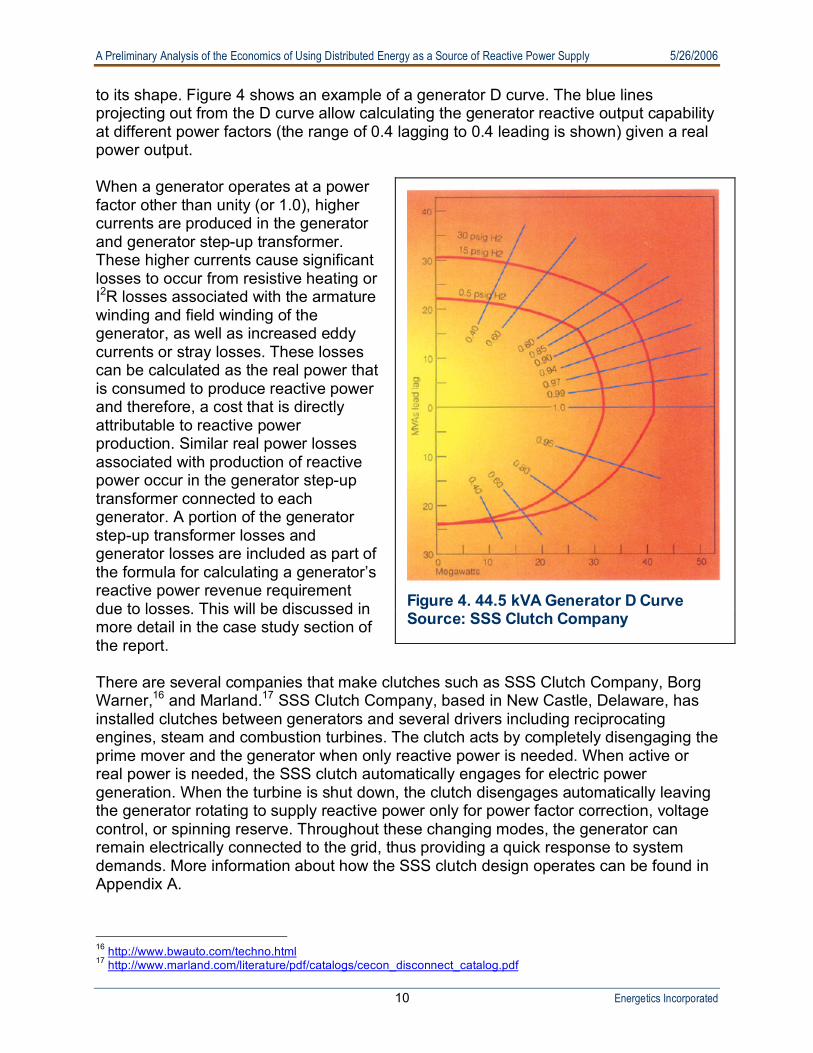
to its shape. Figure 4 shows an example of a generator D curve. The blue lines projecting out from the D curve allow calculating the generator reactive output capability at different power factors (the range of 0.4 lagging to 0.4 leading is shown) given a real power output. When a generator operates at a power factor other than unity (or 1.0), higher currents are produced in the generator and generator step-up transformer. These higher currents cause significant losses to occur from resistive heating or I2R losses associated with the armature winding and field winding of the generator, as well as increased eddy currents or stray losses. These losses can be calculated as the real power that is consumed to produce reactive power and therefore, a cost that is directly attributable to reactive power production. Similar real power losses associated with production of reactive power occur in the generator step-up transformer connected to each generator. A portion of the generator step-up transformer losses and generator losses are included as part of the formula for calculating a generator’s reactive power revenue requirement due to losses. This will be discussed in more detail in the case study section of the report. There are several companies that make clutches such as SSS Clutch Company, Borg Warner,16 and Marland.17 SSS Clutch Company, based in New Castle, Delaware, has installed clutches between generators and several drivers including reciprocating engines, steam and combustion turbines. The clutch acts by completely disengaging the prime mover and the generator when only reactive power is needed. When active or real power is needed, the SSS clutch automatically engages for electric power generation. When the turbine is shut down, the clutch disengages automatically leaving the generator rotating to supply reactive power only for power factor correction, voltage control, or spinning reserve. Throughout these changing modes, the generator can remain electrically connected to the grid, thus providing a quick response to system demands. More information about how the SSS clutch design operates can be found in Appendix A.
16 http://www.bwauto.com/techno.html 17 http://www.marland.com/literature/pdf/catalogs/cecon_disconnect_catalog.pdf
Figure 4. 44.5 kVA Generator D Curve Source: SSS Clutch Company

A Preliminary Analysis of the Economics of Using Distributed Energy as a Source of Reactive Power Supply 5/26/2006
11 Energetics Incorporated
3.3 Demand Side Devices
Inverters There are a number of distributed energy devices including fuel cells, microturbines, photovoltaics, and wind turbines that utilize solid-state inverters as the interface between the prime mover and the distribution network. Inverters with modern digital signal processor-based control systems have the potential to offer an economical, highly flexible means to control both real and reactive power flows under normal operating conditions. A study was conducted by MTechnology, Inc. to determine the marginal cost of reactive power capability in a 1 MW fuel cell/microturbine hybrid.18 They determined the marginal cost of adding reactive power capabilities to their hybrid device is between $56 and $93 per kVAR. The marginal cost per installed kVAR increases as the reactive power capability is increased. Adjustable Speed Drives Adjustable speed drives are devices that change the voltage magnitude and frequency at the motor terminals. Adjustable speed drives save energy because motors that drive pumps or fans can be easily controlled to supply a precise amount of water or air that is needed, without wasted energy. When a pump or fan is used in an application where the flow requirement varies, as they often are, controlling the pump flow with an adjustable speed drive instead of a throttle valve can often save energy equal to one half the horsepower rating of the motor. Adjustable speed drives could potentially be used to change power factor. They could be configured to present a lagging, 1.0, or even a leading power factor. The use of adjustable speed drives for power factor correction warrants further analysis. 3.4 Transmission Devices
Synchronous condensers A synchronous condenser is a synchronous motor without mechanical load that can be controlled to generate or absorb reactive power by changing its field excitation. The synchronous condenser can also dynamically supply reactive power and adjust its output depending on system conditions. It requires real power to operate and its response is slow (in the order of seconds). In addition, the synchronous machines are costly to purchase initially, and they have internal losses, which present a continuous operating cost. Generally, an average cost for synchronous condensers varies from $10 to $40 per kVAR and maintenance is about from $0.4 to $0.8/kVAR per year. Static VAR Compensators Static VAR Compensators (SVCs) are shunt capacitors and reactors connected via thyristors that operate as power electronics switches. They can consume or produce reactive power at speeds in the order of milliseconds. One main disadvantage of the SVCs is that their reactive power output varies according to the square of the voltage they are connected to, similar to capacitors. As a result, an SVC has no limited ability to mitigate voltage instability, leading to voltage collapse situations. An average cost for 18 Marginal Cost of Reactive Power Capability in a 1 MW Distributed Energy Resource, Stephen Fairfax, Neal Dowling, Daniel Healey, Katherine Poole, MTechnology, Inc.
A Preliminary Analysis of the Economics of Using Distributed Energy as a Source of Reactive Power Supply 5/26/2006
12 Energetics Incorporated
SVCs that allow rapid switching between capacitors and reactors varies from $40 to $60 per kVAR. An SVC with capacitors will only cost $30 to $50 per kVAR. Static Compensator (STATCOM) STATCOM are power electronics based SVCs. They use gate turn off thyristors or Insulated Gate Bipolar Transistors (IGBT) to convert a DC voltage input to an AC signal chopped into pulses that are recombined to correct phase angle between voltage and current. While capacitors and reactors cost $10 to $20 and $20 to $30 per kVAR respectively, STATCOM cost $55 to $70 per kVAR in large systems sized at 100 MVAR or more. STATCOM have a slightly smaller footprint that SVC because they use power electronics instead of capacitors and reactors. STATCOMS have a response time in the order of microseconds. Dynamic VAR (D-VAR®) System The Dynamic VAR (D-VAR®) system is an advanced STATCOM technology, developed by American Superconductor. The D-VAR® is a dynamic FACTS device with specialized software to control reactive power output in several sophisticated ways. Its price depends on size. The D-VAR responds to voltage dips by dynamically injecting exact amounts of reactive power. The system can prevent voltage collapse and uncontrolled loss of load when critical transmission elements fail. It can control capacitors and regulate steady state voltages and provides reactive power support to wind farms. The D-VAR also protects critical manufacturing operations from voltage sags. One of the most important features of the D-VAR system is its overload ability, which enables it to inject anywhere up to 3 times its continuous rating for several seconds. This feature is particularly useful in addressing transmission voltage stability problems or to improve power quality and correct voltage sags of incoming power sources. D-VAR systems can range anywhere from 2 MVA to over 100 MVA in size and the smallest units cost approximately $200,000. The price per kVAR varies from $80/kVAr to $100/kVAr for the total installed cost depending on the site specifics, and the price becomes more competitive as the unit gets larger in size. SuperVAR The SuperVAR is a High Temperature Superconductor (HTS) Dynamic Synchronous Condenser meant to run continuously, costing between $1 million and $1.2 million. The SuperVAR machine, developed by American Superconductor, dynamically absorbs or generates reactive power, depending on the needs of the grid. A SuperVAR is rated at 10 MVA but its first prototype demonstrated at the Tennessee Valley Authority (TVA) in Gallatin, TN was 8 MVA. The device responds instantly to disturbances such as lightning, short circuits, and equipment failures. It allows pure voltage regulation on a continuous basis, mitigates voltage flicker, and provides power factor correction. TVA installed the first prototype of the machine to mitigate a flicker problem from a steel mill. 3.5 Distributed Energy Resources with Oversized Generators or
Inverters Oversizing the Generator of a Distributed Energy Device One of the ways a distributed energy device could potentially provide additional VAR support is by oversizing its generator. This approach usually applies to a diesel engine

A Preliminary Analysis of the Economics of Using Distributed Energy as a Source of Reactive Power Supply 5/26/2006
13 Energetics Incorporated
generator, which contains an internal combustion engine (ICE) and a synchronous generator. Oversizing the generator involves taking out the existing motor of a DG device and replacing it with a larger motor. This will not produce any additional real power, but will produce more reactive power. This modification will also not change the footprint of the unit or require it to undergo any additional siting or permitting. Oversizing the generator is an effective way to save on cost per kVAR. The cost for oversizing is estimated in the range of $30 to $35/kVAR and remains close to constant as the reactive power ability is increased. Oversizing the Inverter of a Distributed Energy Device An inverter that is connected with a distributed energy device such as a fuel cell or a microturbine can provide dynamic control of real and reactive power. The solid-state inverters have quicker response and a larger reactive power adjustment range at rated real power than the excitation circuit of the synchronous machines. Although conventionally the range of the reactive power supply from such devices is limited, it is possible to upgrade the inverters to supply reactive power in a much larger range. Oversizing of the inverter will significantly increase the range of reactive power supply. Basically, the approximate marginal cost per kVAR is about $56 to $93/kVAR and this marginal cost increases as the reactive power ability is increased. 3.6 Adjustable Speed Drives Adjustable speed drives are devices that change the voltage magnitude and frequency at the motor terminals. Adjustable speed drives are tremendous energy savers because motors that drive pumps or fans can be easily controlled to supply just the amount of water or air that is needed, with no wasted energy. Reactive power could be supplied at the motor terminals, where it does the most good in reducing losses. The cost of installing adjustable speed drives is usually amortized by the energy savings realized by the reduction of losses in the air or water flow. Adjustable speed drives are often paid back in six months or less because of their energy savings. Some utilities offer rebates for the installation of adjustable speed drives. For this reason, we will not consider the cost of installing the drives. If they are warranted by the conventional energy savings analysis, their cost will be quickly amortized. Therefore, the use of ASD will lead to a net savings from the viewpoint of reactive power supply as long as local compensation is needed.
A Preliminary Analysis of the Economics of Using Distributed Energy as a Source of Reactive Power Supply 5/26/2006
14 Energetics Incorporated
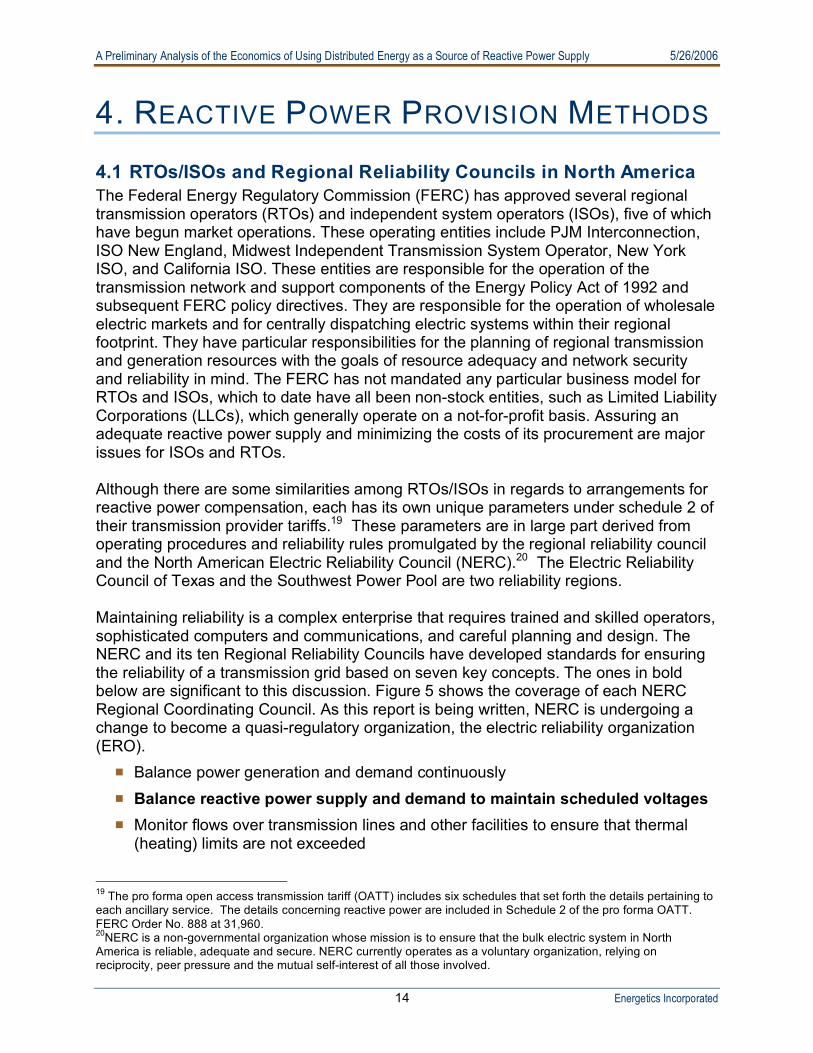
4. REACTIVE POWER PROVISION METHODS 4.1 RTOs/ISOs and Regional Reliability Councils in North America The Federal Energy Regulatory Commission (FERC) has approved several regional transmission operators (RTOs) and independent system operators (ISOs), five of which have begun market operations. These operating entities include PJM Interconnection, ISO New England, Midwest Independent Transmission System Operator, New York ISO, and California ISO. These entities are responsible for the operation of the transmission network and support components of the Energy Policy Act of 1992 and subsequent FERC policy directives. They are responsible for the operation of wholesale electric markets and for centrally dispatching electric systems within their regional footprint. They have particular responsibilities for the planning of regional transmission and generation resources with the goals of resource adequacy and network security and reliability in mind. The FERC has not mandated any particular business model for RTOs and ISOs, which to date have all been non-stock entities, such as Limited Liability Corporations (LLCs), which generally operate on a not-for-profit basis. Assuring an adequate reactive power supply and minimizing the costs of its procurement are major issues for ISOs and RTOs. Although there are some similarities among RTOs/ISOs in regards to arrangements for reactive power compensation, each has its own unique parameters under schedule 2 of their transmission provider tariffs.19 These parameters are in large part derived from operating procedures and reliability rules promulgated by the regional reliability council and the North American Electric Reliability Council (NERC).20 The Electric Reliability Council of Texas and the Southwest Power Pool are two reliability regions. Maintaining reliability is a complex enterprise that requires trained and skilled operators, sophisticated computers and communications, and careful planning and design. The NERC and its ten Regional Reliability Councils have developed standards for ensuring the reliability of a transmission grid based on seven key concepts. The ones in bold below are significant to this discussion. Figure 5 shows the coverage of each NERC Regional Coordinating Council. As this report is being written, NERC is undergoing a change to become a quasi-regulatory organization, the electric reliability organization (ERO).
Balance power generation and demand continuously Balance reactive power supply and demand to maintain scheduled voltages Monitor flows over transmission lines and other facilities to ensure that thermal
(heating) limits are not exceeded
19 The pro forma open access transmission tariff (OATT) includes six schedules that set forth the details pertaining to each ancillary service. The details concerning reactive power are included in Schedule 2 of the pro forma OATT. FERC Order No. 888 at 31,960. 20NERC is a non-governmental organization whose mission is to ensure that the bulk electric system in North America is reliable, adequate and secure. NERC currently operates as a voluntary organization, relying on reciprocity, peer pressure and the mutual self-interest of all those involved.

A Preliminary Analysis of the Economics of Using Distributed Energy as a Source of Reactive Power Supply 5/26/2006
15 Energetics Incorporated
Keep the system in a stable condition Operate the system so that it remains in a reliable condition even if a contingency
occurs, such as the loss of a key generator or transmission facility (the “N-1 criterion”)
Plan, design, and maintain the system to operate reliably Prepare for emergencies
NERC is responsible for setting voltage control reliability rules for the 10 regional coordinating councils. On August 14, 2003, there were several violations of these rules that, combined with additional factors, resulted in one of the worst blackouts ever experienced in the United States or Canada. Specifically, one of the NERC rules that was not followed by a utility involved not properly monitoring and managing reactive power reserves for various contingency conditions. Additionally, the reliability council of that utility did not conduct an adequate review or analyses of voltage criteria, reactive power management and operating needs.21 4.2 Institutional Arrangements for Reactive Power Compensation This section briefly describes the current arrangements in place for provision of reactive power supply from both static sources, e.g., capacitors and load tap changers, and dynamic sources, e.g., synchronous generators, synchronous condensers, distributed energy, and transmission-based solutions, such as STATCOMs and SVCs. As we shall see below, the nature of the market participant providing reactive power supply, e.g., generator, transmission owner, load-serving entity, or end-use customers, will drive whether a solid business case can be made for entering the reactive power supply market. This discussion focuses on regions of the country that have implemented wholesale competition and created system/transmission operation organizations. In those parts of the country that have retained integrated utility monopolies, the institutional arrangements are much simpler. 21 Final Report on the August 14, 2003 Blackout in the United States and Canada, April 2004, ftp://www.nerc.com/pub/sys/all_updl/docs/blackout/ch1-3.pdf
Figure 5. NERC Regional Coordinating Councils
A Preliminary Analysis of the Economics of Using Distributed Energy as a Source of Reactive Power Supply 5/26/2006
16 Energetics Incorporated
The institutional arrangements for obtaining reactive power supplies do not vary significantly according to the status of regulation or competition in a given jurisdiction. The choice of arrangements include: (i) pay nothing to generators, but require that each generator be obliged to provide reactive power as a condition of grid connection; (ii) include within a generator’s installed capacity obligation an additional requirement to provide reactive power, with the generator’s compensation included in its capacity payment; (iii) pay nothing to generators (or include their reactive power obligations as part of their general capacity obligation), but compensate transmission owners and load serving entities for the revenue requirements of transmission-based solutions; (iv) determine prices and quantities for both generator-provided and transmission-based solutions through a market-based approach such as a periodic auction (for reactive power capability) or an ongoing spot market (for short-term reactive power delivery); and (v) centrally procure (likely on a zonal basis) reactive power capability and/or supplies according to a cost-based22 payment schedule set in advance.23 Provision of static reactive power supply through capacitors and load tap changers is generally arranged for by load serving entities/electricity distribution companies as a normal part of distribution network planning and operations. The institutional arrangements for providing reactive power supply from static devices are straightforward, as they are an asset owned by load-serving entities (LSEs) or electricity distribution companies (EDCs). These devices are simply put into the utility’s rate base and fixed and variables costs are recovered via retail rates by the customers served. A similar arrangement can be used for the capital costs of dynamic transmission-based devices (STATCOMs and SVCs) placed in operation by transmission owners. Generally speaking, ISOs and RTOs do compensate generators (both affiliates of vertically integrated utilities and IPPs) for providing reactive power. The institutional arrangement is compensation using a cost-based schedule set in advance, usually a payment equal to the generation owner’s monthly revenue requirement. In exchange the generators must be under the control of the control area operator and be operated to produce or absorb reactive power. In some cases when there is a reduction in real power output due to a request for reactive power production, the RTO will provide an additional payment to compensate the generator for the lost opportunity of delivering real power into the network. Cost-based compensation to generators for providing reactive power supply is regulated by the FERC, and all ISOs/RTOs must provide a Schedule 2 tariff for reactive supply and voltage control as part of their Open Access Transmission Tariff (OATT). There is a significant disconnect between the arrangements for procuring reactive power supply from generators and the arrangements for acquiring reactive power supply from transmission-based sources owned by transmission owners/providers. A transmission owner who mitigates a reactive power compensation problem by investing in a transmission-based reactive power provision will be able to rate base the 22 The cost basis could be actual costs for reactive power provision or could be based on the opportunity costs of providing reactive power in lieu of real power. 23 Principles for Efficient and Reliable Reactive Power Supply and Consumption, FERC Staff Report in Docket # AD05-1-000, February 4, 2005.
A Preliminary Analysis of the Economics of Using Distributed Energy as a Source of Reactive Power Supply 5/26/2006
17 Energetics Incorporated
investment, but at the present does not receive any Schedule 2 compensation from the RTO. This is despite the possibility that transmission-based solutions may be a least-cost alternative for reactive power supply and be more valuable during system contingencies. The situation for distributed energy sources is even more ambiguous, as these smaller devices often do not have the control and communications requirements necessary for automatic operation in response to local or system operators. Institutional arrangements directly affect the economic framework for evaluation of investments in providing reactive power supply. Although a generator can rely on a stream of Schedule 2 capacity payments based on the revenue required for his reactive power supply operations, a transmission provider installing a STATCOM or SVC must rely on retail regulator approval of rate basing the investment and recovering the variable costs. A distributed generator or other distributed energy device would have to either be approved as a source of reactive power supply under Schedule 2, including testing requirements and Automatic Voltage Regulation (AVR), or rely on negotiations with their LSE for a compensation arrangement. Each situation will call for a different economic evaluation framework. Several of the RTOs – notably ISO-NE, PJM, NYISO – are addressing this disparity in payment arrangements for generators and all other sources of reactive power supply. These RTOs are attempting to create a more level playing field by applying the principle of consistent compensation for similar supply types. The objective is a single and consistent compensation approach for all types of reactive power sources that would replace the generator-specific Schedule 2 now in effect. 4.3 Compensation for Reactive Power Provision This section identifies and documents examples of reactive power compensation service market development, administrative solutions, or regulatory frameworks in wholesale markets (transmission level). In particular, it identifies well-developed examples/designs for obligatory reactive power service or market- based reactive power services. 4.3.1 United States 4.3.1.1 PJM PJM Interconnection, LLC (PJM) compensates all generators (affiliates of investor owned utilities and independent power producers) with a payment equal to the generation owner’s monthly revenue requirements as accepted or approved by the FERC.24 Dividing the total zonal revenue requirement by the total gross lagging MVAR capability at maximum power output for all generators in the zone yields rates ranging from $1005/MVAR-year to $5907/MVAR-year with an average zonal rate or $2,430/MVAR-yr. PJM also provides lost opportunity costs payments when there is a reduction in real power output. These costs are filed with and approved by the FERC and are allocated to network transmission service customers in the zone where the generator is located.
24 http://www.pjm.com/documents/ferc/documents/2005/march/20050311-er05623.pdf

A Preliminary Analysis of the Economics of Using Distributed Energy as a Source of Reactive Power Supply 5/26/2006
18 Energetics Incorporated
4.3.1.2 ISO-NE ISO New England Inc. (ISO-NE) compensates generators based on four components: (i) capacity costs—the fixed capital costs incurred by a generator associated with the installation and maintenance of the capability of providing reactive power; (ii) lost opportunity costs—the value of the generator’s lost opportunity cost in the energy market where a generator would otherwise be dispatched by ISO-NE to reduce real power output to produce reactive power; (iii) cost of energy consumed—the cost solely to provide reactive power support, such as the energy for “motoring” a hydroelectric generating unit; and (iv) cost of energy produced—the portion of the amount paid to Market Participants for the hour for energy produced by a generating unit that is considered under the Schedule 2 to be paid for VAR support. ISO-NE provides $1050 per MVAR-year for reactive compensation and currently has 11,919 MVARs available to receive capacity payments. This translates to an annual compensation of $12.5M.25 4.3.1.3 MISO The Midwest Independent Transmission System Operator Inc. (MISO) compensates generators owned by transmission owners for providing reactive power. Rates are based on control area operator rates filed at FERC and are paid where the load is located (zonal basis) and loads outside MISO are charged on an average system-wide rate. MISO does not provide for lost opportunity costs for producing reactive power instead of real power. Compensation for reactive power is treated as a pass-through of revenues from individual control area operators.26 MISO compensates generators owned by transmission owners for providing reactive power, but has no mechanism to compensate independent power producers.27 Appendix D shows MISO’s ancillary services schedule 2 pricing for reactive power and voltage control by region. 4.3.1.4 NY ISO The New York Independent System Operator Inc. (NYISO) compensates all large, conventional generators for reactive power, but those owned by utilities are compensated differently from non-utility generators under purchased power agreements. Payments are made from a pool consisting of total costs incurred by generators that provide voltage support service, and 2004 rates were calculated by dividing 2002 program costs of $61 million by the 2002 generation capacity expected of 15,570 MVAR, resulting in a compensation rate of $3,919/MVAR per year.28 4.3.1.5 ERCOT In the Electric Reliability Council of Texas (ERCOT) region, generators must be capable of providing reactive power over at least the range of power factors of 0.95 leading or lagging, measured at the unit main transformer high voltage terminals. There is no
25 Comments from ISO-NE and NEPOOL Committee to FERC, April 2005, Docket No. AD05-1-000 , http://www.iso-ne.com/regulatory/ferc/filings/2005/apr/ad05_1_000_04_04_05isonepool.pdf 26 FERC Report on Supply and Consumption, Docket AD05-1-000, February 4, 2005, http://www.ferc.gov/EventCalendar/Files/20050310144430-02-04-05-reactive-power.pdf 27 MISO filed with the FERC to add a new Schedule 21 to compensate IPPs separately from Schedule 2 compensation of utility-owned generation. On June 25, 2004 the FERC rejected the specific proposal for Schedule 2 while agreeing that generators providing reactive power to support the transmission system should be compensated. This issue is still under adjudication. Midwest Independent System Transmission Operator, Inc., Docket No. ER04-961-000 109 FERC 61,005 28 http://www.nyiso.com/services/documents/b-and-a/rate_2/2005_oatt_mst_sched2_vss_rates.pdf
A Preliminary Analysis of the Economics of Using Distributed Energy as a Source of Reactive Power Supply 5/26/2006
19 Energetics Incorporated
compensation for reactive power service within this range. Generators receive a variable payment of $2.65/MVARh for MVARs beyond 0.95 leading/lagging.29 4.3.1.6 SPP The Southwest Power Pool Inc.’s (SPP) compensation for reactive power is a pass through of the revenues collected by individual control operators.30 Each control area operator shall specify a voltage or reactive schedule to be maintained by each synchronous generator at a specified bus. Generators shall be able to run at maximum rated reactive and real output according to each unit’s capability curves during emergency conditions for as long as acceptable frequency and voltages allow the generator to continue to operate. Generators shall be exempt from this if they meet the following criteria:31
Generator output less than 20MW Generation is of intermittent variety (wind generation)
4.3.1.7 CAISO In the California Independent Service Operator Corporation’s (CAISO) service territory generators are required to provide reactive power by operating within a power factor range of 0.90 lagging and 0.95 leading. The CAISO tariff states that generators receive no compensation for operating within this range. Generators that are producing real power are required, upon the ISO’s request, to provide reactive energy output outside their standard obligation range, for which they receive lost opportunity costs. 4.3.2 VAR Working Groups Many of the ISOs/RTOs have formed VAR working groups to look into reactive power and voltage support issues. PJM, for example, formed their working group because some generators did not appear to be providing the specified amount of reactive power.32 ISO-NE also has a mature VAR working group that is part of their Transmission Committee.33 The New York ISO has a Reactive Power Working Group.34 The Southwest Power Pool has a Voltage and Reactive Management Task Force.35 Appendix B contains supplemental information about ISO/RTO and overseas developments related to reactive power. Table 2 shows a summary the regional comparison of ISO/RTO arrangements for reactive power compensation.
29 http://pjm.com/committees/working-groups/rswg/downloads/20050713-item-2-reactive-compen-comp.pdf 30 FERC Report on Supply and Consumption, Docket AD05-1-000, February 4, 2005, http://www.ferc.gov/EventCalendar/Files/20050310144430-02-04-05-reactive-power.pdf 31 http://www.spp.org/Publications/SPP_Criteria.pdf 32 http://www.pjm.com/committees/working-groups/rswg/rswg.html 33 http://www.iso-ne.com/committees/comm_wkgrps/trans_comm/tariff_comm/mtrls/index.html 34 http://www.nyiso.com/public/committees/documents.jsp?com=oc_rpwg 35 http://www.spp.org/Committee_Results.cfm?PassObj=1565
A Preliminary Analysis of the Economics of Using Distributed Energy as a Source of Reactive Power Supply 5/26/2006
20 Energetics Incorporated
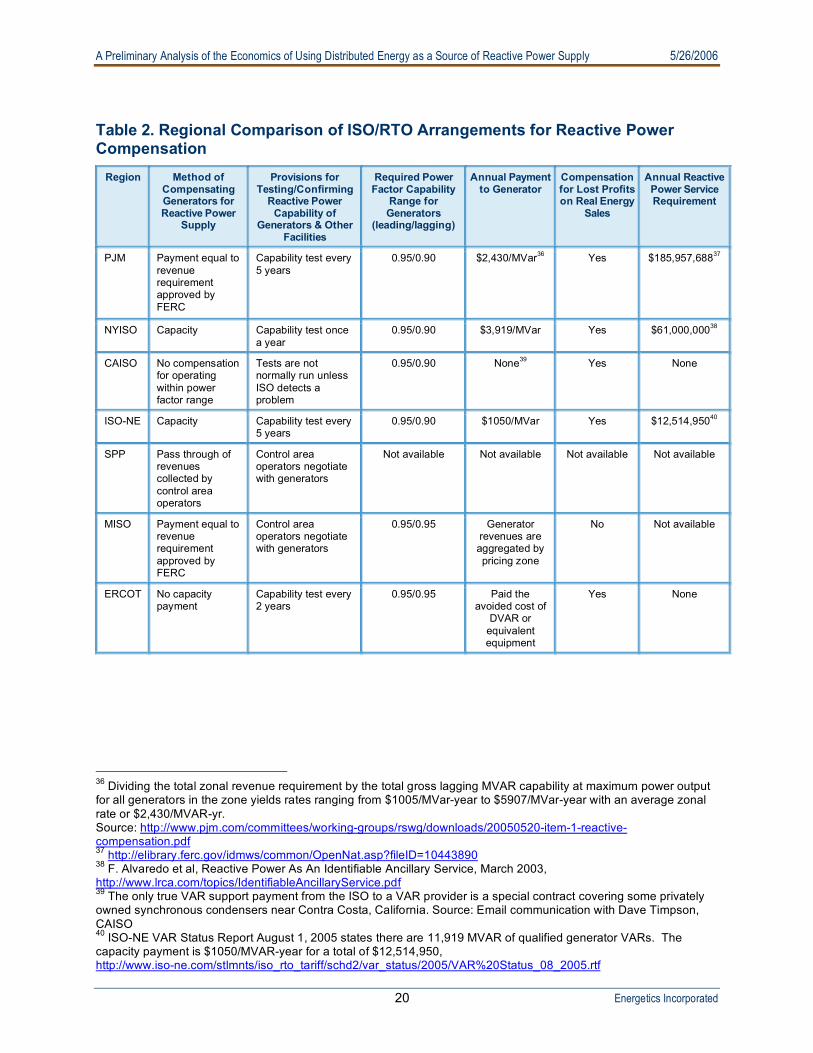
Table 2. Regional Comparison of ISO/RTO Arrangements for Reactive Power Compensation
Region Method of Compensating Generators for Reactive Power
Supply
Provisions for Testing/Confirming
Reactive Power Capability of
Generators & Other Facilities
Required Power Factor Capability
Range for Generators
(leading/lagging)
Annual Payment to Generator
Compensation for Lost Profits on Real Energy
Sales
Annual Reactive Power Service Requirement
PJM Payment equal to revenue requirement approved by FERC
Capability test every 5 years
0.95/0.90 $2,430/MVar36 Yes $185,957,68837
NYISO Capacity Capability test once a year
0.95/0.90 $3,919/MVar Yes $61,000,00038
CAISO No compensation for operating within power factor range
Tests are not normally run unless ISO detects a problem
0.95/0.90 None39 Yes None
ISO-NE Capacity Capability test every 5 years
0.95/0.90 $1050/MVar Yes $12,514,95040
SPP Pass through of revenues collected by control area operators
Control area operators negotiate with generators
Not available Not available Not available Not available
MISO Payment equal to revenue requirement approved by FERC
Control area operators negotiate with generators
0.95/0.95 Generator revenues are aggregated by pricing zone
No Not available
ERCOT No capacity payment
Capability test every 2 years
0.95/0.95 Paid the avoided cost of
DVAR or equivalent equipment
Yes None
36 Dividing the total zonal revenue requirement by the total gross lagging MVAR capability at maximum power output for all generators in the zone yields rates ranging from $1005/MVar-year to $5907/MVar-year with an average zonal rate or $2,430/MVAR-yr. Source: http://www.pjm.com/committees/working-groups/rswg/downloads/20050520-item-1-reactive-compensation.pdf 37 http://elibrary.ferc.gov/idmws/common/OpenNat.asp?fileID=10443890 38 F. Alvaredo et al, Reactive Power As An Identifiable Ancillary Service, March 2003, http://www.lrca.com/topics/IdentifiableAncillaryService.pdf 39 The only true VAR support payment from the ISO to a VAR provider is a special contract covering some privately owned synchronous condensers near Contra Costa, California. Source: Email communication with Dave Timpson, CAISO 40 ISO-NE VAR Status Report August 1, 2005 states there are 11,919 MVAR of qualified generator VARs. The capacity payment is $1050/MVAR-year for a total of $12,514,950, http://www.iso-ne.com/stlmnts/iso_rto_tariff/schd2/var_status/2005/VAR%20Status_08_2005.rtf
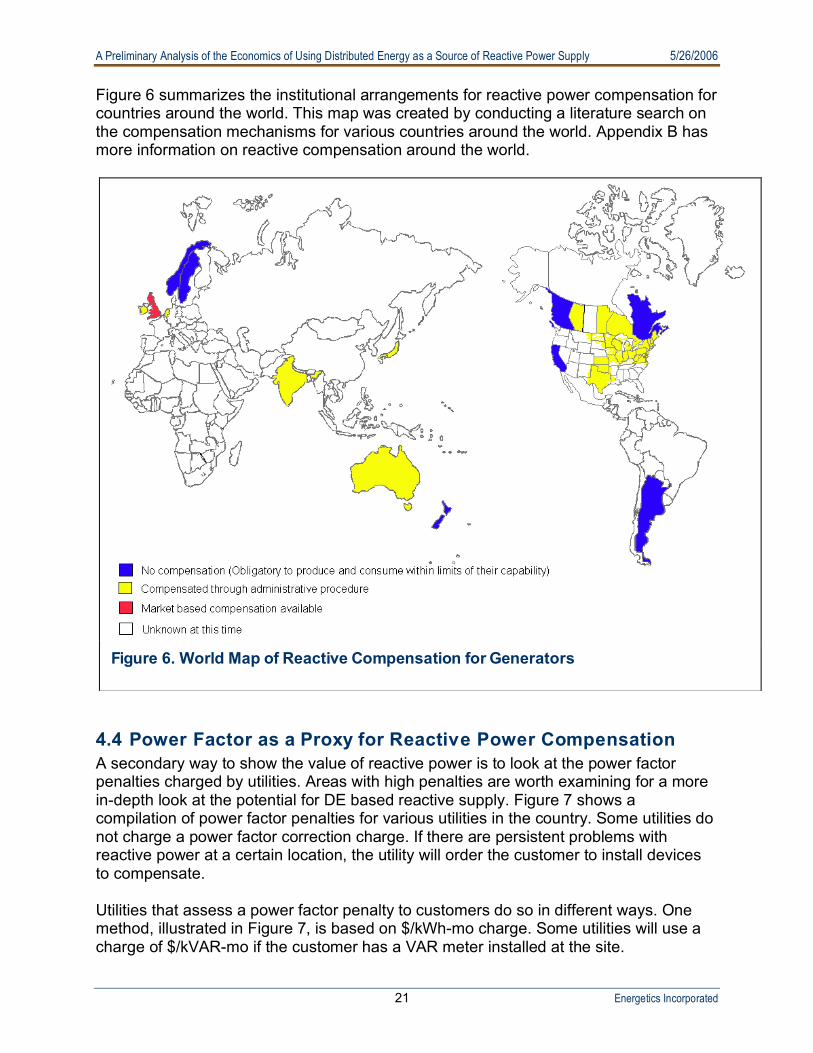
A Preliminary Analysis of the Economics of Using Distributed Energy as a Source of Reactive Power Supply 5/26/2006
21 Energetics Incorporated
Figure 6 summarizes the institutional arrangements for reactive power compensation for countries around the world. This map was created by conducting a literature search on the compensation mechanisms for various countries around the world. Appendix B has more information on reactive compensation around the world.
4.4 Power Factor as a Proxy for Reactive Power Compensation A secondary way to show the value of reactive power is to look at the power factor penalties charged by utilities. Areas with high penalties are worth examining for a more in-depth look at the potential for DE based reactive supply. Figure 7 shows a compilation of power factor penalties for various utilities in the country. Some utilities do not charge a power factor correction charge. If there are persistent problems with reactive power at a certain location, the utility will order the customer to install devices to compensate. Utilities that assess a power factor penalty to customers do so in different ways. One method, illustrated in Figure 7, is based on $/kWh-mo charge. Some utilities will use a charge of $/kVAR-mo if the customer has a VAR meter installed at the site.
Figure 6. World Map of Reactive Compensation for Generators
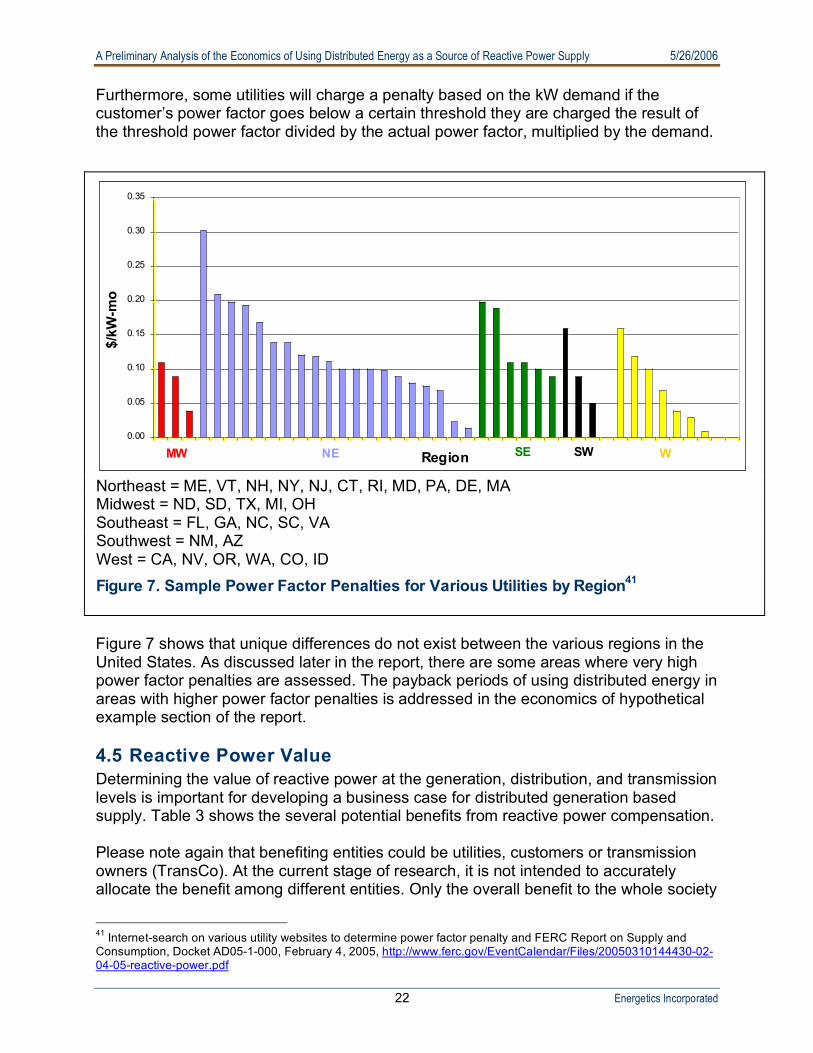
A Preliminary Analysis of the Economics of Using Distributed Energy as a Source of Reactive Power Supply 5/26/2006
22 Energetics Incorporated
Furthermore, some utilities will charge a penalty based on the kW demand if the customer’s power factor goes below a certain threshold they are charged the result of the threshold power factor divided by the actual power factor, multiplied by the demand.
Figure 7 shows that unique differences do not exist between the various regions in the United States. As discussed later in the report, there are some areas where very high power factor penalties are assessed. The payback periods of using distributed energy in areas with higher power factor penalties is addressed in the economics of hypothetical example section of the report. 4.5 Reactive Power Value Determining the value of reactive power at the generation, distribution, and transmission levels is important for developing a business case for distributed generation based supply. Table 3 shows the several potential benefits from reactive power compensation. Please note again that benefiting entities could be utilities, customers or transmission owners (TransCo). At the current stage of research, it is not intended to accurately allocate the benefit among different entities. Only the overall benefit to the whole society
41 Internet-search on various utility websites to determine power factor penalty and FERC Report on Supply and Consumption, Docket AD05-1-000, February 4, 2005, http://www.ferc.gov/EventCalendar/Files/20050310144430-02-04-05-reactive-power.pdf
WNEMW SE SW
0.00
0.05
0.10
0.15
0.20
0.25
0.30
0.35
Region
$/kW-mo
Northeast = ME, VT, NH, NY, NJ, CT, RI, MD, PA, DE, MA Midwest = ND, SD, TX, MI, OH Southeast = FL, GA, NC, SC, VA Southwest = NM, AZ West = CA, NV, OR, WA, CO, ID Figure 7. Sample Power Factor Penalties for Various Utilities by Region41

A Preliminary Analysis of the Economics of Using Distributed Energy as a Source of Reactive Power Supply 5/26/2006
23 Energetics Incorporated
will be discussed. In a future study, more detailed cost-benefit analysis will be performed to set some guidelines for cost and benefit allocations. Table 3. Summary of Reactive Power Value
Benefit Category Difficulty to Quantify Benefited Entities
1. Reduced Reactive Power Penalty Easy Utility/Customer
2. Reactive Capacity Payment Easy Utility/Customer
3. Reduced Losses Medium Customer
4. Increased Line Capacity Medium Utility/TransCo
5. Increased Maximum Transfer Capability Medium Utility/TransCo
6. Other benefit such as improved reliability Difficult Utility/TransCo/Customer
A Preliminary Analysis of the Economics of Using Distributed Energy as a Source of Reactive Power Supply 5/26/2006
24 Energetics Incorporated
5. CASE STUDIES OF REACTIVE SUPPLY Several case studies have been compiled to provide insight on potential opportunities for distributed generation in the reactive power arena. It should be noted that not all of the benefit items are applied for each case study. Only the items that are applicable to a particular case or have data available for that case are calculated in the benefit analysis. The results represent a conservative viewpoint. At the current stage of research, it is our intention to partition the costs and benefits among different entities. Only the overall benefit will be discussed. In a future study, more detailed analysis will be performed to set some guidelines for cost and benefit allocations. 5.1 Economic Analysis Methodologies Evaluating the economics of reactive power compensation is complex. There are no standard evaluation models or economic analysis tools. Since there are no fully functioning markets for reactive power in the U.S., data on costs and benefits is difficult to find. It is an emerging area of analysis that is just beginning to attract attention of researchers and analysts. There are three conceptual approaches to the analysis of the economics for reactive power:
Integrated resource planning Net present value Simple payback
In the absence of time, budget, and data constraints, the most thorough approach would be to conduct a comprehensive assessment of the load and reactive power requirements for a given feeder, substation, or control area, and then to run a production cost model to determine the least cost mix of resources to meet the load, including requirements for reactive power. The mix of resources would include traditional reactive power equipment as well as new techniques. This describes the “integrated resource planning” approach to the analysis of reactive power compensation economics. To our knowledge, no analysis of this type is available in the public literature. A second approach is to determine the net present value of investments in reactive power compensation. This approach requires information on costs and benefits over the lifecycle of the investment so that future streams can be discounted to the present. While there is data on the costs of reactive power equipment, quantitative information on the economic value of reactive power compensation is not readily available. There are a few system operators that offer payments for reactive power to generators. These involve a capacity payment as well as payment for the real power generation forgone. However, there is little historical data on these payments, so projections over the lifecycle of the investment for the future would be highly speculative.
A Preliminary Analysis of the Economics of Using Distributed Energy as a Source of Reactive Power Supply 5/26/2006
25 Energetics Incorporated
A third approach is to conduct a simple payback analysis. This approach compares the up-front costs of reactive power equipment with the expected revenue stream in order to determine the payback period. Given the very limited data available for both costs and benefits, this is the economic analysis approach that we will use. With the acquisition of better data over time, the results of the simple payback method can be compared with that of the other approaches. 5.2 Examples of Small Generators Receiving Reactive
Compensation A number of asset owners were contacted in the ISO-NE territory whose units were considered small generators. This contact list was developed by using the August 2005 VAR Status report from ISO-NE42 and sorting through the units with summer claimed capacity of less than 10 MW. This yielded a list of approximately 20 units that were receiving capacity payments from ISO-NE. Contact information for the owners of these generation assets were established by using the publicly available NEPOOL stakeholder committee lists.43 Figure 8 shows each unit’s name along with its qualified generator VARs and summer claimed capability. These units receive monthly VAR revenue from ISO-NE. The entities that benefit from capacity payment are the utilities and possibly large industrial customers.
42 ISO-NE VAR Status Report, August 2005, http://www.iso-ne.com/stlmnts/iso_rto_tariff/schd2/var_status/index.html 43 http://www2.iso-ne.com/NEPOOL_Roster/jsp/Roster.jsp?Committee_ID=1

A Preliminary Analysis of the Economics of Using Distributed Energy as a Source of Reactive Power Supply 5/26/2006
26 Energetics Incorporated
A representative from Exelon New England Holdings, Inc. was contacted to determine the operating characteristics of their Framingham Jet 1 gas turbine located in the NEMA/Boston region. This unit is a 10 MW peaker that only operates a couple times a year, if at all. It is a qualified generator for 10 MVAR and receives a capacity payment of $10,500/year for this capability. The asset owners decided that as long as the unit was providing the peaking service, it would also try and leverage the generators’ VAR capability to provide an additional revenue stream. A proposal is being explored in ISO-NE to increase the capacity payment to $4,200/MVAR, which would increase their payment to $42,000/year. Holyoke Gas & Electric Department is a municipally owned utility that has two steam turbine units under 10 MW. These units, Cabot 6 and Cabot 8, are peaking resources that are only called upon 1-3 times per year and each provides 8.7 MW of capacity. Each unit receives ISO-NE’s capacity payment for their 4.5 MVAR of reactive power capability resulting in a yearly payment of $4,750. FPL Energy Power Marketing Inc. has several small generation units that provide reactive power support, in addition to several large hydro units that include individual generators that have a capacity of 5 MW or less. Their units have to demonstrate their VAR capability once every 5 years. The units are operated at full load to demonstrate their leading and lagging reactive capability. FPL receives a capacity payment of $1,050/MVAR from ISO-NE based on the demonstrated number of MVAR. The hydro
0
2
4
6
8
10
12
FPL Ene
rgy Pow
er M
arke
ting, In
c
FPL Ene
rgy Pow
er M
arke
ting, In
c
Hud
son Ligh
t & P
ower
Dep
t
Hud
son Ligh
t & P
ower
Dep
t
Hud
son Ligh
t & P
ower
Dep
t
Hud
son Ligh
t & P
ower
Dep
t
FPL Ene
rgy Pow
er M
arke
ting, In
c
Tran
sCan
ada Pow
er M
ktg.
Hud
son Ligh
t & P
ower
Dep
t
Tran
sCan
ada Pow
er M
ktg.
Bra
scan
Ene
rgy M
arke
ting Inc.
FPL Ene
rgy Pow
er M
arke
ting, In
c
FPL Ene
rgy Pow
er M
arke
ting, In
c
Gre
en M
ountain Pow
er C
orp.
Holyo
ke G
as &
Elec Dep
t
Holyo
ke G
as &
Elec Dep
t
FPL Ene
rgy Pow
er M
arke
ting, In
c
Selec
t Ene
rgy Inc.
Cen
tral V
erm
ont P
ublic
Ser
vice
Bea
r Swam
p Pow
er C
ompa
ny
Exe
lon New
Eng
land
Unit
MW
MVARs
Figure 8. Generators under 10MW Qualified for Capacity Payments in ISO-NE

A Preliminary Analysis of the Economics of Using Distributed Energy as a Source of Reactive Power Supply 5/26/2006
27 Energetics Incorporated
units do not run for VAR support only. They are scheduled based on river flow. River flow engineers schedule the hydro units in coordination with the ISO. The generation is offered in the day ahead market and FPL can provide leading or lagging reactive support upon request. The units have to be scheduled by the river flow engineers daily in order for them to participate in the reactive power supply market. FPL also receives lost opportunity cost, in addition to capacity payments. Select Energy is a part of NU Enterprises Inc., the competitive energy holding company of Northeast Utilities. Northeast Generation Company owns a 9.7 MW hydropower facility that has the ability to provide almost 3 MVAR when called upon by ISO-NE or the local control operator. They receive a VAR revenue payment of approximately $250/mo or $3000/year. They are also compensated for lost opportunity costs for reducing real power output and providing VARs; however, this is rarely done. On the low side of the transformer the voltage at this facility is 6.6kV and 69kV on the high side. Table 4 below is a summary of these small generator case studies.
Table 4. Generators Receiving Capacity Payments
#1 #2 #3 #4
Owner Exelon Holyoke Gas & Electric
Select Energy FPL
Location Boston, MA Holyoke, MA Housatonic River, CT Maine
Technology (# of units)
Gas turbine (1)
Steam Turbines (2) Hydropower (1) Hydropower (6)
MW Peak Capacity 10.2 8.7 (each) 9.7 5.32 (average)
Rated MVARs 10.0 4.5 (each) 2.9 1.25 (average)
Total Capacity Payment
$10,500 $9,500 $3,000 $7,843
5.3 Synchronous Generators as an Alternative to Capacitors to
Supply Reactive Power for Growing Utilities Capacitor banks are a common way for distribution utilities with steady load growth to supply reactive power and keep substations at the minimum power factor dictated by their generation and transmission providers. Capacitors can have very low capital and installation costs, especially when simple control technology is used to operate them. An example of a distribution utility that uses capacitor banks to supply reactive power to its growing customer base is Lenoir City Utilities Board (LCUB). Tennessee Valley Authority (TVA), the generation and transmission entity of LCUB requires its distribution members to keep their power factors at 0.95 at their substations. Each substation on LCUB’s territory is metered and the utility pays $1.46/kVAR-mo for lagging power factors inferior to 95% and $1.14/kVAR-mo for leading power factors. The reactive power charge is determined at the peak and lowest electricity demand in a month. Figure 9 shows the average power factor of LCUB in 2004 and 2005. Figure 9 clearly shows a system power factor that results in penalties only during the summer (Power factors between 100% and 95% incur no penalties).
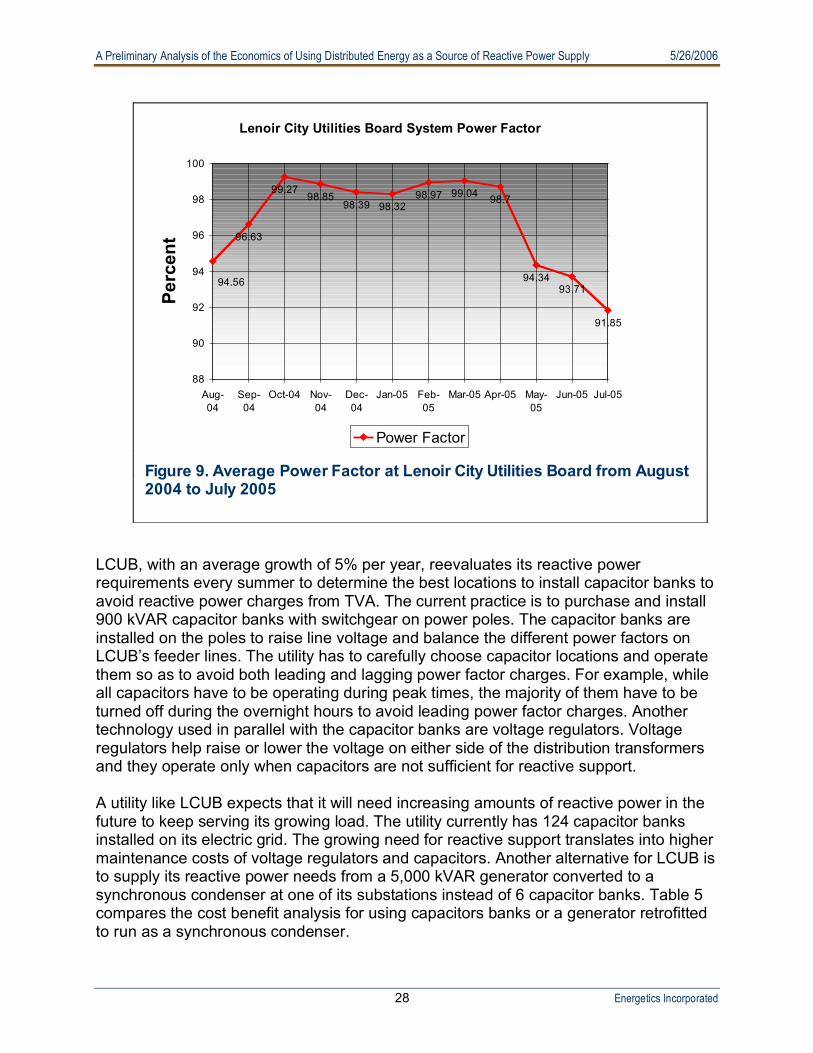
A Preliminary Analysis of the Economics of Using Distributed Energy as a Source of Reactive Power Supply 5/26/2006
28 Energetics Incorporated
LCUB, with an average growth of 5% per year, reevaluates its reactive power requirements every summer to determine the best locations to install capacitor banks to avoid reactive power charges from TVA. The current practice is to purchase and install 900 kVAR capacitor banks with switchgear on power poles. The capacitor banks are installed on the poles to raise line voltage and balance the different power factors on LCUB’s feeder lines. The utility has to carefully choose capacitor locations and operate them so as to avoid both leading and lagging power factor charges. For example, while all capacitors have to be operating during peak times, the majority of them have to be turned off during the overnight hours to avoid leading power factor charges. Another technology used in parallel with the capacitor banks are voltage regulators. Voltage regulators help raise or lower the voltage on either side of the distribution transformers and they operate only when capacitors are not sufficient for reactive support. A utility like LCUB expects that it will need increasing amounts of reactive power in the future to keep serving its growing load. The utility currently has 124 capacitor banks installed on its electric grid. The growing need for reactive support translates into higher maintenance costs of voltage regulators and capacitors. Another alternative for LCUB is to supply its reactive power needs from a 5,000 kVAR generator converted to a synchronous condenser at one of its substations instead of 6 capacitor banks. Table 5 compares the cost benefit analysis for using capacitors banks or a generator retrofitted to run as a synchronous condenser.
Lenoir City Utilities Board System Power Factor
96.63
99.2798.85
98.39 98.3298.97 99.04
98.7
94.3493.71
91.85
94.56
88
90
92
94
96
98
100
Aug-
04
Sep-
04
Oct-04 Nov-
04
Dec-
04
Jan-05 Feb-
05
Mar-05 Apr-05 May-
05
Jun-05 Jul-05
Perc
en
t
Power Factor
Figure 9. Average Power Factor at Lenoir City Utilities Board from August 2004 to July 2005

A Preliminary Analysis of the Economics of Using Distributed Energy as a Source of Reactive Power Supply 5/26/2006
29 Energetics Incorporated
Table 5. Cost Benefit Comparison between Capacitors and Synchronous Condensers
Costs and Benefits ($/year)
Capacitor Banks (5.0 MVAR)
Small Generator Retrofit to Synchronous
Condenser (5.0 MVAR)
Capital Cost 22,000 50,000
Technology Life Time 10 20
Preventive Maintenance 44 6,000 3,500
Cost of Voltage Regulator Maintenance45 6,600 3,300
Annual Cost in Present Value 14,800 9,300
Saving from Avoided Power Factor Penalties46
29,200 29,200
Annual Benefit in Present Value 29,200 29,200
Net Annual Saving in Present Value 14,400 19,900
Net Annual Saving in Present Value ($/MVAR)
2,880 3,980
The table shows that DG wins on strict economic terms against capacitor banks. In addition, LCUB sees extra benefits from using synchronous condensers that are harder to quantify. Capacitors are located throughout the utility’s service territory and thus maintenance is more costly than for a single synchronous generator at a substation. LCUB cannot be sure that its capacitors are operating, as they are too dispersed to monitor their status. Unforeseen events such as lightning could prevent the capacitor timers from functioning, without the utility knowing it. The uncertainty on the status of the capacitors could be avoided by installing more expensive control systems on the capacitors or having one synchronous condenser that is easily reachable to control reactive power flow. The synchronous condenser can also dynamically supply reactive power and adjust its output depending on system conditions. It should be noted that the synchronous condenser may provide more indirect benefits (reduced losses, saved line capacity, and increased transfer capability) than capacitor banks. The reason is that the injected reactive power from the synchronous condenser is almost constant when voltage is low, but considerably low (by voltage squared) for capacitor banks. Bottom line, capacitors are least helpful when most needed. Over time, the more shunt capacitors are added to the system, the greater the chance for voltage collapses as the output of shunt capacitors decreases as the square of the voltage.
44 LCUB expects preventive maintenance to be approximately $300 per month for a 5 MVAR capacitor bank. This estimate takes into account costs associated with damages on capacitor equipment due to lightning. Synchronous Condenser Maintenance is estimated to be $3,000 per year for changing oil and filters in engine and clutch, and $10,000 over the lifetime of the unit to replace bearings. 45 Voltage regulators have higher maintenance costs when reactive power is supplied passively with capacitors they have to operate more often to adjust voltage on the grid. A synchronous condenser will be able to supply reactive power dynamically and result in the $20,000 maintenance on regulators being necessary every 6 years as opposed to every 3 years when capacitors are the only source of reactive power 46 The savings assume that the units will operate at full capacity only during the 4 months of the summer every year.
A Preliminary Analysis of the Economics of Using Distributed Energy as a Source of Reactive Power Supply 5/26/2006
30 Energetics Incorporated
Some of the capacitors installed to avoid power factor penalties over the summer are not needed the rest of the year. Currently, LCUB turns off half of its fixed capacitor banks during the winter to avoid leading PF charges. A synchronous condenser could help the utility limit the installation of capacitors that operate only one third of the year. 5.4 Reactive Power Payments to a Large Generator After a comprehensive search, the authors were unable to find real examples of distributed energy devices being compensated for reactive power. This included an in-depth literature search and personal interviews with industry experts, the U.S. Department of Energy, and other authorities. However, as previously noted, there are a number of large generators that are receiving compensation for reactive power production. The example below, adapted from FERC Docket # ER03-624-000,47 illustrates how a large generator in the PJM territory receives reactive power compensation. The referenced FERC docket was submitted by the Calpine Construction Finance Company, L.P. (Calpine) in March of 2003. The request was approved by FERC in October 2003. The Ontelaunee facility located in Ontelaunee, Pennsylvania includes two combustion turbines rated at 185 MW each and a steam turbine rated at 203 MW. Calpine provides reactive supply and voltage control from this 573 MW facility and is compensated through a monthly revenue requirement with the following cost basis: (i) a fixed capability revenue requirement based on depreciation of the portion of the generator providing reactive power supply, (ii) a heating loss component for operating the generator to lead or lag according to dispatch instructions, and (iii) lost opportunity costs. The methodology of calculating the reactive revenue requirement in the Ontelaunee facility is known as the AEP Method. These charges are described in more detail below. Fixed Capability Revenue Requirement The fixed capability revenue component was derived from the portion of the plant investment attributed to the production of reactive power. This component was calculated by analyzing the reactive portion of the plant’s generators, exciters, and generator step-up transformers. Based on data from Siemens Westinghouse, the manufacturer of the generator units, it was determined that the cost of the generator/exciter portion of each combustion turbine was 15% (14% from the generator alone and 1% from the exciter). Similarly, the cost of the generator/exciter from the steam turbine was 20% (19% from the generator alone and 1% for the associated exciter). Table 6 shows the total reactive cost of the generator/exciter. For comparison purposes, Liberty Electric Power L.L.C has a facility that is approved by FERC for generation voltage support in the PJM region. The generators at this facility were manufactured by General Electric (GE). According to GE, 40.3% of the total steam turbine cost is allocated to the generator alone and 0.4% for
47 Calpine Construction Finance Co, L.P. Submits an Initial Rate Schedule 2 for Reactive Power from the Ontelaunee Energy Center, http://elibrary.ferc.gov/idmws/common/OpenNat.asp?fileID=10522337

A Preliminary Analysis of the Economics of Using Distributed Energy as a Source of Reactive Power Supply 5/26/2006
31 Energetics Incorporated
MW2 MVA2
MVAR2
MVA2 + = 100%
Megawatt Capacity Power Factor = MVA
the exciter. The facility also has two 165 MW combustion turbines where 19.9% of the plant cost is associated with the generator and 0.4% for the exciter.48 Table 6. Total Reactive Cost of the Generator and Exciter
1 2 3 4
Unit Size Generator/Exciter Portion of the
Turbogenerator
Value of Turbo-
generator
Reactive Allocator
(derived below)
Reactive Cost of Generator/Exciter (= Column 1*2*3)
Combustion Turbine 1
165 MW 15% $36,176,438 27.8% $1,505,844
Combustion Turbine 2
165 MW 15% $36,176,438 27.8% $1,505,844
Steam Turbine
191 MW 20% $60,755,174 27.8% $3,371,912
Total $6,383,600
The reactive power allocation factor is the percentage of the facility necessary to provide reactive power. Generator investment is a function of the total rated power in mega volt-amperes (MVA). Rated MVA is in turn a function of the squares of the rated and reactive capabilities according to Equation 1.
Equation 1. Generator MVA = (MW2 + MVAR2)1/2 Therefore, the allocation of the generator investment cost must also be a function of the squares of rated real and reactive capabilities. Equation 2 shows the allocation that flows from the Equation 1.
Equation 2. Equation 3. Equation 3 shows the relationship between MW and MVA. Using a 0.85 power factor and plant capacity values from the Ontelaunee facility of 573 MW, 674.1 MVA, and a total plant reactive capability of 355.1 MVAR, the reactive allocator is 27.8% (355.12/674.12).
48 Liberty Electric Power, LLC submits a revised rate schedule for reactive power to be provided to the PJM Interconnection, LLC transmission grid, FERC Docket ER03-1209-000, http://elibrary.ferc.gov/idmws/common/OpenNat.asp?fileID=10360085
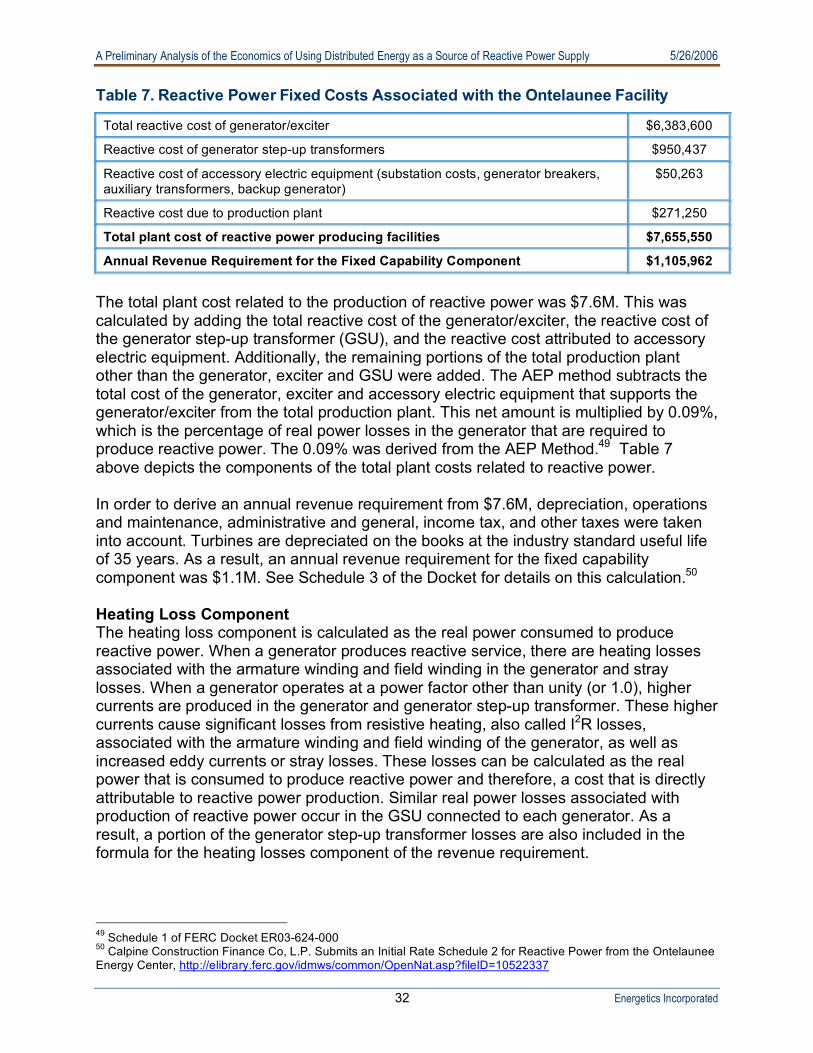
A Preliminary Analysis of the Economics of Using Distributed Energy as a Source of Reactive Power Supply 5/26/2006
32 Energetics Incorporated
Table 7. Reactive Power Fixed Costs Associated with the Ontelaunee Facility
Total reactive cost of generator/exciter $6,383,600
Reactive cost of generator step-up transformers $950,437
Reactive cost of accessory electric equipment (substation costs, generator breakers, auxiliary transformers, backup generator)
$50,263
Reactive cost due to production plant $271,250
Total plant cost of reactive power producing facilities $7,655,550
Annual Revenue Requirement for the Fixed Capability Component $1,105,962
The total plant cost related to the production of reactive power was $7.6M. This was calculated by adding the total reactive cost of the generator/exciter, the reactive cost of the generator step-up transformer (GSU), and the reactive cost attributed to accessory electric equipment. Additionally, the remaining portions of the total production plant other than the generator, exciter and GSU were added. The AEP method subtracts the total cost of the generator, exciter and accessory electric equipment that supports the generator/exciter from the total production plant. This net amount is multiplied by 0.09%, which is the percentage of real power losses in the generator that are required to produce reactive power. The 0.09% was derived from the AEP Method.49 Table 7 above depicts the components of the total plant costs related to reactive power. In order to derive an annual revenue requirement from $7.6M, depreciation, operations and maintenance, administrative and general, income tax, and other taxes were taken into account. Turbines are depreciated on the books at the industry standard useful life of 35 years. As a result, an annual revenue requirement for the fixed capability component was $1.1M. See Schedule 3 of the Docket for details on this calculation.50 Heating Loss Component The heating loss component is calculated as the real power consumed to produce reactive power. When a generator produces reactive service, there are heating losses associated with the armature winding and field winding in the generator and stray losses. When a generator operates at a power factor other than unity (or 1.0), higher currents are produced in the generator and generator step-up transformer. These higher currents cause significant losses from resistive heating, also called I2R losses, associated with the armature winding and field winding of the generator, as well as increased eddy currents or stray losses. These losses can be calculated as the real power that is consumed to produce reactive power and therefore, a cost that is directly attributable to reactive power production. Similar real power losses associated with production of reactive power occur in the GSU connected to each generator. As a result, a portion of the generator step-up transformer losses are also included in the formula for the heating losses component of the revenue requirement.
49 Schedule 1 of FERC Docket ER03-624-000 50 Calpine Construction Finance Co, L.P. Submits an Initial Rate Schedule 2 for Reactive Power from the Ontelaunee Energy Center, http://elibrary.ferc.gov/idmws/common/OpenNat.asp?fileID=10522337
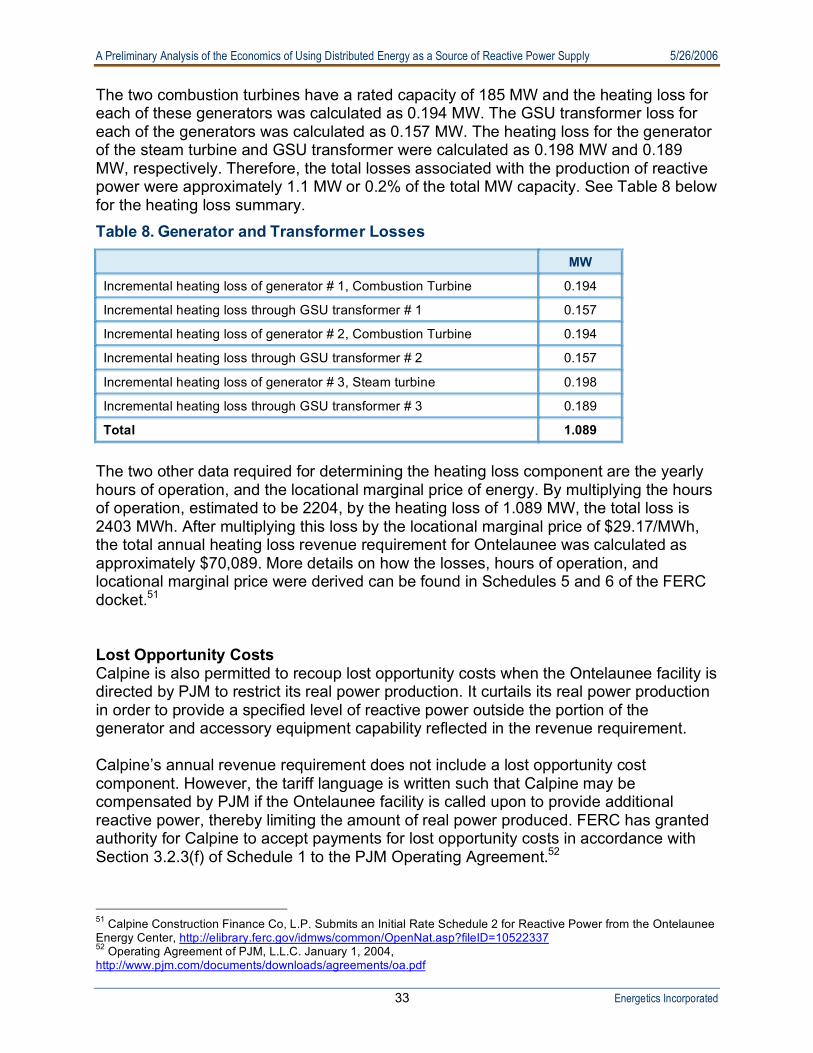
A Preliminary Analysis of the Economics of Using Distributed Energy as a Source of Reactive Power Supply 5/26/2006
33 Energetics Incorporated
The two combustion turbines have a rated capacity of 185 MW and the heating loss for each of these generators was calculated as 0.194 MW. The GSU transformer loss for each of the generators was calculated as 0.157 MW. The heating loss for the generator of the steam turbine and GSU transformer were calculated as 0.198 MW and 0.189 MW, respectively. Therefore, the total losses associated with the production of reactive power were approximately 1.1 MW or 0.2% of the total MW capacity. See Table 8 below for the heating loss summary. Table 8. Generator and Transformer Losses
MW
Incremental heating loss of generator # 1, Combustion Turbine 0.194
Incremental heating loss through GSU transformer # 1 0.157
Incremental heating loss of generator # 2, Combustion Turbine 0.194
Incremental heating loss through GSU transformer # 2 0.157
Incremental heating loss of generator # 3, Steam turbine 0.198
Incremental heating loss through GSU transformer # 3 0.189
Total 1.089
The two other data required for determining the heating loss component are the yearly hours of operation, and the locational marginal price of energy. By multiplying the hours of operation, estimated to be 2204, by the heating loss of 1.089 MW, the total loss is 2403 MWh. After multiplying this loss by the locational marginal price of $29.17/MWh, the total annual heating loss revenue requirement for Ontelaunee was calculated as approximately $70,089. More details on how the losses, hours of operation, and locational marginal price were derived can be found in Schedules 5 and 6 of the FERC docket.51 Lost Opportunity Costs Calpine is also permitted to recoup lost opportunity costs when the Ontelaunee facility is directed by PJM to restrict its real power production. It curtails its real power production in order to provide a specified level of reactive power outside the portion of the generator and accessory equipment capability reflected in the revenue requirement. Calpine’s annual revenue requirement does not include a lost opportunity cost component. However, the tariff language is written such that Calpine may be compensated by PJM if the Ontelaunee facility is called upon to provide additional reactive power, thereby limiting the amount of real power produced. FERC has granted authority for Calpine to accept payments for lost opportunity costs in accordance with Section 3.2.3(f) of Schedule 1 to the PJM Operating Agreement.52
51 Calpine Construction Finance Co, L.P. Submits an Initial Rate Schedule 2 for Reactive Power from the Ontelaunee Energy Center, http://elibrary.ferc.gov/idmws/common/OpenNat.asp?fileID=10522337 52 Operating Agreement of PJM, L.L.C. January 1, 2004, http://www.pjm.com/documents/downloads/agreements/oa.pdf

A Preliminary Analysis of the Economics of Using Distributed Energy as a Source of Reactive Power Supply 5/26/2006
34 Energetics Incorporated
A Market Seller providing Reactive Services from either a steam-electric generating unit, combined cycle unit or combustion turbine unit, shall receive a credit hourly in an amount equal to the following equation: Equation 4. {(AG - LMPDMW) x (UB - URTLMP)} where:
AG equals the actual hourly integrated output of the unit; LMPDMW equals the level of output for the unit determined according to the point on the scheduled offer curve on which the unit was operating corresponding to the hourly integrated real time LMP; UB equals the unit offer for that unit for which output is increased, determined according to the real time scheduled offer curve on which the unit was operating; URTLMP equals the real time LMP at the unit’s bus; and where UB - URTLMP shall not be negative.
The total annual revenue requirement of $1,176,000 was calculated by adding the fixed cost and heating loss components. Moreover, PJM pays Calpine $98,000 in monthly revenue for its reactive supply and voltage control capability. This equates to a $4,237/MVAR-yr gross voltage support payment to Calpine. As noted previously, PJM’s total compensation to generators is on the order of $185M every year for this type of support. Table 9 shows a sample of some independent power producers that are receiving a range of reactive yearly revenue requirements in the PJM and MISO regions.53 They have each filed a detailed justification of their reactive power costs to FERC. This illustrates that higher payments are available to some generators, which distributed energy devices may be able to capture. However, there is not a mechanism in place for utilities, let alone the ISOs/RTOs, to be able to detect customer owned distributed energy. The customer would need to step forward and make their asset available or the ISO/RTO could conduct a survey in a targeted area to see if there were reactive power existing capabilities. If a methodology was in place for the ISO/RTO to control the distributed energy device to dispatch reactive power, then the unit owner might be able to take advantage of capacity payments.
53 ISO-NE VAR Working Group Meeting Notes 10/24/05, Al McBride, Calpine

A Preliminary Analysis of the Economics of Using Distributed Energy as a Source of Reactive Power Supply 5/26/2006
35 Energetics Incorporated
Table 9. Summary of Some Approved FERC Filings for Generation Voltage Support FERC
Docket Generator
Name Location/
Market Fuel/Prime
Mover Annual
Revenue Requirement
Claimed Real Power Capability
(MW)
Net MVAR @ 0.9pf
Effective Gross Voltage
Support Rate ($/MVAR-yr)
ER03-1209-000 Liberty Electric Power, LLC Peco/PJM Gas CC $2,222,472 521 252.33 $8,807.74
ER03-794-002 Duke Energy Fayette, LLC Allegheny/PJM Gas Peaker $2,391,276 620 300.28 $7,963.50
ER04-1166 Twelvepole Creek LLC AEP-WV/PJM Gas Peaker $1,457,832 458 221.82 $6,572.15
ER05-289 Ocean Peaking Power LLC JCPL/PJM Gas Peaker $952,555 330 159.83 $5,959.94
ER05-567 Duke Energy Hanging Rock LLC AEP-Ohio/PJM Gas CC $3,429,356 1,240 600.56 $5,710.27
ER05-623 Duke Washington Energy LLC AEP-Ohio/PJM Gas CC $1,569,806 620 300.28 $5,227.81
ER03-1164-000 Reliant Energy Hunterstown, LLC MetEd/PJM Gas CC $2,027,688 830 401.99 $5,044.16
ER03-1396-000 Troy Energy, LLC ATSI/MISO Gas Peaker $1,498,920 620 300.28 $4,991.75
ER03-451 Pleasants Energy LLC Allegheny/PJM Gas Peaker $722,906 300 145.30 $4,975.38
ER03-229 Armstrong Energy Limited Partnership Allegheny/PJM Gas Peaker $1,435,133 600 290.59 $4,938.63
ER04-231-002 Conectiv Bethlehem, LLC PPL/PJM Gas CC $2,094,180 885 428.63 $4,885.81
ER05-288 CED Rock Springs LLC Maryland/PJM Gas Peaker $766,570 335 162.25 $4,724.68
ER05-1361-000 Fox Energy Center Wisconsin/MISO Gas CC $1,352,081 600 290.59 $4,652.83
ER04-1164 Reliant Energy Seward LLC Penelec/PJM Coal $1,142,356 521 252.33 $4,527.20
ER05-328 Riverside Generating Company LLC AEP-KY/PJM Gas Peaker $1,702,765 820 397.14 $4,287.52
ER03-624-000 Ontelaunee Energy Center MetEd/PJM Gas CC $1,176,048 573 277.52 $4,237.76
ER05-270 Dynegy Mid West Generation Inc Illinois/MISO Coal $7,584,800 4,042 1,957.63 $3,874.48
ER04-765 University Park LLC ComEd/PJM Gas Peaker $543,304 300 145.30 $3,739.27
ER04-1102 Wolf Hills Energy LLC AEP-V/PJM Gas Peaker $442,023 250 121.08 $3,650.65
ER04-1103 Big Sandy Peaker Plant LLC AEP-WV/PJM Gas Peaker $525,904 300 145.30 $3,619.52
ER04-680 Tenaska Virginia Partners LP Virginia/PJM Gas CC $1,385,697 885 428.63 $3,232.89
ER03-269-000 Handsome Lake Energy, LLC Penelec/PJM Gas Peaker $370,308 250 121.08 $3,058.36
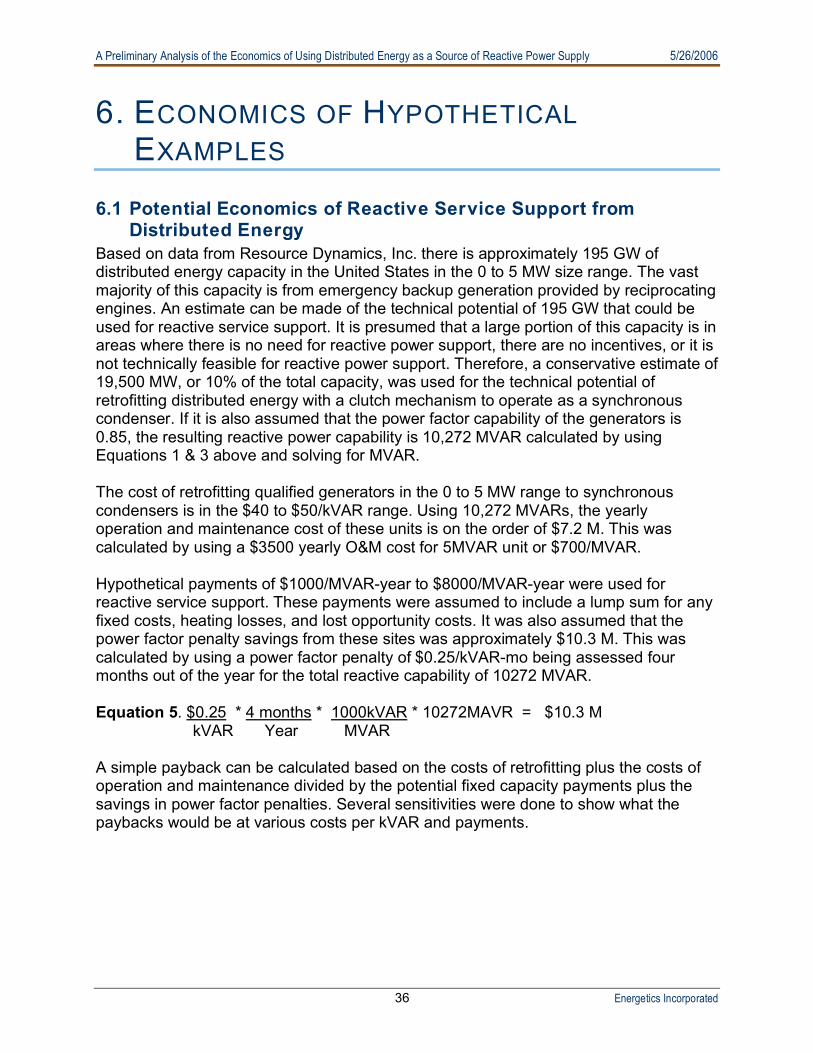
A Preliminary Analysis of the Economics of Using Distributed Energy as a Source of Reactive Power Supply 5/26/2006
36 Energetics Incorporated
6. ECONOMICS OF HYPOTHETICAL EXAMPLES
6.1 Potential Economics of Reactive Service Support from
Distributed Energy Based on data from Resource Dynamics, Inc. there is approximately 195 GW of distributed energy capacity in the United States in the 0 to 5 MW size range. The vast majority of this capacity is from emergency backup generation provided by reciprocating engines. An estimate can be made of the technical potential of 195 GW that could be used for reactive service support. It is presumed that a large portion of this capacity is in areas where there is no need for reactive power support, there are no incentives, or it is not technically feasible for reactive power support. Therefore, a conservative estimate of 19,500 MW, or 10% of the total capacity, was used for the technical potential of retrofitting distributed energy with a clutch mechanism to operate as a synchronous condenser. If it is also assumed that the power factor capability of the generators is 0.85, the resulting reactive power capability is 10,272 MVAR calculated by using Equations 1 & 3 above and solving for MVAR. The cost of retrofitting qualified generators in the 0 to 5 MW range to synchronous condensers is in the $40 to $50/kVAR range. Using 10,272 MVARs, the yearly operation and maintenance cost of these units is on the order of $7.2 M. This was calculated by using a $3500 yearly O&M cost for 5MVAR unit or $700/MVAR. Hypothetical payments of $1000/MVAR-year to $8000/MVAR-year were used for reactive service support. These payments were assumed to include a lump sum for any fixed costs, heating losses, and lost opportunity costs. It was also assumed that the power factor penalty savings from these sites was approximately $10.3 M. This was calculated by using a power factor penalty of $0.25/kVAR-mo being assessed four months out of the year for the total reactive capability of 10272 MVAR. Equation 5. $0.25 * 4 months * 1000kVAR * 10272MAVR = $10.3 M kVAR Year MVAR A simple payback can be calculated based on the costs of retrofitting plus the costs of operation and maintenance divided by the potential fixed capacity payments plus the savings in power factor penalties. Several sensitivities were done to show what the paybacks would be at various costs per kVAR and payments.

A Preliminary Analysis of the Economics of Using Distributed Energy as a Source of Reactive Power Supply 5/26/2006
37 Energetics Incorporated
Distributed energy producing reactive power can only be deployed where there are larger payments to justify the additional cost of retrofitting the units. If the distributed energy device is also located in an area where there is a high power factor penalty, the paybacks have the potential to be even lower. As depicted in Figure 10, with payments of $1000 to $3000/MVAR-year paybacks are longer than 12 years with the current technology costs. However, as the fixed payments reach upwards of $4000/MVAR, the paybacks dip below 10 years. It is reasonable to expect that reactive power payments could potentially increase to help pay for premium reactive power sources where there are reliability constraints. Northeastern Massachusetts is a region with an insufficiency in reactive power compensation. The 2004 Annual Markets Report issued by ISO New England identifies “increases in out-of-market compensation (i.e., payments outside of energy market-clearing processes)” as a major problem that needs attention.54 The Report notes that these payments were primarily to generators and were driven by reliability needs for transmission support, mainly for reactive power, and primarily in northeastern Massachusetts (NEMA, or Greater Boston). The cost of Volt Ampere Reactive (VAR) payments rose from $12 million in 2003 to $78 million in 2004. This insufficiency in reactive power compensation affects the proper functioning of energy markets by reducing LMPs below efficient levels, increasing day ahead/real-time price differences due to flawed cost allocation of real-time operating reserve charges, and by making it more difficult for participants to hedge transactions and serve load in constrained regions. The Report concludes by reporting that “ISO and participants are pursuing infrastructure upgrades, operational changes, and market-rule changes designed to reduce the severity of these problems. The market rule changes must provide appropriate incentives for flexible resources to locate in the correct places to reduce out-of-merit costs.”
54 2004 Annual Markets Report, ISO New England, p. 4.
Paybacks with Various Installed Costs and Payments
0.0
2.5
5.0
7.5
10.0
12.5
15.0
17.5
20.0
22.5
25.0
27.5
1000 2000 3000 4000 5000 6000 7000 8000
Fixed Payments ($/MVAR-year)
Payb
ack (years
)
$50/kVAR $40/kVAR $30/kVAR $20/kVAR $10/kVAR
Figure 10. Payback Period for Distributed Energy Device Conversion to Synchronous Condensers
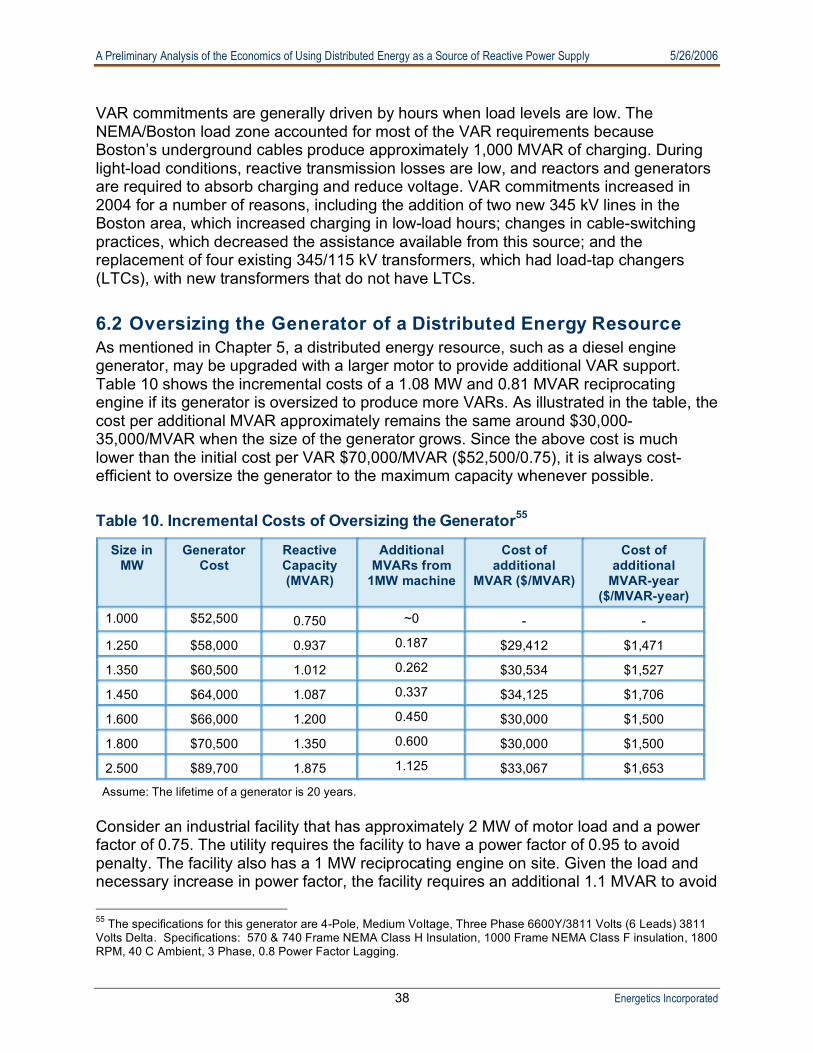
A Preliminary Analysis of the Economics of Using Distributed Energy as a Source of Reactive Power Supply 5/26/2006
38 Energetics Incorporated
VAR commitments are generally driven by hours when load levels are low. The NEMA/Boston load zone accounted for most of the VAR requirements because Boston’s underground cables produce approximately 1,000 MVAR of charging. During light-load conditions, reactive transmission losses are low, and reactors and generators are required to absorb charging and reduce voltage. VAR commitments increased in 2004 for a number of reasons, including the addition of two new 345 kV lines in the Boston area, which increased charging in low-load hours; changes in cable-switching practices, which decreased the assistance available from this source; and the replacement of four existing 345/115 kV transformers, which had load-tap changers (LTCs), with new transformers that do not have LTCs. 6.2 Oversizing the Generator of a Distributed Energy Resource As mentioned in Chapter 5, a distributed energy resource, such as a diesel engine generator, may be upgraded with a larger motor to provide additional VAR support. Table 10 shows the incremental costs of a 1.08 MW and 0.81 MVAR reciprocating engine if its generator is oversized to produce more VARs. As illustrated in the table, the cost per additional MVAR approximately remains the same around $30,000-35,000/MVAR when the size of the generator grows. Since the above cost is much lower than the initial cost per VAR $70,000/MVAR ($52,500/0.75), it is always cost-efficient to oversize the generator to the maximum capacity whenever possible. Table 10. Incremental Costs of Oversizing the Generator55
Size in MW
Generator Cost
Reactive Capacity (MVAR)
Additional MVARs from
1MW machine
Cost of additional
MVAR ($/MVAR)
Cost of additional
MVAR-year ($/MVAR-year)
1.000 $52,500 0.750 ~0 - -
1.250 $58,000 0.937 0.187 $29,412 $1,471
1.350 $60,500 1.012 0.262 $30,534 $1,527
1.450 $64,000 1.087 0.337 $34,125 $1,706
1.600 $66,000 1.200 0.450 $30,000 $1,500
1.800 $70,500 1.350 0.600 $30,000 $1,500
2.500 $89,700 1.875 1.125 $33,067 $1,653
Assume: The lifetime of a generator is 20 years. Consider an industrial facility that has approximately 2 MW of motor load and a power factor of 0.75. The utility requires the facility to have a power factor of 0.95 to avoid penalty. The facility also has a 1 MW reciprocating engine on site. Given the load and necessary increase in power factor, the facility requires an additional 1.1 MVAR to avoid 55 The specifications for this generator are 4-Pole, Medium Voltage, Three Phase 6600Y/3811 Volts (6 Leads) 3811 Volts Delta. Specifications: 570 & 740 Frame NEMA Class H Insulation, 1000 Frame NEMA Class F insulation, 1800 RPM, 40 C Ambient, 3 Phase, 0.8 Power Factor Lagging.
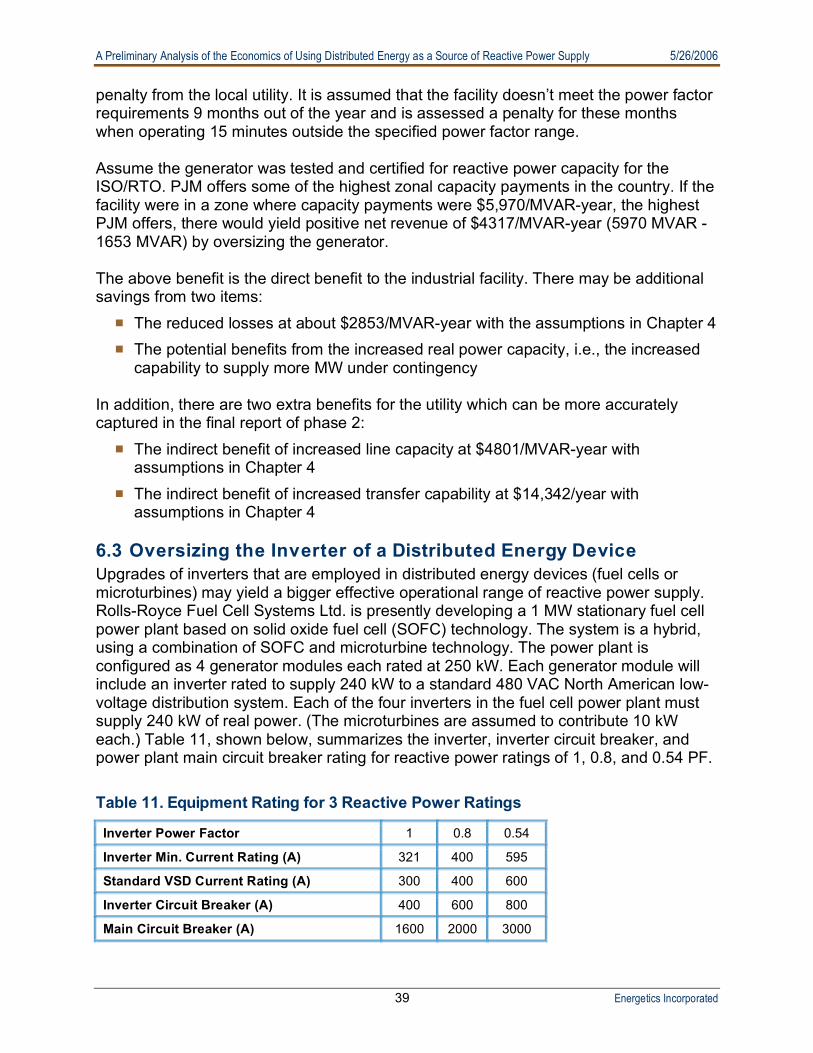
A Preliminary Analysis of the Economics of Using Distributed Energy as a Source of Reactive Power Supply 5/26/2006
39 Energetics Incorporated
penalty from the local utility. It is assumed that the facility doesn’t meet the power factor requirements 9 months out of the year and is assessed a penalty for these months when operating 15 minutes outside the specified power factor range. Assume the generator was tested and certified for reactive power capacity for the ISO/RTO. PJM offers some of the highest zonal capacity payments in the country. If the facility were in a zone where capacity payments were $5,970/MVAR-year, the highest PJM offers, there would yield positive net revenue of $4317/MVAR-year (5970 MVAR -1653 MVAR) by oversizing the generator. The above benefit is the direct benefit to the industrial facility. There may be additional savings from two items:
The reduced losses at about $2853/MVAR-year with the assumptions in Chapter 4 The potential benefits from the increased real power capacity, i.e., the increased
capability to supply more MW under contingency In addition, there are two extra benefits for the utility which can be more accurately captured in the final report of phase 2:
The indirect benefit of increased line capacity at $4801/MVAR-year with assumptions in Chapter 4
The indirect benefit of increased transfer capability at $14,342/year with assumptions in Chapter 4
6.3 Oversizing the Inverter of a Distributed Energy Device Upgrades of inverters that are employed in distributed energy devices (fuel cells or microturbines) may yield a bigger effective operational range of reactive power supply. Rolls-Royce Fuel Cell Systems Ltd. is presently developing a 1 MW stationary fuel cell power plant based on solid oxide fuel cell (SOFC) technology. The system is a hybrid, using a combination of SOFC and microturbine technology. The power plant is configured as 4 generator modules each rated at 250 kW. Each generator module will include an inverter rated to supply 240 kW to a standard 480 VAC North American low-voltage distribution system. Each of the four inverters in the fuel cell power plant must supply 240 kW of real power. (The microturbines are assumed to contribute 10 kW each.) Table 11, shown below, summarizes the inverter, inverter circuit breaker, and power plant main circuit breaker rating for reactive power ratings of 1, 0.8, and 0.54 PF. Table 11. Equipment Rating for 3 Reactive Power Ratings
Inverter Power Factor 1 0.8 0.54
Inverter Min. Current Rating (A) 321 400 595
Standard VSD Current Rating (A) 300 400 600
Inverter Circuit Breaker (A) 400 600 800
Main Circuit Breaker (A) 1600 2000 3000

A Preliminary Analysis of the Economics of Using Distributed Energy as a Source of Reactive Power Supply 5/26/2006
40 Energetics Incorporated
Table 12 shows the marginal cost of reactive power capacity for this system based on the quotations from a local representative of industrial motor drives and their associated electrical packaging business.
Table 12. Cost for additional MVAR Capability
PF 1 0.80 0.54
MVAR 0 0.72 1.50
Cost $280k $320k $420k
% change - 14% 50%
$/MVAR - $56k $93k
$/MVAR-year - $2,800 $4,650
Assumption: The lifetime of an inverter is 20 years. Table 12 shows the marginal cost of reactive power for this particular configuration of a 1 MW power plant is in the range of $56k to $93k per MVAR, or $2800 to $4650 per MVAR-year if lifetime is assumed to be 20 years. The marginal cost per MVAR increases as the reactive power capability is increased. This result is reasonable. The trigonometric relationship between real, reactive, and apparent power means that the inverter minimum current rating increased only about 25% for the first 0.72 MVAR, but reaching 1.50 MVAR requires an 85% increase in current rating over a unit with no reactive power capability. This option costs double to triple the investment as opposed to the option of oversizing generators. However, this option may provide faster response time. If compared with inverter-based technology like SVC, this option is appealing because the competing SVC technologies cost $50k to $100k per MVAR (assuming the same lifetime). These systems are typically much larger and enjoy economies of scale. The fact that 0.72 MVAR can be procured for as little as $56k per MVAR indicates that adding reactive power capability to DER inverters merits further investigation. The benefits to the customers and utilities from this option are essentially the same as described in the previous case study for oversizing generators. 6.4 Using Adjustable Speed Drives to Supply Reactive Power at
West Point56 In this case study, the system of the US Military Academy will be investigated for the option of Adjustable Speed Drives. The US Military Academy has a 1,500 kW diesel generator, and two steam turbines driving 1,250 kW generators. The turbines are older non-condensing turbines used only in the winter, and the exhaust steam is used to heat campus buildings. The generators are vintage1973 and operate at 1800 rpm. These generators would be ideal for use as synchronous condensers because they are connected to the turbines with removable couplings. In addition, there is a newer 1,500 56 Source: Reactive Power Supply from Local Distributed Energy Sources and the Possibility of Supplying Reactive Power from Generators at West Point, New York, by J. Kueck and D. Massie.

A Preliminary Analysis of the Economics of Using Distributed Energy as a Source of Reactive Power Supply 5/26/2006
41 Energetics Incorporated
kW steam turbine. These generators are installed with switchgear connecting them to the West Point distribution system, and they could be controlled either to regulate voltage or control the power factor on the West Point distribution system. However, reactive power does not travel well and there are some locations where it is needed and some locations where it is not. The local transmission operator at West Point is Orange and Rockland. Orange and Rockland has two capacitor banks on the 34.5 kV line that feeds West Point, and they usually operate only one. The second one is only connected during a heat wave when load is unusually high, and has only been used once in the last two years. Orange and Rockland has no need for reactive power from West Point. With the use of adjustable speed drives at West Point, it is easy to imagine that the net power factor could be corrected to near unity for the entire year. Adjustable speed drives are devices that change the voltage magnitude and frequency at the motor terminals. Adjustable speed drives are tremendous energy savers because motors that drive pumps or fans can be easily controlled to supply just the amount of water or air that is needed, with no wasted energy. When a pump or fan is used in an application where the flow requirement varies, as they often are, controlling the pump flow with an adjustable speed drive instead of a throttle valve can often save energy equal to one half the horsepower rating of the motor. Adjustable speed drives often have payback periods of less than one year.57 In addition, today’s adjustable speed drives can be used to change power factor values. They can be controlled to present a lagging, unity (1.0), or even a leading power factor. The option to control power factor is called an active front end. We can roughly approximate the savings as follows. Motor driven equipment accounts for 64 percent of the electricity consumed in the U.S. industrial sector.58 Let’s assume that just half of the West Point load, or 30% is motor load. To simplify, let’s assume that there are 10 motors drawing 200 kW at 0.8 power factor, slightly less than 30% of the 7 MW average load discussed above. If we equipped these motors with adjustable speed drives, we could supply about 1.6 MVAR of reactive power from these adjustable speed drives. Importantly, we could supply this reactive power at the motor terminals, where it does the most good in reducing losses. How much energy goes into heating in the cable and transformer system that feeds the 480 volt motors? Average distribution system losses account for 2% of plant annual energy use.59 If we use this two percent to calculate a system resistance for the circuits feeding the motors, the extra current flow associated with the 0.8 power factor accounts for roughly 15 kW. Installing adjustable speed drives to correct the power factor to 1.0
57 A good source for case studies, training and other links for energy savings from adjustable speed drives is provided at http://www.eere.energy.gov/industry/bestpractices/. 58 Source: U.S. DOE, Office of Energy Efficiency and Renewable Energy, Industrial Technologies Program, Motors, Pumps and Fans Fact Sheet., http://www.eere.energy.gov/industry/bestpractices/motors.html 59 Source: Energy Tips – Motor Systems, Motor Systems Tip Sheet #8, September, 2005, U.S. DOE, EERE, Industrial Technologies Program.

A Preliminary Analysis of the Economics of Using Distributed Energy as a Source of Reactive Power Supply 5/26/2006
42 Energetics Incorporated
would save roughly this amount of power. The 15 kW at an average energy cost of .062 $/kWh gives a total dollar savings of about $8,000 per year. The cost of installing adjustable speed drives is usually amortized by the energy savings realized by the reduction of losses in the air or water flow. Drives are often paid back in six months or less. Some utilities offer rebates for the installation of adjustable speed drives. For this reason, we will not consider the cost of installing the drives. If they are warranted by the conventional energy savings analysis, their cost will be quickly amortized. The savings of $8k per year will simply be an additional incentive. Calculation of Real Power Savings The site kW savings in cable and transformer heating from using adjustable speed drives to correct power factor was found in section 7 above to be 17.5 kW. Over a one year period this is 153 MW hours. Using the conversion factor of 3,412 Btu per kWh, this converts to 522 million source BTU savings. This is a meaningful level of source BTU savings, especially if it can be repeated at other commercial and industrial installations. Also, supplying reactive power from adjustable speed drives will provide an important service to distribution and transmission operators. The power factor of the load could be kept at 1.0, or even leading when needed. This will result in greater distribution and transmission system efficiency and reliability. Ultimately, providing a 1.0 power or leading power factor may result in compensation from the distribution company. 6.5 Indirect Benefits of Reactive Power Supply Several indirect benefits will be discussed in this sub-section and the next two sub-sections. To help readers understand the indirect benefit, a simple system is presented, as shown in Figure 11 below, to illustrate the methodology for capturing the indirect or hidden benefit. In the simple system shown below, there is a generation bus, a load bus, and a line connecting the two buses. Here we assume that the load power factor is 0.90, which makes P = 1 MW and Q = 0.484 MVAR numerically. We also assume that the compensation device will inject Qc = 0.156 MVAR to make the load power factor 0.95, i.e., P = 1 MW and Q = 0.329 MVAR.
G
P+jQ Qc
R+jX
Load
Generation
Center
Figure 11. A simple one-line power system.
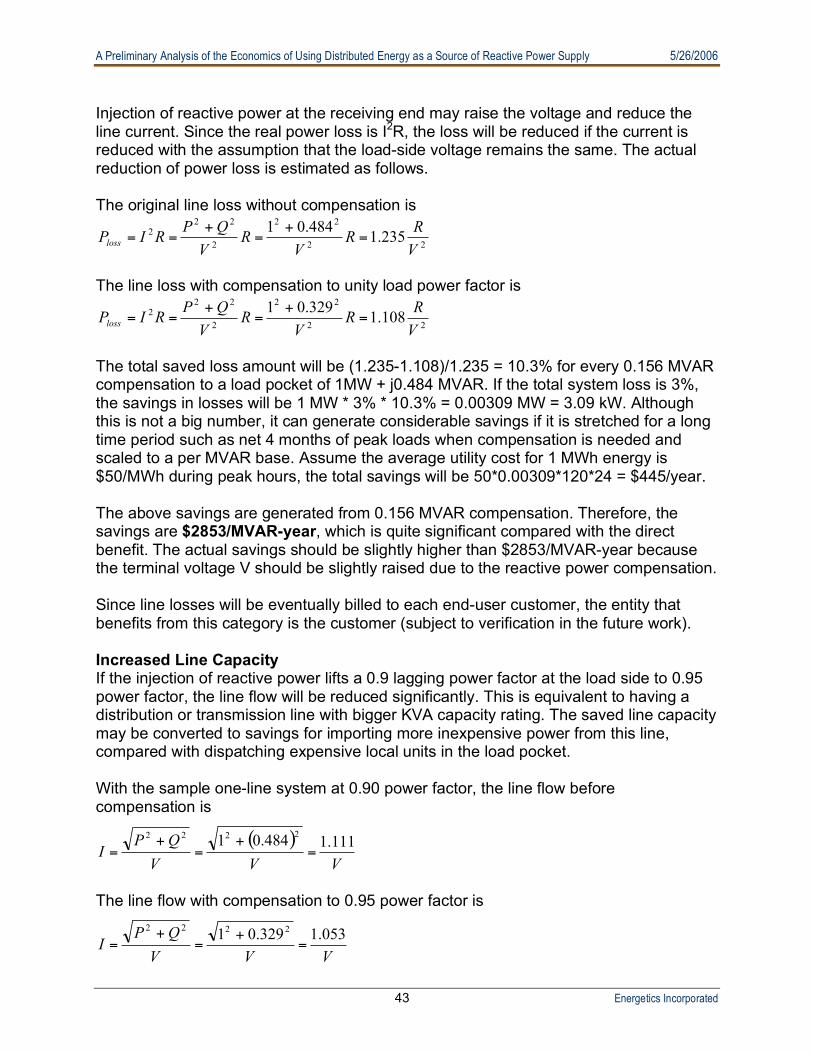
A Preliminary Analysis of the Economics of Using Distributed Energy as a Source of Reactive Power Supply 5/26/2006
43 Energetics Incorporated
Injection of reactive power at the receiving end may raise the voltage and reduce the line current. Since the real power loss is I2R, the loss will be reduced if the current is reduced with the assumption that the load-side voltage remains the same. The actual reduction of power loss is estimated as follows. The original line loss without compensation is
22
22
2
22
2235.1
484.01
V
RR
VR
V
QPRIPloss =
+=
+==
The line loss with compensation to unity load power factor is
22
22
2
22
2108.1
329.01
V
RR
VR
V
QPRIPloss =
+=
+==
The total saved loss amount will be (1.235-1.108)/1.235 = 10.3% for every 0.156 MVAR compensation to a load pocket of 1MW + j0.484 MVAR. If the total system loss is 3%, the savings in losses will be 1 MW * 3% * 10.3% = 0.00309 MW = 3.09 kW. Although this is not a big number, it can generate considerable savings if it is stretched for a long time period such as net 4 months of peak loads when compensation is needed and scaled to a per MVAR base. Assume the average utility cost for 1 MWh energy is $50/MWh during peak hours, the total savings will be 50*0.00309*120*24 = $445/year. The above savings are generated from 0.156 MVAR compensation. Therefore, the savings are $2853/MVAR-year, which is quite significant compared with the direct benefit. The actual savings should be slightly higher than $2853/MVAR-year because the terminal voltage V should be slightly raised due to the reactive power compensation. Since line losses will be eventually billed to each end-user customer, the entity that benefits from this category is the customer (subject to verification in the future work). Increased Line Capacity If the injection of reactive power lifts a 0.9 lagging power factor at the load side to 0.95 power factor, the line flow will be reduced significantly. This is equivalent to having a distribution or transmission line with bigger KVA capacity rating. The saved line capacity may be converted to savings for importing more inexpensive power from this line, compared with dispatching expensive local units in the load pocket. With the sample one-line system at 0.90 power factor, the line flow before compensation is
( )VVV
QPI
111.1484.012222
=+
=+
=
The line flow with compensation to 0.95 power factor is
VVV
QPI
053.1329.012222
=+
=+
=

A Preliminary Analysis of the Economics of Using Distributed Energy as a Source of Reactive Power Supply 5/26/2006
44 Energetics Incorporated
This saves (1.111-1.053)/1.111 = 5.2% of the total capacity of the transmission line assuming that the voltage remains the same. To capture this savings, we assume the line will reach its limit during the peak hours, i.e., 4 net months. Therefore, 0.052 MW can be transferred over from generation center to load pocket for every 1 MW load. Assume that the price difference is $5/MWh between the generation center and load pocket. (This is a reasonable estimation if considering the price difference between New York City or Boston and their neighboring areas.) Hence, the total savings for the 4 peak month will be $5/MWh*0.052*120 days*24 hours = $749/year. This is the savings from 0.156 MVAR compensation. So the saving per MVAR-year will be $4801/MVAR-year. Typically, the entity that benefits from this category is the utility and/or transmission company since they own the networks. Increased Maximum Transfer Capability The maximum transfer capability of the sample system is given as
P
QkandVEwhere
X2
)k1k(EP
22
max ==++!
=
Again, assume the compensation lifts the power factor from 0.9 to 0.95. Or, from 1MW + j0.484MVAR to 1MW + j0.329MVAR and that the voltage remains the same. It can be easily verified that the max transfer capacity has been improved by 15.5%. Therefore, during the 4 months of peak load, the system may move 15.5% more inexpensive MW from generation center to load center while keeping roughly the same voltage stability margin. Again, this can be converted to a dollar savings amount as $5/MWh*0.155*120 days *24 hours = $2232/year. If the compensation is scaled to $/MVAR, it is as significant as $14342/MVAR-year. As stated in the previous sub-section, the entity that benefits is the utility and/or transmission company since they are the network owners. Other Benefits It should be mentioned that there may be many other benefits that are difficult to quantify such as better voltage regulation and voltage quality. Also, the transmission line tends to be more reliable when it carries less current as shown above. More details will be discussed in the future research.

A Preliminary Analysis of the Economics of Using Distributed Energy as a Source of Reactive Power Supply 5/26/2006
45 Energetics Incorporated
7. CONCLUSIONS A major blackout affecting 50 million people in the Northeast United States, where insufficient reactive power supply was an issue, and an increased number of filings made to the Federal Energy Regulatory Commission by generators for reactive power has led to a closer look at reactive power supply and compensation. The Northeastern Massachusetts region is one such area where there is an insufficiency in reactive power compensation. Distributed energy due to its close proximity to loads seems to be a viable option for solving any present or future reactive power shortage problems. Industry experts believe that supplying reactive power from synchronized distributed energy sources can be 2 to 3 times more effective than providing reactive support in bulk from longer distances at the transmission or generation level. Several technology options are available to supply reactive power from distributed energy sources such as small generators, synchronous condensers, fuel cells or microturbines. In addition, simple payback analysis indicates that investments in DG to provide reactive power can be recouped in less than 5 years when capacity payments for providing reactive power are larger than $5,000/kVAR and the DG capital and installation costs are lower than $30/kVAR. However, the current institutional arrangements for reactive power compensation present a significant barrier to wider adoption of distributed energy as a source of reactive power. Furthermore, there is a significant difference between how generators and transmission owners/providers are compensated for reactive power supplied. The situation for distributed energy sources is even more difficult, as there are no arrangements to compensate independent DE owners interested in supplying reactive power to the grid other than those for very large IPPs. There are comparable functionality barriers as well, as these smaller devices do not have the control and communications requirements necessary for automatic operation in response to local or system operators. There are no known distributed energy asset owners currently receiving compensation for reactive power supply or capability. However, there are some cases where small generators on the generation and transmission side of electricity supply have been tested and have installed the capability to be dispatched for reactive power support. Several concerns need to be met for distributed energy to become widely integrated as a reactive power resource.
The overall costs of retrofitting distributed energy devices to absorb or produce reactive power need to be reduced.
There needs to be a mechanism in place for ISOs/RTOs to procure reactive power from the customer side of the meter where distributed energy resides.
Novel compensation methods should be introduced to encourage the dispatch of dynamic resources close to areas with critical voltage issues.

A Preliminary Analysis of the Economics of Using Distributed Energy as a Source of Reactive Power Supply 5/26/2006
46 Energetics Incorporated
The next phase of this research will investigate in detail how different options of reactive power producing DE can compare both economically and functionally with shunt capacitor banks. Shunt capacitor banks, which are typically used for compensating reactive power consumption of loads on distribution systems, are very commonly used because they are very cost effective in terms of capital costs. However, capacitor banks can require extensive maintenance especially due to their exposure to lightning at the top of utility poles. Also, it can be problematic to find failed capacitor banks and their maintenance can be expensive, requiring crews and bucket trucks which often requires total replacement. Another shortcoming of capacitor banks is the fact that they usually have one size at a location (typically sized as 300, 600, 900 or 1200kVAr) and thus don’t have variable range as do reactive power producing DE, and cannot respond to dynamic reactive power needs. Additional future work is to find a detailed methodology to identify the hidden benefit of DE for providing reactive power and the best way to allocate the benefit among customers, utilities, transmission companies or RTOs. With the hidden benefits discovered, it will be easier for the policy maker to re-assess the value of reactive power and to form a sound competitive market for this service. Along with the capability of DE to provide local reactive power, a market needs to exist to promote the operation of DE to regulate voltage and net power factor. There are a number of potential benefits that have been identified including capacity relief, loss reduction, improved system reliability, extended equipment life, reduced transport of reactive power from the G&T, and improved local voltage regulation and power factor. An attempt has been made using very simple data and cases to quantify these benefits. Only the model of a larger and more detailed distribution system with DE can truly give a full picture of the benefits that reactive power from local DE can provide. Obviously, the extent of the benefit will depend on the location and quantity of DE that is installed on the distribution system and operated to achieve voltage regulation and/or net power factor correction.

A Preliminary Analysis of the Economics of Using Distributed Energy as a Source of Reactive Power Supply 5/26/2006
47 Energetics Incorporated
APPENDIX A. CONVERTING A DISTRIBUTED ENERGY DEVICE INTO A SYNCHRONOUS CONDENSER As mentioned in the body of the report, a technology capable of converting distributed energy devices into synchronous condensers is offered by SSS Clutch Company, based in New Castle, Delaware. The company has been installing clutches between generators and several drivers including reciprocating engines, steam and combustion turbines since the 1970s. The clutch acts by completely disengaging the prime mover and the generator when only reactive power is needed. When active or real power is needed, the SSS clutch automatically engages for electric power generation. When the turbine is shut down, the clutch disengages automatically leaving the generator rotating to supply reactive power only for power factor correction, voltage control, or spinning reserve. Throughout these changing modes, the generator can remain electrically connected to the grid, thus providing a quick response to system demands.
Figure A-1. Elements of Basic SSS Clutch Source: SSS Clutch

A Preliminary Analysis of the Economics of Using Distributed Energy as a Source of Reactive Power Supply 5/26/2006
48 Energetics Incorporated
SSS clutches can be installed on turbine generators from 0.5 MW to 300 MW. The smallest installation to date of the technology is on a 1 MW turbine generator. The clutch costs approximately 3% of the price of a new power plant. The clutch has not been used on combined cycle or hydro units for this application. When active or real power is needed, the SSS clutch automatically engages for electric power generation. When the turbine is shut down, the clutch disengages, leaving the generator rotating to supply reactive power or spinning reserve. Figure A-1 depicts an internal schematic of the clutch system. Figure A-2 shows the outside view of the clutch. Regardless of operating mode, the generator remains electrically connected to the grid, thus providing instantaneous response to system needs. Table A-1 below details a selected number of SSS Clutch installations in the U.S. for synchronous condensing. Table A-1. SSS Clutch Installations for Synchronous Condensing in the U.S.
Installation Date
Customer Location Generator Size
Number of Units
Capital Cost Application
1995 Pacificorp Salt Lake City 25 MW 1 600,000 Reactive Power
1997 KP&L Kansas City 172 MW 1 800,000 Reactive Power
1998 City of Key West
Key West 34 MW 1 500,000 Reactive Power
1998 ComEd Chicago 1150 MW 2 $8 Million Reactive Power
1998 PG&E San Jose 60 MW 1 250,000 Reactive Power
1999 Williams Scranton 30 MW 1 unknown Spinning Reserve and Reactive Power
2000 Tenaska New Church 50 MW 4 700,000 each
Spinning Reserve and Reactive Power
2001 PSE&G Kearny 50 MW 4 700,000 each
Spinning Reserve and Reactive Power
2001 PSE&G Burlington 50 MW 4 700,000 each
Spinning Reserve and Reactive Power
2002 GWF Lemoore 50 MW 2 700,000 each
Reactive Power
2002 Ottertail Fergus Falls 50 MW 1 700,000 Reactive Power
Figure A-2. External View of an SSS Clutch System

A Preliminary Analysis of the Economics of Using Distributed Energy as a Source of Reactive Power Supply 5/26/2006
49 Energetics Incorporated
A potential advantage of using distributed generators for reactive power supply is that many are already located near load pockets and are thus well-positioned to provide reactive power compensation as needed. This may enable them to relieve voltage stability problems as efficiently and inexpensively as large generators located elsewhere. Once a generator is converted into a synchronous condenser it could also be eligible to participate in spinning reserve markets. Table A-2 presents cost benefit analyses on two SSS clutch retrofits for participation in the spinning reserve market. Generators retrofitted for spinning reserve could also be candidates for supplying reactive power on an as needed basis.
GE LM 6000 with SSS Clutch
P&W FT4 or FT8 Twinpac with 2 SSS Clutches
P&W FT4 or T8T Twinpac without
SSS Clutches
Losses to spin 500 kW 800 kW 3750 kW
Estimated cost to purchase power $.06/kWh $.06/kWh $.06/kWh
Electricity cost to operate in spinning reserve mode
$30/hr $48/hr $225/hr
Revenue of current spinning reserve of $12/MWh
$600/hr $600/hr $600/hr
Daily gross revenue for spinning 15 hours/day
$9,000 $9,000 $9,000
Daily cost of electricity for spinning $450 $720 $3,375
Daily potential net revenue (gross revenue minus cost of electricity)
$8,550 $8,280 $5,625
Estimated cost to retrofit clutches $750,000 $1,000,000 $1,000,000
Estimated number of days to pay for retrofit 88 376 N/A
60 Source: SSS Clutch Company
Table A-2. Economic Justification for Clutch Retrofit60
A Preliminary Analysis of the Economics of Using Distributed Energy as a Source of Reactive Power Supply 5/26/2006
50 Energetics Incorporated
APPENDIX B. ADDITIONAL INFORMATION ON ISOS/RTOS PJM PJM Interconnection, LLC (PJM) compensates all generators with a payment equal to the generation owner’s monthly revenue requirements as accepted or approved by the FERC.61 In order to qualify, generators have to be under the control of the control area operator and be operated to produce or absorb reactive power. PJM also provides lost opportunity costs payments when there is a reduction in real power output. The Transmission Provider maintains voltage scheduling oversight to ensure that all sources of reactive power are treated in an equitable manner. The Transmission Provider may change schedules as necessary to maintain system reliability. Local control center operators may also direct changes to generators’ voltage schedules or reactive output. Control systems on generators are supposed to react automatically to changing system conditions and to increase or decrease reactive power output as needed to maintain local voltages.62 Generators must be built to maintain a composite power delivery at continuous rated power output at the generator’s terminals at a power factor of at least 0.95 leading to 0.90 lagging. The Transmission Provider may allow small generation resources to meet lower standards. Generators must follow the Transmission Providers instructions to produce reactive power within the generators’ design limitations. PJM actively updates and manages the generators that provide reactive power supply. They conduct annual reactive reserve checks to update the data on generator reactive power capability (“D” curves).63 They are currently reviewing the power factor standards to be applied to member companies, with the initial recommendation that all zones and members must present an absolute minimum power factor (PF) of 0.97 lagging to the PJM system.64 Finally, PJM’s Reactive Services Working Group is actively studying ways to reduce the amounts of compensation for reactive power supplies, which has been steadily rising over the past several years. PJM’s Load Power factor Working Group, who proposed the 0.97 power factor, was recently disbanded as they have come up with a general consensus, and will present their findings to the Market Implementation Committee. MISO The Midwest Independent Transmission System Operator Inc. (MISO) compensates generators owned by transmission owners for providing reactive power. On June 25, 2004, while agreeing that generators providing reactive power to support the 61 http://www.pjm.com/documents/ferc/documents/2005/march/20050311-er05623.pdf 62 PJM Manual 27, Open Access Transmission Tariff Accounting, Revision 45, February 15, 2005 63 See http://www.pjm.com/services/training/downloads/20050607-seminar-reactive-pwr-print.pdf 64 PJM Load Power Factor Analysis Report, Report to the PJM Planning Committee, PJM Load Power Factor Working Group, May 2005

A Preliminary Analysis of the Economics of Using Distributed Energy as a Source of Reactive Power Supply 5/26/2006
51 Energetics Incorporated
transmission system should be compensated, FERC rejected a MISO proposal to provide IPPs with compensation.65 Rates are based on control area operator rates filed at FERC and are paid where the load is located (zonal basis) and loads outside MISO are charged on an average system-wide rate. MISO does not provide for lost opportunity costs for producing reactive power instead of real power. Compensation for reactive power is treated as a pass-through of revenues from individual control area operators.66 NY ISO The New York Independent System Operator Inc. (NYISO) compensates all large, conventional generators for reactive power, but those owned by utilities are compensated differently from non-utility generators under purchased power agreements. Payments are made from a pool consisting of total costs incurred by generators that provide voltage support service, and 2004 rates were calculated by dividing 2002 program costs of $61 million by the 2002 generation capacity expected of 15,570 MVar, resulting in a compensation rate of $3,919/Mvar per year.67 Every year a resource must demonstrate that it has successfully performed reactive power capability testing. An additional requirement is the ability to produce/absorb reactive power within the resource’s tested reactive capability, and to maintain a specific voltage level under steady-state and contingency conditions. Payments are withheld if the unit fails to respond when called upon or following a contingency. Payments made for voltage support billing by all transmission customers, LSE’s, exports, and wheel-throughs is $0.39/MWH for 2005. This was calculated by estimating the total reactive support payments of approximately $61 M and dividing by the estimated total annual energy in MWH (158,013,000 MWH in 2004).68 ISO NE ISO-NE provides $1050 per MVAR-year for reactive compensation, but is reduced if the active capacity reserve margin is more than 20%.69 ISO-NE has formed a VAR working group and is examining the forms of payment and whether others are appropriate. The group is looking to extend these payments to generators that have been retired. One of the questions they have is if it is appropriate to pay them for this service. The VAR working group is also looking into making the capacity VAR payment more locational by providing additional compensation in more constrained areas. As a result of the FERC Staff report, ISO-NE is looking specifically into the following issues:
the treatment of static versus dynamic reactive power procurement and sources the compensation of both leading and lagging reactive power capabilities
65 Midwest Independent System Transmission Operator, Inc., Docket No. ER04-961-000 109 FERC 61,005 66 FERC Report on Supply and Consumption, Docket AD05-1-000, February 4, 2005, http://www.ferc.gov/EventCalendar/Files/20050310144430-02-04-05-reactive-power.pdf 67 http://www.nyiso.com/services/documents/b-and-a/rate_2/2005_oatt_mst_sched2_vss_rates.pdf 68 NYISO 2004 Annual Report, http://www.nyiso.com/public/webdocs/company/about_us/annual_report/annual2004final.pdf 69 Presentation Alan Robb, GridAmerica LLC, for the Harvard Electricity Policy Group 12/2/04
A Preliminary Analysis of the Economics of Using Distributed Energy as a Source of Reactive Power Supply 5/26/2006
52 Energetics Incorporated
the determination of the types of reactive power devices that should be eligible for compensation
the sufficiency of the present compensation methodology the specific compensation amounts within the methodology the cost allocation methodology for reactive power potential market power associated with changing the existing Schedule 2 integration with other market reforms in New England, such as the advent of
LICAP There are a number of old, inefficient generators in New England that have applied, or may soon apply for retirement. Since 2002, ISO-NE has been investigating the benefits of the conversion of these generators so that they can operate as synchronous condensers to provide dynamic reactive power in critical areas. ISO-NE has looked primarily at converting generators at the transmission level. Generator owners are interested in converting their units to synchronous condensers, but clear incentives need to be in place before any capital is spent.70 New England is divided into reactive analysis zones, each of which has a maximum and minimum load power factor during peak loads. Keeping within this range is the responsibility of the local transmission owner. When utilities do not meet the power factor criteria, ISO-NE sends them a formal letter stating how far outside the range they fall. There is not a penalty associated with this; rather, ISO-NE works to remedy the problem through the stakeholder process. Based on the information that ISO-NE sends, the utility can determine the additional MVAR capacity required and build that into their rate case. The formal documentation from ISO-NE assists the utility in making the case for a higher tariff. Penalties are not imposed based on failure to provide reactive power. However, according to Cinergy Services, the current rate design for reactive power may not be valid to apply to all generators. “Not all generators are equal in providing reactive power.” This is a significant rate design issue.” Cinergy also calls for FERC to implement a penalty (or incentive) system to ensure that generators are available for provision of reactive power when needed.71 The capital costs for devices providing reactive power including capacitors, synchronous condensers and Flexible AC Transmission Systems (FACTS) are collected by transmission owners through transmission rates. As with other ISOs/RTOs, generators in ISO-NE must be able to deliver or absorb reactive power with a power factor consistent with the interconnecting Transmission Provider’s requirements, and must operate with Active Voltage Regulation (AVR) unless otherwise directed by the Transmission Provider. If a generator does not have sufficient reactive power capacity or fails to dispatch that capacity as directed by the system
70 Personal communication with Dave Bertagnolli, ISO-NE, August 17, 2005 71 Testimony by Ronald Snead of Cinergy Services at the March 8 hearing at FERC

A Preliminary Analysis of the Economics of Using Distributed Energy as a Source of Reactive Power Supply 5/26/2006
53 Energetics Incorporated
operator, the Transmission Provider may install the needed reactive compensation equipment at the generator’s expense. Transmission customers must maintain overall load power factors and reactive power supply within predefined regions in accordance with standards set by the system operator. If a transmission customer lacks sufficient capability for this purpose, the Transmission provider may install the needed reactive compensation equipment at the customer’s expense.72 ISO-NE is currently considering compensation for merchant HVDC converter reactive output. To receive payment for reactive power, generators must demonstrate their capability. A test is scheduled during the summer when the generator must sustain their reactive power output at maximum real power output for one hour. In lieu of an actual test, historical data can be submitted. Certain units in New England are not allowed to achieve their full reactive power output during a test because to do so would compromise system reliability. In such cases, ISO-NE reviews manufacturer’s data supplied by the generator owner.73 SPP The Southwest Power Pool Inc.’s (SPP) compensation for reactive power is a pass through of the revenues collected by individual control operators.74 Each control area operator shall specify a voltage or reactive schedule to be maintained by each synchronous generator at a specified bus. Generators shall be able to run at maximum rated reactive and real output according to each unit’s capability curves during emergency conditions for as long as acceptable frequency and voltages allow the generator to continue to operate. Generators shall be exempt from this if they meet the following criteria:75
Generator output less than 20MW Generation is of intermittent variety (wind generation)
CAISO In the California Independent Service Operator Corporation’s service territory all loads and distribution companies directly connected to the ISO-controlled grid must maintain reactive flow at grid interface points within a power factor band of 0.97 lagging to 0.99 leading. Power factors for both generators and loads are measured at their respective interconnection points with the ISO-controlled grid. The ISO levies penalties against generators, loads, and distribution companies who do not comply with the power factor requirements. CAISO issues daily voltage schedules. Generators that have contractual arrangements with the ISO must comply with the power factor requirements set forth in their contracts, while those that do not must adhere to the power factor requirements applicable under the FERC tariff of the transmission owner to whom they are connected. Subject to geographical requirements, the ISO chooses the least costly generators from a merit
72 New England Power Pool Document, 2002a, p.7 73 http://elibrary.ferc.gov/idmws/common/opennat.asp?fileID=10480067 74 FERC Report on Supply and Consumption, Docket AD05-1-000, February 4, 2005, http://www.ferc.gov/EventCalendar/Files/20050310144430-02-04-05-reactive-power.pdf 75 http://www.spp.org/Publications/SPP_Criteria.pdf

A Preliminary Analysis of the Economics of Using Distributed Energy as a Source of Reactive Power Supply 5/26/2006
54 Energetics Incorporated
order ranking to produce additional voltage support in each location where voltage support is needed. ERCOT The Electric Reliability Council of Texas (ERCOT), which is not subject to FERC jurisdiction, defines voltage support from two different perspectives. First, this service is the provision, by Qualified Scheduling Entities (QSE) to ERCOT, of a generation resource whose power factor and output voltage level can be scheduled by ERCOT to maintain transmission voltages within acceptable limits. Second, this service is the provision, by ERCOT to the QSEs, of the coordinated scheduling by ERCOT of voltage profiles to maintain transmission voltages throughout the system. Texas’ reactive power dispatch is unusual in that it attempts to minimize the dependence on generation-supplied reactive power. This minimization reflects Texas’ philosophy that ERCOT should have the smallest possible role in Texas’ markets, and should therefore direct generator dispatch as little as possible. ERCOT does determine voltage support needs by location and posts all voltage profiles on its Market Information System, thus letting QSEs know the desired voltages at their points of generation interconnection. QSEs are required to respond to changes in these voltage profiles. ERCOT deploys static reactive power resources so that QSEs can maintain dynamic reactive reserves that are adequate to meet ERCOT System requirements. In Texas, generators must be capable of providing reactive power over at least the range of power factors of 0.95 leading or lagging, measured at the unit main transformer high voltage terminals. This capability must be maintained at all times during which the plant is on-line. There is no compensation for reactive power service within this range. Some generators – namely those that are qualified renewable generators and/or were in operation prior to September 1, 1999 – are held to lower requirements based upon the quantity of reactive power that they can produce at rated real power capability.

A Preliminary Analysis of the Economics of Using Distributed Energy as a Source of Reactive Power Supply 5/26/2006
55 Energetics Incorporated
APPENDIX C. OVERSEAS REACTIVE POWER COMPENSATION PRACTICES Table C-1 gives a snapshot of international arrangements for reactive power compensation.
Region Institutional Arrangements for Reactive Power Compensation
Payments/ Penalties
Required Power Factor Capability Range for
Generators (leading/lagging)
Argentina Obligatory within power factor range
$0.15/MVarh for an announced generator
outage
Australia Availability payment, lost profits and enabling payment
0.93/0.90
Belgium Ratcheting penalties for power factor
Outside of 0.95/0.95 penalty is $7.83/MVarh
Canada
Alberta Obligatory within power factor range
0.90/0.90
British Columbia No compensation
Manitoba Compensated outside power factor range
Ontario Compensated outside power factor range
0.95/0.90
Quebec No compensation
Chile Investigating a market based approach76
India Buy and sell when voltage drops below 97% of nominal
$1/MVarh
Ireland Availability and production/consumption payment
$1.50/MVarh
Japan Discount of base rate if customer improves power factor
Netherlands Capacity payment only
Norway No compensation
UK (England and Wales)
Default payment or offer 1 year contracts
$2.40/MVarh
0.95/0.85
Sweden No compensation
76 Michael Pollitt, Electricity Reform in Chile Lessons for Developing Countries, University of Cambridge, September 2004, http://web.mit.edu/ceepr/www/2004-016.pdf
Table C-1. Regional Comparison of International Arrangements for Reactive Power Compensation
A Preliminary Analysis of the Economics of Using Distributed Energy as a Source of Reactive Power Supply 5/26/2006
56 Energetics Incorporated
Canada The provinces of Canada each have their own set of reactive power compensation rules. Alberta The interconnection requirements of the Transmission Administrator state that generators must be capable of producing and absorbing reactive power within a 0.90 lagging and 0.90 leading power factor range, which some older generators cannot meet. Alberta apparently obtains additional voltage support from generators through programs involving location-based credits and transmission must-run schemes. In addition, consistent with the Western Electricity Coordinating Council (WECC) requirements, generators must be equipped with automatic voltage regulators on automatic voltage control mode and with power system stabilizers.77 Manitoba Generators are compensated when they produce reactive power outside the transmission operator’s specified range. Ontario All generators connected to the grid and greater than 10MW are required to have the capability of supplying reactive power in the range of 90% lagging and 95% leading. Generators are compensated for lost profits if directed to operate outside this market range. Quebec and British Columbia Reactive support and voltage control is treated as an ancillary service and the customers pay the supplier. There are no other penalties or incentives for reactive power. Australia In Australia, the National Electricity Market Management Company (NEMMCO) is the ISO. For their preparedness in providing reactive power service, all reactive power ancillary service providers are eligible for an availability payment. Further, synchronous compensators also receive an enabling payment component when their service is activated by the ISO for use. Synchronous generators also receive compensation for lost profits from producing reactive power instead of real power. The payment for reactive power is equal to the availability.78 The provision for reactive power from generators is separated in two categories, 1) the mandatory reactive power support, and 2) reactive power as an ancillary service. It is mandatory for the generators to provide reactive power within the operating power factors of 0.9 lagging and 0.93 leading. Beyond this mandatory component is the ancillary service component, which is left to the generators to offer.
77 FERC Report on Supply and Consumption, Docket AD05-1-000, February 4, 2005, http://www.ferc.gov/EventCalendar/Files/20050310144430-02-04-05-reactive-power.pdf 78 On Some Aspects of Design of Electric Power Ancillary Service Markets, Thesis for the Degree of Doctor of Philosophy, Jin Zhong, Chalmers University of Technology, Göteberg, Sweden 2003, http://www.elkraft.chalmers.se/Publikationer/EKS.publ/Abstract/2003/JinPhD.html

A Preliminary Analysis of the Economics of Using Distributed Energy as a Source of Reactive Power Supply 5/26/2006
57 Energetics Incorporated
New Zealand New Zealand defines the service as “the dispatch of reactive power and other support resources with the objective of managing voltage within the normal limits set out in the coordination policy.”79
Although New Zealand recognizes that voltage control can be provided by a wide variety of resources, the only resources that receive payment for voltage support ancillary services are certain capacitors owned by the transmission firm, static VAR compensators, generators in synchronous compensation mode, and generators that are constrained to provide voltage support. Transpower, which owns and operates New Zealand’s high-voltage electricity transmission grid, requires generators to provide reactive power capability and distributors to meet power factor limits under its connection contracts. These mandated requirements are often sufficient to ensure voltage standards are met, particularly where load and generation are balanced and transmission lines are lightly loaded. Generators are not compensated for meeting these requirements. Norway No compensation is paid to generators for reactive power. 80 Sweden No compensation is paid to generators for reactive power.81 Generators of more than 10 MVA rating are required to maintain reactive power reserves during normal system conditions: 82 United Kingdom In the U.K. (England and Wales), the Grid Code connection conditions specify that all generators must be capable of supplying their rated power output at any point between the limits 0.85 power factor lagging and 0.95 power factor leading at the generator terminals. Additional services above the mandatory conditions include commercial services such as synchronous compensation and extended power factor ability. A generator can accept a default payment for reactive power of approximately $2.40/MVarh leading or lagging. An alternative is that the generator may offer contracts up to one year. Ireland ESB National Grid is (ESBNG) is responsible for operating Ireland's national electricity transmission system. Through ESBNG’s dispatch instructions, generators adjust reactive power output. These units are compensated $1.50/MVArh for producing and consuming reactive power. Additionally, they are compensated $0.30/MVArh for being
79 Grid Security Committee Ancillary Service Working Group [2000b, pp. 16-17] 80 The Energy Market in Norway and Sweden: Introduction, Christie, R.D.; Wangensteen, I.; Power Engineering Review, IEEE, Volume 18, Issue 2, Feb. 1998 Pages 44 - 45 81 Ibid 82 On Some Aspects of Design of Electric Power Ancillary Service Markets, Thesis for the Degree of Doctor of Philosophy, Jin Zhong, Chalmers University of Technology, Göteberg, Sweden 2003, http://www.elkraft.chalmers.se/Publikationer/EKS.publ/Abstract/2003/JinPhD.html
A Preliminary Analysis of the Economics of Using Distributed Energy as a Source of Reactive Power Supply 5/26/2006
58 Energetics Incorporated
available to produce or consume reactive power. ESBNG has a 200MVar lagging and 120MVar leading capability.83 Thailand For a customer with a lagging power factor, if in any monthly billing period during which the customer’s maximum 15-minute reactive power demand (kVAR demand) exceeds 61.97% of his maximum 15-minute active power demand (kW demand), a power factor charge of Baht 14.02 (US $0.35) will be made on each kVAR in excess, determined to the nearest whole kVAR, discarding the fraction of 0.5 kVAR.84 Chile Chile is investigating a market based approach to compensate for reactive power.
83 http://www.eirgrid.com/EirGridPortal/DesktopDefault.aspx?tabid=Ancillary%20Services 84 http://www.eppo.go.th/power/pw-Rate-MEA-Unbundled.html

A Preliminary Analysis of the Economics of Using Distributed Energy as a Source of Reactive Power Supply 5/26/2006
59 Energetics Incorporated
APPENDIX D. MISO ANCILLARY SERVICES SCHEDULE 2 PRICING FOR REACTIVE POWER AND VOLTAGE CONTROL
On-Peak
Hourly $/MW-
HR
Off-Peak
Hourly $/MW-
HR
On-Peak Daily
$/MW-DY
Off-Peak Daily
$/MW-DY
Weekly $/MW-
WK Monthly
$/MW-MO Yearly
$/MW-YR
ALTE $0.2300 $0.1100 $3.7000 $2.6000 $18.5000 $80.0000 $960.0000
ALTW $0.3800 $0.1800 $6.0000 $4.3000 $30.0000 $130.0000 $1,560.0000
AMRN $0.1200 $0.1200 $2.8500 $2.8500 $20.0100 $86.7000 $1,040.4000
ATSI $0.3075 $0.1460 $4.9195 $3.5043 $24.5973 $106.5883 $1,279.0601
CILC $0.0688 $0.0333 $1.1000 $0.8000 $5.4000 $23.4000 $280.8000
CIN $0.3500 $0.3500 $8.0000 $8.0000 $50.0000 $216.0000 $2,592.0000
CWLD $0.0000 $0.0000 $0.0000 $0.0000 $0.0000 $0.0000 $0.0000
CWLP $0.4945 $0.3297 $11.0769 $7.9121 $55.3846 $240.0000 $2,880.0000
EKPC
GRE $0.6346 $0.3014 $10.1538 $7.2329 $50.7692 $220.0000 $2,640.0000
HE $0.6438 $0.6438 $10.3000 $10.3000 $51.4000 $222.9000 $2,675.3000
IP $0.1500 $0.0720 $2.4200 $1.7280 $12.1000 $52.4000 $628.8000
IPL $0.3100 $0.3100 $5.0000 $5.0000 $25.0000 $110.0000 $1,300.0000
ITC *** $0.3900 $0.1800 $6.2300 $4.4400 $31.1600 $135.0400 $1,620.4800
LES
LGEE $0.3000 $0.1500 $5.0000 $3.6000 $25.0000 $108.0000 $1,300.0000
MDU $0.1168 $0.1168 $2.8022 $2.8022 $19.6154 $85.0000 $1,020.0000
METC $0.6900 $0.6900 $11.1100 $11.1100 $55.5500 $241.0400 $2,892.4200
MGE $0.0800 $0.0800 $1.9200 $1.9200 $13.4800 $58.4000 $700.8000
MHEB $0.7079 $0.3362 $11.3262 $8.0679 $56.6308 $245.4000 $2,944.8000
MISO ** $0.3734 $0.1773 $5.9743 $4.2557 $29.8715 $129.4432 $1,553.3184
MP $0.0959 $0.0959 $2.3014 $2.3014 $16.1538 $70.0000 $840.0000
MPS $0.1200 $0.1200 $1.8800 $1.8800 $9.3800 $41.0000 $492.0000
NIPS $0.1511 $0.1511 $3.6264 $3.6264 $25.3846 $110.0000 $1,320.0000
NSP $0.2260 $0.1270 $4.0000 $3.0000 $12.1000 $93.0000 $1,116.0000

A Preliminary Analysis of the Economics of Using Distributed Energy as a Source of Reactive Power Supply 5/26/2006
60 Energetics Incorporated
On-Peak
Hourly $/MW-
HR
Off-Peak
Hourly $/MW-
HR
On-Peak Daily
$/MW-DY
Off-Peak Daily
$/MW-DY
Weekly $/MW-
WK Monthly
$/MW-MO Yearly
$/MW-YR
OTP $0.1500 $0.1500 $3.5300 $3.5300 $24.7400 $107.2200 $1,287.0000
SIGE $0.2712 $0.1288 $4.3000 $3.1000 $21.7000 $94.0000 $1,128.0000
SIPC $0.2750 $0.2750 $4.4000 $4.4000 $22.0000 $95.3000 $1,143.0000
UPPC $0.1660 $0.0790 $2.7000 $1.9000 $13.3000 $57.6000 $691.6000
WEC $0.2100 $0.1000 $3.3200 $2.3700 $16.6200 $72.0000 $864.0000
WPEK $0.3650 $0.1740 $5.8460 $4.1640 $29.2300 $126.6635 $1,519.9625
WPS $0.2300 $0.1100 $3.7000 $2.6000 $18.6000 $81.0000 $967.0000
AVERAGE $0.2869 $0.1946 $4.9829 $4.1098 $26.1226 $114.6032 $1,374.5580
** MISO Rate charged for Sinks external to MISO (non-MISO members) *** ITC (DECO) charges apply for ITC Schedule 2

A Preliminary Analysis of the Economics of Using Distributed Energy as a Source of Reactive Power Supply 5/26/2006
61 Energetics Incorporated
APPENDIX E. DESCRIPTION OF A VOLTAGE COLLAPSE DIAGNOSTIC SOFTWARE85 New software is now available to assess the magnitude and location of the reactive needs in a particular system for contingencies, transfers, loading changes, or power factor changes. The tool, developed by Intellicon Inc. (Holt, MI), finds all areas that are susceptible to voltage instability and searches for all contingencies that have no load flow solution. It then prescribes preventive control that adds reactive reserves to the areas affected by the contingency to provide a sufficient margin. Methodology The Intellicon software evaluates reactive power need in an electrical system by going through the following steps:
1. It breaks the study system into subnetworks by computing V-Q curves at all buses in a large region while monitoring the generators that exhaust reactive supply. The subnetworks are the groups of buses and the set of generators that protect them from voltage instability. The subnetworks are shown as circles in Figures E-1 to E-4 below.
2. It finds the nested sets of subnetworks that are of increasing size in terms of the buses and generators contained in the subnetworks.
3. It finds area subnetworks that are the largest subnetworks in each nested set and their buses and generators. The nested subnetworks for any area subnetwork in Figure E-1 to E-4 below are connected by a series of lines forming a path from the top to the bottom, where the area subnetwork is found. The areas are all subnetworks that can be found by following upward paths emanating from the area subnetwork. The subnetworks with the fewest buses and generators are generally in the distribution system and the larger subnetworks include buses at progressively higher voltage rating levels.
4. It finds initiating subnetworks that are the smallest subnetworks in an area and are at the top of Figures E-1 to E-4. Exhaustion of reactive reserves cause voltage instability at an initiating subnetwork and pulls reactive power out of the larger subnetworks it is nested in. If reactive reserves are being progressively exhausted at some non-initiating subnetwork, the reactive reserves will be exhausted within all nested subnetworks that lie within it and reactive power is also pulled from the subnetwork it is nested in.
5. It establishes that voltage instability spreads as the number of subnetworks in the area exhaust their reactive reserves.
85 ”Increasing Electric Power Flow Capacity and Reducing the Frequency, Probability, and Scale of Brownouts and Blackouts”, Michigan Energy Efficiency Grant Report October 31,2003, Michigan Public Service Commission Case No U-13129

A Preliminary Analysis of the Economics of Using Distributed Energy as a Source of Reactive Power Supply 5/26/2006
62 Energetics Incorporated
Software Screen Snapshots Figure E-1 shows the base case system. Note that the reactive reserve levels are all at 100% of the base case reactive reserves based on the legend.
Figure E-2 shows the affect of a contingency that causes voltage instability in Area 1(the three left circles) by fully exhausting the reactive reserves of that set of three subnetworks, causing voltage instability and lack of a load flow solution. Note that there are subnetworks larger than the Area 1 subnetwork (bottom of the set of three fully exhausted subnetworks) that can experience voltage instability. This causes a lack of a load flow solution for more severe contingencies. Figure E-3 shows how distributed generation in the initiating subnetworks provides reactive reserves and stability in the initiating and area subnetworks. Figure E- 4 shows how distributed generation, with voltage controlled inverters in the initiating subnetworks, could greatly improve the voltage stability security by further increasing the reactive reserves on the subnetworks in Area 1.
Figure E-1. Reactive Reserves of Subnetworks in the Base Case
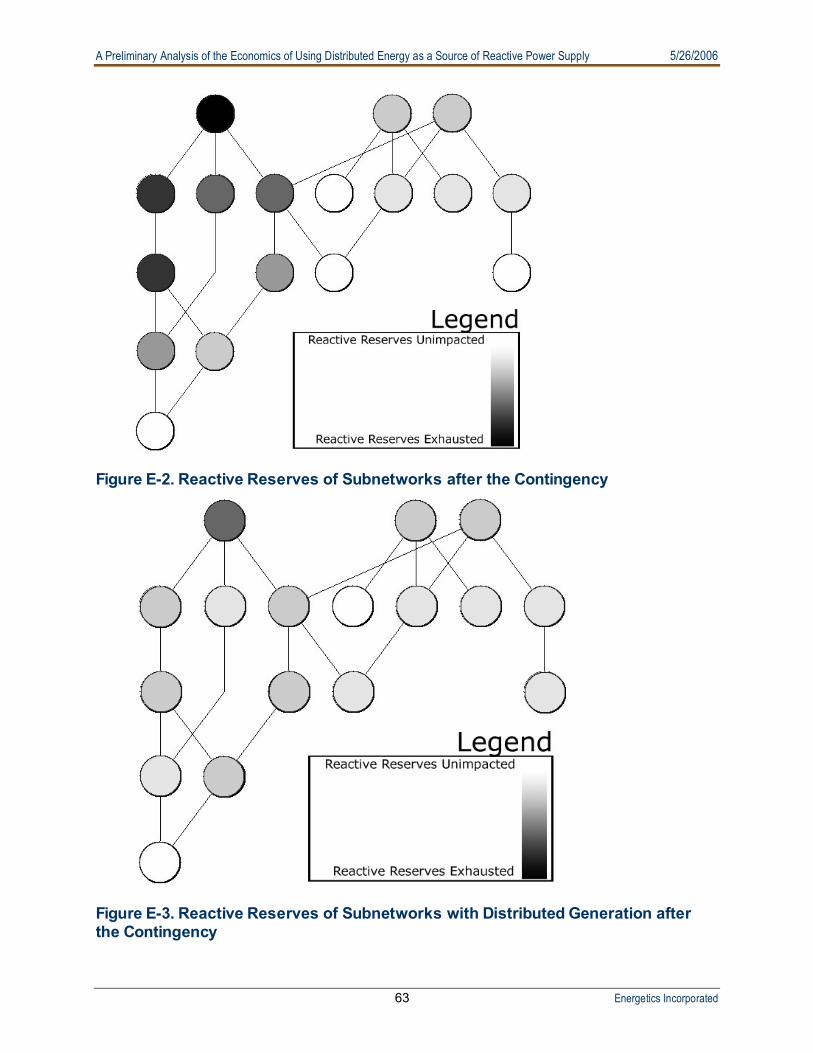
A Preliminary Analysis of the Economics of Using Distributed Energy as a Source of Reactive Power Supply 5/26/2006
63 Energetics Incorporated
Figure E-2. Reactive Reserves of Subnetworks after the Contingency
Figure E-3. Reactive Reserves of Subnetworks with Distributed Generation after the Contingency
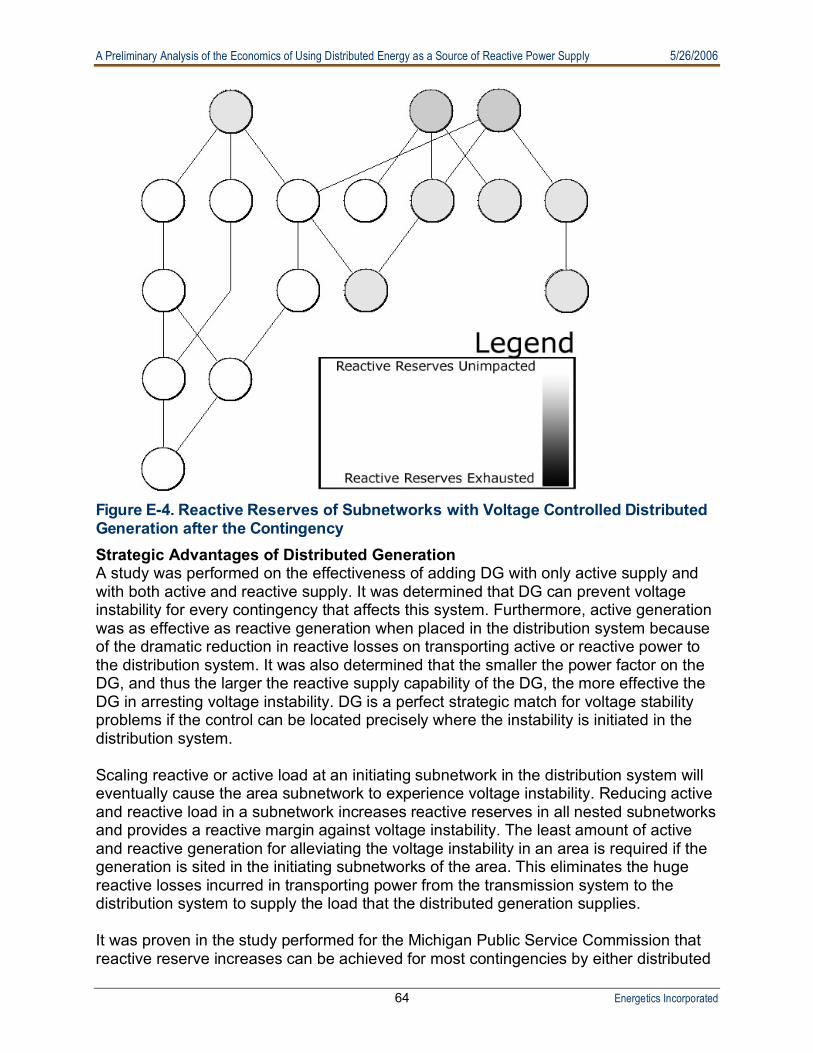
A Preliminary Analysis of the Economics of Using Distributed Energy as a Source of Reactive Power Supply 5/26/2006
64 Energetics Incorporated
Figure E-4. Reactive Reserves of Subnetworks with Voltage Controlled Distributed Generation after the Contingency Strategic Advantages of Distributed Generation A study was performed on the effectiveness of adding DG with only active supply and with both active and reactive supply. It was determined that DG can prevent voltage instability for every contingency that affects this system. Furthermore, active generation was as effective as reactive generation when placed in the distribution system because of the dramatic reduction in reactive losses on transporting active or reactive power to the distribution system. It was also determined that the smaller the power factor on the DG, and thus the larger the reactive supply capability of the DG, the more effective the DG in arresting voltage instability. DG is a perfect strategic match for voltage stability problems if the control can be located precisely where the instability is initiated in the distribution system. Scaling reactive or active load at an initiating subnetwork in the distribution system will eventually cause the area subnetwork to experience voltage instability. Reducing active and reactive load in a subnetwork increases reactive reserves in all nested subnetworks and provides a reactive margin against voltage instability. The least amount of active and reactive generation for alleviating the voltage instability in an area is required if the generation is sited in the initiating subnetworks of the area. This eliminates the huge reactive losses incurred in transporting power from the transmission system to the distribution system to supply the load that the distributed generation supplies. It was proven in the study performed for the Michigan Public Service Commission that reactive reserve increases can be achieved for most contingencies by either distributed

A Preliminary Analysis of the Economics of Using Distributed Energy as a Source of Reactive Power Supply 5/26/2006
65 Energetics Incorporated
generation alone or by the voltage controlled inverter alone. Distributed generation with voltage controlled inverters is far more effective. As Figure E-4 shows, reactive reserves of the area are increased using both active and reactive generation. Once the amount of active and reactive generation is found for each area, one can site and size the distributed generation within the area. This distributed generation control with voltage control can provide load flow solutions for all of the 324 contingencies on 87 initiating subnetworks found on this 15,000 bus model of Michigan. Intellicon has recently submitted proposals to perform planning and design studies based on the above methodology. Such a study provides the foundation for long term planning for states with a RPS.