a preliminary study on the bovine leather value …sds.ukzn.ac.za/files/rr_40.pdfinternational...
TRANSCRIPT

INTERNATIONAL COMPETITIVENESS AND VALUE CHAINS IN SELECTED
MANUFACTURING SECTORS STUDY
A Preliminary Study on the BovineLeather Value Chain in South Africa
Richard Ballard
CSDS Research Report No. 40
May 2001
Industrial Restructuring ProjectSchool of Development Studies
University of Natal, Durban

Acknowledgements
The European Union through its Department of Trade and Industry Policy Support Programmeprovided the principal funding for the writing of this research report. The financial support receivedfrom the European Union is sincerely appreciated and hereby acknowledged.
This report would not have been possible without the enthusiastic contributions of a number of firmsand industry role-players who willingly gave up their valuable time in order to supply data and ideasfor this report. In particular I would like to thank Der Anne Dods, Tony Mossop and Ralph Powellsfor their advice and support. Finally, thanks to my colleagues at the Industrial Restructuring Projectfor their invaluable input and assistance on this research.
ISBN NO: 1-86840-433-1
School of Development StudiesUniversity of NatalDurban, 4041Tel: (031) 260 1031Fax: (031) 260 2359Email: [email protected]: http://www.nu.ac.za/csds/
R. Ballard
Foreword
The Industrial Restructuring Project (IRP) was initiated at the beginning of 1996 as the KwaZulu-Natal Industrial Restructuring Project (KZN IRP). The project initially focused exclusively onKwaZulu-Natal, but is now aimed at supporting industrial policy in South Africa at the national,provincial and local levels. It is facilitated by international experts and is based at the School ofDevelopment Studies, University of Natal Durban. The project has two important features. Firstly, itfocuses on critical issues that are impacting on the competitiveness of manufacturing sectors that areunder threat from increased international competition and the liberalisation of the South African traderegime. Secondly, it is action-oriented in design. The findings that have been generated have, forexample, been presented to numerous industry stakeholders, including government, businessassociations and trade unions. The project consequently has the support of various regional andnational stakeholders.
This particular report/working paper has arisen out of both new research and the cumulativeknowledge that has been generated from previous studies. These cover a number of IRP reports,working papers, journal articles and conference papers. Some of the themes covered include SouthAfrica’s manufacturing competitiveness, the automotive industry, the clothing and textiles sectors,footwear, middle-management capacity, human resource development, institutional support forindustrial restructuring, and business services for manufacturing competitiveness. Enquiriesregarding IRP material should be addressed to: The Librarian, Centre for Social and DevelopmentStudies, University of Natal, Durban, 4041. Tel: 031 2601031; Fax: 031 2602359; email:[email protected]. This report can be downloaded for free at http://www.nu.ac.za/csds/ (click onpublications).
Prof. Mike MorrisHead: IRP
Contents
1 INTRODUCTION: OVERVIEW OF THE LEATHER INDUSTRY 31.1 ‘Globalisation’ and the new economic operating environment 51.2 Leather value chains in South Africa 71.3 Report Structure 9
2 SKINS, HIDES AND LEATHERS 112.1 Description of the value chain – stages 1-3 112.2 Profile of tanneries in South Africa 162.3 Imports 182.4 Exports 202.5 Summary of key issues 21
3 AUTOMOTIVE UPHOLSTERY 233.1 The Motor Industry Development Programme & automotive upholstery 233.2 Automotive seat manufacturers 243.3 Exports 263.4 Future of the sector 283.5 Summary of key issues 28
4 GENERAL LEATHER PRODUCTS 294.1 A sector under pressure 294.2 Descriptive profile of general goods manufacturers 334.3 Competition from imported finished goods 354.4 Raw material supply 374.5 Exports 384.6 Summary of key issues 40
5 FOOTWEAR 415.1 A sector under pressure 415.2 Exports 485.3 Summary of key issues 49
6 SUMMARY AND POLICY CONSIDERATIONS 506.1 Further research topics on the leather industry in SA 516.2 Policy options for consideration 52
7 REFERENCES & SOURCES 54
8 APPENDICES 558.1 Import/export breakdown for ch. 41 - skins, hides & leathers 558.2 Import/Export breakdown for ch. 42 – general leather goods 628.3 Import breakdown for ch 64 – footwear 668.4 Tariffs on imported hides, leather, leather goods and footwear 708.5 Methodology 748.6 Sample questionnaire for leather products manufacturers 778.7 Sample questionnaire for tanneries 79
R. Ballard
List of figures
Figure 1: Summary of number of employees registered with the National Bargaining Council 3Figure 2: Summary of exports from various parts of the leather industry 4Figure 3: The Bovine Leather Value Chain - 2000 8Figure 4: Regional change in employment in tanning 16Figure 5: Imports of items listed under Chapter 41: raw & semi-processed skins and hides and finished leather 19Figure 6: Exports of items listed under Chapter 41: raw & semi-processed skins and hides and finished leather 20Figure 7: Value of exports of Stitched Leather Automotive Components 26Figure 8: Unit price of exports of Stitched Leather Automotive Components 27Figure 9: Regional change in employment in general goods manufacture 30Figure 10: Imports of items listed under Chapter 42: general leather goods 35Figure 11: Exports of items listed under Chapter 42: general leather goods 38Figure 12: Formal employment in the footwear sector 1918-1999 (SAFLIA 1999) 42Figure 13: Pairs produced from 1918-1999 (SAFLIA 1999) 43Figure 14: Changing employment per region over time (SAFLIA 1999) 43Figure 15: Changing production per region over time (SAFLIA 1999) 44Figure 16: Imports of items listed under Chapter 64: footwear 45Figure 17: Top ten countries exporting shoes to South Africa (SAFLIA 1999) 45Figure 18: Exports of items listed under Chapter 64: footwear 48Figure 19: Dollar value of imports of un-tanned hides and skins 56Figure 20: Dollar value of imported tanned leather (including semi-processed) 56Figure 21: Quantity in kilograms of un-tanned hides and skins imported 57Figure 22: Quantity in kilograms of tanned hides and skins imported (including semi-processed) 57Figure 23: Dollar price per kilogram of imports of skins hides & leather 58Figure 24: Rand price per kilogram of imports of skins hides & leather 58Figure 25: Dollar value of exports of un-tanned hides and skins 59Figure 26: Dollar value of tanned leather (including semi-processed) 59Figure 27: Quantity in kilograms of un-tanned hides and skins exported 60Figure 28: Quantity in kilograms of tanned hides and skins exported (including semi-processed) 60Figure 29: Dollar price per kilogram of exports of untanned skins and hides 61Figure 30: Dollar price per kilogram of exports of tanned skins and hides (including semi-processed) 61Figure 31: Dollar value of imports of general goods 62Figure 32: Quantity per item of general goods imports 63Figure 33: Dollar price per item of general goods imports 63Figure 34: Dollar value of exports of general goods 64Figure 35: Quantity of items of general goods exports 64Figure 36: Dollar price per item of general goods exports 65Figure 37: Dollar value of imports of footwear 66Figure 38: Quantity in pairs of footwear imports 67Figure 39: Dollar price per pair of footwear imports 67Figure 40: Dollar value of exports of footwear 68Figure 41: Quantity in pairs of footwear exports 68Figure 42: Dollar price per pair of footwear exports 69
List of tables
Table 1: Employers and employees in tanning sector 16Table 2: Types of leather manufactured 17Table 3: Stage of processing at tannery 17Table 4: Types of products in which leather is ultimately used 18Table 5: Turnover category of tanneries surveyed for the year 2000 18Table 6: Ownership status of tanneries 18Table 7: Net exports of types of skins, hides and leathers (2000) 21Table 8: Comparison of prices of imported and exported skins hides and leather 21Table 9: Quantity of auto-upholstery exports 27Table 10: Employers and employees in the general leather goods sector 29Table 11: Has the number of people you employ increased or decreased since 1996? 30Table 12: Explanations for decreases in employment at general goods firms surveyed 31Table 13: Explanations for increases in employment at general goods firms surveyed 31Table 14: Major challenges identified by general goods manufacturers 31Table 15: New business strategies being deployed by general products manufacturers to overcome challenges 32Table 16: Location of general goods manufacturers 33Table 17: Types of products manufactured by companies surveyed 33Table 18: Types of leather used by general goods manufacturers surveyed 34Table 19: Turnover category of general goods manufacturers surveyed for the year 2000 34Table 20: Ownership status of general goods manufacturers 34Table 21: Has the proportion of imported raw material changed over the last five years? 37Table 22: Has the proportion of goods you manufacture with no leather content changed over the last 5 years? 38Table 23: Net exports of types of general leather goods (2000) 39Table 24: Has the proportion of exported raw material changed over the last five years? 39Table 25: Pairs of shoes produced in SA, imported and exported 41Table 26: Employers and employees in the footwear sector 42Table 27: Net exports of types of footwear (2000) 49Table 28: Import duties - Customs & Excise Chapter 41 - Raw hides and skins (excluding furskins) and leather 70Table 29: Import duties - Customs and Excise Chapter 42 - Articles of leather; saddlery and harness; travel goods,
handbags and similar containers; articles 71Table 30: Import duties - Customs & Excise Chapter 64 - Footwear, gaiters and the like; parts of such articles
(Revised 3 October 2000) 72Table 31: Interviews with stakeholders, industry representatives and analysts 74Table 32: Questionnaires sent and completed 75Table 33: Firm visits and interviews 76
Executive summaryPurpose and scopeThe purpose of this report is to provide a preliminary overview of the key trends, challenges andopportunities facing the leather industry of South Africa. It is a broad-brush overview of the industryintended to provoke discussion and provide some data for further policy making. By its very nature ithas many unanswered questions and omissions and does not claim to be in any way definitive.
MethodologyData was collected using four main techniques: First, a variety of stakeholders within the industrywere contacted and interviewed including employer associations, unions, the National BargainingCouncil of the Leather Industry and consultants. Second 39 firms responded to a short faxquestionnaire requesting data on products made, type of leather used, use of synthetics, number ofemployees, turnover, ownership, imports of raw materials, exports of finished goods, key challengesand strategies. The results of this survey are included throughout this report especially in the sectionon general leather goods (p. 29). Third, open-ended discussions were held with representatives of 12firms on the particular issues facing them at present. Finally, data was collected from a variety ofsecondary sources such as Customs and Excise, the National Bargaining Council for the LeatherIndustry and the South African Footwear and Leather Industry Association.
Change within the leather industryThe leather industry in South Africa has changed radically during the last decade. Whereas it washistorically orientated towards the manufacture of footwear and general leather goods, it is nowprimarily focused on the production of automotive upholstery. This report argues that the keydifference between growing parts of the leather industry and declining parts of the leather industry isthat of export and domestic market focus. Whereas the automotive upholstery sector exports almostall of the goods it produces, the footwear and general leather goods sectors have continued to rely onthe domestic market. The problem is that much of the domestic market has been lost to cheap importsfrom the Far East manufactured with poorly paid labour.
This change within the leather industry is explored in terms of the four mains sectors of the industry.The following summarise the key points identified by each section:
Section two: Summary of key issues in Skins hides and leather• Quality of hides: While hide quality is reasonable by world standards, certain changes could be
implemented by those who look after the animal during its life and those who prepare the hide inorder to improve quality.
• Availability of hides: There is a shortage both globally and domestically of hides. The demandfor hides by the automotive sector out-strips the number of cattle slaughtered locally.
• Price of hides: The price of hides is determined on the international hide market. The price ofhides on this market has increased over the last two years, reversing the trend of the previous fewyears. The advent of foot and mouth disease has also fuelled this increase. In South Africa, theseincreases are exaggerated with the depreciation of the Rand. Local buyers of hides including wetblue tanners and leather finishers have found it increasingly difficult to offer the same pricebuyers abroad are prepared to pay.
• Exports: The export of skins, hides and semi-processed leather generates substantial foreignearnings for South Africa. Yet, in the context of the previous point on hide prices, some sectionsof the tanning industry believe the export of hides should have some barriers in order to ensurethat raw materials are available for local downstream activities.
• Imports: The importation of raw hides takes place to make up the shortfall of locally availablehides. Most agree that this should be encouraged and facilitated. However, the importation of

2 Bovine Leather Value Chain in SA
CSDS Research Report no. 40
finished leather is more contentious. On one hand there is a residual footwear tanning industrywhich is attempting to compete with cheap dumped leather from abroad. On the other hand, thischeap leather is a raw input into the footwear and general goods sectors which are themselvesstruggling to be competitive against cheap imported finished goods.
• Tanning overcapacity: There is an over-capacity of wet blue and footwear finishing facilities inSouth Africa due, in part, to the shortage of raw material and the decline of some downstreamindustries.
Section three: Summary of key issues in automotive upholstery• Export focus: One of the key aspects of the automotive industry is its export focus. It is not
dependent in any way on the domestic end-consumer market.• Quality of raw materials: Raw materials are identified as the most frequent cause of quality
problems.• Cost of raw materials: The hide price is cited as one of the main restraints on the further growth
of the sector.• Future significance of MIDP: Although some seat manufacturers believe they are becoming
competitive in their own right, the MIDP incentive is likely to remain a key factor in futuredecisions by assemblers of whether to keep this business in South Africa.
• Dependence of tanneries: Should the automotive upholstery sector fail, it is likely to result inthe collapse of the tanning industry. South Africa would become like Australia which simplyexports raw hides without any value adding.
Section four: Summary of key issues in general leather goods• Domestic focus: Unlike the automotive industry, the general leather goods sector is dependent
almost exclusively on the domestic market.• Domestic market conquered by cheap imports: Cheap imports (legal, dumped and smuggled)
have penetrated the South African market for general leather goods thus displacing domesticmanufacturers.
• Declining employment: Due to the loss of business for firms, the number of firms andemployees has decreased.
• Raw material supply: The cost, quality and availability of leather inputs is a major inhibitor tothe competitiveness of general goods manufacturers. This has resulted in growing use ofimported leather and synthetic inputs.
Section five: Summary of key issues in footwear• Domestic focus: As with the general goods sector, the footwear manufacturing sector continues
to rely on the domestic market.• Loss of domestic market to imports: The domestic market is no longer the exclusive domain of
domestic manufacturers due to competition from cheap, dumped or smuggled imports.• Raw materials: Imported leather is increasingly being utilised in order to reduce the cost of
inputs. Due to the protected nature of the leather industries in source countries, this leather canbe imported at cheaper prices than it can be made in South Africa.
• Informalisation: In order to compete with manufacturers in the Far East, South Africanfootwear manufacturers have found various ways of operating outside of National Bargainingcouncil agreements, by outsourcing to unregistered firms or adopting a COFESA model.Consequently, this informal sector labour is paid less than formal sector labour.
1 Introduction: Overview of the Leather Industry
The landscape of the South African leather industry has been fundamentally changed over the lastdecade. During the early 1990s, the 12 or so bovine tanneries were primarily orientated towardsproviding raw material for the several hundred footwear manufacturers, and to a lesser extentmanufacturers of general goods and furniture, who made goods for the domestic market. Since thattime a number of crucial changes have impacted on the industry:
• Drought in the early 1990s.• The deregulation of the Meat Board.• The relaxation of import controls on leather and finished goods.• The new emphasis on exporting products ranging from raw hides right through to finished
goods, especially as a result of the governments Motor Industry Development Programme(MIDP).
• The depreciation of the Rand.• Hide price fluctuations due to external factors such as BSE and foot and mouth disease.• Institutional changes to employer and employee associations.1
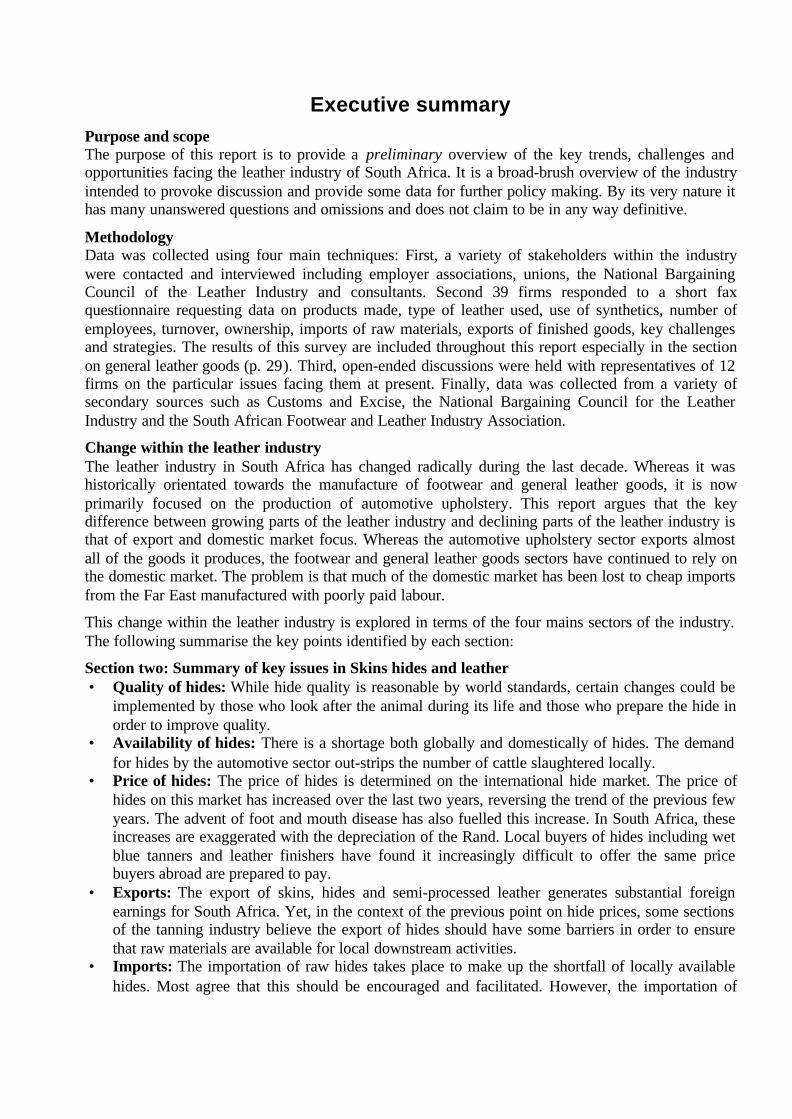
These pressures have resulted in variety of changes taking place including a radically differentemployment profile, as the following data shows:
Figure 1: Summary of number of employees registered with the National Bargaining Council
0
5000
10000
15000
20000
25000
30000
35000
40000
Nu
mb
er o
f E
mp
loye
es
Tanning 2481 2097 2412 2691 2713 4820 4344
General goods/handbags 3410 3183 3040 3167 2716 2458 2287
Footwear 28351 24878 22841 19990 17537 15742 11972
1995 1996 1997 1998 1999 2000 2001
1 The Skins, Hides and Leather Council (SHALC) – a longstanding body representing tanners and shippers in SouthAfrica – has been downscaled in the last few years, joining forces with the South African Tanners Association whichrepresents members to the government and the National Bargaining Council. The Footwear Manufacturers Federation ofSouth Africa (FMFSA) reformed as the South African Footwear and Leather Industries Assocation (SAFLIA) with theintention of opening itself to non-footwear manufacturers. The Leather Industry Research Institute based in Rhodesclosed in 1999 although training continues at the newly formed International School of Tanning Technologies and severalLIRI staff have continued to operate as consultants. Finally the National Bargaining Council of the Leather Industry ofSouth Africa has had its jurisdiction extended to the whole country as of February 2001.
4 Bovine Leather Value Chain in SA
CSDS Research Report no. 40
This graph does not represent all employment as it has two very important omissions. One is thegrowing informal footwear sector which, by definition, is not captured by the National BargainingCouncil but which, according to some estimates, may employ as many people as the formal sectordoes. The other omission is the sectors that are not registered with the National Bargaining Council,including those factories that sew automotive upholstery. This would add several thousandemployees to the total.
What the graph does show, however, is that the pressures created by these and other changes havecreated an entirely different leather industry. Now only one major tannery, along with several smallertanneries, produce leather for the footwear sector. The footwear and general leather goodsmanufacturing sectors have experienced factory closures and job losses. Yet despite the decline indemand for leather from footwear, the tanning sector in South Africa has been growing. This isbecause it has been able to supply a growing niche in the international automotive industry; namelythat of leather seats for luxury cars. Therefore the past dominance of the footwear industry has beeneclipsed by the arrival of the automotive upholstery sector.
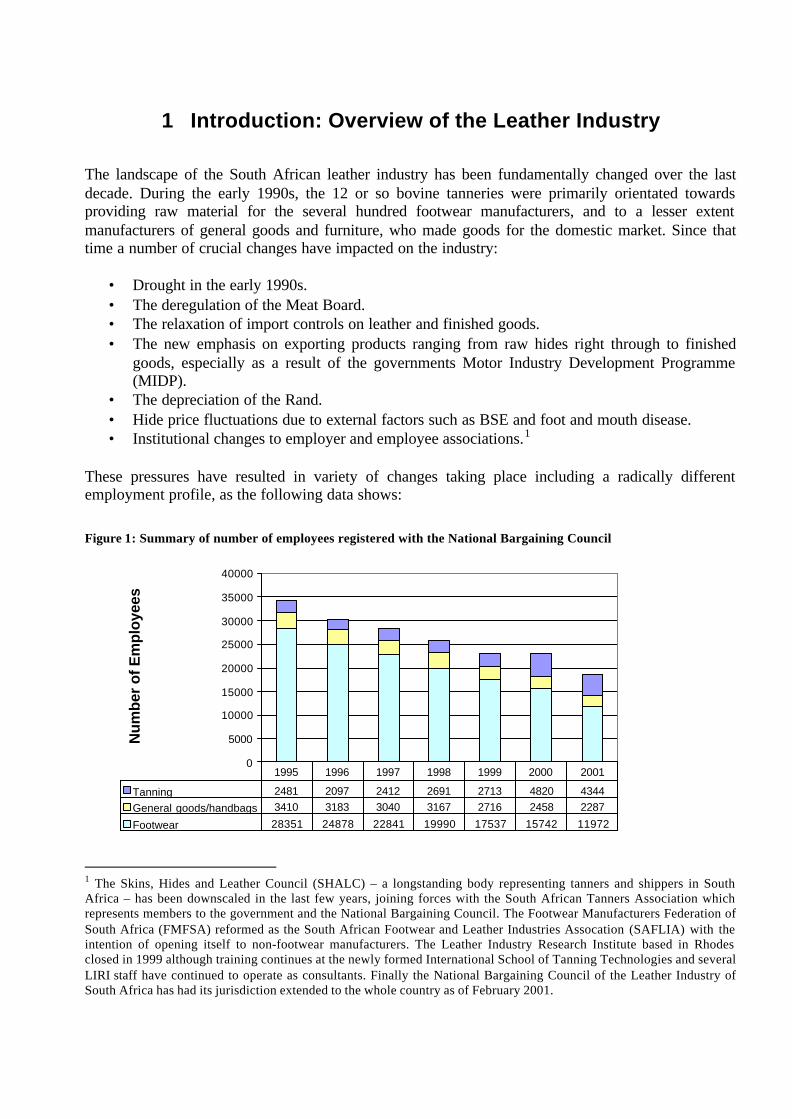
In general, export-orientated parts of the industry have thrived while domestically orientated partshave declined. Exporting sectors include not only automotive upholstery, but raw and semi-processedhides, and other types of leather such as ostrich and sheep. All together, the leather industry generatesin excess of half a billion US Dollars of foreign earnings for the South African economy.
Figure 2: Summary of exports from various parts of the leather industry
0.00
100.00
200.00
300.00
400.00
500.00
600.00
700.00
Ex
po
rts
in
Do
lla
rs (
Mil
lio
ns
)
Ch 64: Footwear 16.73 19.50 25.78 25.91 26.04 22.01 16.41 18.93 17.36
Ch 42: Leather goods 6.86 8.68 11.06 16.29 17.42 17.40 13.01 13.92 13.71
Auto upholstery 2.03 4.07 130.57 281.08 293.14 305.60 335.84 310.25 277.62
Ch 41: Hides & Leathers 139.14 158.24 198.85 232.36 250.05 244.13 192.77 176.85 223.24
1992 1993 1994 1995 1996 1997 1998 1999 2000
The domestically orientated sectors of the industry such as footwear and general leather goods havesuffered due to their dependence on the domestic market and the rapid penetration of cheap importedgoods into that market. These imported goods are able to undercut South African goods as they aremanufactured in parts of the world which have a variety of competitive advantages, such as protected
1. Introduction: Overview of the Leather Industry 5
R. Ballard
upstream tanning industries, subsidised manufacturing, very cheap labour and low standards ofenvironmental protection.
The purpose of this report is to identify some of the key challenges and opportunities facing varioussectors of the leather industry in South Africa. As this introduction has already made clear, theleather industry in South Africa is not a single homogenous industry but consists of a number ofsectors whose interests are not necessarily the same. In order to identify these various interests andexamine the relationships between them, this report makes use of a schematic value chain, which willbe outlined later in this introduction. Before this, however, it is useful to consider briefly the neweconomic landscape within which the leather industry now operates.
1.1 ‘Globalisation’ and the new economic operating environment
Globalisation can be defined as the process whereby distance is becoming less of a barrier to social,cultural, and economic interaction. Through technological advances within communications andtransport, interaction between far away places – whether physical (face to face meetings) or virtual(through communications technology such as email) – can now take place relatively inexpensivelyand easily. In economic terms, globalisation has had two different sets of impacts. Firstly, it has a setof impacts on production. Whereas in the past a whole product might have been made in one factory,it now may be made using components and stages of manufacture from all over the world. Secondly,globalisation impacts on consumption, and the way international trade is being encouraged andenabled. Under the watchful encouragement of multilateral organisations such as the World Bank,International Monetary Fund (IMF) and World Trade Organisation (WTO), protectionist tradebarriers are tumbling around the world. This process of ‘trade liberalisation’ is attempting to promoteinternational trade, as opposed to the inward focus that characterised most economies in the past.
The post-apartheid democratic government of South Africa has also adopted this route of ‘tradeliberalisation’ and the decade of the 1990s witnessed a fundamental economic shift from a closedeconomy protected through import substitution, to an open economy attempting to benefit fromgrowth through exports. However, international trade is rules-based (Hanival & Hirsch 1998: 4),which means that in order to gain access to foreign markets, the government had to undertake toallow foreign producers access to South African markets. This meant a reduction in the protectionfrom import tariffs. In 1996, the board embarked on a five year Tariff Rationalisation Process whichaimed to simplify and reduce one of the most complex protective structures in the world (Holden andCasale 2000: 4).
The implications of this process for previously protected businesses are that they are no longercompeting just with other domestic producers but rather are forced to compete with all producers inthe world. Previously safe in their monopoly of access to the domestic market, manufacturers nowhave to contend with a far larger set of competitors, and are being encouraged themselves to competefor offshore markets. In South Africa, some industries such as the automotive sector appear to beresponding well to this competitive challenge, while other industries including textiles, clothing andfootwear have found this considerably more difficult (Kaplinsky and Morris 1997, Harrison et al.1997). Unlike more capital intensive and high-tech industries such as the automotive industry, thebarriers to entry are lower in textiles, clothing, and footwear, where all one needs are a few sewingmachines to get going.
Although the forces of globalisation are essentially beyond the control of individual stakeholders in aparticular country, this need not necessarily mean that all have become victims of it. The challenge is
6 Bovine Leather Value Chain in SA
CSDS Research Report no. 40
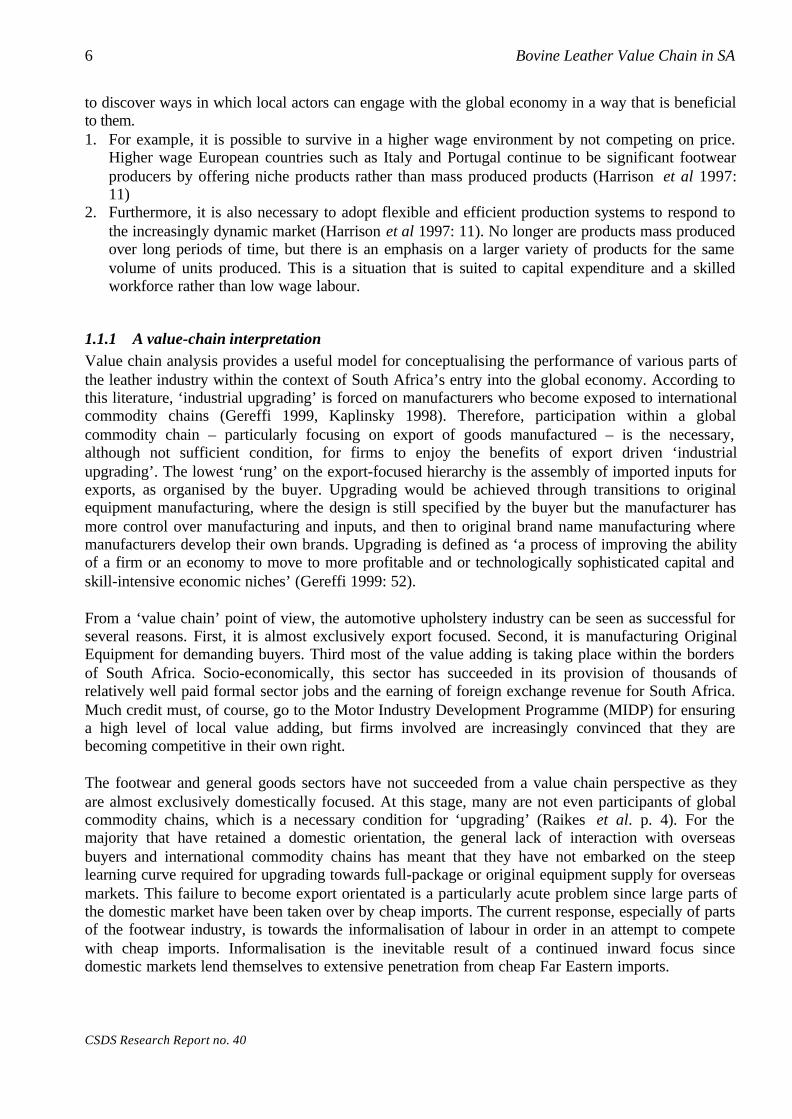
to discover ways in which local actors can engage with the global economy in a way that is beneficialto them.1. For example, it is possible to survive in a higher wage environment by not competing on price.
Higher wage European countries such as Italy and Portugal continue to be significant footwearproducers by offering niche products rather than mass produced products (Harrison et al 1997:11)
2. Furthermore, it is also necessary to adopt flexible and efficient production systems to respond tothe increasingly dynamic market (Harrison et al 1997: 11). No longer are products mass producedover long periods of time, but there is an emphasis on a larger variety of products for the samevolume of units produced. This is a situation that is suited to capital expenditure and a skilledworkforce rather than low wage labour.
1.1.1 A value-chain interpretationValue chain analysis provides a useful model for conceptualising the performance of various parts ofthe leather industry within the context of South Africa’s entry into the global economy. According tothis literature, ‘industrial upgrading’ is forced on manufacturers who become exposed to internationalcommodity chains (Gereffi 1999, Kaplinsky 1998). Therefore, participation within a globalcommodity chain – particularly focusing on export of goods manufactured – is the necessary,although not sufficient condition, for firms to enjoy the benefits of export driven ‘industrialupgrading’. The lowest ‘rung’ on the export-focused hierarchy is the assembly of imported inputs forexports, as organised by the buyer. Upgrading would be achieved through transitions to originalequipment manufacturing, where the design is still specified by the buyer but the manufacturer hasmore control over manufacturing and inputs, and then to original brand name manufacturing wheremanufacturers develop their own brands. Upgrading is defined as ‘a process of improving the abilityof a firm or an economy to move to more profitable and or technologically sophisticated capital andskill-intensive economic niches’ (Gereffi 1999: 52).
From a ‘value chain’ point of view, the automotive upholstery industry can be seen as successful forseveral reasons. First, it is almost exclusively export focused. Second, it is manufacturing OriginalEquipment for demanding buyers. Third most of the value adding is taking place within the bordersof South Africa. Socio-economically, this sector has succeeded in its provision of thousands ofrelatively well paid formal sector jobs and the earning of foreign exchange revenue for South Africa.Much credit must, of course, go to the Motor Industry Development Programme (MIDP) for ensuringa high level of local value adding, but firms involved are increasingly convinced that they arebecoming competitive in their own right.
The footwear and general goods sectors have not succeeded from a value chain perspective as theyare almost exclusively domestically focused. At this stage, many are not even participants of globalcommodity chains, which is a necessary condition for ‘upgrading’ (Raikes et al. p. 4). For themajority that have retained a domestic orientation, the general lack of interaction with overseasbuyers and international commodity chains has meant that they have not embarked on the steeplearning curve required for upgrading towards full-package or original equipment supply for overseasmarkets. This failure to become export orientated is a particularly acute problem since large parts ofthe domestic market have been taken over by cheap imports. The current response, especially of partsof the footwear industry, is towards the informalisation of labour in order in an attempt to competewith cheap imports. Informalisation is the inevitable result of a continued inward focus sincedomestic markets lend themselves to extensive penetration from cheap Far Eastern imports.
1. Introduction: Overview of the Leather Industry 7
R. Ballard
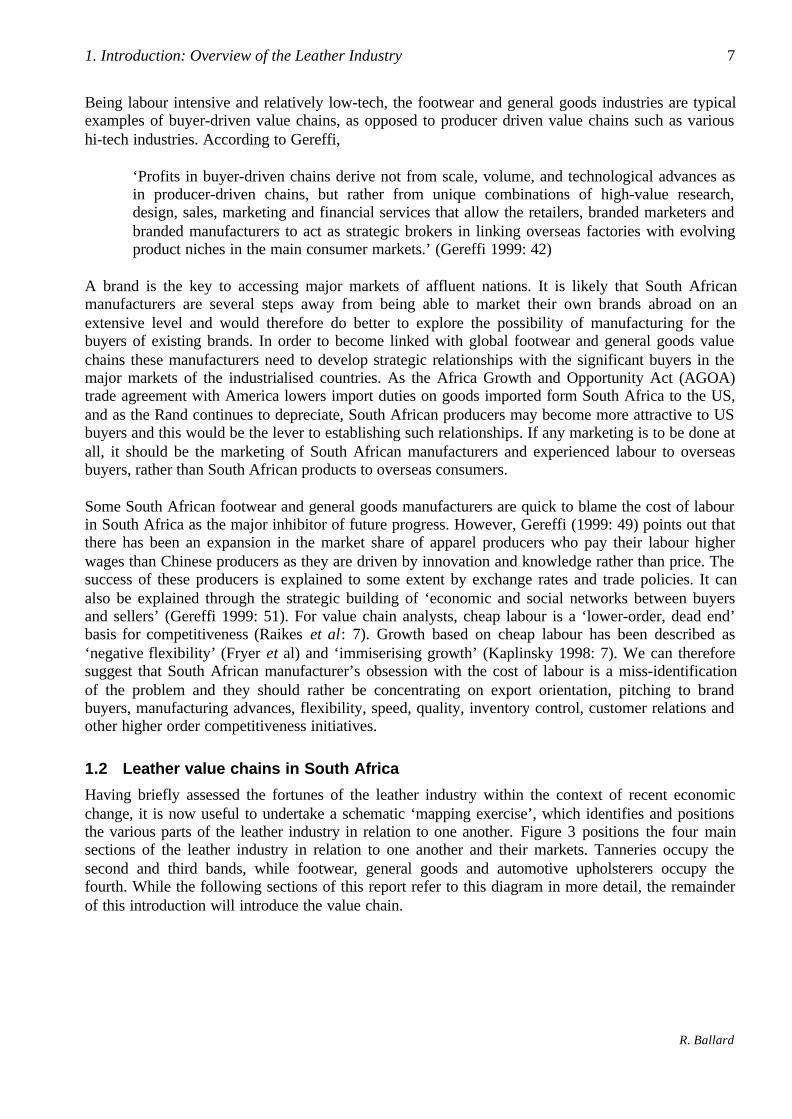
Being labour intensive and relatively low-tech, the footwear and general goods industries are typicalexamples of buyer-driven value chains, as opposed to producer driven value chains such as varioushi-tech industries. According to Gereffi,
‘Profits in buyer-driven chains derive not from scale, volume, and technological advances asin producer-driven chains, but rather from unique combinations of high-value research,design, sales, marketing and financial services that allow the retailers, branded marketers andbranded manufacturers to act as strategic brokers in linking overseas factories with evolvingproduct niches in the main consumer markets.’ (Gereffi 1999: 42)
A brand is the key to accessing major markets of affluent nations. It is likely that South Africanmanufacturers are several steps away from being able to market their own brands abroad on anextensive level and would therefore do better to explore the possibility of manufacturing for thebuyers of existing brands. In order to become linked with global footwear and general goods valuechains these manufacturers need to develop strategic relationships with the significant buyers in themajor markets of the industrialised countries. As the Africa Growth and Opportunity Act (AGOA)trade agreement with America lowers import duties on goods imported form South Africa to the US,and as the Rand continues to depreciate, South African producers may become more attractive to USbuyers and this would be the lever to establishing such relationships. If any marketing is to be done atall, it should be the marketing of South African manufacturers and experienced labour to overseasbuyers, rather than South African products to overseas consumers.
Some South African footwear and general goods manufacturers are quick to blame the cost of labourin South Africa as the major inhibitor of future progress. However, Gereffi (1999: 49) points out thatthere has been an expansion in the market share of apparel producers who pay their labour higherwages than Chinese producers as they are driven by innovation and knowledge rather than price. Thesuccess of these producers is explained to some extent by exchange rates and trade policies. It canalso be explained through the strategic building of ‘economic and social networks between buyersand sellers’ (Gereffi 1999: 51). For value chain analysts, cheap labour is a ‘lower-order, dead end’basis for competitiveness (Raikes et al: 7). Growth based on cheap labour has been described as‘negative flexibility’ (Fryer et al) and ‘immiserising growth’ (Kaplinsky 1998: 7). We can thereforesuggest that South African manufacturer’s obsession with the cost of labour is a miss-identificationof the problem and they should rather be concentrating on export orientation, pitching to brandbuyers, manufacturing advances, flexibility, speed, quality, inventory control, customer relations andother higher order competitiveness initiatives.
1.2 Leather value chains in South Africa
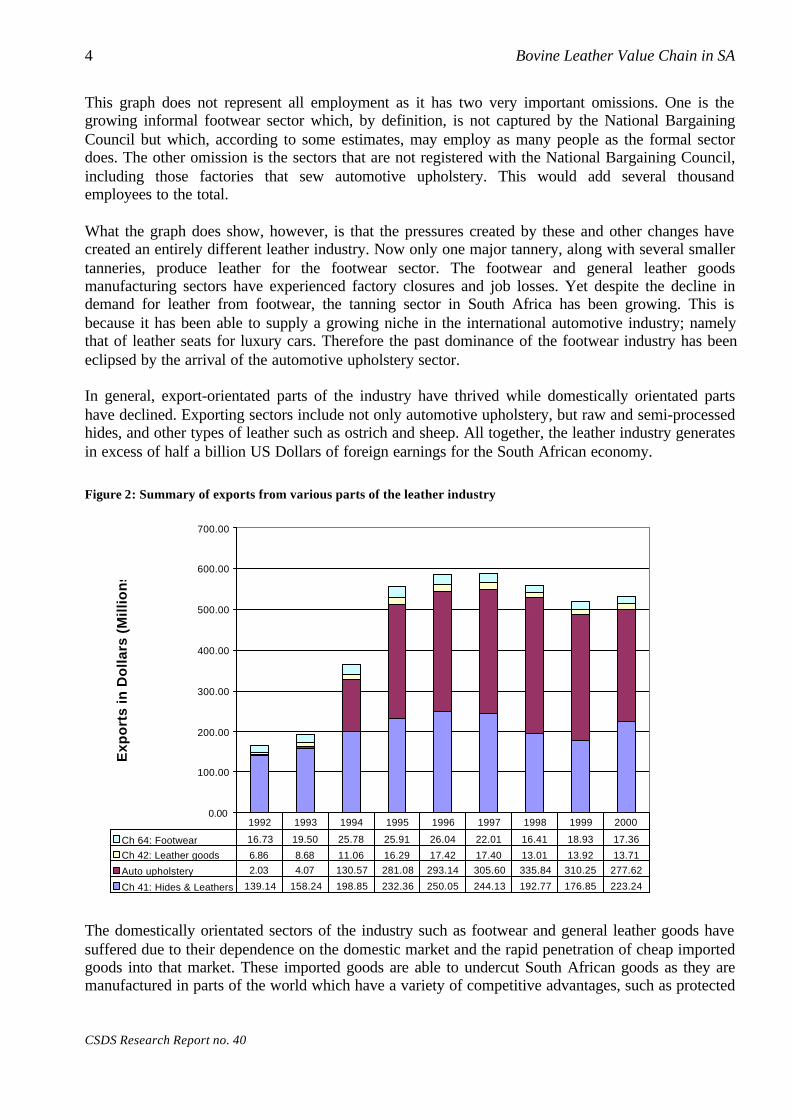
Having briefly assessed the fortunes of the leather industry within the context of recent economicchange, it is now useful to undertake a schematic ‘mapping exercise’, which identifies and positionsthe various parts of the leather industry in relation to one another. Figure 3 positions the four mainsections of the leather industry in relation to one another and their markets. Tanneries occupy thesecond and third bands, while footwear, general goods and automotive upholsterers occupy thefourth. While the following sections of this report refer to this diagram in more detail, the remainderof this introduction will introduce the value chain.

8 Bovine Leather Value Chain in SA
CSDS Research Report no. 40
Figure 3: The Bovine Leather Value Chain - 2000
Farmers, feedlots & abattoirs
Wet blues
AutomotiveLeather
Footwear& general goods
leather
Footwear & general goods Manufacturers
Minor exports
Small domestic Market
Domestic footwear & general goods
market
5. M
arke
t4
. Fin
ish
ed
pro
du
ct3
. Fin
ish
ed
lea
the
r2
. Se
mi
pro
ce
ssed
1. H
ide
su
pp
ly
Far-East imports
Leather imports(Esp. India)
Wet blue importsImport sh
ortfall
+-
1.5
mil
m2
+- 9
mil
m2
+- 2 mil m 2
Hide imports+-10% exported, especially low grade hand flayed & dry
+- 25% of original hide stockexported as wet blues
2.2 mil hides p.a. (Unofficially)
Splits to domestic footwear Splits exported
Exports to car assemblers,esp. In Germany
Cut & stitchAuto upholstery
(Arrows: blue = exports, red = imports, green = value chain within SA)

1. Introduction: Overview of the Leather Industry 9
R. Ballard
The value chain depicted in Figure 3 is divided into five stages: hide supply, semi-processed leather,finished leather, finished products, and the market. The various operations are linked by a series ofarrows showing imports (red), exports (blue) and transfers down the value chain within South Africa(green). Arrows have different thickness in order to schematically portray the relative volumes ofoutputs and inputs into the various parts of the value chain.
One of the main features of the diagram is two streams within the value chain: one leading toautomotive upholstery and the other leading to footwear and general goods. Although the latter areentirely separate sectors, their fate over the last decade has been somewhat similar and they havebeen subjected to many of the same pressures. They have therefore been combined for the purposesof this exercise.
In order to show exactly where these two streams separate, it is necessary to separate the tanningprocess into two distinct stages. The first stage of tanning takes raw hides and tans them into semi-processed leather (Arrows B & C). The second stage takes semi-processed hides and re-tans theminto finished leather ready for use by a variety of manufacturers (Arrows E & F). The type of finishedleather used in automotive upholstery is very different from the type of leather used in footwear andgeneral goods. It is therefore common to find a separation of the tanning process between differenttypes of tanneries, between those producing only wet blues, those producing for footwear, and thoseproducing for automotive use.
The orientation of bovine finishing tanneries has altered dramatically over the last decade (stage 3).Whereas in the past they were producing leather for footwear, general goods and furnituremanufacturers, most are now producing leather for the automotive upholstery manufacturers (ArrowK). There is now only one major and several small footwear leather producers left in the country. Thereason for this is that the footwear manufacture section itself has shrunk due to cheap imports (ArrowR) and the remaining footwear manufacturers are turning to imported leather for their inputs (ArrowO).
The South African tanning industry has a complex relationship with local downstream manufacturers.While they do indeed provide the inputs for these industries (arrows N and K), especially theautomotive upholstery industry, downstream manufacturers such as footwear are also increasinglysourcing leather from abroad (Arrow O). Furthermore, the products of South African tanneries(leather, semi-processed hides and even raw hides with no value adding) are exported as productsthemselves and do not go to downstream value adding activities (Arrows A, D and I).
1.3 Report Structure
1.3.1 ScopeThis report takes a broad-brush approach in its attempts to identify the major trends, challenges andopportunities that currently face the industry. It does this by providing both original data from asurvey conducted and relevant secondary data. Particular emphasis is placed on employment levels,import penetration of finished goods, export of finished goods, raw material supply, andinformalisation within some sectors.
10 Bovine Leather Value Chain in SA
CSDS Research Report no. 40
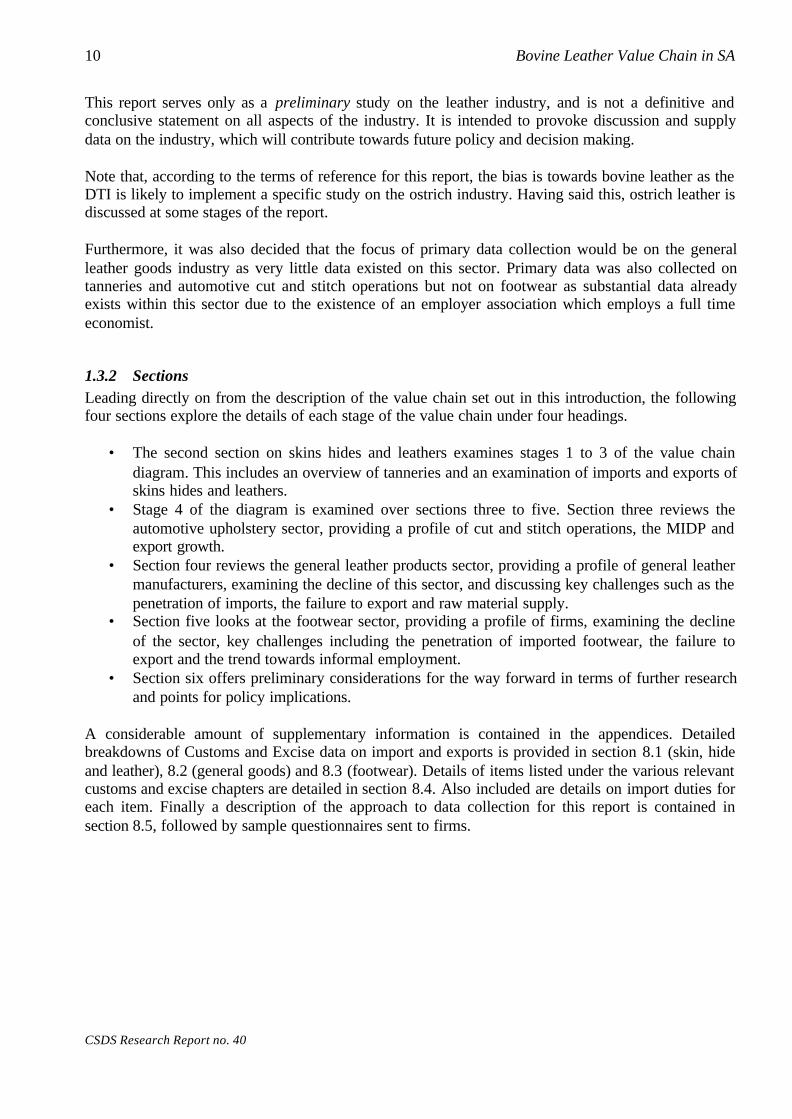
This report serves only as a preliminary study on the leather industry, and is not a definitive andconclusive statement on all aspects of the industry. It is intended to provoke discussion and supplydata on the industry, which will contribute towards future policy and decision making.
Note that, according to the terms of reference for this report, the bias is towards bovine leather as theDTI is likely to implement a specific study on the ostrich industry. Having said this, ostrich leather isdiscussed at some stages of the report.
Furthermore, it was also decided that the focus of primary data collection would be on the generalleather goods industry as very little data existed on this sector. Primary data was also collected ontanneries and automotive cut and stitch operations but not on footwear as substantial data alreadyexists within this sector due to the existence of an employer association which employs a full timeeconomist.
1.3.2 SectionsLeading directly on from the description of the value chain set out in this introduction, the followingfour sections explore the details of each stage of the value chain under four headings.
• The second section on skins hides and leathers examines stages 1 to 3 of the value chaindiagram. This includes an overview of tanneries and an examination of imports and exports ofskins hides and leathers.
• Stage 4 of the diagram is examined over sections three to five. Section three reviews theautomotive upholstery sector, providing a profile of cut and stitch operations, the MIDP andexport growth.
• Section four reviews the general leather products sector, providing a profile of general leathermanufacturers, examining the decline of this sector, and discussing key challenges such as thepenetration of imports, the failure to export and raw material supply.
• Section five looks at the footwear sector, providing a profile of firms, examining the declineof the sector, key challenges including the penetration of imported footwear, the failure toexport and the trend towards informal employment.
• Section six offers preliminary considerations for the way forward in terms of further researchand points for policy implications.
A considerable amount of supplementary information is contained in the appendices. Detailedbreakdowns of Customs and Excise data on import and exports is provided in section 8.1 (skin, hideand leather), 8.2 (general goods) and 8.3 (footwear). Details of items listed under the various relevantcustoms and excise chapters are detailed in section 8.4. Also included are details on import duties foreach item. Finally a description of the approach to data collection for this report is contained insection 8.5, followed by sample questionnaires sent to firms.

2 Skins, Hides and Leathers
This section deals with tanneries, which fit into stages 2 and 3 of the ‘value chain’ presented inFigure 3, namely the manufacture of semi-processed leather and finished leather. Tanning has been agrowth sector in South Africa despite the demise of its traditional downstream customers of footwearand general goods manufacturers. This is due to the recent arrival of the automotive upholsterysector, around which at least 70% of bovine tanning activity now revolves. As well as automotiveupholstery, an important new trend that will be highlighted in this section is the export of hides atvarious stages of the tanning processes.
2.1 Description of the value chain – stages 1-3
2.1.1 Stage 1: Hide SupplyStage 1 in this diagram is the hide supply. Official statistics state that there are around 1.8 millionslaughters of cattle a year, however this number only captures the slaughtering that take place informal abattoirs. If the supply of hides from rural areas is included, the hide supply could be above 2million, with estimates ranging as high as 2.5 million.
The bulk of the hides that are produced in South Africa go onto the next stage of processing (ArrowB on Figure 3). However, around 10 to 15% do get exported (Arrow A). These tend to be hand-flayeddry salted and sun dried hides produced in rural areas outside of official abattoirs. Exporters arguethat the reason they should be exported is that they are low grade hides and South African tannerieshave little use for them. However, there have been complaints in recent years that good qualityfeedlot hides are being exported rather than channelled into domestic processing for the automotiveindustry (SHALC nd).
Hide price: Since hides are a global commodity, the price of hides is determined on the worldmarket for hides. In other words, farmers and abattoirs are not in control of the price of their product.At present, there is a general shortage of hides due to the stagnant or even decreasing number ofanimals slaughtered domestically and in many parts of the world. BSE and Foot and Mouth diseasehave contributed to this shortage. It is uncertain whether Foot and Mouth is causing an actualshortage or whether shortages are coming from ‘panic buying’ by hide merchants and tanneries inanticipation of shortages, or even to deliberately force up prices.
Although hide prices are meant to be universal, arguments have been made that the MIDP hasinflated the price of hides (SHALC nd). This occurs because the MIDP provides an incentive forusing local raw materials and suppliers of hides are therefore likely to exploit this increased value oftheir product.
Quality: Hides produced in South Africa are of varying quality. While not as good as hides producedin places like Germany, where animals sleep in barns because of the weather, South African hides areon a par with hides produced in places such as Brazil, Argentina and Queensland, Australia.

12 Bovine Leather Value Chain in SA
CSDS Research Report no. 40
Positive aspects of the quality of South African hides:• Some hides produced in South Africa come from feedlots where the animals spend their last
few months relatively safe from damaging thorn trees and ticks and giving previouslyacquired wounds a chance to heal.
• South African tanners comment that, in comparison to some countries, South African animalsare slaughtered and flayed well in formal abattoirs, in a way that provides a good shape andmaximises yield.
• The splits from South African hides have a tight fibre structure, which makes them strongerand ideal for conversion into certain types of leather, such as suede.
• The types of cattle farmed in South Africa are the non-hump types of cattle, unlike manyother parts of the world where humped species such as Brahman are more dominant. Non-hump cattle are more suitable for use in the automotive upholstery as the hump produces anawkward shape and it is difficult to generate the large panels necessary for automotiveindustry.
Negative aspects of the quality of South African hides• South African hides do get damaged by the ‘African bush’ (acacia trees, barbed wire and
ticks) during the life of the animal. Many animals do not go to feedlots, which means thatthey may be slaughtered with unhealed wounds on their hides. Due to the shortage of hides,these non-feedlot hides often command the same price as feedlot hides. Tick bites are, ofcourse, preventable with regular dipping.
• The Department of Agriculture encourages branding of animals in order to control stock theft.Each time an animal is branded, it can waste as much as a square foot of the hide. It is alsobranded on the rump, which is the best part of the leather. The Skins, Hides and LeatherCouncil has approached the Department of Agriculture in order to find a way of avoiding thiswastage.
• The South African meat industry tends to slaughter cattle at a younger age than some parts ofthe world, which means there is about 1m 2 less leather than would be produced, for example,from South American cattle.
• Since the end of the Meat Board and the deregulation of the industry, standards of hidepreparation at abattoirs have, in some cases, deteriorated.
There have been attempts to reward better prepared hides in the past, but these have failed as the highquality supplier tries to buy in hides from other producers and pass them off as their own. Also,problems arise if the word spreads that there are different prices being paid for hides as all suppliersdemand the highest available price.
2.1.2 Stage 2: Semi-processed hidesStage 2 is the production of semi-processed hides. As well as using South African hides at this stage(Arrow B), tanneries also import some hides (Arrow C). At wet blue tanneries, hides undergo the firststage of tanning, which effectively preserves the hide as a semi-processed leather. As its namesuggests, it is wet and a pale blue colour, which comes from the chromium salt used to tan the hide.
During discussions with tanners, concerns were raised that there was an over-capacity of wet bluetanning in South Africa. One estimated that although only around 2.2 million hides are produced inSouth Africa, there is a capacity to process 3.8 million hides a year at wet blue facilities.
2. Skins, Hides and Leathers 13
R. Ballard
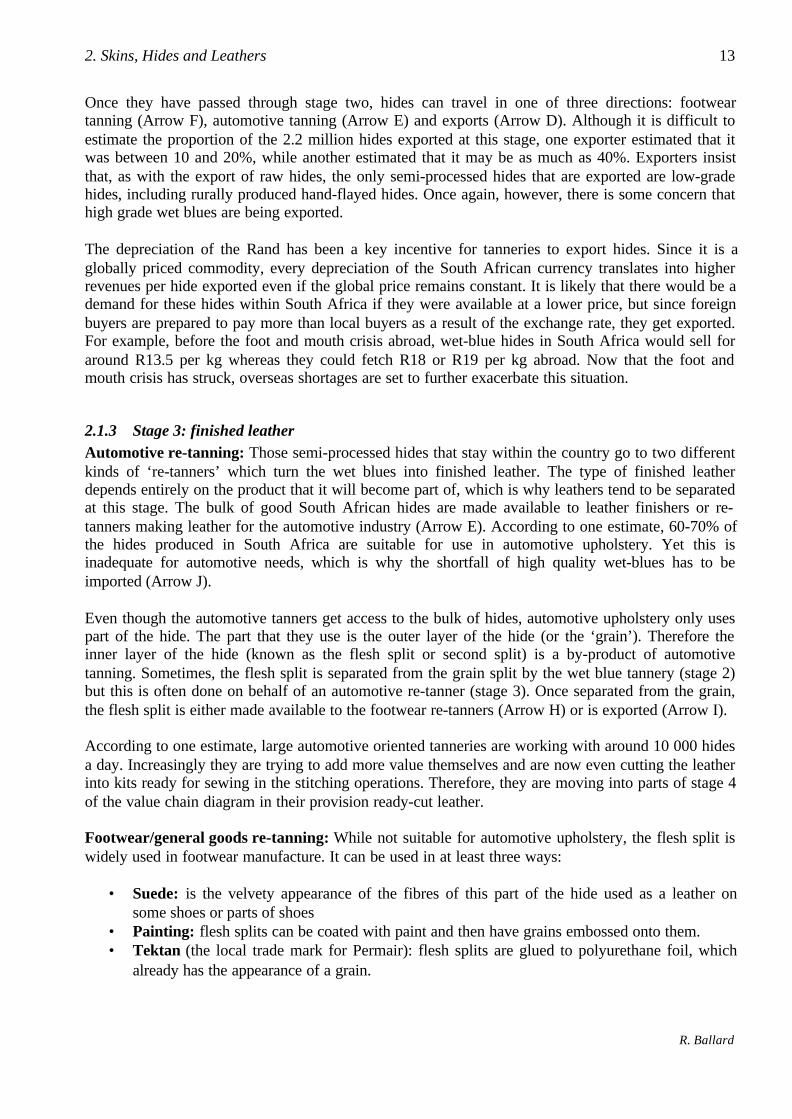
Once they have passed through stage two, hides can travel in one of three directions: footweartanning (Arrow F), automotive tanning (Arrow E) and exports (Arrow D). Although it is difficult toestimate the proportion of the 2.2 million hides exported at this stage, one exporter estimated that itwas between 10 and 20%, while another estimated that it may be as much as 40%. Exporters insistthat, as with the export of raw hides, the only semi-processed hides that are exported are low-gradehides, including rurally produced hand-flayed hides. Once again, however, there is some concern thathigh grade wet blues are being exported.
The depreciation of the Rand has been a key incentive for tanneries to export hides. Since it is aglobally priced commodity, every depreciation of the South African currency translates into higherrevenues per hide exported even if the global price remains constant. It is likely that there would be ademand for these hides within South Africa if they were available at a lower price, but since foreignbuyers are prepared to pay more than local buyers as a result of the exchange rate, they get exported.For example, before the foot and mouth crisis abroad, wet-blue hides in South Africa would sell foraround R13.5 per kg whereas they could fetch R18 or R19 per kg abroad. Now that the foot andmouth crisis has struck, overseas shortages are set to further exacerbate this situation.
2.1.3 Stage 3: finished leatherAutomotive re-tanning: Those semi-processed hides that stay within the country go to two differentkinds of ‘re-tanners’ which turn the wet blues into finished leather. The type of finished leatherdepends entirely on the product that it will become part of, which is why leathers tend to be separatedat this stage. The bulk of good South African hides are made available to leather finishers or re-tanners making leather for the automotive industry (Arrow E). According to one estimate, 60-70% ofthe hides produced in South Africa are suitable for use in automotive upholstery. Yet this isinadequate for automotive needs, which is why the shortfall of high quality wet-blues has to beimported (Arrow J).
Even though the automotive tanners get access to the bulk of hides, automotive upholstery only usespart of the hide. The part that they use is the outer layer of the hide (or the ‘grain’). Therefore theinner layer of the hide (known as the flesh split or second split) is a by-product of automotivetanning. Sometimes, the flesh split is separated from the grain split by the wet blue tannery (stage 2)but this is often done on behalf of an automotive re-tanner (stage 3). Once separated from the grain,the flesh split is either made available to the footwear re-tanners (Arrow H) or is exported (Arrow I).
According to one estimate, large automotive oriented tanneries are working with around 10 000 hidesa day. Increasingly they are trying to add more value themselves and are now even cutting the leatherinto kits ready for sewing in the stitching operations. Therefore, they are moving into parts of stage 4of the value chain diagram in their provision ready-cut leather.
Footwear/general goods re-tanning: While not suitable for automotive upholstery, the flesh split iswidely used in footwear manufacture. It can be used in at least three ways:
• Suede: is the velvety appearance of the fibres of this part of the hide used as a leather onsome shoes or parts of shoes
• Painting: flesh splits can be coated with paint and then have grains embossed onto them.• Tektan (the local trade mark for Permair): flesh splits are glued to polyurethane foil, which
already has the appearance of a grain.
14 Bovine Leather Value Chain in SA
CSDS Research Report no. 40
Many of the flesh splits produced from the automotive industry have been made available to theSouth African footwear tanneries (Arrow H). However, increasing volumes of flesh splits from theautomotive industry are now also being exported to places such as the Republic of China where thereis a huge demand since this region does not have a significant domestic supply of hides (Arrow I).This is a trend that concerned smaller footwear tanners as their raw material is becoming increasinglyscarce.
Early in the 1990s there were around 11 or 12 footwear tanneries. At present there is only one largetannery and several small tanneries, with most of the others having switched to automotive tanning.There are two reasons for the decline in footwear leather finishing. The first is the decline in thefootwear sector itself (see Section 5, below). The second is that the remaining footwearmanufacturers have largely switched to using imported leather for the manufacture of shoes (ArrowO). The penetration of imported leather has taken place purely on the basis of price. Due to variousgovernment policies, countries such as India, Pakistan, Brazil and Argentina are able to produce verycheap leather – a deliberate attempt to promote downstream industries within those countries throughthe availability of cheap leather. For example, India – which has the largest cattle population in theworld – banned the exports of raw hides and wet blues until the year 2000. Only the export offinished leather was permitted. This suppressed the price of their leather and it is therefore verycheap. In 2001, under pressure from the WTO, the ban on the export of wet blues has been lifted, buta 60% export duty has been placed on wet blues thereby replacing the ‘ban’ with an equallyprohibitive measure. The ban on the export of raw hides remains in place.
As a consequence of the protection placed by many countries, South African re-tanners find it verydifficult to import wet blues for re-tanning here. The price of these wet blues is several times moreexpensive than the locally available wet blues due, in part, to the export duties imposed by theexporting countries.
The result of the relatively high cost of local footwear leather is that South African footwearmanufacturers are now by-passing local footwear tanneries in favor of cheaper imported leather.According to one estimate, footwear manufacturers want to pay around $1.20 to $1.50 per squarefoot for their leather inputs. They are able to buy at this price from India as India protects their rawmaterial. They are not willing to pay the $1.80 to $2, which is the cost local footwear tanneries areable to achieve.
Several tanners also stressed that not all of the benefits of cheap imported leather go tofootwear/general goods manufacturers. Very often the importers mark up the cheap imported leatherto just below the local price and keep the difference themselves. This particularly affects SMMEswho are forced to rely on importers.
Hides make up the main part of the cost of producing leather. One footwear finishing tannery saidthat hides made up around two thirds of its costs. Therefore it believes that the reason why it is notable to compete is due to the fact that it does not have access to cheap hides in the way that tanneriesin places like India do. Tanneries specifically requested that the DTI urgently implement anti-dumping procedures against unfairly priced imported leather.
An issue also related to hide price is the fact that automotive upholstery producers receive benefitsfrom exporting their seat covers and are therefore effectively able to pay more for their hides. Thefootwear re-tanners receive no such benefits and hides are therefore more expensive for them. One

2. Skins, Hides and Leathers 15
R. Ballard
footwear tannery reported that it was now importing about two thirds of its wet blues from placessuch as Australia, Brazil, Zambia, Venezuela, and even Thailand (via Italy) (Arrow G). However, itwould prefer to use domestic hides as they would not have to plan so far in advance and they wouldhave more consistent quality.
2.1.4 Other types of leatherVegetable tanning: Vegetable tanning is an alternative way of preserving hide. Instead of usingchrome, tannins from sources such as wattle trees are used to preserve the leather. The equivalent of‘wet blue’ in this process is a ‘wet white’. This leather is preferred by some craft manufacturers suchas gun holster makers as it is more mouldable than chrome tanned leather which has a tendency toreturn to its original shape. It is also a fashionable leather in some markets as it is seen as a moreenvironmentally friendly and natural way to produce leather.
Until recently, there was a large vegetable tanner in Pietermaritzburg employing around 100 people.However, this tannery closed at the start of 2001 citing, amongst other reasons, cheap imports of thesame product and the scarcity of good quality hides due to the automotive upholstery sector. Theclosure of this tannery has left many downstream manufactures of goods without access to rawmaterials. One business owner in particular stated that his firm was in crisis mode and may well closetheir business due to a lack of raw materials. Help may come from a newer tannery inPietermaritzburg, which is doing vegetable tanning at a smaller scale.
Ostrich leather: Unlike bovine hide, ostrich skin is not a by-product of the meat industry but ratherthe ostrich meat is a by-product of the skin. At present the farmer gets around R1300 for a skinwhereas s/he gets R500 for the meat. Once processed, a fully tanned first grade skin is worth $20 persquare foot (about R2600 for a skin), whereas a low-grade tanned skin will still sell for R1500.Despite this apparently high price one ostrich leather tanner stated that it was a buyer’s market andthat there was not a shortage of skins.
Although the majority of skins do come from South Africa there are also many that come fromelsewhere such as Australia, Sweden, Belguim, Spain, Portugal, Scotland and Switzerland. The skinis brought to South Africa for finishing as this expertise is not necessarily available in the countrieswhere the skins come from. Alarmingly, however, this ability is currently being transferred by SouthAfrican ostrich tanners who are training Koreas on the art of tanning ostrich leather.
Much of the finished ostrich leather produced in South Africa is exported to countries such asMexico, Japan, Korea, Hong Kong rather than utilised locally by down stream manufacturers. It isused to make clothing, bags, shoes, etc.
Concerns were raised that there was an over-capacity in the ostrich leather tanning sector and thatnew tanneries were being established without a secure source of skins.
Sheepskin: Very few finished sheepskin products are produced in South Africa, other than a fewoperations making sheepskin slippers, chamois leather and industrial gloves. The overwhelmingmajority of sheepskin is exported.
Pig skin: Unlike places like China, South Africa does not have a significant supply of pigskin as thistends to be part of the sale of meat and is therefore not a by-product of the meat industry.

16 Bovine Leather Value Chain in SA
CSDS Research Report no. 40
2.2 Profile of tanneries in South Africa
While the above provides a general overview of trends, challenges and opportunities within thetanning sector, the remainder of this section will offer some numerical detail to flesh out andconcretise some of these general statements.
At present there are 20 firms registered with the National Bargaining Council employing 4344people. This represents a substantial growth since the mid 1990s in the number of tanneries and theaverage number of people each employs.
Table 1: Employers and employees in tanning sector
1995 1996 1997 1998 1999 2000 2001 % change 95-01Employers 14 13 15 17 17 22 20 30.0 %Employees 2481 2097 2412 2691 2713 4820 4344 42.9 %Ave. frm size 177.2 161.3 160.8 158.3 159.6 219.1 217.2 18.4 %(Source: National Bargaining Council of the Leather Industry of South Africa)
While the Eastern and Western Cape have shown declines in the number of employees in this sectorsince 1998, KwaZulu-Natal and in particular Gauteng/the Northern province have increased. Thelatter is now dominant in terms of the number of people employed in the sector.
Figure 4: Regional change in employment in tanning
0
500
1000
1500
2000
2500
3000
Em
plo
ye
es
Gauteng 514 570 694 749 1004 2713 2721
Western Cape 828 772 874 920 627 613 504
KZN 361 75 85 102 171 474 576
Eastern Cape 778 680 759 920 911 1020 543
1995 1996 1997 1998 1999 2000 2001
Eight tanneries responded to a questionnaire sent out for the purposes of this report (see section 8.7 p.79). Sixteen questionnaires were sent out in total. Although there are 20 tanneries registered with theNational Bargaining Council, there are as many as 34 according to other lists. There are 14 ostrich
2. Skins, Hides and Leathers 17
R. Ballard
tanneries, one main footwear finishing tannery along with several smaller ones, about six tanneriesfinishing leather for the automotive industry and a number of wet-blue facilities.
The number of people employed in these tanneries averaged at 297 people and ranged from 45 toover 1000. While four firms reported increased numbers of employees since 1996, four stated that thenumbers of employees had declined. Reasons given for this included a lack of demand for thefinished good for which the leather was used, competition from imported leather and automationwithin the tannery.
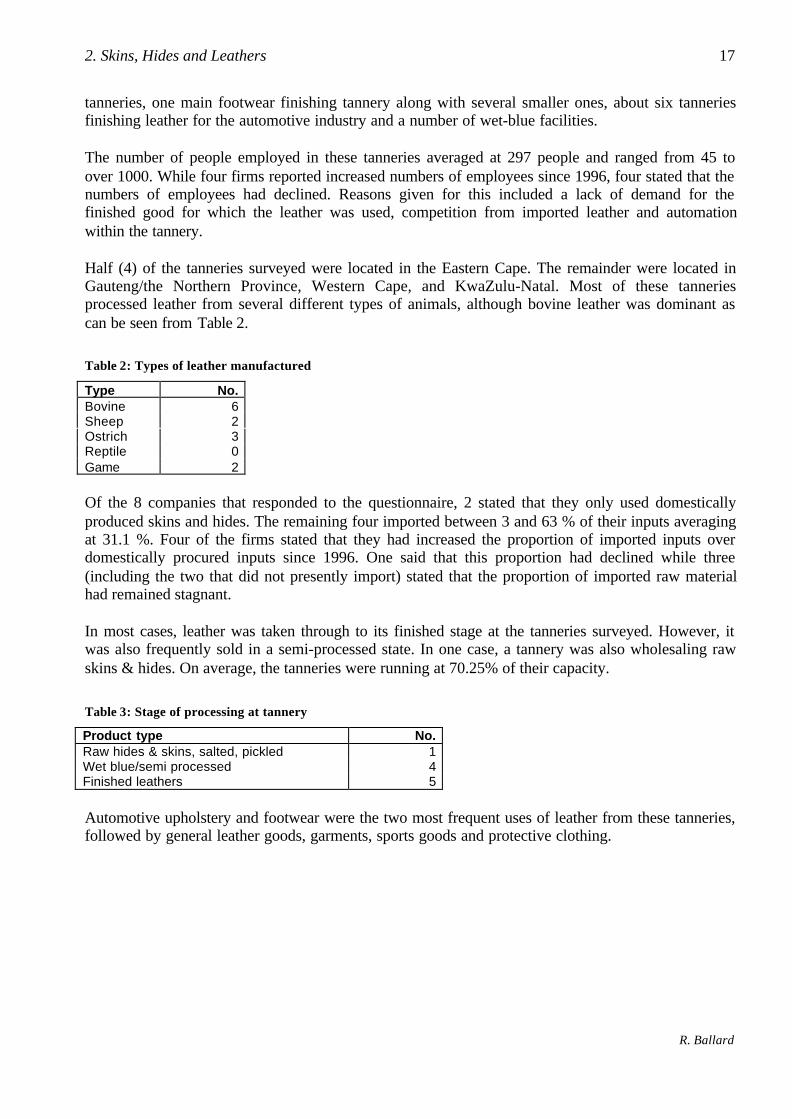
Half (4) of the tanneries surveyed were located in the Eastern Cape. The remainder were located inGauteng/the Northern Province, Western Cape, and KwaZulu-Natal. Most of these tanneriesprocessed leather from several different types of animals, although bovine leather was dominant ascan be seen from Table 2.
Table 2: Types of leather manufactured
Type No.Bovine 6Sheep 2Ostrich 3Reptile 0Game 2
Of the 8 companies that responded to the questionnaire, 2 stated that they only used domesticallyproduced skins and hides. The remaining four imported between 3 and 63 % of their inputs averagingat 31.1 %. Four of the firms stated that they had increased the proportion of imported inputs overdomestically procured inputs since 1996. One said that this proportion had declined while three(including the two that did not presently import) stated that the proportion of imported raw materialhad remained stagnant.
In most cases, leather was taken through to its finished stage at the tanneries surveyed. However, itwas also frequently sold in a semi-processed state. In one case, a tannery was also wholesaling rawskins & hides. On average, the tanneries were running at 70.25% of their capacity.
Table 3: Stage of processing at tannery
Product type No.Raw hides & skins, salted, pickled 1Wet blue/semi processed 4Finished leathers 5
Automotive upholstery and footwear were the two most frequent uses of leather from these tanneries,followed by general leather goods, garments, sports goods and protective clothing.

18 Bovine Leather Value Chain in SA
CSDS Research Report no. 40
Table 4: Types of products in which leather is ultimately used
Product type No.Automotive (car seats, steering wheel covers, gear lever covers, etc) 4Garments (Jackets, skirts, pants, hats, etc) 1General leather goods (wallets, filo-faxes, handbags, luggage, belts, accessories, etc) 3Sports goods (balls, gloves, saddlery, etc) 1Footwear (shoes, shoe components) 4Furniture (Leather lounge suites, upholstery, etc) 0Protective leather clothing 1Holsters and gun bags 0
Tanneries varied greatly in terms of turnover. While some were turning over in excess of R50million, there were some smaller players turning over little more than five million. Three tanneries ofvarying sizes provided their actual turnover and this averaged at R26,080,973.
Table 5: Turnover category of tanneries surveyed for the year 2000
Turnover Category No.Less than R 5 million 0R 5-10 million 1R 10-20 million 3R 20-50 million 1Above R 50 million 3
There were a variety of ownership structures amongst tanneries. While the majority were ownermanaged or private companies, two were subsidiaries of domestic companies and one was asubsidiary of a foreign company. Tanneries were asked whether they would like increased foreigninvestment in their tanneries. Of those that answered, five said no, one said yes.
Table 6: Ownership status of tanneries
Ownership type No.Subsidiary of Domestic Company 2Subsidiary of Foreign Company 1Independent: Ltd or Private Company 2Owner-Managed (Proprietor or Partnership) 3Joint Venture with Foreign Firm 0
The findings of this profiling exercise, provided for illustrative purposes, highlight the great diversitywithin the tanning industry. Tanneries range from relatively small owner-managed operations of 50people right up to multi-nationals employing more than a thousand people. They worked with varioustypes of skins and hides but were predominantly bovine orientated. They also made leather for avariety of uses, but concentrated on footwear and automotive.
2.3 Imports
In order to provide numerical figures for the import and export arrows (A D I, C, G, J) of the valuechain in Figure 3, it is useful now to turn to data calculated by Customs and Excise.
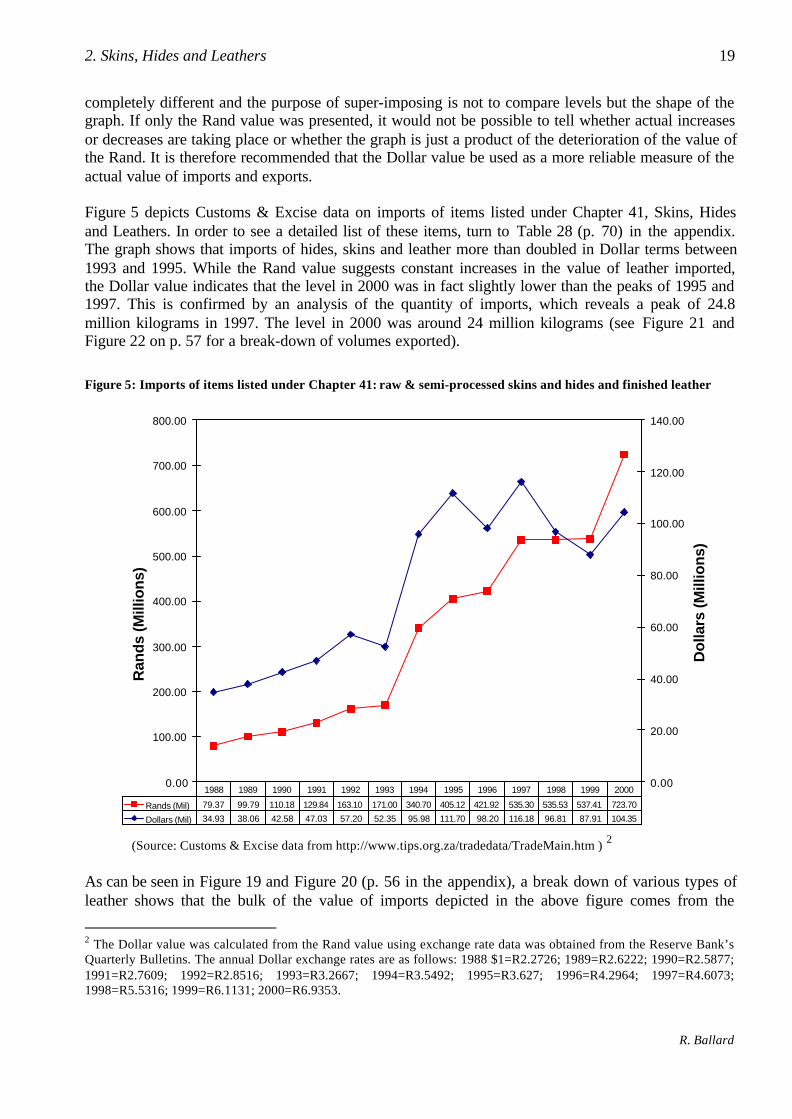
How to use Dollar/Rand graphs: Aggregate import and export data presented in this report uses theformat seen in Figure 5. Note that there are in fact two graphs super-imposed on one another. The redline (with squares) is the Rand value and needs to be read against the left axis, while the blue line(with diamonds) is the Dollar value and should be read against the right axis. The two scales are
2. Skins, Hides and Leathers 19
R. Ballard
completely different and the purpose of super-imposing is not to compare levels but the shape of thegraph. If only the Rand value was presented, it would not be possible to tell whether actual increasesor decreases are taking place or whether the graph is just a product of the deterioration of the value ofthe Rand. It is therefore recommended that the Dollar value be used as a more reliable measure of theactual value of imports and exports.
Figure 5 depicts Customs & Excise data on imports of items listed under Chapter 41, Skins, Hidesand Leathers. In order to see a detailed list of these items, turn to Table 28 (p. 70) in the appendix.The graph shows that imports of hides, skins and leather more than doubled in Dollar terms between1993 and 1995. While the Rand value suggests constant increases in the value of leather imported,the Dollar value indicates that the level in 2000 was in fact slightly lower than the peaks of 1995 and1997. This is confirmed by an analysis of the quantity of imports, which reveals a peak of 24.8million kilograms in 1997. The level in 2000 was around 24 million kilograms (see Figure 21 andFigure 22 on p. 57 for a break-down of volumes exported).
Figure 5: Imports of items listed under Chapter 41: raw & semi-processed skins and hides and finished leather
0.00
100.00
200.00
300.00
400.00
500.00
600.00
700.00
800.00
Ran
ds
(Mill
ion
s)
0.00
20.00
40.00
60.00
80.00
100.00
120.00
140.00
Do
llars
(M
illio
ns)
Rands (Mil) 79.37 99.79 110.18 129.84 163.10 171.00 340.70 405.12 421.92 535.30 535.53 537.41 723.70
Dollars (Mil) 34.93 38.06 42.58 47.03 57.20 52.35 95.98 111.70 98.20 116.18 96.81 87.91 104.35
1988 1989 1990 1991 1992 1993 1994 1995 1996 1997 1998 1999 2000
(Source: Customs & Excise data from http://www.tips.org.za/tradedata/TradeMain.htm ) 2
As can be seen in Figure 19 and Figure 20 (p. 56 in the appendix), a break down of various types ofleather shows that the bulk of the value of imports depicted in the above figure comes from the
2 The Dollar value was calculated from the Rand value using exchange rate data was obtained from the Reserve Bank’sQuarterly Bulletins. The annual Dollar exchange rates are as follows: 1988 $1=R2.2726; 1989=R2.6222; 1990=R2.5877;1991=R2.7609; 1992=R2.8516; 1993=R3.2667; 1994=R3.5492; 1995=R3.627; 1996=R4.2964; 1997=R4.6073;1998=R5.5316; 1999=R6.1131; 2000=R6.9353.
20 Bovine Leather Value Chain in SA
CSDS Research Report no. 40
importation of tanned and semi-processed Bovine and Equine leather to the value of $64.4 millionlast year. The next highest category was untanned bovine and equine hide, which cost $25 million in2000.
Using Customs & Excise data on value of imports and quantity of imports, it is possible to calculatethe unit price of imports. Figure 23 (p. 58) shows that the Dollar price of untanned, semi-processedand finished imports decreased from 1997 to 1999 but increased in 2000. Overall, tanned and semi-processed imports have, in fact, decreased slightly from a peak of $8.68 per kg in 1997 to $7.51 in2000. Of course, with the deterioration of the Rand, semi-processed and tanned hides have cost moreper kilogram for South African buyers. Between 1999 and 2000, the price increased from R40.7 perkg to R52.1 (Figure 24). Of concern is the increase in the cost of hides between 1999 and 2000, aglobal trend which is also reflected in the price of exports.
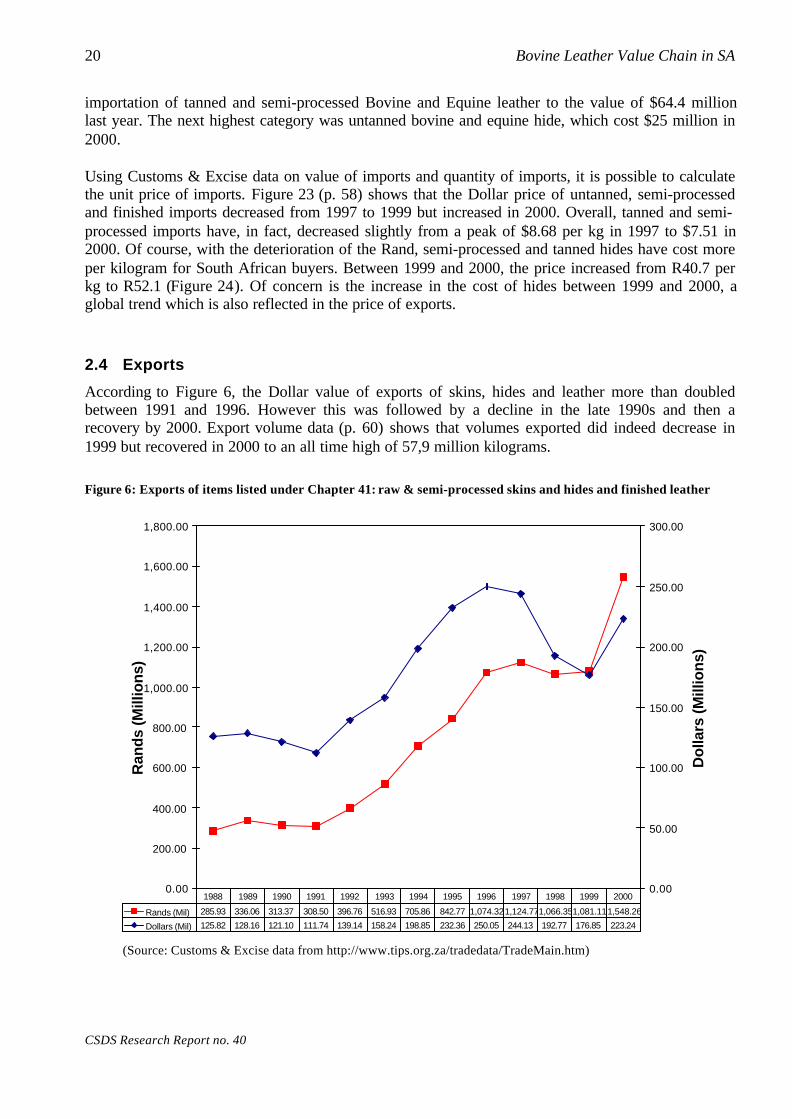
2.4 Exports
According to Figure 6, the Dollar value of exports of skins, hides and leather more than doubledbetween 1991 and 1996. However this was followed by a decline in the late 1990s and then arecovery by 2000. Export volume data (p. 60) shows that volumes exported did indeed decrease in1999 but recovered in 2000 to an all time high of 57,9 million kilograms.
Figure 6: Exports of items listed under Chapter 41: raw & semi-processed skins and hides and finished leather
0.00
200.00
400.00
600.00
800.00
1,000.00
1,200.00
1,400.00
1,600.00
1,800.00
Ran
ds
(Mill
ion
s)
0.00
50.00
100.00
150.00
200.00
250.00
300.00
Do
llars
(M
illio
ns)
Rands (Mil) 285.93 336.06 313.37 308.50 396.76 516.93 705.86 842.77 1,074.321,124.771,066.351,081.111,548.26
Dollars (Mil) 125.82 128.16 121.10 111.74 139.14 158.24 198.85 232.36 250.05 244.13 192.77 176.85 223.24
1988 1989 1990 1991 1992 1993 1994 1995 1996 1997 1998 1999 2000
(Source: Customs & Excise data from http://www.tips.org.za/tradedata/TradeMain.htm)

2. Skins, Hides and Leathers 21
R. Ballard
Figure 25 and Figure 26 (p. 59) provide a break-down of the relative value of exports of differentkinds of leather. Until 1999, ostrich, goat and reptile generated by far the most revenue. Thisoccurred despite relatively low volumes and was the result of far higher prices on this type of leather.However, in 2000 the earnings from exports of semi-processed and tanned hides increased from$37.6 million to $76 million, putting it roughly at the same level as earnings from ostrich, goat andreptile. Figure 30 (p. 61) shows that the reason for the increase was not the result of increased volumebut rather a doubling of the unit price of leather exported from $1.53 per kilogram to $3.07. In Randterms this represents an increase from R9.36 per kilogram to R21.28. Earnings from untanned hidesalso increased both as a result of increased volumes shipped and an increase in unit price.
When import and export figures are combined (Table 7), it becomes apparent that South Africa is anet exporter of skins, hides and leather, both in terms of quantity and value. South Africa exportsmore than double the value of the skins, hides and leather it imports. However, it is a net importer ofuntanned bovine and equine hide. This confirms the ‘shortage of hides’ frequently identified as a keyproblem by tanners.
Table 7: Net exports of types of skins, hides and leathers (2000)
Net exports (2000) Value in Dollars Quantity in KilogramsExports Imports Difference Exports Imports Difference
Untanned Bovine & Equine 18,953,928 25,044,838 -6,090,911 10,439,262 14,491,761 -4,052,499Untanned Sheep 25,995,812 29,241 25,966,571 13,761,772 605 13,761,167Untanned Ostrich, Goat, Reptile 10,430,006 2,771,582 7,658,424 4,561,789 230,389 4,331,400Tanned Bovine & Equine 75,964,029 64,418,110 11,545,919 24,759,758 8,632,755 16,127,003Tanned Sheep 11,088,337 138,492 10,949,844 1,684,945 4,650 1,680,295Tanned Ostrich, Goat, Reptile 80,810,865 11,947,232 68,863,633 2,667,402 627,071 2,040,331
223,242,976 104,349,495 118,893,481 57,874,928 23,987,231 33,887,697
In all cases other than ostrich leather, the value of the good exported per kilogram was lower than thevalue of the same leather in that category imported. The likely explanation of this is that the exportswere of a lower quality or an earlier stage of processing than the goods imported. This is particularlytrue for the category ‘tanned bovine and equine’ which includes semi-processed hide. The price paidfor exported hides is likely to reflect the dominance of wet blues in exports of this category, while theimported leather in this category is likely to be dominated by finished leather for the footwear andgeneral goods industry. These figures need to be used with some caution, however, as the volume ofsome categories of imports was virtually negligible (see above).
Table 8: Comparison of prices of imported and exported skins hides and leather
Price Exports $/kg Imports $/kgUntanned Bovine & Equine 1.15 1.38Untanned Sheep 2.28 3.28Untanned Goat, Reptile, Other 1.55 9.54Tanned Bovine & Equine 1.53 6.66Tanned Sheep 6.90 10.81Tanned Goat, Reptile, Other 31.86 13.82
2.5 Summary of key issues
• Quality of hides: While hide quality is reasonable by world standards, certain changes couldbe implemented by those who look after the animal during its life and those who prepare thehide in order to improve quality.

22 Bovine Leather Value Chain in SA
CSDS Research Report no. 40
• Availability of hides: There is a shortage both globally and domestically of hides. Thedemand for hides by the automotive sector out-strips the number of cattle slaughtered locally.
• Price of hides: The price of hides is determined on the international hide market. The price ofhides on this market has increased over the last two years, reversing the trend of the previousfew years. The advent of foot and mouth has also fuelled this increase. In South Africa, theseincreases are exaggerated with the depreciation of the Rand. Local buyers of hides includingwet blue tanners and leather finishers have found it increasingly difficult to offer the sameprice buyers abroad are prepared to pay.
• Exports: The export of skins, hides and semi-processed leather generates substantial foreignearnings for South Africa. Yet, in the context of the previous point on hide prices, somesections of the tanning industry believe the export of hides should have some barriers in orderto ensure that raw materials are available for local downstream activities.
• Imports: The importation of raw hides takes place to make up the shortfall of locallyavailable hides. Most agree that this should be encouraged and facilitated. However, theimportation of finished leather is more contentious. On one hand there is a residual footweartanning industry which is attempting to compete with cheap dumped leather from abroad. Onthe other hand, this cheap leather is a raw input into the footwear and general goods sectorswhich are themselves struggling to be competitive.
• Tanning overcapacity: There is an over-capacity of wet blue and footwear finishingfacilities in South Africa due, in part, to the shortage of raw material and the decline of somedownstream industries.
3 Automotive upholstery
3.1 The Motor Industry Development Programme & automotive upholstery
The types of factories addressed in this section are the cut and stitching operations that manufactureleather seat covers for the automotive industry (stage four of Figure 3, p. 8). This is not alongstanding industry in South Africa and most factories are just five or six years old. The primaryreason for the growth of the tanning industry into automotive upholstery is the Motor IndustryDevelopment Programme (MIDP) implemented by the Department of Trade and Industry inSeptember 1995. While initially due to last until 2002, it has now been extended, in a revised form,until 2007. The fundamental difference between the MIDP and previous government intervention inthe motor industry was that in the past, the government provided ‘demand side’ support which meantthat it promoted the demand for locally made goods by placing prohibitive taxes on imported goods(Barnes & Morris 2000). The MIDP, by contrast, is a supply side support programme which does notaim to protect local industry from international competition, but to enable local industry to becomeinternationally competitive. Therefore, the automotive sector was, by nature, to become exportorientated thus diminishing the importance of defending the domestic market.
The key component of the MIDP with regards to automotive upholstery is that it contained animport-export complementation scheme that gave credits to component manufacturers andassemblers for any exported goods. These credits, which are transferable, could then be used byassemblers to offset the duty on parts or vehicles that they wanted to import. Part of the reason forpromoting exports is that the automotive industry was historically a net importer, and a source oftrade imbalance for the South African economy.
While the exports of a variety of automotive components have thrived in response to this incentive,two products have shown particularly dramatic growth: stitched leather seat covers and catalyticconverters. Until 1998 leather car seats was the category of components that generated the mostexport revenue. It is now second to catalytic converters but still accounts for around a fifth of thetotal value of all exports of automotive components (DTI 2000). While these appear to be twoentirely different products, one common factor explains their meteoric success: low value addingactivity in relation to the cost of the final product due to the high cost of inputs. The inclusion of rawmaterials as part of the rebate scheme is criticised as a major weakness in terms of the objectives ofpromoting the components sector as assemblers have used relatively low value added exports insteadof other vehicle parts (Barnes & Morris 2000: 13). This dimension of the MIDP has been criticisedfrom the leather industry itself for a different reason, which is that there is a shortage of high qualityhides necessary for the volume of seats manufactured. This shortage results in inflated hide pricessince hide sellers are aware of the extra-ordinary value of their hide from a local content point ofview.
Despite these problems, the MIDP is widely acknowledged to have saved the hide tanning industrywhich was facing demise as its traditional customers, the footwear and general leather goodsmanufacturers, failed to retain their market.
24 Bovine Leather Value Chain in SA
CSDS Research Report no. 40
3.2 Automotive seat manufacturers
3.2.1 The value chainWhile they are very clearly part of the leather commodity chain, many seat manufacturers considerthemselves less a part of the leather industry and more a part of the automotive industry. Indeed,these firms are not actually registered with the National Bargaining Council of Leather Industries orany of the leather related employers associations. Most of them are, however, registered withNAACAM (the National Association of Automotive Component and Allied Manufacturers).
The type of operation carried out at these firms is closer to the manufacture of other automotiveproducts, such as non-leather upholstery, than it is to the products traditionally considered part of theleather industry (footwear, general leather goods, etc). Furthermore, as the value chain outlined inFigure 3 suggests, the automotive upholstery sub-sector requires an entirely different input than otherleather goods producers. While general leather goods, footwear manufacturers and automotiveupholstery manufacturers may share common suppliers of raw hides and wet blues, they would notshare a common supply of finished leather. The reason for this is that automotive leather andfootwear/general goods leather are very different. Automotive upholstery leather only utilises theouter 1-2 millimetres of the hide (known as the grain). Furthermore, it requires good quality hidesdue to the stringent demands of automotive assemblers.
3.2.2 Descriptive profile of automotive upholstery firmsTable 32 (p. 75) estimates that there are 8 cut and stitch operations producing automotive leatherproducts in South Africa. Some of these spread their operations across two or three factories each.Seven questionnaires were circulated to these firms and four were returned.
Customers: Seat manufacturers are producing seats for car assemblers such as BMW, DaimlerChrysler, Audi, Ford, and Daewoo.
Age: Many of these factories are very new – most having opened within the last six years. Equipmentwithin the factories is therefore relatively up to date.
Size: In line with other automotive component assemblers, seat manufacturers generally employseveral hundred and sometimes more than a thousand employees. The average for the four surveysreturned was 573.75 employees.
Leather used: Automotive upholsterers use exclusively bovine leather, although one ostrich tanneryreported that one of the automotive assemblers was, at one stage, considering using ostrich leather inparts of their seats.
Ownership: Cut and stitch operations are generally subsidiaries of multi-national companies. Severalof these companies are, in fact, owned by the same multi-national.
3.2.3 Key issuesRelationship with customers: The cut and stitch operations that manufacture the seat covers havevery close relationships with their customers. These relationships are long term contracts withautomotive assemblers supplying highly specialised parts, such as seats for a single car model. These
3. Automotive upholstery 25
R. Ballard
contracts sometimes last for several years. In some cases, these cut and stitch operations are actuallyowned by the automotive assembler. The remaining factories are generally part of multinational firmsspecialising in the manufacture of interior auto trim.
The seat manufacturers supply their products on a ‘just in time’ basis, delivering up to three times aday. Finished goods inventory at the seat manufacturers is less than a day. Once they have beenreceived by the customer (usually one of the assemblers) they are air-freighted to their overseasmarkets, mainly in Germany. One exporter alone is flying around 500 tons of leather seat covers perweek, which equates to hundreds of thousands of seat kits per year.
Crucially, since the assemblers are the ones who actually export the product, they are the recipientsof the MIDP import rebate, not the seat manufacturer or any stage further upstream. Therefore it isimportant to realise that the only direct beneficiaries of the MIDP are the automotive assemblers. Theauto upholstery industry and tanning industry only benefits indirectly from the MIDP since thebusiness is kept within South Africa. Arguably, the MIDP does subsidise this commodity chain sincethe end customer (the assembler) is able to pay more for the seats, who are then able to pay more forinputs, than they would be able to without the MIDP.
Inputs: Seat cover manufacturers often do not have control over their inputs. In several cases theseinputs are procured on their behalf by the automotive assembler for whom they sew the seat covers.Therefore the only relationship between some seat manufacturers and their suppliers is one whichconcentrates on leather quality as they do not order their own raw materials.
While some of these seat manufacturers are both leather cutters and sewers, others do not have anycutting abilities and receive pre-cut leather components ready for stitching. Cutting is done for thelatter either by other trim manufacturers, or increasingly by the automotive leather tanneriesthemselves.
The implication of this is that the assemblers are in direct control over the logistics of the seatmanufacturers. What they make in any given week is determined by the inputs supplied to them bythe tannery as ordered by the assembler.
Quality: Rejects by customers are very high in this industry. One seat manufacturer estimated thatparts per million returned could be as low as 20000 at good firms but could also be as high as 70000.
Problems with raw materials (i.e. leather) are the most frequent cause of seats returned from thecustomer. In many cases the problem is not so much that there is something defective with the leatherbut rather that it is inconsistent in appearance. As the seat manufacturers point out, however, leatheris an organic product which, by definition, is variable. It is not possible to simply reproduce a type ofleather as one would a textile. Some exclusive sports car manufacturers do, in fact, supply aneducation pamphlet on the leather upholstery in their vehicles explaining reasons for marks andinconsistent appearance and justifying this on the basis that it is a natural product. More massproduced luxury cars have not, however, reached this stage.
As well as variations in raw material appearance, there can be more fundamental problems. Forexample, in an attempt to get a higher yield from the hide tanneries sometimes use hide from thestomach area which is far more stretchable and can be difficult to work with. Different thickness ofraw material even within specified tolerance can also make sewing work difficult.
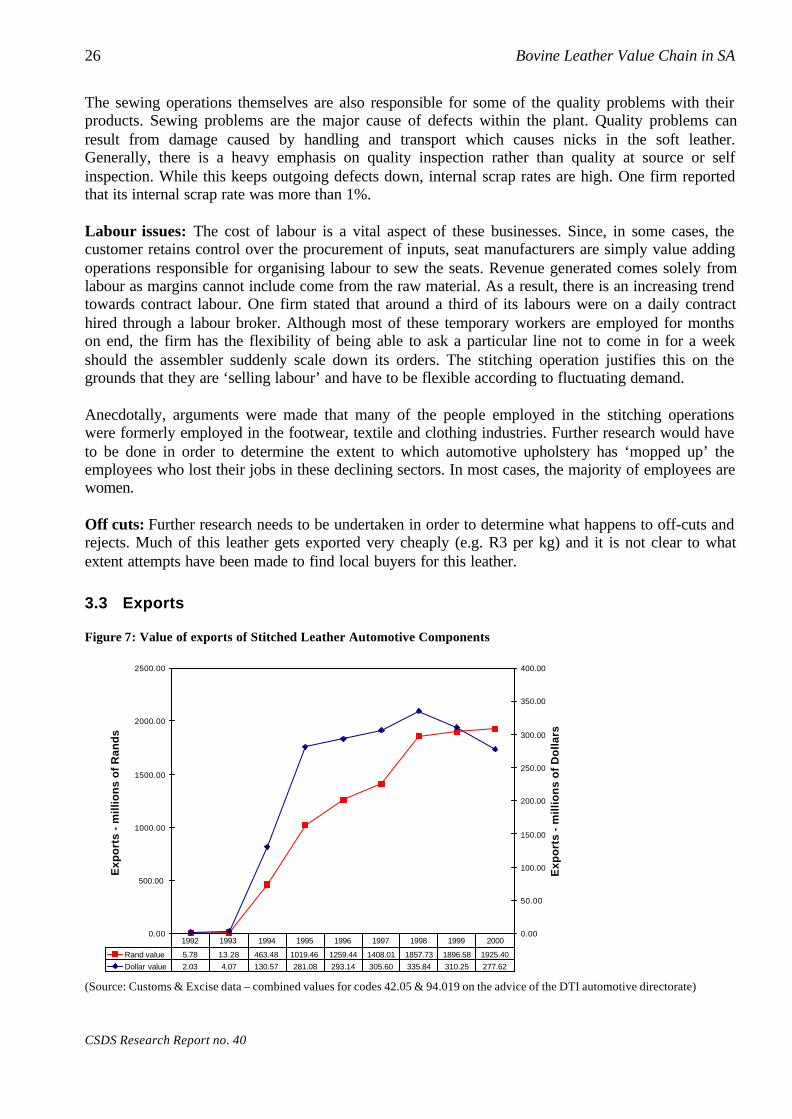
26 Bovine Leather Value Chain in SA
CSDS Research Report no. 40
The sewing operations themselves are also responsible for some of the quality problems with theirproducts. Sewing problems are the major cause of defects within the plant. Quality problems canresult from damage caused by handling and transport which causes nicks in the soft leather.Generally, there is a heavy emphasis on quality inspection rather than quality at source or selfinspection. While this keeps outgoing defects down, internal scrap rates are high. One firm reportedthat its internal scrap rate was more than 1%.
Labour issues: The cost of labour is a vital aspect of these businesses. Since, in some cases, thecustomer retains control over the procurement of inputs, seat manufacturers are simply value addingoperations responsible for organising labour to sew the seats. Revenue generated comes solely fromlabour as margins cannot include come from the raw material. As a result, there is an increasing trendtowards contract labour. One firm stated that around a third of its labours were on a daily contracthired through a labour broker. Although most of these temporary workers are employed for monthson end, the firm has the flexibility of being able to ask a particular line not to come in for a weekshould the assembler suddenly scale down its orders. The stitching operation justifies this on thegrounds that they are ‘selling labour’ and have to be flexible according to fluctuating demand.
Anecdotally, arguments were made that many of the people employed in the stitching operationswere formerly employed in the footwear, textile and clothing industries. Further research would haveto be done in order to determine the extent to which automotive upholstery has ‘mopped up’ theemployees who lost their jobs in these declining sectors. In most cases, the majority of employees arewomen.
Off cuts: Further research needs to be undertaken in order to determine what happens to off-cuts andrejects. Much of this leather gets exported very cheaply (e.g. R3 per kg) and it is not clear to whatextent attempts have been made to find local buyers for this leather.
3.3 Exports
Figure 7: Value of exports of Stitched Leather Automotive Components
0.00
500.00
1000.00
1500.00
2000.00
2500.00
Exp
ort
s -
mil
lio
ns
of
Ran
ds
0.00
50.00
100.00
150.00
200.00
250.00
300.00
350.00
400.00
Ex
po
rts
- m
illi
on
s o
f D
oll
ars
Rand value 5.78 13.28 463.48 1019.46 1259.44 1408.01 1857.73 1896.58 1925.40
Dollar value 2.03 4.07 130.57 281.08 293.14 305.60 335.84 310.25 277.62
1992 1993 1994 1995 1996 1997 1998 1999 2000
(Source: Customs & Excise data – combined values for codes 42.05 & 94.019 on the advice of the DTI automotive directorate)
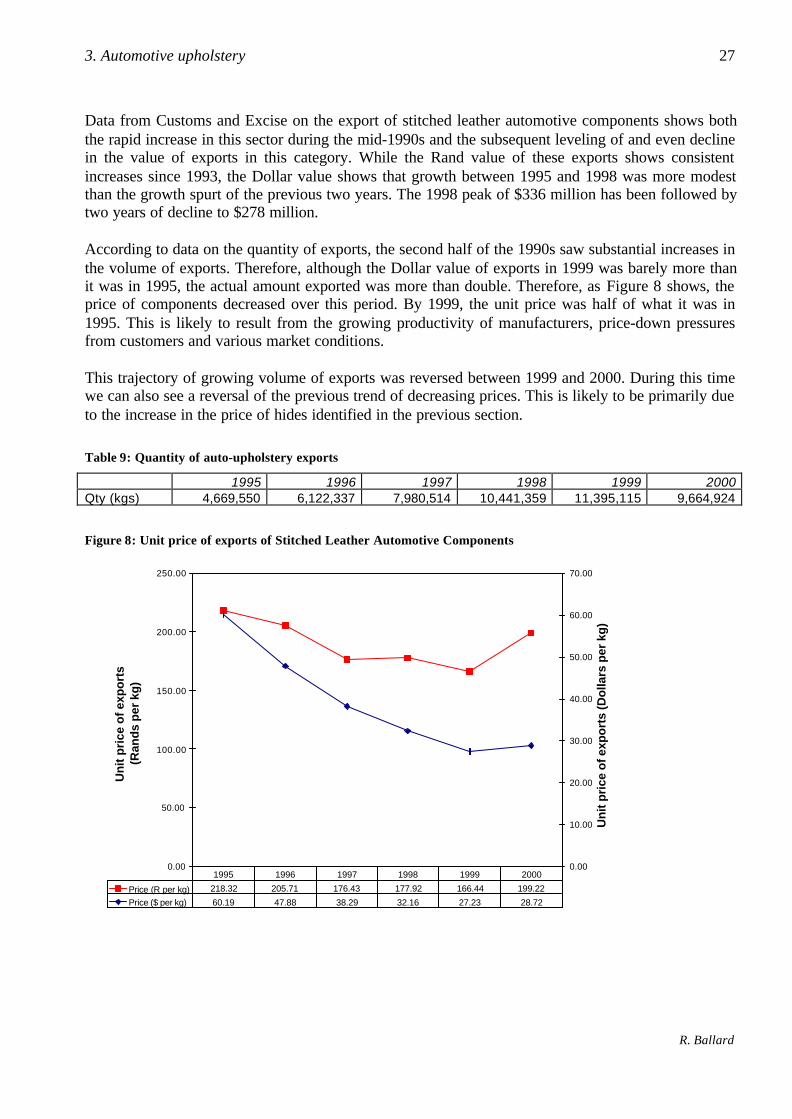
3. Automotive upholstery 27
R. Ballard
Data from Customs and Excise on the export of stitched leather automotive components shows boththe rapid increase in this sector during the mid-1990s and the subsequent leveling of and even declinein the value of exports in this category. While the Rand value of these exports shows consistentincreases since 1993, the Dollar value shows that growth between 1995 and 1998 was more modestthan the growth spurt of the previous two years. The 1998 peak of $336 million has been followed bytwo years of decline to $278 million.
According to data on the quantity of exports, the second half of the 1990s saw substantial increases inthe volume of exports. Therefore, although the Dollar value of exports in 1999 was barely more thanit was in 1995, the actual amount exported was more than double. Therefore, as Figure 8 shows, theprice of components decreased over this period. By 1999, the unit price was half of what it was in1995. This is likely to result from the growing productivity of manufacturers, price-down pressuresfrom customers and various market conditions.
This trajectory of growing volume of exports was reversed between 1999 and 2000. During this timewe can also see a reversal of the previous trend of decreasing prices. This is likely to be primarily dueto the increase in the price of hides identified in the previous section.
Table 9: Quantity of auto-upholstery exports
1995 1996 1997 1998 1999 2000Qty (kgs) 4,669,550 6,122,337 7,980,514 10,441,359 11,395,115 9,664,924
Figure 8: Unit price of exports of Stitched Leather Automotive Components
0.00
50.00
100.00
150.00
200.00
250.00
Un
it p
rice
of
exp
ort
s (R
and
s p
er k
g)
0.00
10.00
20.00
30.00
40.00
50.00
60.00
70.00
Un
it p
rice
of
exp
ort
s (D
olla
rs p
er k
g)
Price (R per kg) 218.32 205.71 176.43 177.92 166.44 199.22
Price ($ per kg) 60.19 47.88 38.29 32.16 27.23 28.72
1995 1996 1997 1998 1999 2000
28 Bovine Leather Value Chain in SA
CSDS Research Report no. 40
3.4 Future of the sector
Furture growth: Many believe that the sector has reached its saturation point and will not growmuch further.
Hide price: One way in which the demand for automotive upholstery would grow is if the price ofhides were to be reduced. They would then become a more affordable choice for buyers of a varietyof types of cars.
Productivity & alternative geographic centres: Some concern was expressed about the potential ofother countries to enter the automotive upholstery arena. According to one firm, workers in Hungaryare being paid R250 a week which is much lower than South African wages and Hungary is muchcloser to Germany. Other benchmarking activity undertaken by firms is inconclusive but doessuggest that South Africa is not at a productivity disadvantage compared to other countries. Atpresent, Far Eastern countries are receiving some out-sourcing work from the global trimmanufacturers but as yet have no design or customer relations strengths. Should this situation change,the Far East could pose a more serious threat.
Future significance of the MIDP: The MIDP is central to the continued success of the seat makingsector. One seat manufacturer stated bluntly ‘if the MIDP falls away, we’re dead’. Some reported thatthe MIDP was a necessary incentive to overcome the distance between SA and the main markets inEurope, and that the cost of logistics may be the major factor causing a loss of business should theMIDP go.
However, whether the MIDP remains or not, it may become less significant if other types of exportsbecome more prominent. As one tanner pointed out, even if the MIDP did remain, it will play less ofa role for the Automotive Assemblers since they are increasingly exporting whole cars which willgive them the credits they require in order to import other cars and components.
At present the import credits from the MIDP are being phased downwards towards the end of theprogramme in 2007.
3.5 Summary of key issues
• Export focus: One of the key aspects of the automotive industry is its export focus. It is notdependent in any way on the domestic end-buyer market.
• Quality of raw materials: Raw materials are identified as the most frequent cause of qualityproblems.
• Cost of raw materials: The hide price is cited as one of the main restraints on the furthergrowth of the sector.
• Future significance of MIDP: Although some seat manufacturers believe they are becomingcompetitive in their own right, the MIDP incentive is likely to remain a key factor in futuredecisions by assemblers of whether to keep this business in South Africa.
• Dependence of tanneries: Should the automotive upholstery sector fail, it is likely to resultin the collapse of the tanning industry. South Africa would become like Australia whichsimply exports raw hides without any value adding.

4 General leather products
This section examines manufacturers that produce general leather products including fashion items,belts, leather clothing, filo-faxes, luggage, furniture, and industrial protective clothing. Therefore, thedefinition of general goods as used here is broader than the definition used by the NationalBargaining Council of the Leather Industry which would not include items such as furniture.
This section has three parts. First, it provides a profile of the types of firms found in this sector basedon data from the questionnaire. Second, there is a review of the pressures faced by this sector, and themajor challenges and barriers identified by manufacturers. Third, the discussion concentrates on threeof these pressures, namely competition from imported goods, raw material supply and the challengeto export.
4.1 A sector under pressure
4.1.1 Declining employmentData from the National Bargaining Council of the Leather Industry of South Africa (Table 10) showsthe dramatic decline in the number of formal sector companies and employees in the general goodssector. Both the number of employers and employees declined by around a third of their 1995 levels.Average firm size indicates that the number of employees has remained relatively constant at justbelow 30 employees in each company. In other words, the decline in the number of employees in thesector is consistent with the decline in the number of firms, meaning that job losses are related tofactory closures rather than ‘downsizing’.
Table 10: Employers and employees in the general leather goods sector
1995 1996 1997 1998 1999 2000 2001 % change 95-01Employers 119 116 108 108 97 87 78 -34.5Employees 3410 3183 3040 3167 2716 2458 2287 -32.9Avg. frm size 28.7 27.4 28.1 29.3 28.0 28.3 29.3 2.3(Source: National Bargaining Council of the Leather Industry of South Africa)
The Bargaining Council’s statistics can be further disaggregated into regional change. As can be seenfrom Figure 9, KwaZulu-Natal declined the most between 1995 and 2001, shrinking by 58.6%,followed by the Western Cape which declined by 48.1%, and the Eastern Cape which declined by43%. Gauteng, on the other hand, remained relatively constant declining only by 2.1% between 1995and 2001.
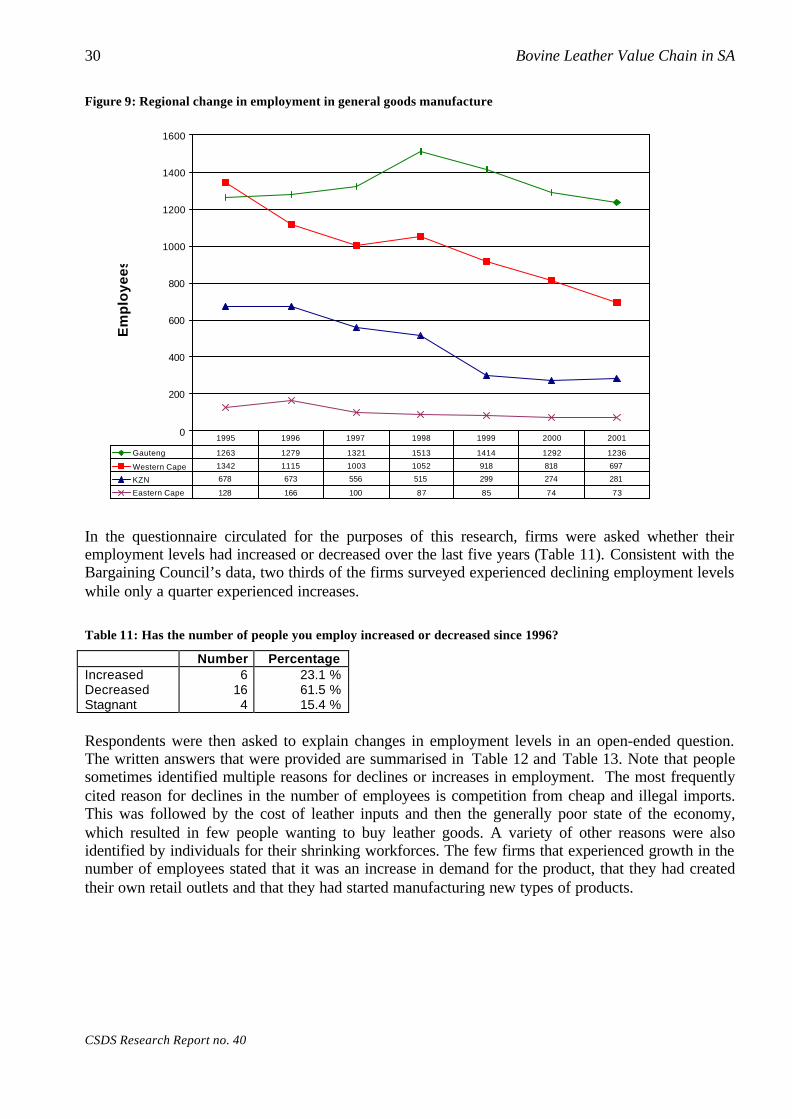
30 Bovine Leather Value Chain in SA
CSDS Research Report no. 40
Figure 9: Regional change in employment in general goods manufacture
0
200
400
600
800
1000
1200
1400
1600E
mp
loy
ee
s
Gauteng 1263 1279 1321 1513 1414 1292 1236
Western Cape 1342 1115 1003 1052 918 818 697
KZN 678 673 556 515 299 274 281
Eastern Cape 128 166 100 87 85 74 73
1995 1996 1997 1998 1999 2000 2001
In the questionnaire circulated for the purposes of this research, firms were asked whether theiremployment levels had increased or decreased over the last five years (Table 11). Consistent with theBargaining Council’s data, two thirds of the firms surveyed experienced declining employment levelswhile only a quarter experienced increases.
Table 11: Has the number of people you employ increased or decreased since 1996?
Number PercentageIncreased 6 23.1 %Decreased 16 61.5 %Stagnant 4 15.4 %
Respondents were then asked to explain changes in employment levels in an open-ended question.The written answers that were provided are summarised in Table 12 and Table 13. Note that peoplesometimes identified multiple reasons for declines or increases in employment. The most frequentlycited reason for declines in the number of employees is competition from cheap and illegal imports.This was followed by the cost of leather inputs and then the generally poor state of the economy,which resulted in few people wanting to buy leather goods. A variety of other reasons were alsoidentified by individuals for their shrinking workforces. The few firms that experienced growth in thenumber of employees stated that it was an increase in demand for the product, that they had createdtheir own retail outlets and that they had started manufacturing new types of products.
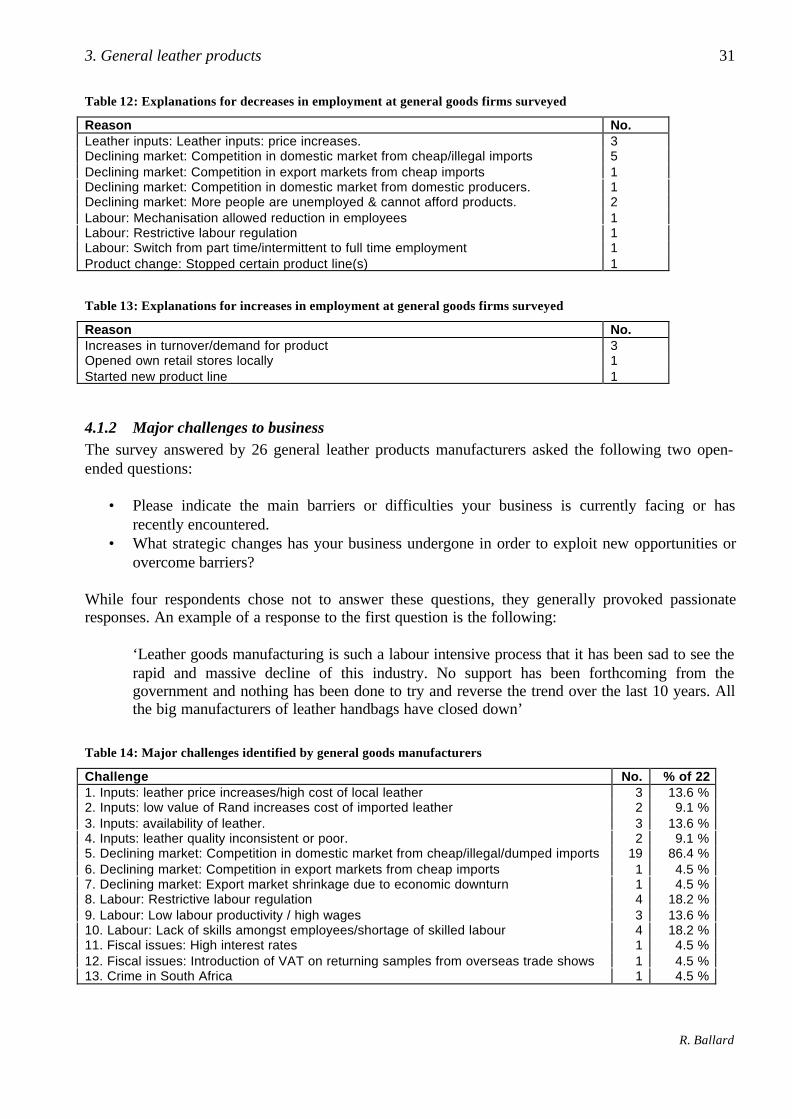
3. General leather products 31
R. Ballard
Table 12: Explanations for decreases in employment at general goods firms surveyed
Reason No.Leather inputs: Leather inputs: price increases. 3Declining market: Competition in domestic market from cheap/illegal imports 5Declining market: Competition in export markets from cheap imports 1Declining market: Competition in domestic market from domestic producers. 1Declining market: More people are unemployed & cannot afford products. 2Labour: Mechanisation allowed reduction in employees 1Labour: Restrictive labour regulation 1Labour: Switch from part time/intermittent to full time employment 1Product change: Stopped certain product line(s) 1
Table 13: Explanations for increases in employment at general goods firms surveyed
Reason No.Increases in turnover/demand for product 3Opened own retail stores locally 1Started new product line 1
4.1.2 Major challenges to businessThe survey answered by 26 general leather products manufacturers asked the following two open-ended questions:
• Please indicate the main barriers or difficulties your business is currently facing or hasrecently encountered.
• What strategic changes has your business undergone in order to exploit new opportunities orovercome barriers?
While four respondents chose not to answer these questions, they generally provoked passionateresponses. An example of a response to the first question is the following:
‘Leather goods manufacturing is such a labour intensive process that it has been sad to see therapid and massive decline of this industry. No support has been forthcoming from thegovernment and nothing has been done to try and reverse the trend over the last 10 years. Allthe big manufacturers of leather handbags have closed down’
Table 14: Major challenges identified by general goods manufacturers
Challenge No. % of 221. Inputs: leather price increases/high cost of local leather 3 13.6 %2. Inputs: low value of Rand increases cost of imported leather 2 9.1 %3. Inputs: availability of leather. 3 13.6 %4. Inputs: leather quality inconsistent or poor. 2 9.1 %5. Declining market: Competition in domestic market from cheap/illegal/dumped imports 19 86.4 %6. Declining market: Competition in export markets from cheap imports 1 4.5 %7. Declining market: Export market shrinkage due to economic downturn 1 4.5 %8. Labour: Restrictive labour regulation 4 18.2 %9. Labour: Low labour productivity / high wages 3 13.6 %10. Labour: Lack of skills amongst employees/shortage of skilled labour 4 18.2 %11. Fiscal issues: High interest rates 1 4.5 %12. Fiscal issues: Introduction of VAT on returning samples from overseas trade shows 1 4.5 %13. Crime in South Africa 1 4.5 %

32 Bovine Leather Value Chain in SA
CSDS Research Report no. 40
The various responses to the first question are summarised in Table 14. By far the most frequentlycited challenge is a declining domestic market as a result of cheap or illegal or dumped imports,especially from the Far East. This was identified by 19 of the 22 firms (86.4 %) that answered thisquestion. Other market related challenges identified were declining markets are a result of economicdownturns, and competition in export markets from the Far East. Several firms also mentioned labourrelated issues such as restrictive labour laws, low labour productivity and a lack of skills. Another setof challenges related to inputs, the rising cost of leather, the unavailability of leather, and theinconsistent or poor quality of the available leather. Finally, regarding the economic and politicalcontext, companies referred to high interest rates, vat being charged on samples returning from tradefairs and crime in South Africa.
In response to the second question, companies were undertaking a variety of strategies to overcomethe above challenges. Encouragingly, the most frequently cited strategy was to attempt to becomeexporters, a strategy mentioned by just less than a third of the firms. Other marketing strategies suchas bypassing retailers, setting up own retail outlets, creating internet catalogues, and exploring newdomestic markets generally. There was also a set of strategies around product change, such asswitching to niche or up market products, increasing the range of products or changing productsmade. In order to resolve the raw materials/inputs problems, firms were either switching to syntheticsor importing leather to get around shortages in local supplies. Labour related strategies includedtraining and giving shares to employees. Firms were also buying new machinery and capital toresolve production problems. On the more negative side, one firm stated that they were switchingaway from manufacturing to wholesale of imported finished goods and several referred to merging,downsizing or closing.
Table 15: New business strategies being deployed by general products manufacturers to overcome challenges
New strategies No. % of 221. Product change: Upgrade quality/moving upmarket 2 9.1 %2. Product change: Increase range of products 2 9.1 %3. Product change: Change products made 1 4.5 %4. Product change: Switching to niche products (such as game, personalised products) 2 9.1 %5. Inputs: Switching to synthetics 6 27.3 %6. Inputs: Importing leather to obtain required quality/type 2 9.1 %7. Marketing: exploring new domestic markets 1 4.5 %8. Marketing: exporting more, exploring new export markets; attending trade shows 7 31.8 %9. Marketing: created an internet catalogue 1 4.5 %10. Marketing: using more direct retailers such as factory shops 1 4.5 %11. Marketing: using multiple distributors to sell finished goods 1 4.5 %12. Marketing: opening own domestic retail outlets 1 4.5 %13. Labour: In-house training to boost skills 1 4.5 %14. Labour: Black empowerment: Shares to paid employees 1 4.5 %15. Capital expenditure: Acquiring new machinery 1 4.5 %16. Importing finished goods (switching away from manufacturing to wholesale) 1 4.5 %17. Downsizing, merging, closing 3 13.6 %
Having outlined the perspective of businesses, the following examines the challenges of cheapimports, raw materials and the drive to export in more detail.

3. General leather products 33
R. Ballard
4.2 Descriptive profile of general goods manufacturers
In order to build up an impression of the types of firms that exist within this sector, the followingprovides a descriptive profile of firms based on returned questionnaires and data derived from theNational Bargaining Council of Leather Industries.
Location: Twenty six general leather products manufacturers were surveyed, just under half ofwhom were located in Gauteng, with a strong representation also from the Western Cape followed bya few firms in KwaZulu-Natal and the Eastern Cape. This is a fairly similar distribution to thelocation of all firms registered with the National Bargaining Council which showed Gauteng andWestern cape as the two provinces with the most firms followed by KZN and the Eastern Cape.
Table 16: Location of general goods manufacturers
Province Number of returnedquestionnaires
% Number of employersregistered with Council
%
Gauteng 12 46.2 % 34 43.6 %Western Cape 9 34.6 % 32 41.0 %KwaZulu-Natal 3 11.5 % 9 11.5 %Eastern Cape 2 7.7 % 3 3.8 %Total 26 100 % 78 100%
Firm size: For the purposes of describing the number of employees it is necessary to disaggregatethe number of firms. The two furniture firms had an average of close to 500 people each. Theremaining 24 firms had an average number 42.3 employees ranging from 3 to 280. However, the firmemploying 280 people was an outlier as the next largest firm employed 85 people. Therefore if thefirm employing 280 people is removed, the remaining 23 firms employed an average of 31.9 people.As Table 10 (below) shows, the average number of employees of those firms registered at theNational Bargaining Council for the Leather Industry is 29.3 people. Since the firm employing 280people was not a member of the Council, the average number of employees of those firms surveyedis fairly similar to all those registered with the Council.
Products: The overwhelming majority of the firms produced general leather items such as wallets,filo-faxes, handbags, luggage, and belts. Three also were engaged in the manufacture of fashionclothing, and there were also firms manufacturing sports goods, footwear (in combination withgeneral leather goods), furniture, protective leather clothing and gun accessories.
Table 17: Types of products manufactured by companies surveyed
Product type No. % offirms
Garments (Jackets, skirts, pants, hats, etc) 3 11.5 %General leather goods (wallets, filo-faxes, handbags, luggage, belts, accessories, etc) 22 84.6 %Sports goods (balls, gloves, saddlery, etc) 2 7.7 %Footwear (shoes, shoe components) 1 3.8 %Furniture (Leather lounge suites, upholstery, etc) 2 7.7 %Protective leather clothing 1 3.8 %Holsters and gun bags 2 7.7 %
While most of the manufacturers use bovine leather, eleven also use game, ten use ostrich leather,eight used sheep leather, and six used reptile.
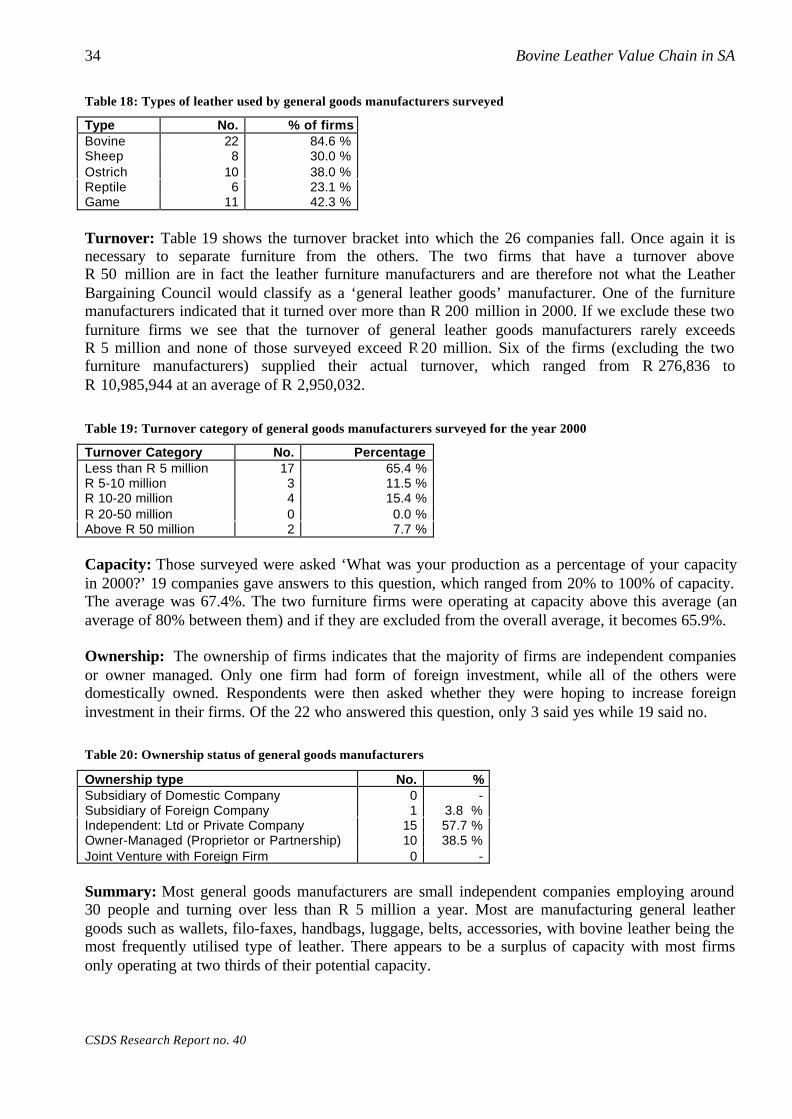
34 Bovine Leather Value Chain in SA
CSDS Research Report no. 40
Table 18: Types of leather used by general goods manufacturers surveyed
Type No. % of firmsBovine 22 84.6 %Sheep 8 30.0 %Ostrich 10 38.0 %Reptile 6 23.1 %Game 11 42.3 %
Turnover: Table 19 shows the turnover bracket into which the 26 companies fall. Once again it isnecessary to separate furniture from the others. The two firms that have a turnover aboveR0500million are in fact the leather furniture manufacturers and are therefore not what the LeatherBargaining Council would classify as a ‘general leather goods’ manufacturer. One of the furnituremanufacturers indicated that it turned over more than R02000million in 2000. If we exclude these twofurniture firms we see that the turnover of general leather goods manufacturers rarely exceedsR050million and none of those surveyed exceed R0200million. Six of the firms (excluding the twofurniture manufacturers) supplied their actual turnover, which ranged from R0276,836 toR010,985,944 at an average of R02,950,032.
Table 19: Turnover category of general goods manufacturers surveyed for the year 2000
Turnover Category No. PercentageLess than R 5 million 17 65.4 %R 5-10 million 3 11.5 %R 10-20 million 4 15.4 %R 20-50 million 0 0.0 %Above R 50 million 2 7.7 %
Capacity: Those surveyed were asked ‘What was your production as a percentage of your capacityin 2000?’ 19 companies gave answers to this question, which ranged from 20% to 100% of capacity.The average was 67.4%. The two furniture firms were operating at capacity above this average (anaverage of 80% between them) and if they are excluded from the overall average, it becomes 65.9%.
Ownership: The ownership of firms indicates that the majority of firms are independent companiesor owner managed. Only one firm had form of foreign investment, while all of the others weredomestically owned. Respondents were then asked whether they were hoping to increase foreigninvestment in their firms. Of the 22 who answered this question, only 3 said yes while 19 said no.
Table 20: Ownership status of general goods manufacturers
Ownership type No. %Subsidiary of Domestic Company 0 -Subsidiary of Foreign Company 1 3.8 %Independent: Ltd or Private Company 15 57.7 %Owner-Managed (Proprietor or Partnership) 10 38.5 %Joint Venture with Foreign Firm 0 -
Summary: Most general goods manufacturers are small independent companies employing around30 people and turning over less than R 5 million a year. Most are manufacturing general leathergoods such as wallets, filo-faxes, handbags, luggage, belts, accessories, with bovine leather being themost frequently utilised type of leather. There appears to be a surplus of capacity with most firmsonly operating at two thirds of their potential capacity.
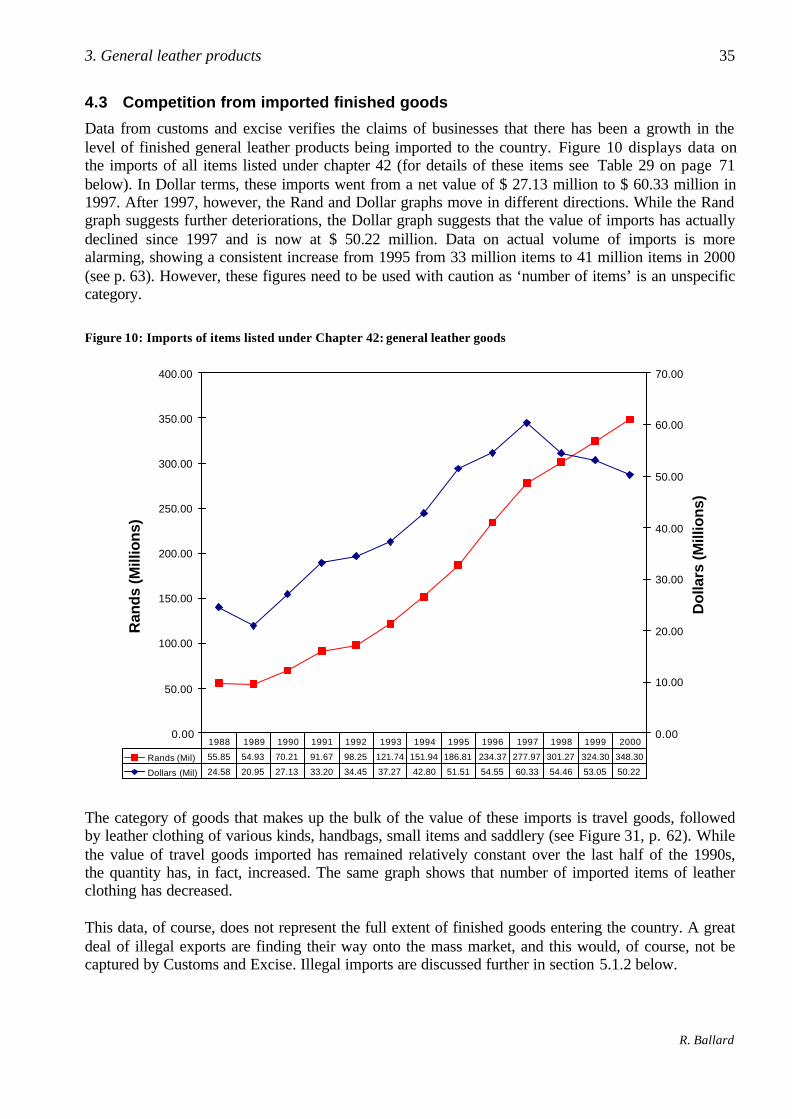
3. General leather products 35
R. Ballard
4.3 Competition from imported finished goods
Data from customs and excise verifies the claims of businesses that there has been a growth in thelevel of finished general leather products being imported to the country. Figure 10 displays data onthe imports of all items listed under chapter 42 (for details of these items see Table 29 on page 71below). In Dollar terms, these imports went from a net value of $ 27.13 million to $ 60.33 million in1997. After 1997, however, the Rand and Dollar graphs move in different directions. While the Randgraph suggests further deteriorations, the Dollar graph suggests that the value of imports has actuallydeclined since 1997 and is now at $ 50.22 million. Data on actual volume of imports is morealarming, showing a consistent increase from 1995 from 33 million items to 41 million items in 2000(see p. 63). However, these figures need to be used with caution as ‘number of items’ is an unspecificcategory.
Figure 10: Imports of items listed under Chapter 42: general leather goods
0.00
50.00
100.00
150.00
200.00
250.00
300.00
350.00
400.00
Ran
ds
(Mill
ion
s)
0.00
10.00
20.00
30.00
40.00
50.00
60.00
70.00
Do
llars
(M
illio
ns)
Rands (Mil) 55.85 54.93 70.21 91.67 98.25 121.74 151.94 186.81 234.37 277.97 301.27 324.30 348.30
Dollars (Mil) 24.58 20.95 27.13 33.20 34.45 37.27 42.80 51.51 54.55 60.33 54.46 53.05 50.22
1988 1989 1990 1991 1992 1993 1994 1995 1996 1997 1998 1999 2000
The category of goods that makes up the bulk of the value of these imports is travel goods, followedby leather clothing of various kinds, handbags, small items and saddlery (see Figure 31, p. 62). Whilethe value of travel goods imported has remained relatively constant over the last half of the 1990s,the quantity has, in fact, increased. The same graph shows that number of imported items of leatherclothing has decreased.
This data, of course, does not represent the full extent of finished goods entering the country. A greatdeal of illegal exports are finding their way onto the mass market, and this would, of course, not becaptured by Customs and Excise. Illegal imports are discussed further in section 5.1.2 below.

36 Bovine Leather Value Chain in SA
CSDS Research Report no. 40
4.3.1 Case StudyIn order to illustrate the issue of cheap imports, it is useful to examine the case study of Proglove CC.This company was established in 1983 in King Williamstown. It manufactures industrial protectivegear such as gloves that are used in industry for handling potentially harmful objects or doingpotentially harmful jobs such as welding. The business has three major operations split across twosites. At one site, low grade wet blues and sheepskins are re-tanned in preparation for use inprotective clothing. At the other site, this leather is stamped (cut) into the component shapes. In thethird stage, these components are then sewn together. At the first site, 106 people are employed while280 are employed in the cutting and stitching operation. The overwhelming majority are women.
Industrial protective clothing used to be a significant business in South Africa. The owners ofProglove estimate that a decade ago there were seven to eight manufactures employing 2000 to 2500people. Now, however, there is only one other manufacturer and less than 500 employees altogether.The reason for this, according to Proglove, is that cheap imports from the Far East have penetratedthe market. Manufacturers have been replaced with around 15 formal importers and an unknownnumber of non-established importers of industrial protective clothing. These importers employaround 80 people in comparison to the 2000 jobs lost in this sub-sector.
At present around 4 million pairs of industrial gloves are sold in South Africa a year, of whichProglove produces a quarter. Most of the remainder is supplied by cheap imports. The distributionagents that Proglove relies on for marketing are increasingly using imported gloves. This year,Proglove lost the contract to supply Iscor to imported gloves. One of the main reasons why theseimports are able to undercut Proglove is because they are of inferior quality. While Proglove isendorsed by SABS and makes durable gloves to high standards, imported gloves are not durable. Forexample, some are made from the middle split, which is the useless sandwich in between the grainsplit and the flesh split of the hides. Generally samples and first deliveries from importers are good,as a way of securing orders, but then deteriorate rapidly in quality.
Proglove also believes that manufacturers in China, India, Malasia, Singapore, Pakistan and the WestIndies are able to undercut South African producers as they are subsidised or protected, and thatmuch of the imported goods are ‘dumped’. Proglove says it would love nothing better than healthycompetition from abroad, but ‘we’re not competing against other manufacturers, we are competingagainst the governments of countries that protect those manufacturers.’ They believe that they wouldbe competitive were there to be level playing fields.
Aside from the problem of legal imports being cheaper than local products despite having paid 20%import tax, there are also many illegal imports that slip past customs controls and therefore do nothave to pay tax. Many goods are being smuggled in through corruption and loopholes in the customsand excise system.
In the face of this competition, Proglove has lodged an application for a 30% import surcharge on topof the existing 20% import tariff. Until 1994 there was a 25% surcharge but this was scrapped underthe new government. Proglove argues that if the surcharge were in place, it could guarantee increasedemployment. If there were only a 20% surcharge, they could guarantee 120 manufacturing jobswithin a year, thereby re-employing those who had been retrenched in recent years. A highersurcharge might actually allow a growth in the sector. It is a very cheap sector in which to createunskilled jobs, and one R12,000 sewing machines can create 2.7 jobs. Proglove also argues that withincreasing volume of production, the cost of overheads per glove would come down and therefore it

3. General leather products 37
R. Ballard
might be able to start competing on price with its foreign competition and could go into exports. Itbelieves that its best export opportunities are in sub-Saharan Africa.
4.4 Raw material supply
As Table 14 (above) suggests, raw material supply presents a formidable problem for smallcompanies. Some small companies feel that they are not valued as clients of tanneries who are moreinterested in bigger clients. One company in Cape Town employing 20 employees complained thatMossop Western – the major non-automotive tannery – would not even look at them as a customer.The company believed that larger footwear manufacturers and more recently automotive needs werebeing prioritised above those of small companies. Very often when the company requests supply bysending in samples of leather previously bought from the tannery, they are told that it is not availableat present. At one stage around 1996, the company was not supplied with leather for an entire season.
Furthermore, when the tannery is willing to supply, it requires the customer to buy very largequantities which means that the company cannot afford to buy stock of a large variety of leathers.Although importing raw materials is an alternative, this avenue has the same problems in that thefirm would have to buy whole container-loads of leather when they might only have needed a smallquantity.
Aside from the intermittent availability of local leather, it is also not always of good quality.Manufacturers did not feel that South African leather was not low grade in general, just that theautomotive sector was able to monopolise the best grades thereby leaving the poorer qualities forother types of manufacturers. As was explained in section 3, the MIDP incentivises the use of localleather in automotive upholstery manufacture.
Imported raw material: In Table 15 (above), two firms stated that one of their business strategieswas to import more of their raw materials. To quote one respondent explaining their business strategy‘We have moved more and more upmarket using better quality leather obtainable only fromoverseas.’ In this case, the choice to switch to imported leather was driven by the poor quality of theavailable local leather.
In the survey, respondents were asked what proportion of raw leather inputs were imported. Elevenof the firms did not import any raw material. Those that did import, imported between 5 and 100% oftheir inputs, averaging at 49.9 %. If the eleven non-importers are included in this figure, generalleather products manufactures import 28.8% of their raw materials.
Asked whether the proportion of imported raw material import has increased, decreased or stayed thesame, the majority (including those that do not import) stated that they import no more or less thanthey did five years ago. Eight firms stated that they now imported more while two indicated that theyimported less.
Table 21: Has the proportion of imported raw material changed over the last five years?
Number PercentageIncreased 8 30.8 %Decreased 2 7.7 %Stagnant 16 61.5 %
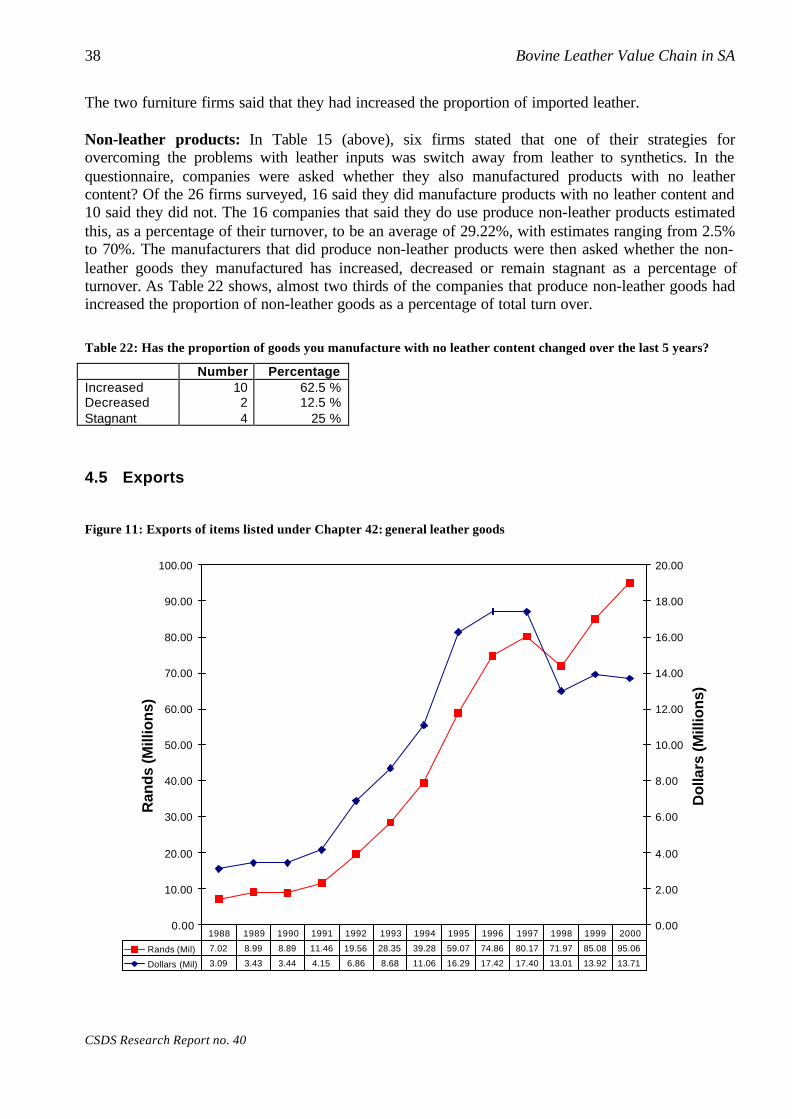
38 Bovine Leather Value Chain in SA
CSDS Research Report no. 40
The two furniture firms said that they had increased the proportion of imported leather.
Non-leather products: In Table 15 (above), six firms stated that one of their strategies forovercoming the problems with leather inputs was switch away from leather to synthetics. In thequestionnaire, companies were asked whether they also manufactured products with no leathercontent? Of the 26 firms surveyed, 16 said they did manufacture products with no leather content and10 said they did not. The 16 companies that said they do use produce non-leather products estimatedthis, as a percentage of their turnover, to be an average of 29.22%, with estimates ranging from 2.5%to 70%. The manufacturers that did produce non-leather products were then asked whether the non-leather goods they manufactured has increased, decreased or remain stagnant as a percentage ofturnover. As Table 22 shows, almost two thirds of the companies that produce non-leather goods hadincreased the proportion of non-leather goods as a percentage of total turn over.
Table 22: Has the proportion of goods you manufacture with no leather content changed over the last 5 years?
Number PercentageIncreased 10 62.5 %Decreased 2 12.5 %Stagnant 4 25 %
4.5 Exports
Figure 11: Exports of items listed under Chapter 42: general leather goods
0.00
10.00
20.00
30.00
40.00
50.00
60.00
70.00
80.00
90.00
100.00
Ran
ds
(Mill
ion
s)
0.00
2.00
4.00
6.00
8.00
10.00
12.00
14.00
16.00
18.00
20.00
Do
llars
(M
illio
ns)
Rands (Mil) 7.02 8.99 8.89 11.46 19.56 28.35 39.28 59.07 74.86 80.17 71.97 85.08 95.06
Dollars (Mil) 3.09 3.43 3.44 4.15 6.86 8.68 11.06 16.29 17.42 17.40 13.01 13.92 13.71
1988 1989 1990 1991 1992 1993 1994 1995 1996 1997 1998 1999 2000
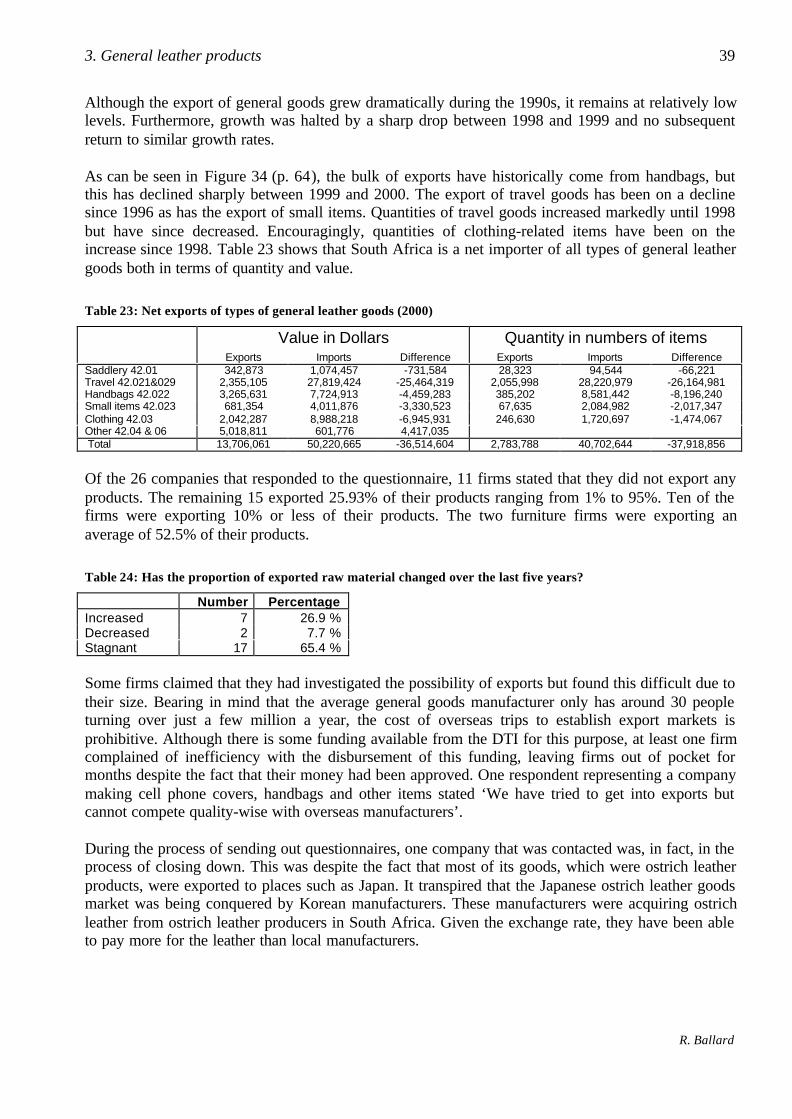
3. General leather products 39
R. Ballard
Although the export of general goods grew dramatically during the 1990s, it remains at relatively lowlevels. Furthermore, growth was halted by a sharp drop between 1998 and 1999 and no subsequentreturn to similar growth rates.
As can be seen in Figure 34 (p. 64), the bulk of exports have historically come from handbags, butthis has declined sharply between 1999 and 2000. The export of travel goods has been on a declinesince 1996 as has the export of small items. Quantities of travel goods increased markedly until 1998but have since decreased. Encouragingly, quantities of clothing-related items have been on theincrease since 1998. Table 23 shows that South Africa is a net importer of all types of general leathergoods both in terms of quantity and value.
Table 23: Net exports of types of general leather goods (2000)
Value in Dollars Quantity in numbers of itemsExports Imports Difference Exports Imports Difference
Saddlery 42.01 342,873 1,074,457 -731,584 28,323 94,544 -66,221Travel 42.021&029 2,355,105 27,819,424 -25,464,319 2,055,998 28,220,979 -26,164,981Handbags 42.022 3,265,631 7,724,913 -4,459,283 385,202 8,581,442 -8,196,240Small items 42.023 681,354 4,011,876 -3,330,523 67,635 2,084,982 -2,017,347Clothing 42.03 2,042,287 8,988,218 -6,945,931 246,630 1,720,697 -1,474,067Other 42.04 & 06 5,018,811 601,776 4,417,035 Total 13,706,061 50,220,665 -36,514,604 2,783,788 40,702,644 -37,918,856
Of the 26 companies that responded to the questionnaire, 11 firms stated that they did not export anyproducts. The remaining 15 exported 25.93% of their products ranging from 1% to 95%. Ten of thefirms were exporting 10% or less of their products. The two furniture firms were exporting anaverage of 52.5% of their products.
Table 24: Has the proportion of exported raw material changed over the last five years?
Number PercentageIncreased 7 26.9 %Decreased 2 7.7 %Stagnant 17 65.4 %
Some firms claimed that they had investigated the possibility of exports but found this difficult due totheir size. Bearing in mind that the average general goods manufacturer only has around 30 peopleturning over just a few million a year, the cost of overseas trips to establish export markets isprohibitive. Although there is some funding available from the DTI for this purpose, at least one firmcomplained of inefficiency with the disbursement of this funding, leaving firms out of pocket formonths despite the fact that their money had been approved. One respondent representing a companymaking cell phone covers, handbags and other items stated ‘We have tried to get into exports butcannot compete quality-wise with overseas manufacturers’.
During the process of sending out questionnaires, one company that was contacted was, in fact, in theprocess of closing down. This was despite the fact that most of its goods, which were ostrich leatherproducts, were exported to places such as Japan. It transpired that the Japanese ostrich leather goodsmarket was being conquered by Korean manufacturers. These manufacturers were acquiring ostrichleather from ostrich leather producers in South Africa. Given the exchange rate, they have been ableto pay more for the leather than local manufacturers.
40 Bovine Leather Value Chain in SA
CSDS Research Report no. 40
4.6 Summary of key issues
• Domestic focus: Unlike the automotive industry, the general leather goods sector isdependent almost exclusively on the domestic market.
• Domestic market conquered by cheap imports: Cheap imports (legal, dumped andsmuggled) have penetrated the South African market for general leather goods thus displacingdomestic manufacturers.
• Declining employment: Due to the loss of business for firms, the number of firms andemployees has decreased.
• Raw material supply: The cost, quality and availability of leather inputs is a major inhibitorto the competitiveness of general goods manufacturers. This has resulted in growing use ofimported leather and synthetic inputs.
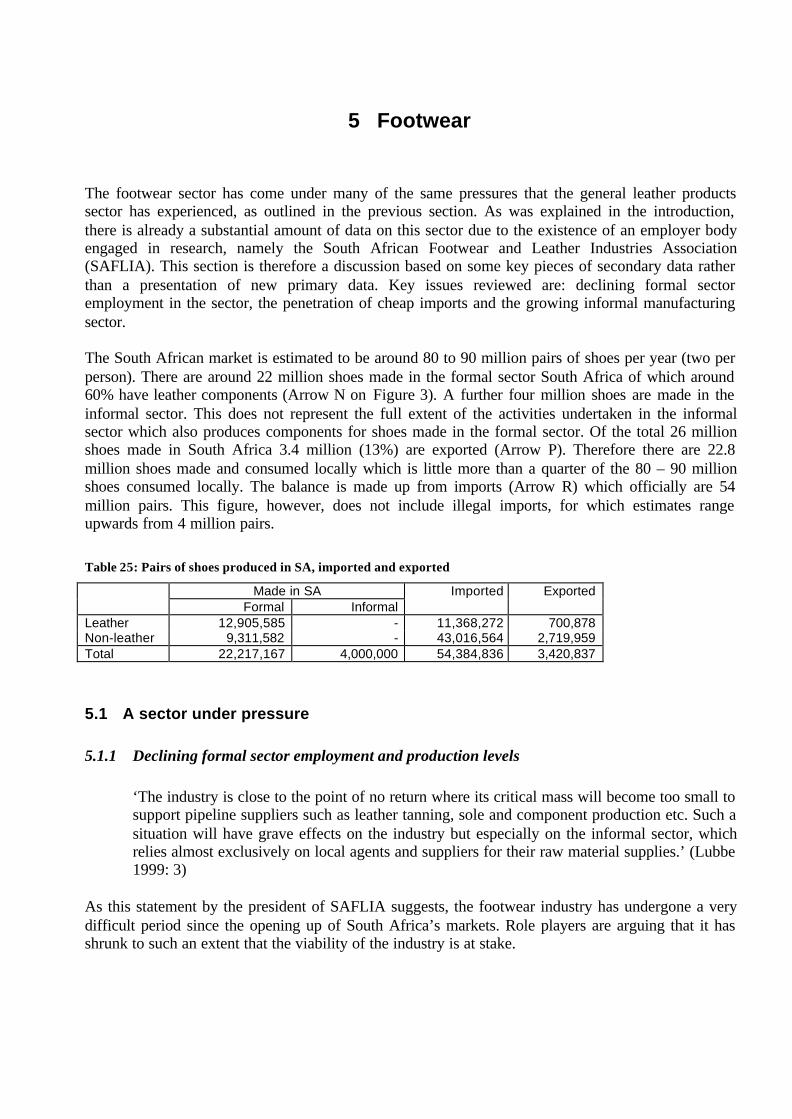
5 Footwear
The footwear sector has come under many of the same pressures that the general leather productssector has experienced, as outlined in the previous section. As was explained in the introduction,there is already a substantial amount of data on this sector due to the existence of an employer bodyengaged in research, namely the South African Footwear and Leather Industries Association(SAFLIA). This section is therefore a discussion based on some key pieces of secondary data ratherthan a presentation of new primary data. Key issues reviewed are: declining formal sectoremployment in the sector, the penetration of cheap imports and the growing informal manufacturingsector.
The South African market is estimated to be around 80 to 90 million pairs of shoes per year (two perperson). There are around 22 million shoes made in the formal sector South Africa of which around60% have leather components (Arrow N on Figure 3). A further four million shoes are made in theinformal sector. This does not represent the full extent of the activities undertaken in the informalsector which also produces components for shoes made in the formal sector. Of the total 26 millionshoes made in South Africa 3.4 million (13%) are exported (Arrow P). Therefore there are 22.8million shoes made and consumed locally which is little more than a quarter of the 80 – 90 millionshoes consumed locally. The balance is made up from imports (Arrow R) which officially are 54million pairs. This figure, however, does not include illegal imports, for which estimates rangeupwards from 4 million pairs.
Table 25: Pairs of shoes produced in SA, imported and exported
Made in SA Imported ExportedFormal Informal
Leather 12,905,585 - 11,368,272 700,878Non-leather 9,311,582 - 43,016,564 2,719,959Total 22,217,167 4,000,000 54,384,836 3,420,837
5.1 A sector under pressure
5.1.1 Declining formal sector employment and production levels
‘The industry is close to the point of no return where its critical mass will become too small tosupport pipeline suppliers such as leather tanning, sole and component production etc. Such asituation will have grave effects on the industry but especially on the informal sector, whichrelies almost exclusively on local agents and suppliers for their raw material supplies.’ (Lubbe1999: 3)
As this statement by the president of SAFLIA suggests, the footwear industry has undergone a verydifficult period since the opening up of South Africa’s markets. Role players are arguing that it hasshrunk to such an extent that the viability of the industry is at stake.
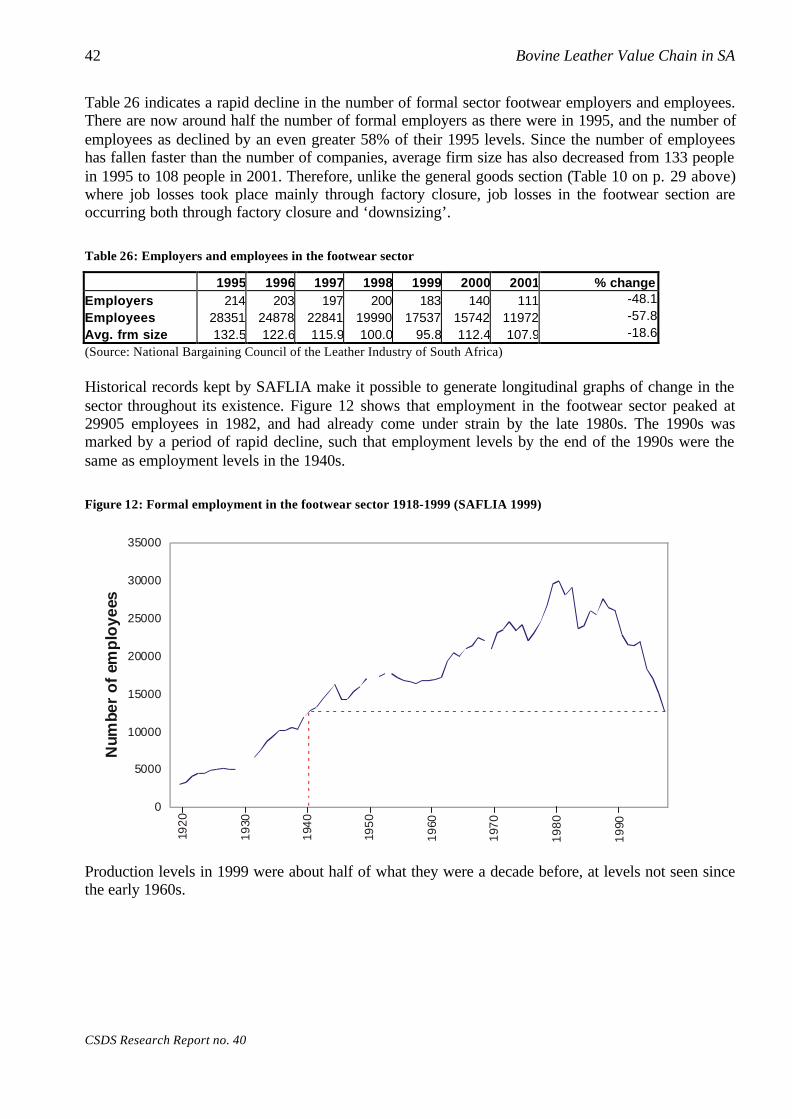
42 Bovine Leather Value Chain in SA
CSDS Research Report no. 40
Table 26 indicates a rapid decline in the number of formal sector footwear employers and employees.There are now around half the number of formal employers as there were in 1995, and the number ofemployees as declined by an even greater 58% of their 1995 levels. Since the number of employeeshas fallen faster than the number of companies, average firm size has also decreased from 133 peoplein 1995 to 108 people in 2001. Therefore, unlike the general goods section (Table 10 on p. 29 above)where job losses took place mainly through factory closure, job losses in the footwear section areoccurring both through factory closure and ‘downsizing’.
Table 26: Employers and employees in the footwear sector
1995 1996 1997 1998 1999 2000 2001 % changeEmployers 214 203 197 200 183 140 111 -48.1
Employees 28351 24878 22841 19990 17537 15742 11972 -57.8
Avg. frm size 132.5 122.6 115.9 100.0 95.8 112.4 107.9 -18.6
(Source: National Bargaining Council of the Leather Industry of South Africa)
Historical records kept by SAFLIA make it possible to generate longitudinal graphs of change in thesector throughout its existence. Figure 12 shows that employment in the footwear sector peaked at29905 employees in 1982, and had already come under strain by the late 1980s. The 1990s wasmarked by a period of rapid decline, such that employment levels by the end of the 1990s were thesame as employment levels in the 1940s.
Figure 12: Formal employment in the footwear sector 1918-1999 (SAFLIA 1999)
0
5000
10000
15000
20000
25000
30000
35000
20 30 40 50 60 70 80 90
Num
ber
of
emp
loye
es
192
0
19
30
194
0
195
0
19
60
197
0
19
80
19
90
Production levels in 1999 were about half of what they were a decade before, at levels not seen sincethe early 1960s.

5. Footwear 43
R. Ballard
Figure 13: Pairs produced from 1918-1999 (SAFLIA 1999)
0
10000
20000
30000
40000
50000
60000
70000
20 30 40 50 60 70 80 90
Pai
rs(T
ho
usa
nd
s)
19
20
193
0
194
0
195
0
19
60
197
0
19
80
19
90
Statistics on regional change show that declines in formal employment levels have not been evenlydistributed. KwaZulu-Natal has declined by 59.6% of its 1990 level, followed by the Eastern Cape at49.8%, the Western Cape at 37.7% and the Northern Area at 17.2%.
Figure 14: Changing employment per region over time (SAFLIA 1999)
0
2000
4000
6000
8000
10000
12000
14000
16000
18000
Num
ber
of e
mpl
oyee
s
KZN 15452 15405 13388 12888 12395 12364 9898 8849 7170 6238
Western Cape 6078 5932 5611 5168 5329 5783 5405 5185 4668 3664
Eastern Cape 4049 3868 3041 2768 2877 3054 2557 2365 2468 2034
Northern area 773 780 766 699 703 698 396 593 678 640
1990 1991 1992 1993 1994 1995 1996 1997 1998 1999
Production in KZN declined by 42.6% of its 1994 levels, followed closely by the Western Cape at41.1%, then the Eastern Cape at 25.1% and the Northern Area at 28.2%.

44 Bovine Leather Value Chain in SA
CSDS Research Report no. 40
Figure 15: Changing production per region over time (SAFLIA 1999)
0
5000
10000
15000
20000
25000
30000
Pai
rs P
rodu
ced
(Tho
usan
ds)
KZN 28106 26122 22704 22721 17874 16127
Western Cape 10287 10933 9220 9188 7644 6060
Eastern Cape 3849 4479 3470 3587 3466 2884
Northern Area 1049 1127 1044 968 885 753
1994 1995 1996 1997 1998 1999
It is important to realise that these statistics are, in fact, incomplete as they only capture formal sectoremployment. There has been a growing informal footwear manufacturing sector employingthousands of people. This issue will be dealt with in section 5.1.3 after an assessment of the primaryreason for the decline in formal sector employment, that is, penetration of cheap imported footwearinto the South African market.
5.1.2 Penetration of imported footwearAs Figure 16 shows, imports of footwear have increased dramatically since the end of the 1980s.However, while the Rand value of imports gives the impression of constant increases, the Dollarvalue shows a decline between 1997 and 1998 followed by a return to increasing value of imports.The result is that the import levels of 2000 are not much more than the import levels of 1997 inDollar terms.
The table on p. 67 shows that, in terms of quantities, imports reached a peak of 66 million pairs in1995, almost doubling from the previous year. They then declined until 1998 back below 1994 levelsand have subsequently increased to 54 million pairs in 2000. Figure 38 shows that these dramaticfluctuations can be attributed to changing levels of imports of non-leather footwear, rather thanleather footwear. At present, leather footwear only accounts for a fifth of the pairs imported and isrelatively constant, while imports of non-leather footwear is increasing rapidly. It should be noted,however, that the relatively few pairs of leather footwear are more valuable per pair and cost at leastdouble non-leather footwear (Figure 39).
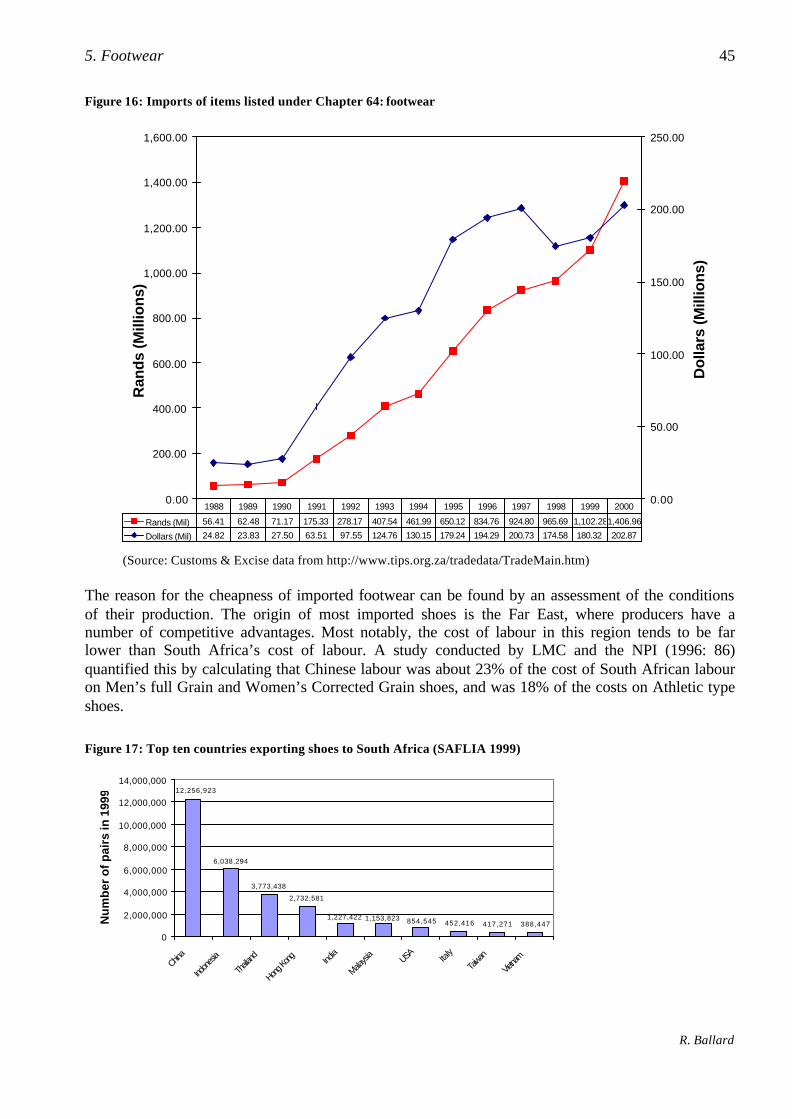
5. Footwear 45
R. Ballard
Figure 16: Imports of items listed under Chapter 64: footwear
0.00
200.00
400.00
600.00
800.00
1,000.00
1,200.00
1,400.00
1,600.00R
and
s (M
illio
ns)
0.00
50.00
100.00
150.00
200.00
250.00
Do
llars
(M
illio
ns)
Rands (Mil) 56.41 62.48 71.17 175.33 278.17 407.54 461.99 650.12 834.76 924.80 965.69 1,102.281,406.96
Dollars (Mil) 24.82 23.83 27.50 63.51 97.55 124.76 130.15 179.24 194.29 200.73 174.58 180.32 202.87
1988 1989 1990 1991 1992 1993 1994 1995 1996 1997 1998 1999 2000
(Source: Customs & Excise data from http://www.tips.org.za/tradedata/TradeMain.htm)
The reason for the cheapness of imported footwear can be found by an assessment of the conditionsof their production. The origin of most imported shoes is the Far East, where producers have anumber of competitive advantages. Most notably, the cost of labour in this region tends to be farlower than South Africa’s cost of labour. A study conducted by LMC and the NPI (1996: 86)quantified this by calculating that Chinese labour was about 23% of the cost of South African labouron Men’s full Grain and Women’s Corrected Grain shoes, and was 18% of the costs on Athletic typeshoes.
Figure 17: Top ten countries exporting shoes to South Africa (SAFLIA 1999)
6,038,294
3,773,438
2,732,581
452,416 417,271 388,447
12,256,923
854,5451,153,8231,227,422
0
2,000,000
4,000,000
6,000,000
8,000,000
10,000,000
12,000,000
14,000,000
China
Indon
esia
Thaila
nd
Hong K
ong
India
Malays
ia USA Italy
Taiwan
Vietna
m
Nu
mb
er o
f p
airs
in 1
999

46 Bovine Leather Value Chain in SA
CSDS Research Report no. 40
In general, environmental and labour standards are lower in cheap footwear manufacturing regions,thereby considerably reducing costs for these manufacturers. Concern has been raised in somestandards as to the safety of leather made in some areas. It is believed that some leather is tannedusing the highly toxic chrome 6 (raw chrome) as opposed to chrome 3 which is the safer tanningagent used in areas with more rigorous standards. Furthermore, industries are protected andsubsidised in various ways by the governments of major footwear exporting countries.
Various players in the South African industry believe that goods brought into South Africa areunfairly priced and are therefore classifiable as ‘dumped’ goods in terms of the GATT agreements. Aprice would be deemed unfair if it were below the cost of the inputs needed to make that good, or if itwere being sold at below the cost for which it would sell the same good in other markets. The sellingcountry is able to sell at below cost as it is either offloading ‘surplus’ goods or strategicallyattempting to take over and dominate a market. Although it sells at a loss into the target market, thepredatory firms or countries will be rewarded once the indigenous competition is dead and they canraise their prices.
Foreign goods are sometimes unfairly priced due to their origin as over-runs of production. Forexample, a Far Eastern manufacturer may make several million pairs of a shoe for a US buyer. Ifmanufacturer makes too many shoes for the buyer’s needs, they then have a surplus which has to besold off. Not only has this manufacturer had a significant economy of sale, but the surplus footwear islikely to be sold for even lower amounts as the manufacturer has already paid for the cost of theproduction with the sale to the original buyer.
SAFLIA has raised concern about the way in which imports from the Far East are no longer markedwith ‘country of origin’ labels (Linde 1999: 21). This makes it difficult not only for member of thepublic to determine the origin of the products they are considering buying, but also makes it difficultto undertake anti-dumping action.
Aside from dumping, there is also the problem of illegal goods smuggled into the country which arenot charged the 30% footwear import tariff by Customs and Excise. According to one estimate,illegal imports may exceed 18 million pairs. SAFLIA has, at times, paid for forensic investigators toassist Customs and Excise with detecting and stopping such goods. These goods get through due to avariety of reasons: lack of capacity at Customs and Excise, lack of training, lack of personnel, andcorruption. According to LMC and the NPI (1996: 234), illegal imports are a legacy from apartheidera sanctions busting.
Ironically, some of the biggest importers into South Africa are, in fact, the major footwearmanufacturers. Therefore interests are somewhat ‘blurry’ since manufacturers are no longernecessarily committed to manufacturing jobs in South Africa as they can still retail footwear withouthaving to manufacture it.
A number of people identified the potential role of a consumer education campaign in order topromote South Africa shoes, in terms of quality, standards of labour during production, and domesticjob creation. There is a misconception that South African goods are not good quality whereas thereality is that they are often superior to the imported goods. Many people do not know that thebranded shoes they purchase are in fact already made in South Africa. In order for such a campaignto work, it would be necessary to have ‘country of origin’ labels.
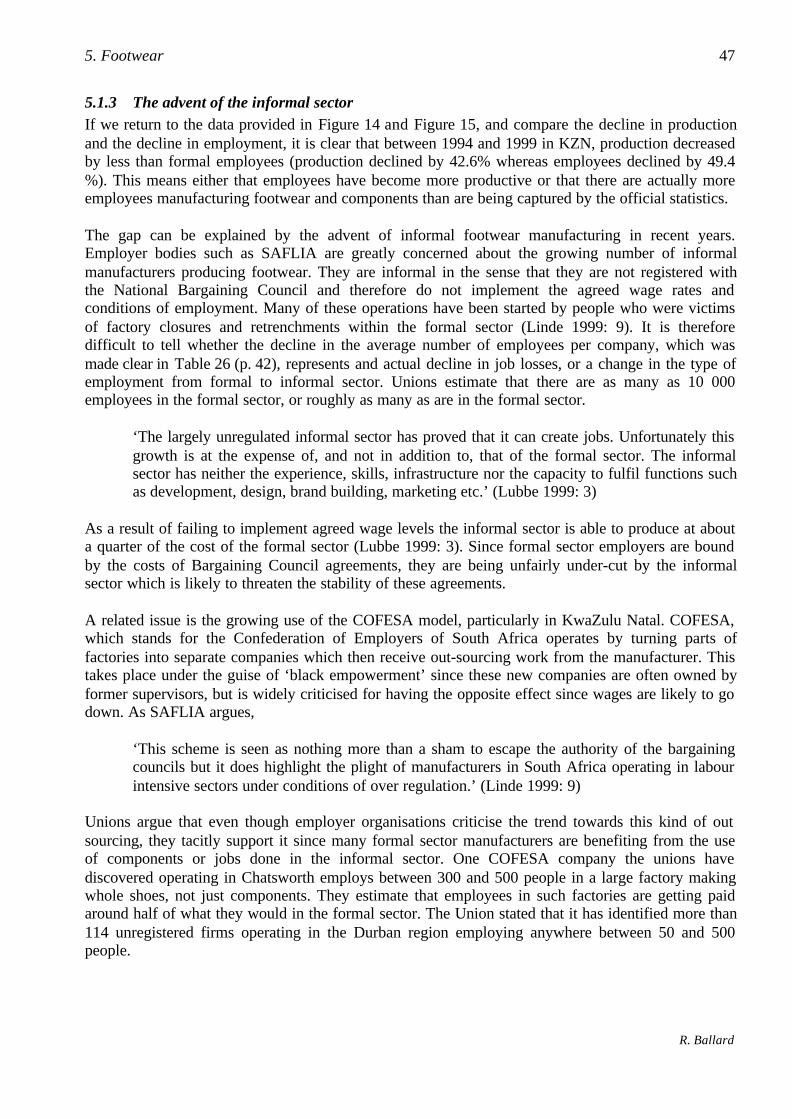
5. Footwear 47
R. Ballard
5.1.3 The advent of the informal sectorIf we return to the data provided in Figure 14 and Figure 15, and compare the decline in productionand the decline in employment, it is clear that between 1994 and 1999 in KZN, production decreasedby less than formal employees (production declined by 42.6% whereas employees declined by 49.4%). This means either that employees have become more productive or that there are actually moreemployees manufacturing footwear and components than are being captured by the official statistics.
The gap can be explained by the advent of informal footwear manufacturing in recent years.Employer bodies such as SAFLIA are greatly concerned about the growing number of informalmanufacturers producing footwear. They are informal in the sense that they are not registered withthe National Bargaining Council and therefore do not implement the agreed wage rates andconditions of employment. Many of these operations have been started by people who were victimsof factory closures and retrenchments within the formal sector (Linde 1999: 9). It is thereforedifficult to tell whether the decline in the average number of employees per company, which wasmade clear in Table 26 (p. 42), represents and actual decline in job losses, or a change in the type ofemployment from formal to informal sector. Unions estimate that there are as many as 10 000employees in the formal sector, or roughly as many as are in the formal sector.
‘The largely unregulated informal sector has proved that it can create jobs. Unfortunately thisgrowth is at the expense of, and not in addition to, that of the formal sector. The informalsector has neither the experience, skills, infrastructure nor the capacity to fulfil functions suchas development, design, brand building, marketing etc.’ (Lubbe 1999: 3)
As a result of failing to implement agreed wage levels the informal sector is able to produce at abouta quarter of the cost of the formal sector (Lubbe 1999: 3). Since formal sector employers are boundby the costs of Bargaining Council agreements, they are being unfairly under-cut by the informalsector which is likely to threaten the stability of these agreements.
A related issue is the growing use of the COFESA model, particularly in KwaZulu Natal. COFESA,which stands for the Confederation of Employers of South Africa operates by turning parts offactories into separate companies which then receive out-sourcing work from the manufacturer. Thistakes place under the guise of ‘black empowerment’ since these new companies are often owned byformer supervisors, but is widely criticised for having the opposite effect since wages are likely to godown. As SAFLIA argues,
‘This scheme is seen as nothing more than a sham to escape the authority of the bargainingcouncils but it does highlight the plight of manufacturers in South Africa operating in labourintensive sectors under conditions of over regulation.’ (Linde 1999: 9)
Unions argue that even though employer organisations criticise the trend towards this kind of outsourcing, they tacitly support it since many formal sector manufacturers are benefiting from the useof components or jobs done in the informal sector. One COFESA company the unions havediscovered operating in Chatsworth employs between 300 and 500 people in a large factory makingwhole shoes, not just components. They estimate that employees in such factories are getting paidaround half of what they would in the formal sector. The Union stated that it has identified more than114 unregistered firms operating in the Durban region employing anywhere between 50 and 500people.
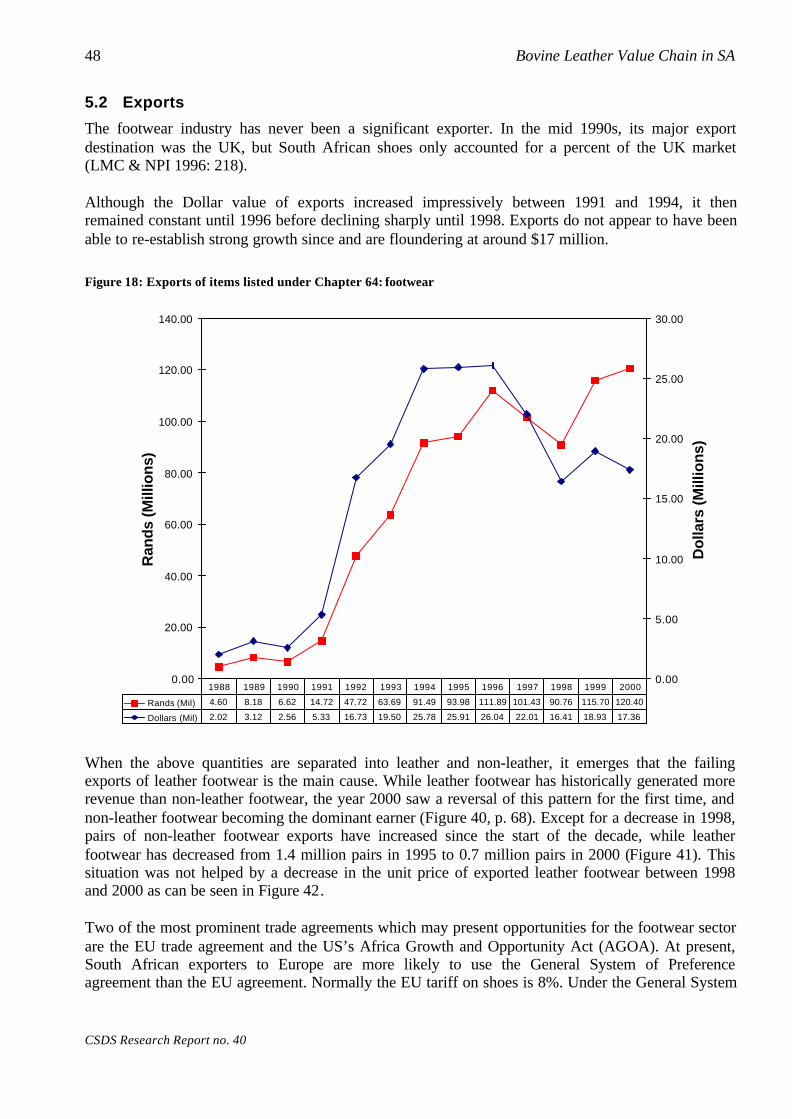
48 Bovine Leather Value Chain in SA
CSDS Research Report no. 40
5.2 Exports
The footwear industry has never been a significant exporter. In the mid 1990s, its major exportdestination was the UK, but South African shoes only accounted for a percent of the UK market(LMC & NPI 1996: 218).
Although the Dollar value of exports increased impressively between 1991 and 1994, it thenremained constant until 1996 before declining sharply until 1998. Exports do not appear to have beenable to re-establish strong growth since and are floundering at around $17 million.
Figure 18: Exports of items listed under Chapter 64: footwear
0.00
20.00
40.00
60.00
80.00
100.00
120.00
140.00
Ran
ds
(Mill
ion
s)
0.00
5.00
10.00
15.00
20.00
25.00
30.00
Do
llars
(M
illio
ns)
Rands (Mil) 4.60 8.18 6.62 14.72 47.72 63.69 91.49 93.98 111.89 101.43 90.76 115.70 120.40
Dollars (Mil) 2.02 3.12 2.56 5.33 16.73 19.50 25.78 25.91 26.04 22.01 16.41 18.93 17.36
1988 1989 1990 1991 1992 1993 1994 1995 1996 1997 1998 1999 2000
When the above quantities are separated into leather and non-leather, it emerges that the failingexports of leather footwear is the main cause. While leather footwear has historically generated morerevenue than non-leather footwear, the year 2000 saw a reversal of this pattern for the first time, andnon-leather footwear becoming the dominant earner (Figure 40, p. 68). Except for a decrease in 1998,pairs of non-leather footwear exports have increased since the start of the decade, while leatherfootwear has decreased from 1.4 million pairs in 1995 to 0.7 million pairs in 2000 (Figure 41). Thissituation was not helped by a decrease in the unit price of exported leather footwear between 1998and 2000 as can be seen in Figure 42.
Two of the most prominent trade agreements which may present opportunities for the footwear sectorare the EU trade agreement and the US’s Africa Growth and Opportunity Act (AGOA). At present,South African exporters to Europe are more likely to use the General System of Preferenceagreement than the EU agreement. Normally the EU tariff on shoes is 8%. Under the General System
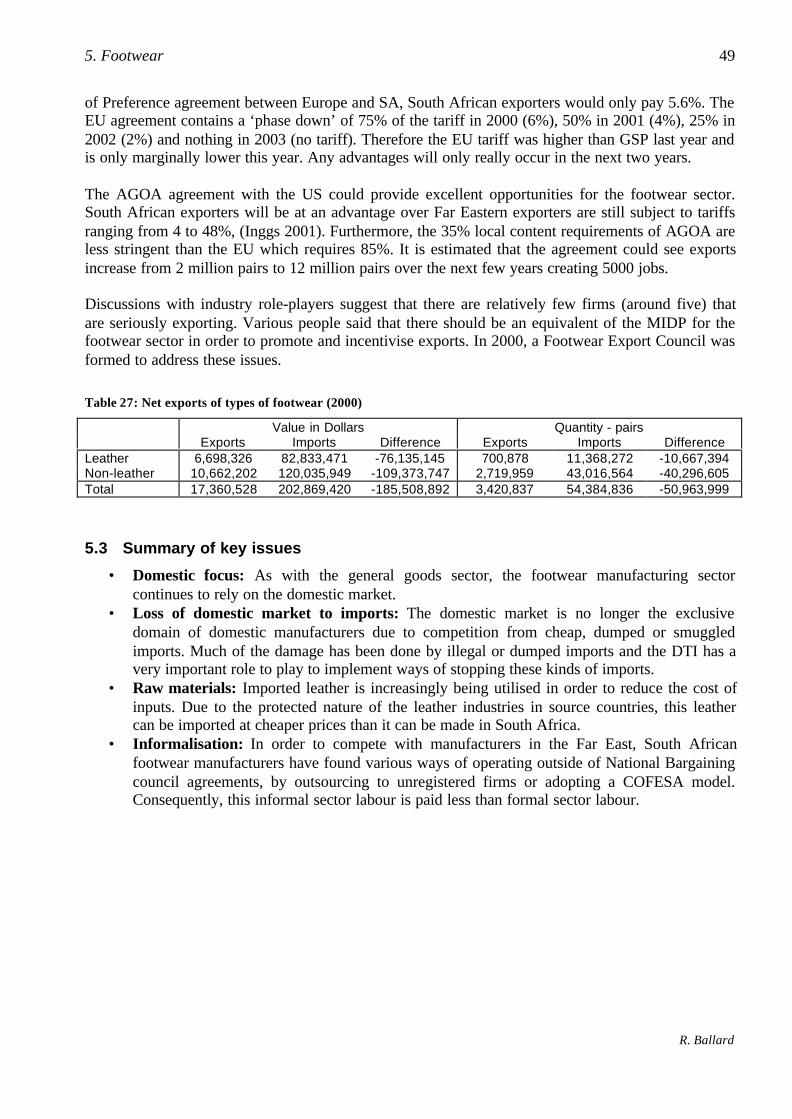
5. Footwear 49
R. Ballard
of Preference agreement between Europe and SA, South African exporters would only pay 5.6%. TheEU agreement contains a ‘phase down’ of 75% of the tariff in 2000 (6%), 50% in 2001 (4%), 25% in2002 (2%) and nothing in 2003 (no tariff). Therefore the EU tariff was higher than GSP last year andis only marginally lower this year. Any advantages will only really occur in the next two years.
The AGOA agreement with the US could provide excellent opportunities for the footwear sector.South African exporters will be at an advantage over Far Eastern exporters are still subject to tariffsranging from 4 to 48%, (Inggs 2001). Furthermore, the 35% local content requirements of AGOA areless stringent than the EU which requires 85%. It is estimated that the agreement could see exportsincrease from 2 million pairs to 12 million pairs over the next few years creating 5000 jobs.
Discussions with industry role-players suggest that there are relatively few firms (around five) thatare seriously exporting. Various people said that there should be an equivalent of the MIDP for thefootwear sector in order to promote and incentivise exports. In 2000, a Footwear Export Council wasformed to address these issues.
Table 27: Net exports of types of footwear (2000)
Value in Dollars Quantity - pairsExports Imports Difference Exports Imports Difference
Leather 6,698,326 82,833,471 -76,135,145 700,878 11,368,272 -10,667,394Non-leather 10,662,202 120,035,949 -109,373,747 2,719,959 43,016,564 -40,296,605Total 17,360,528 202,869,420 -185,508,892 3,420,837 54,384,836 -50,963,999
5.3 Summary of key issues
• Domestic focus: As with the general goods sector, the footwear manufacturing sectorcontinues to rely on the domestic market.
• Loss of domestic market to imports: The domestic market is no longer the exclusivedomain of domestic manufacturers due to competition from cheap, dumped or smuggledimports. Much of the damage has been done by illegal or dumped imports and the DTI has avery important role to play to implement ways of stopping these kinds of imports.
• Raw materials: Imported leather is increasingly being utilised in order to reduce the cost ofinputs. Due to the protected nature of the leather industries in source countries, this leathercan be imported at cheaper prices than it can be made in South Africa.
• Informalisation: In order to compete with manufacturers in the Far East, South Africanfootwear manufacturers have found various ways of operating outside of National Bargainingcouncil agreements, by outsourcing to unregistered firms or adopting a COFESA model.Consequently, this informal sector labour is paid less than formal sector labour.
6 Summary and Policy Considerations
The leather industry in South Africa has been fundamentally transformed through South Africa’stransition from a relatively closed and protected economy to an open market. In the past it wasdependent on the sale of finished goods such as footwear and general goods in the domestic market.Since economic liberalisation, however, the large parts of the domestic market have been lost tocheap imports especially from the Far East. As a result we see declining formal sector employment infootwear and general goods and an increasing use of informal labour in an attempt to compete withthese cheap goods.
Despite the decline of traditional leather manufacturing industries, the tanning sector has thrived overthe same period. The reason for this is the arrival of the automotive upholstery sector which exportsleather car seats, predominantly to Europe.
Those sub-sectors of the leather industry that have succeeded have in common their export focus.This includes not only the upholstery sector, which exports almost everything it makes, but alsoincludes up-stream exports of ostrich leather, wet blues and even raw hides. The automotive sector isan undeniable ‘success story’ of growing employment in a well paid, high tech sector where most ofthe inputs and value adding take place within South Africa. It is all the more successful due to theinfusion of technology through Foreign Direct Investment and the growing competitiveness of firmsinvolved in this commodity chain.
Those sub-sectors that have declined have the common characteristic of an inward orientation –attempting to continue selling to their traditional domestic market. The rapid tariff phase downexposed the uncompetitive-ness of the footwear and general goods sectors. It forced these industriesto confront the same pressures which had characterised international footwear and general goodsmanufacture for some time. As the data presented here has shown, these pressures resulted in thepainful loss of tens of thousands of formal sector jobs.
The case of the footwear and general goods sector exposes a fundamental problem with internationalcompetition, which is that minimum acceptable standards of one country are not the same as those ofanother. It is very difficult for a country with a well paid workforce and stringent environmental lawsto compete with a country that has a low paid workforce and lax environmental standards. Forexample, China’s aggressive entry into the global market is said to be reducing labour standardselsewhere (Harrison et al 1997: 10).
One of the effects of globalisation is that poorer countries have become engaged in a ‘race to thebottom’ in that they compete by lowering standards. Cheap labour has become a commodity, the‘competitive advantage’ of the poor nations. South Africa, according to Fryer & Newham (2000) iscaught in a ‘nexus of bewilderment’ pulled between the left’s insistence on the need for protectionand the right’s demands for a laissez faire state.
High standards of employment are unsustainable in the face of competition from producers with lowstandards of employment competing for the same market. The emergence of COFESA and variousmodes of ‘informal employment’ are simply the lowering of employment standards as an adaptationto this competition. This trend exemplifies experience in other developing countries that the objectiveof high labour standards are unrealistic as they require complex legislation which is difficult to

6. Summary and Policy Considerations 51
R. Ballard
enforce and police (Fryer & Newham 2000: 16). The 2001 wage negotiations at the NationalBargaining Council of the Leather Industry demonstrate precisely this point, with employerrepresentatives calling for a return to firm level negotiation and the removal of blanket agreementsother than basic conditions of employment.
Protecting the domestic marketMany role players have called for greater protection of the domestic market. An analysis of theprotection levels, however, suggests that they are in fact fairly high in themselves and within theparameters set by the GATT agreements which the government has adopted. The government’sobjective, within the 1996 Tariff Rationalisation Process, was to achieve 30% of tariffs on finishedgoods, 20% on intermediate goods and 10% on primary goods (Holden and Casale 2000: 3).Mechanisms such as anti-dumping duties are seen as preferable to an increase in the tariff rate.Encouragingly for firms, 69% of the 57 applications to increase duty in 1998 and 78.6 % of the 30applications for anti-dumping duties in 1997 were approved by the Board of Trade and Tariffs(Holden and Casale 2000: 7). The proportion of supported applications has risen during the 1990s forboth categories. Holden and Casale (2000: 20) identified employment being one of the mostimportant considerations favoured by the Board.
No matter how high tariff levels are, however, they are immaterial in the face of illegal imports. Themillions pairs of footwear entering the country without the 30% import duty continue to damage anypotential for domestic manufacturers to enjoy access to the domestic market. This has beenacknowledged by the DTI as a key priority and this report can only reaffirm the importance of swiftand effective action in this regard.
Developing an export focusThe key to future growth in the footwear and general goods sectors, however, will not be through thedomestic market but exports. While these sectors have not previously succeeded in exports, the EUand AGOA agreements currently coming into effect may provide the appropriate window ofopportunity. Through a close relationship with significant buyers in the US and Europe, the footwearand general goods sectors have a better chance of embarking on the ‘steep learning curve’ which willlead to greater competitiveness and productivity.
6.1 Further research topics on the leather industry in SA
As a preliminary piece of research, this report can identify a number of areas for further research:
• Survey of protection of the leather industry by various governments around the world in orderto see whether South Africa’s protection is in line with other countries.
• The positive and negative impacts of a charge placed on exporting raw and semi-processedhides including by-products from automotive tanning (i.e. splits).
• Potential for education campaigns directed at farmers and those who are responsible forflaying and temporarily preserving hides in order to improve the quality of hides.
• Potential for co-operative procurement of raw material (raw and semi-processed hides andimported leather).
• The manufacturing productivity of various sectors (the gap between SA firms and world classmanufacturing).
• Informalisation within the industry.• Export promotion.
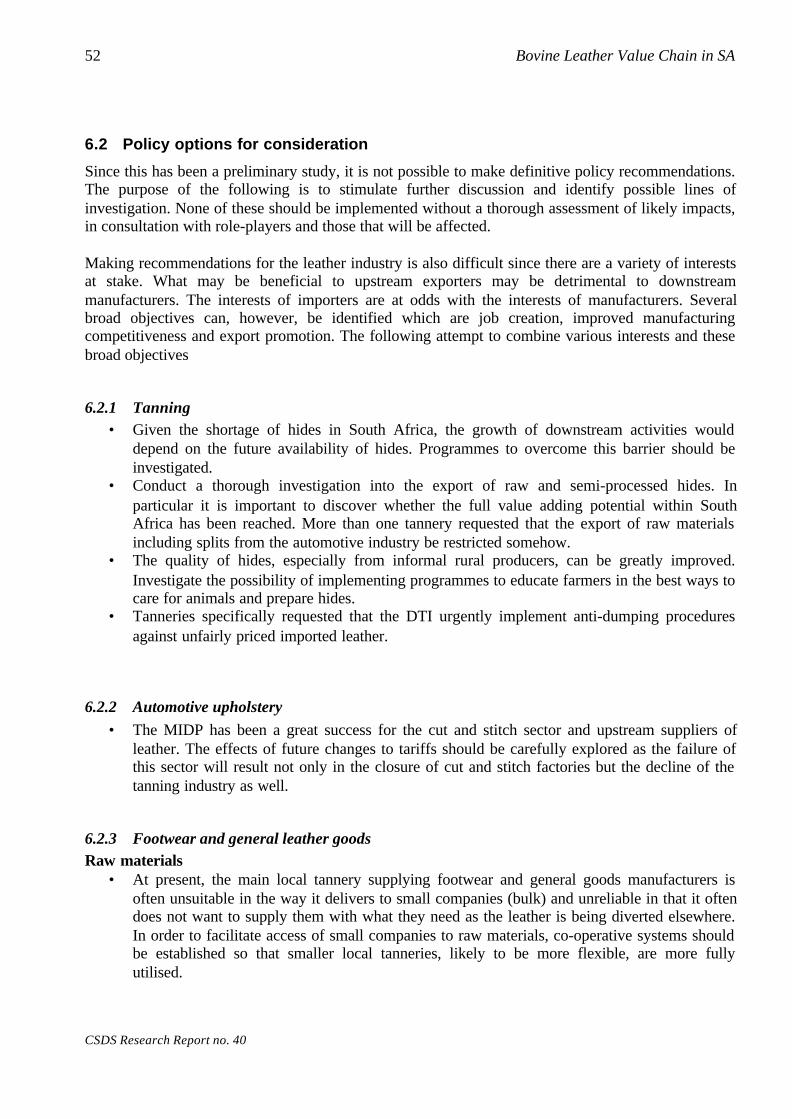
52 Bovine Leather Value Chain in SA
CSDS Research Report no. 40
6.2 Policy options for consideration
Since this has been a preliminary study, it is not possible to make definitive policy recommendations.The purpose of the following is to stimulate further discussion and identify possible lines ofinvestigation. None of these should be implemented without a thorough assessment of likely impacts,in consultation with role-players and those that will be affected.
Making recommendations for the leather industry is also difficult since there are a variety of interestsat stake. What may be beneficial to upstream exporters may be detrimental to downstreammanufacturers. The interests of importers are at odds with the interests of manufacturers. Severalbroad objectives can, however, be identified which are job creation, improved manufacturingcompetitiveness and export promotion. The following attempt to combine various interests and thesebroad objectives
6.2.1 Tanning• Given the shortage of hides in South Africa, the growth of downstream activities would
depend on the future availability of hides. Programmes to overcome this barrier should beinvestigated.
• Conduct a thorough investigation into the export of raw and semi-processed hides. Inparticular it is important to discover whether the full value adding potential within SouthAfrica has been reached. More than one tannery requested that the export of raw materialsincluding splits from the automotive industry be restricted somehow.
• The quality of hides, especially from informal rural producers, can be greatly improved.Investigate the possibility of implementing programmes to educate farmers in the best ways tocare for animals and prepare hides.
• Tanneries specifically requested that the DTI urgently implement anti-dumping proceduresagainst unfairly priced imported leather.
6.2.2 Automotive upholstery• The MIDP has been a great success for the cut and stitch sector and upstream suppliers of
leather. The effects of future changes to tariffs should be carefully explored as the failure ofthis sector will result not only in the closure of cut and stitch factories but the decline of thetanning industry as well.
6.2.3 Footwear and general leather goodsRaw materials
• At present, the main local tannery supplying footwear and general goods manufacturers isoften unsuitable in the way it delivers to small companies (bulk) and unreliable in that it oftendoes not want to supply them with what they need as the leather is being diverted elsewhere.In order to facilitate access of small companies to raw materials, co-operative systems shouldbe established so that smaller local tanneries, likely to be more flexible, are more fullyutilised.

6. Summary and Policy Considerations 53
R. Ballard
• Where a shortfall still exists, cooperative procurement of imported leather should befacilitated with a view to passing on a maximum amount of the saving onto the manufacturer.
Domestic market• Treat footwear and general goods anti-dumping applications with a matter of urgency.• Continue to explore ways of closing leaks in customs and excise. Explore the possibility of
implementing a programme specifically aimed at stopping the illegal importation of shoes.• Promote South African footwear to the domestic market on the basis of quality.• Consider requirements for ‘countries of origin’ labels on imported goods.
Export promotion• Investigate the possibility MIDP type plan of the footwear and general leather goods sector to
promote exports.• Explore the possibility of a programme to dissemination of information about export
opportunities which are now available through AGOA, the EU trade agreement and othertrade agreements. Look at facilitating contact between South African manufacturers and USand European buyers.
• Although small companies make potentially exportable products, their low turnover givesthem few resources to travel overseas and establish international markets. Trade fairs andwholesale agencies should be investigated in order to overcome this problem.

7 References & Sources
Barnes, Justin & Morris, Mike (2000) ‘An Analysis of the Endogenous and Exogenous Factors Impacting onthe Success of the Motor Industry Development Programme’ CSDS Working Paper No. 27, March 2000
DTI (2000) Current Developments in the Automotive Industry. South African government Department ofTrade and Industry
Fryer, David & Newham, Michael (2000) ‘Globalisation, Value, Rights and Work: Positive or NegativeFlexibility for South Africa?’ TIPS Annual Forum 1997 Paper http://www.tips.org.za/papers/ (DownloadedMay 2000)
Gereffi, Gary (1999) ‘International Trade and Bargaining Upgrading in the Apparel Commodity Chain’Journal of International Economics. Vol. 48, pp. 37-70
Harrison, Phil; Futter, Margaret & Meth, Fiona (1997) An Industry in Distress: Pietermaritzburg’s FootwearSector. CSDS Research Report No. 10. Centre for Development Studies, University of Natal
Hanival, Stephen & Hirsch, Alan (1998) ‘Industrial Restructuring in South Africa: The Perspective fromGovernment’ Tips Annual Forum 1998 paper http://www.tips.org.za/papers/ (Downloaded May 2001)
Holden, Merle & Casale, Daniela (2000) Endogenous Protection in a Trade Liberalising Economy: The Caseof South Africa. Trade and Industrial Policy Secretariat (TIPS) Working Paper 11_2000http://www.tips.org.za/papers/ (Downloaded May 2001)
Inggs, Margie (2001) ‘Pact Promises Reheeling of Local Shoe Industry Sunday Tribune Business Report. 7 Jan2001
Kaplinsky, Raphael and Morris, Mike (1997) ‘The Formulation and Implementation of Industrial Policy inSouth Africa: a View from the Edge’ TIPS Annual Forum 1997 Paper http://www.tips.org.za/papers/(Downloaded May 2001)
Kaplinsky, Raphael (1998) ‘Spreading the Gains from Globalisation: What can be Learned from Value ChainAnalysis’ IDS Working Paper 110. http://www.ids.ac.uk/ids/publicat/wp/wp110.pdf (Downloaded May2001)
Linde, Dennis (1999) ‘Executive Director’s Review’ Annual Report of the Southern African Footwear andLeather Industries Association (SAFLIA)
LMC International (UK) and National Productivity Institute (SA) (1996) Country Footwear Profiles includingCost Comparisons. July 1996. Prepared for the Footwear Manufacturers Federation of SA and the JapaneseGrant Fund
Lubbe, André (1999) ‘Message from the SAFLIA President’ Annual Report of the Southern African Footwearand Leather Industries Association (SAFLIA)
Raikes, Philip; Jensen, Michael & Ponte, Stefano (forthcoming) ‘Global Commodity Chain Analysis and theFrench Filière Approach: Comparison and Critique’ Economy and Society.
Schmitz, Hubert (1998) ‘Responding to Global Competitive Pressure: Local Co-operation and Upgrading thethe Sinos Valley, Brazil’ Institute of Development Studies – Working Paper 82http://www.ids.ac.uk/ids/publicat/wp/wp82.pdf
SHALC (nd) ‘MIDP Change Proposals’ Skins Hides and Leather Council unpublished Document.SHALC (2000) ‘Is the South African Footwear Industry being Deprived of Leather by the Motor Industry?’
Skins Hides and Leather Council unpublished document. 2 Feb 2000
Web sitesClearing Support Services & Cargo Info Africa: http://www.rapidttp.co.za/tariff/index.htmlInternational Trade Centre: http://www.intracen.org/leather/LeatherXchange:* http://www.leatherxchange.com/Trade and Industrial Policy Secretariat (TIPS):* http://www.tips.org.za/
* password required for some parts of these sites
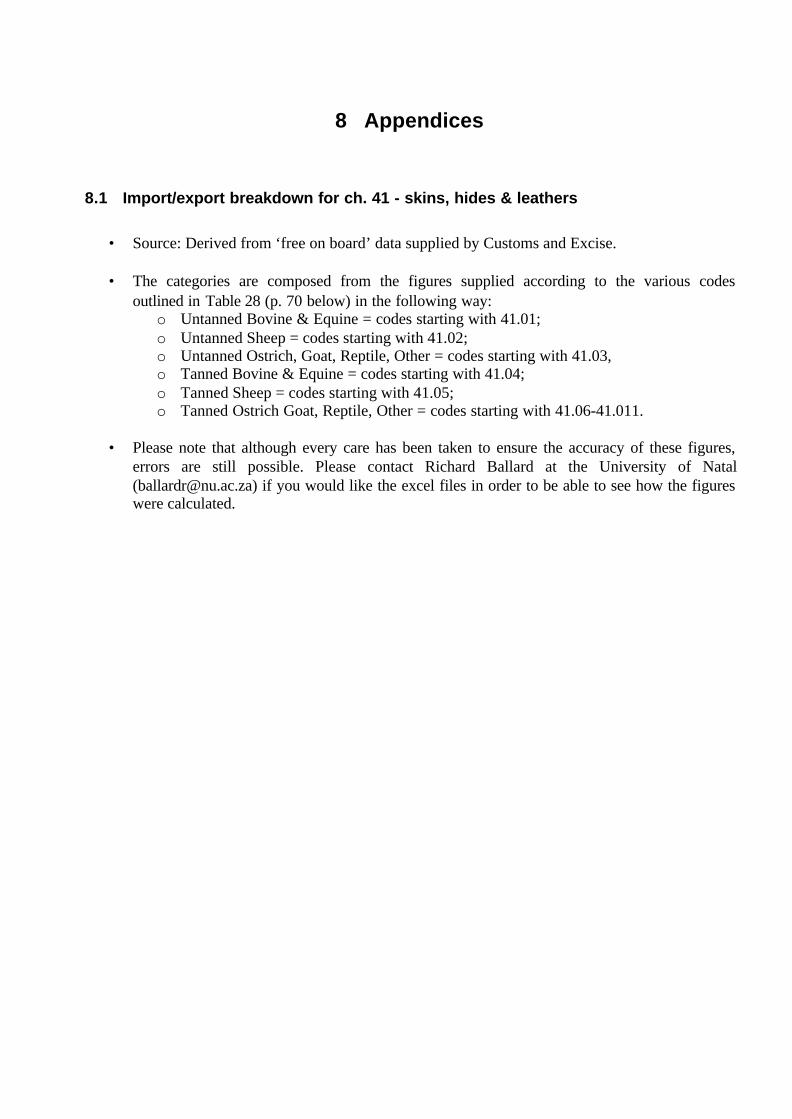
8 Appendices
8.1 Import/export breakdown for ch. 41 - skins, hides & leathers
• Source: Derived from ‘free on board’ data supplied by Customs and Excise.
• The categories are composed from the figures supplied according to the various codesoutlined in Table 28 (p. 70 below) in the following way:
o Untanned Bovine & Equine = codes starting with 41.01;o Untanned Sheep = codes starting with 41.02;o Untanned Ostrich, Goat, Reptile, Other = codes starting with 41.03,o Tanned Bovine & Equine = codes starting with 41.04;o Tanned Sheep = codes starting with 41.05;o Tanned Ostrich Goat, Reptile, Other = codes starting with 41.06-41.011.
• Please note that although every care has been taken to ensure the accuracy of these figures,errors are still possible. Please contact Richard Ballard at the University of Natal([email protected]) if you would like the excel files in order to be able to see how the figureswere calculated.
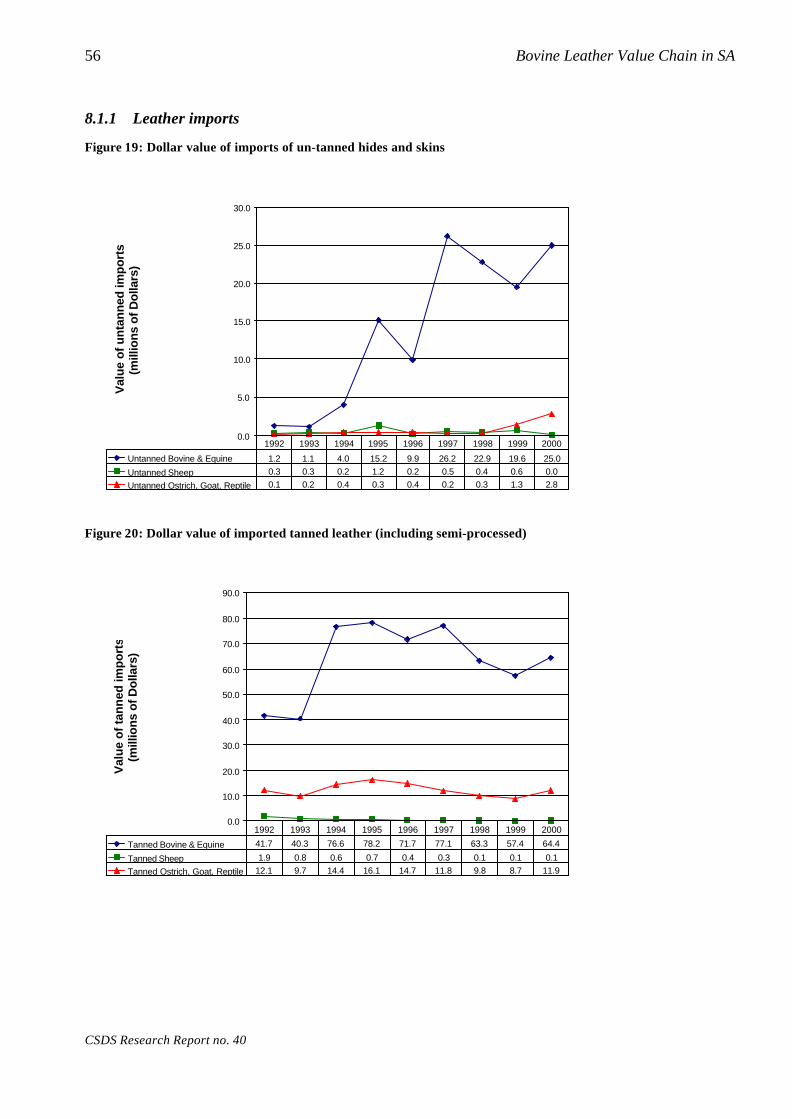
56 Bovine Leather Value Chain in SA
CSDS Research Report no. 40
8.1.1 Leather imports
Figure 19: Dollar value of imports of un-tanned hides and skins
0.0
5.0
10.0
15.0
20.0
25.0
30.0
Val
ue
of
un
tan
ned
imp
ort
s (m
illio
ns
of
Do
llars
)
Untanned Bovine & Equine 1.2 1.1 4.0 15.2 9.9 26.2 22.9 19.6 25.0
Untanned Sheep 0.3 0.3 0.2 1.2 0.2 0.5 0.4 0.6 0.0
Untanned Ostrich, Goat, Reptile 0.1 0.2 0.4 0.3 0.4 0.2 0.3 1.3 2.8
1992 1993 1994 1995 1996 1997 1998 1999 2000
Figure 20: Dollar value of imported tanned leather (including semi-processed)
0.0
10.0
20.0
30.0
40.0
50.0
60.0
70.0
80.0
90.0
Val
ue
of
tan
ned
imp
ort
s (m
illio
ns
of
Do
llars
)
Tanned Bovine & Equine 41.7 40.3 76.6 78.2 71.7 77.1 63.3 57.4 64.4
Tanned Sheep 1.9 0.8 0.6 0.7 0.4 0.3 0.1 0.1 0.1
Tanned Ostrich, Goat, Reptile 12.1 9.7 14.4 16.1 14.7 11.8 9.8 8.7 11.9
1992 1993 1994 1995 1996 1997 1998 1999 2000

8. Appendices 57
R. Ballard
Figure 21: Quantity in kilograms of un-tanned hides and skins imported
0.0
20.0
40.0
60.0
80.0
100.0
120.0
140.0
160.0
Qu
anti
ty o
f u
nta
nn
ed im
po
rts
(100
,000
s o
f kg
s)
Untanned Bovine & Equine 9.4 9.0 22.1 71.9 75.6 151.4 135.2 141.4 144.9
Untanned Sheep 3.6 5.2 3.1 1.3 0.2 0.8 1.4 1.9 0.0
Untanned Ostrich, Goat, Reptile 0.4 1.1 1.9 1.9 1.0 0.9 0.9 1.4 2.3
1992 1993 1994 1995 1996 1997 1998 1999 2000
Figure 22: Quantity in kilograms of tanned hides and skins imported (including semi-processed)
0.0
20.0
40.0
60.0
80.0
100.0
120.0
Qu
anti
ty o
f ta
nn
ed im
po
rts
(100
,000
's o
f kg
s)
Tanned Bovine & Equine 102.6 94.2 89.9 78.4 86.1 86.3
Tanned Sheep 0.5 0.1 0.1 0.0 0.1 0.0
Tanned Ostrich, Goat, Reptile 18.1 6.1 4.9 5.3 6.3 6.3
1995 1996 1997 1998 1999 2000
Aggregate volumes imported (kilograms)Year 1995 1996 1997 1998 1999 2000Kilograms 19,627,625 17,719,661 24,797,751 22,129,534 23,729,068 23,987,231
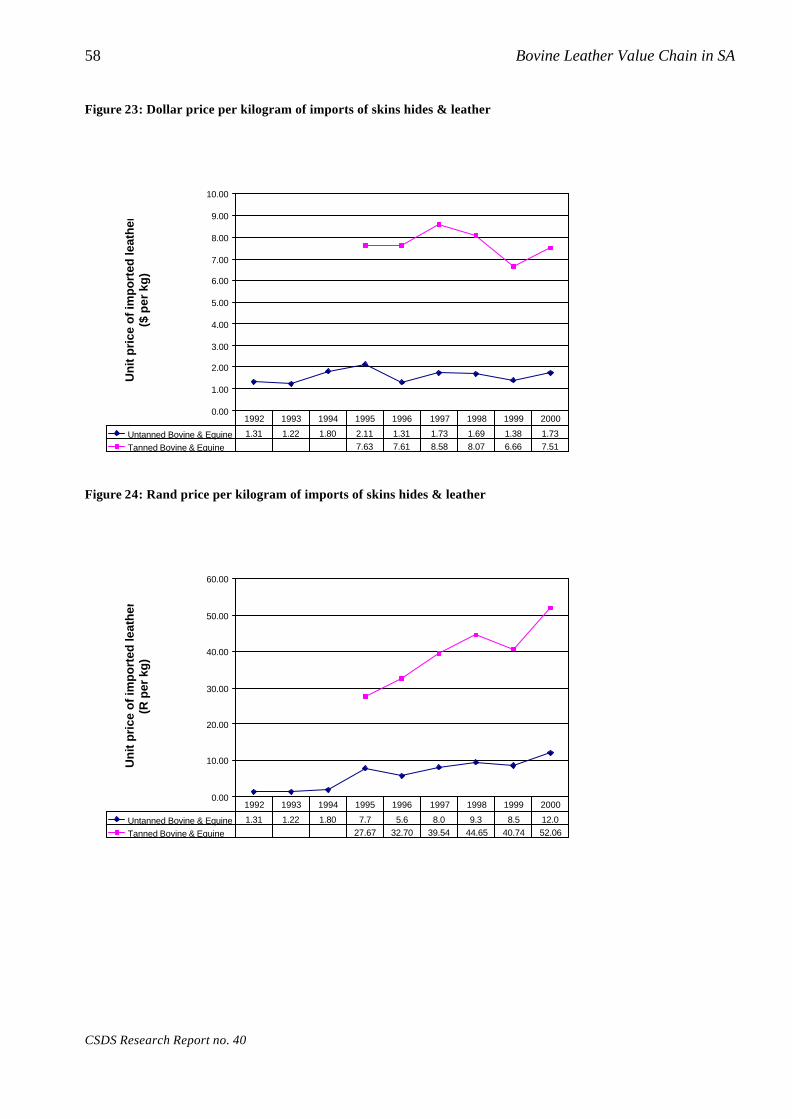
58 Bovine Leather Value Chain in SA
CSDS Research Report no. 40
Figure 23: Dollar price per kilogram of imports of skins hides & leather
0.00
1.00
2.00
3.00
4.00
5.00
6.00
7.00
8.00
9.00
10.00
Un
it p
rice
of
imp
ort
ed le
ath
er
($ p
er k
g)
Untanned Bovine & Equine 1.31 1.22 1.80 2.11 1.31 1.73 1.69 1.38 1.73
Tanned Bovine & Equine 7.63 7.61 8.58 8.07 6.66 7.51
1992 1993 1994 1995 1996 1997 1998 1999 2000
Figure 24: Rand price per kilogram of imports of skins hides & leather
0.00
10.00
20.00
30.00
40.00
50.00
60.00
Un
it p
rice
of
imp
ort
ed le
ath
er
(R p
er k
g)
Untanned Bovine & Equine 1.31 1.22 1.80 7.7 5.6 8.0 9.3 8.5 12.0
Tanned Bovine & Equine 27.67 32.70 39.54 44.65 40.74 52.06
1992 1993 1994 1995 1996 1997 1998 1999 2000

8. Appendices 59
R. Ballard
8.1.2 Leather exports
Figure 25: Dollar value of exports of un-tanned hides and skins
0.0
10.0
20.0
30.0
40.0
50.0
60.0
70.0
80.0
Val
ue
of
un
tan
ned
exp
ort
s (m
illio
ns
of
Do
llars
)
Untanned Bovine & Equine 28.7 36.6 26.4 28.1 25.1 33.7 24.0 9.9 19.0
Untanned Sheep 42.7 40.5 46.7 63.1 70.4 55.4 36.6 27.0 26.0
Untanned Ostrich, Goat, Reptile 2.2 2.4 3.4 4.9 8.1 7.9 3.9 4.8 10.4
1992 1993 1994 1995 1996 1997 1998 1999 2000
Figure 26: Dollar value of tanned leather (including semi-processed)
0.0
10.0
20.0
30.0
40.0
50.0
60.0
70.0
80.0
90.0
100.0
Val
ue
of
tan
ned
exp
ort
s (m
illio
ns
of
Do
llars
)
Tanned Bovine & Equine 23.9 29.7 47.8 49.0 44.9 45.4 40.1 37.6 76.0
Tanned Sheep 1.0 1.3 2.0 2.5 6.0 12.3 10.0 11.6 11.1
Tanned Ostrich, Goat, Reptile 39.5 46.4 72.0 88.0 86.6 82.2 60.1 84.5 80.8
1992 1993 1994 1995 1996 1997 1998 1999 2000
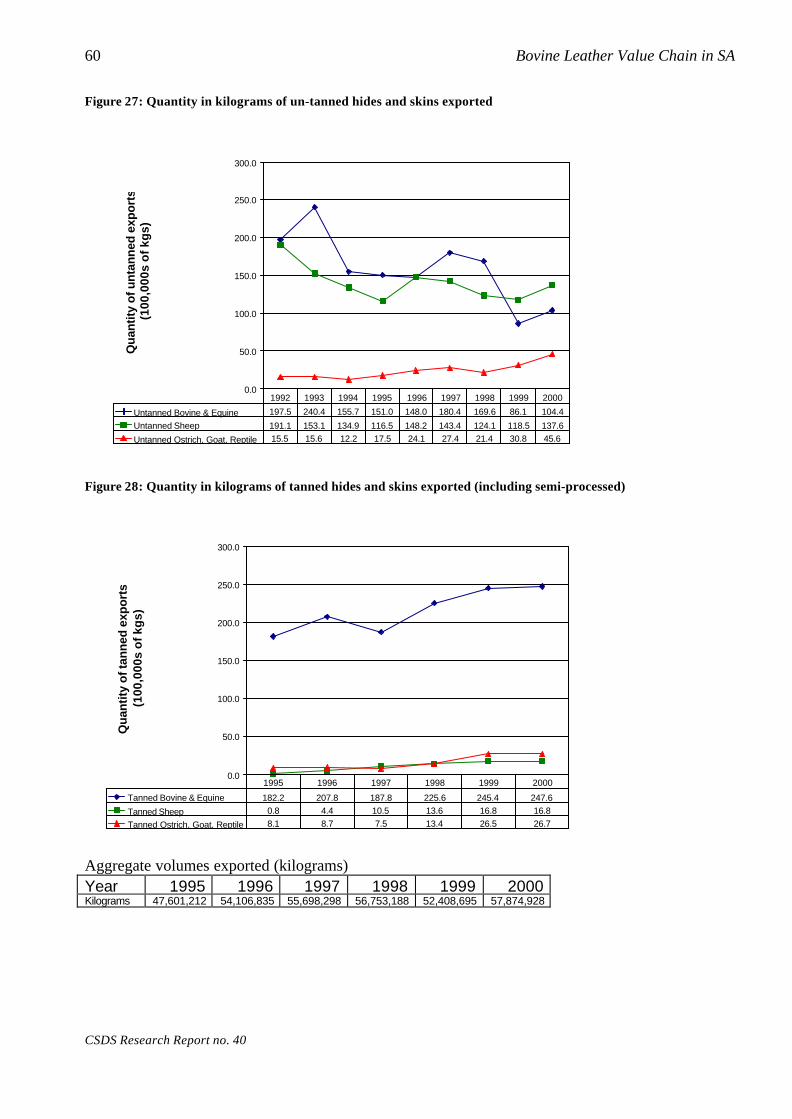
60 Bovine Leather Value Chain in SA
CSDS Research Report no. 40
Figure 27: Quantity in kilograms of un-tanned hides and skins exported
0.0
50.0
100.0
150.0
200.0
250.0
300.0
Qu
anti
ty o
f u
nta
nn
ed e
xpo
rts
(100
,000
s o
f kg
s)
Untanned Bovine & Equine 197.5 240.4 155.7 151.0 148.0 180.4 169.6 86.1 104.4
Untanned Sheep 191.1 153.1 134.9 116.5 148.2 143.4 124.1 118.5 137.6
Untanned Ostrich, Goat, Reptile 15.5 15.6 12.2 17.5 24.1 27.4 21.4 30.8 45.6
1992 1993 1994 1995 1996 1997 1998 1999 2000
Figure 28: Quantity in kilograms of tanned hides and skins exported (including semi-processed)
0.0
50.0
100.0
150.0
200.0
250.0
300.0
Qu
anti
ty o
f ta
nn
ed e
xpo
rts
(100
,000
s o
f kg
s)
Tanned Bovine & Equine 182.2 207.8 187.8 225.6 245.4 247.6
Tanned Sheep 0.8 4.4 10.5 13.6 16.8 16.8
Tanned Ostrich, Goat, Reptile 8.1 8.7 7.5 13.4 26.5 26.7
1995 1996 1997 1998 1999 2000
Aggregate volumes exported (kilograms)Year 1995 1996 1997 1998 1999 2000Kilograms 47,601,212 54,106,835 55,698,298 56,753,188 52,408,695 57,874,928
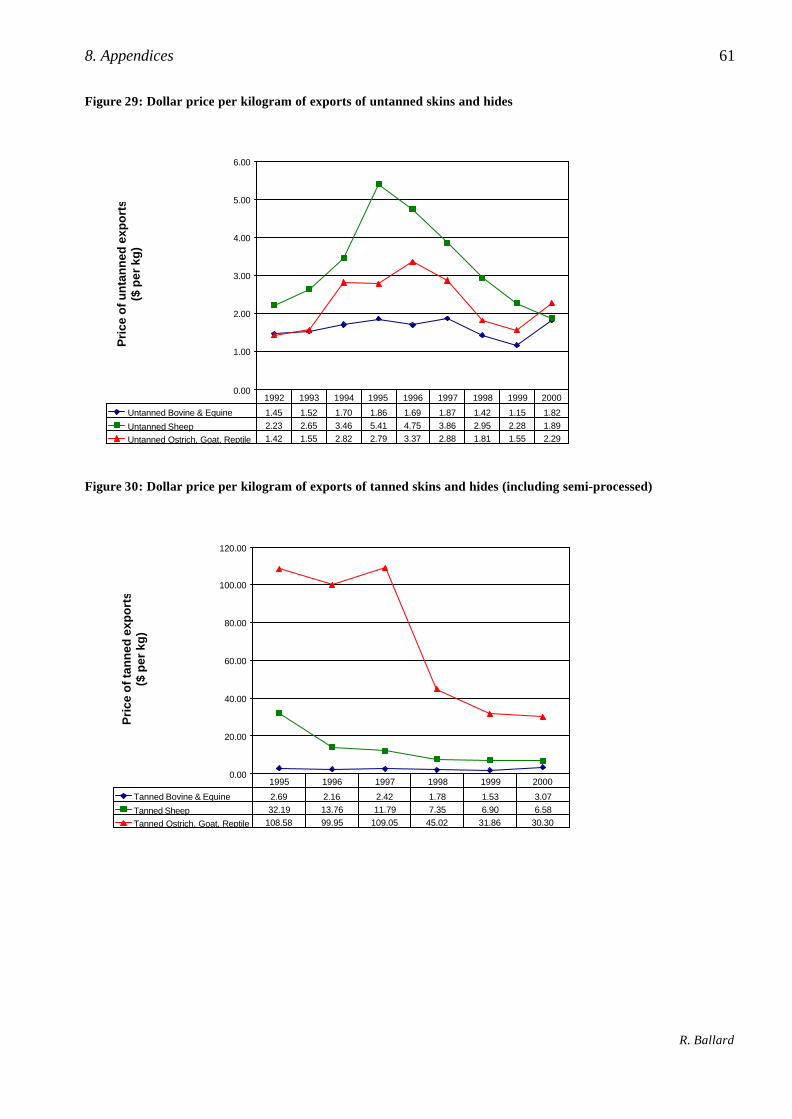
8. Appendices 61
R. Ballard
Figure 29: Dollar price per kilogram of exports of untanned skins and hides
0.00
1.00
2.00
3.00
4.00
5.00
6.00
Pri
ce o
f u
nta
nn
ed e
xpo
rts
($ p
er k
g)
Untanned Bovine & Equine 1.45 1.52 1.70 1.86 1.69 1.87 1.42 1.15 1.82
Untanned Sheep 2.23 2.65 3.46 5.41 4.75 3.86 2.95 2.28 1.89
Untanned Ostrich, Goat, Reptile 1.42 1.55 2.82 2.79 3.37 2.88 1.81 1.55 2.29
1992 1993 1994 1995 1996 1997 1998 1999 2000
Figure 30: Dollar price per kilogram of exports of tanned skins and hides (including semi-processed)
0.00
20.00
40.00
60.00
80.00
100.00
120.00
Pri
ce o
f ta
nn
ed e
xpo
rts
($ p
er k
g)
Tanned Bovine & Equine 2.69 2.16 2.42 1.78 1.53 3.07
Tanned Sheep 32.19 13.76 11.79 7.35 6.90 6.58
Tanned Ostrich, Goat, Reptile 108.58 99.95 109.05 45.02 31.86 30.30
1995 1996 1997 1998 1999 2000
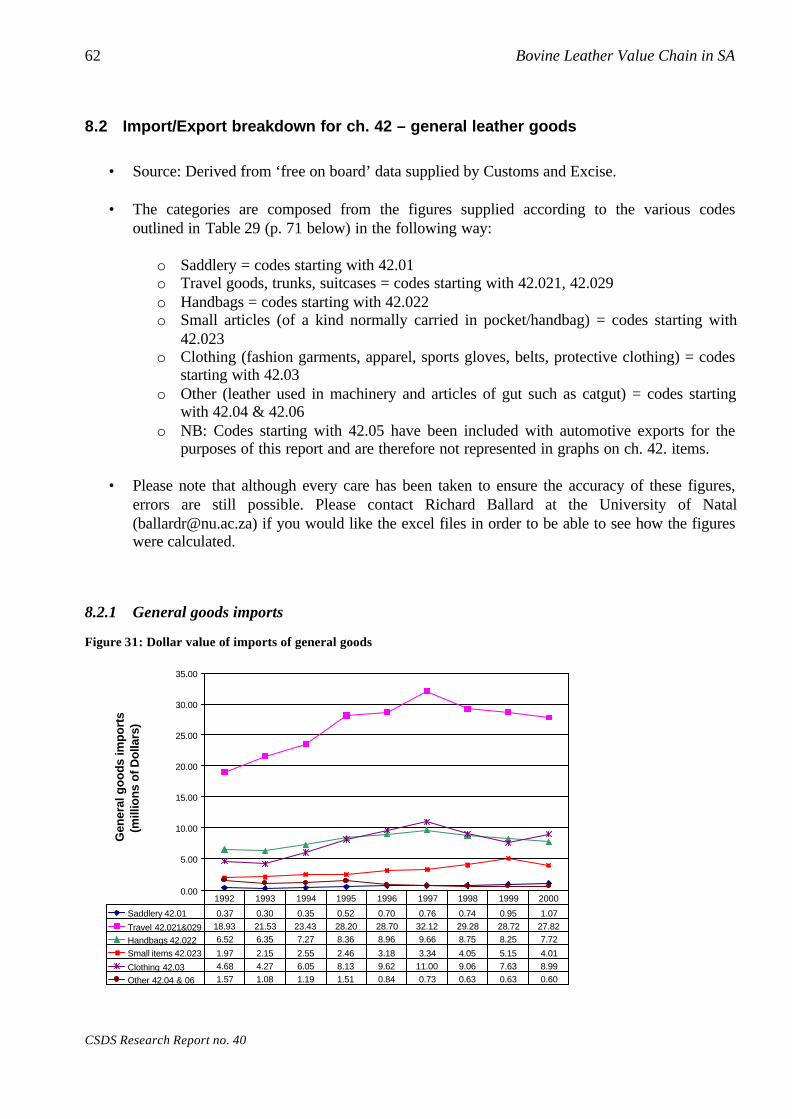
62 Bovine Leather Value Chain in SA
CSDS Research Report no. 40
8.2 Import/Export breakdown for ch. 42 – general leather goods
• Source: Derived from ‘free on board’ data supplied by Customs and Excise.
• The categories are composed from the figures supplied according to the various codesoutlined in Table 29 (p. 71 below) in the following way:
o Saddlery = codes starting with 42.01o Travel goods, trunks, suitcases = codes starting with 42.021, 42.029o Handbags = codes starting with 42.022o Small articles (of a kind normally carried in pocket/handbag) = codes starting with
42.023o Clothing (fashion garments, apparel, sports gloves, belts, protective clothing) = codes
starting with 42.03o Other (leather used in machinery and articles of gut such as catgut) = codes starting
with 42.04 & 42.06o NB: Codes starting with 42.05 have been included with automotive exports for the
purposes of this report and are therefore not represented in graphs on ch. 42. items.
• Please note that although every care has been taken to ensure the accuracy of these figures,errors are still possible. Please contact Richard Ballard at the University of Natal([email protected]) if you would like the excel files in order to be able to see how the figureswere calculated.
8.2.1 General goods imports
Figure 31: Dollar value of imports of general goods
0.00
5.00
10.00
15.00
20.00
25.00
30.00
35.00
Gen
eral
go
od
s im
po
rts
(mill
ion
s o
f D
olla
rs)
Saddlery 42.01 0.37 0.30 0.35 0.52 0.70 0.76 0.74 0.95 1.07
Travel 42.021&029 18.93 21.53 23.43 28.20 28.70 32.12 29.28 28.72 27.82
Handbags 42.022 6.52 6.35 7.27 8.36 8.96 9.66 8.75 8.25 7.72
Small items 42.023 1.97 2.15 2.55 2.46 3.18 3.34 4.05 5.15 4.01
Clothing 42.03 4.68 4.27 6.05 8.13 9.62 11.00 9.06 7.63 8.99
Other 42.04 & 06 1.57 1.08 1.19 1.51 0.84 0.73 0.63 0.63 0.60
1992 1993 1994 1995 1996 1997 1998 1999 2000

8. Appendices 63
R. Ballard
Figure 32: Quantity per item of general goods imports
0.00
5000.00
10000.00
15000.00
20000.00
25000.00
30000.00
Qu
anti
ty o
f g
en. g
oo
ds
imp
ort
s (1
000s
of
item
s)
Saddlery 42.01 21.89 16.26 23.31 30.34 44.97 55.77 61.61 71.88 94.54
Travel 42.021&029 11415.36 13088.54 14760.87 18296.91 18302.07 21635.60 21321.91 26150.93 28220.98
Handbags 42.022 2998.14 3726.30 6218.59 6330.01 8287.83 7931.71 7195.04 7265.03 8581.44
Small items 42.023 6813.97 6326.07 8721.85 3465.69 4217.24 2842.69 3055.46 2214.13 2084.98
Clothing 42.03 2320.91 2373.61 4524.36 4678.12 2707.43 2083.82 1919.35 1648.98 1720.70
1992 1993 1994 1995 1996 1997 1998 1999 2000
Aggregate volumes of general goods imported (number of items)Year 1992 1993 1994 1995 1996 1997 1998 1999 2000Items 23,570,270 25,530,771 34,248,969 32,801,071 33,559,550 34,549,592 33,553,369 37,350,945 40,702,644
Figure 33: Dollar price per item of general goods imports
0.00
2.00
4.00
6.00
8.00
10.00
12.00
14.00
16.00
18.00
20.00
Pri
ce o
f im
po
rted
gen
eral
go
od
s ($
per
item
)
Saddlery 42.01 16.84 18.32 15.19 17.20 15.62 13.68 12.05 13.23 11.36
Travel 42.021&029 1.66 1.65 1.59 1.54 1.57 1.48 1.37 1.10 0.99
Handbags 42.022 2.18 1.70 1.17 1.32 1.08 1.22 1.22 1.14 0.90
Small items 42.023 0.29 0.34 0.29 0.71 0.75 1.17 1.33 2.33 1.92
Clothing 42.03 2.02 1.80 1.34 1.74 3.55 5.28 4.72 4.63 5.22
1992 1993 1994 1995 1996 1997 1998 1999 2000
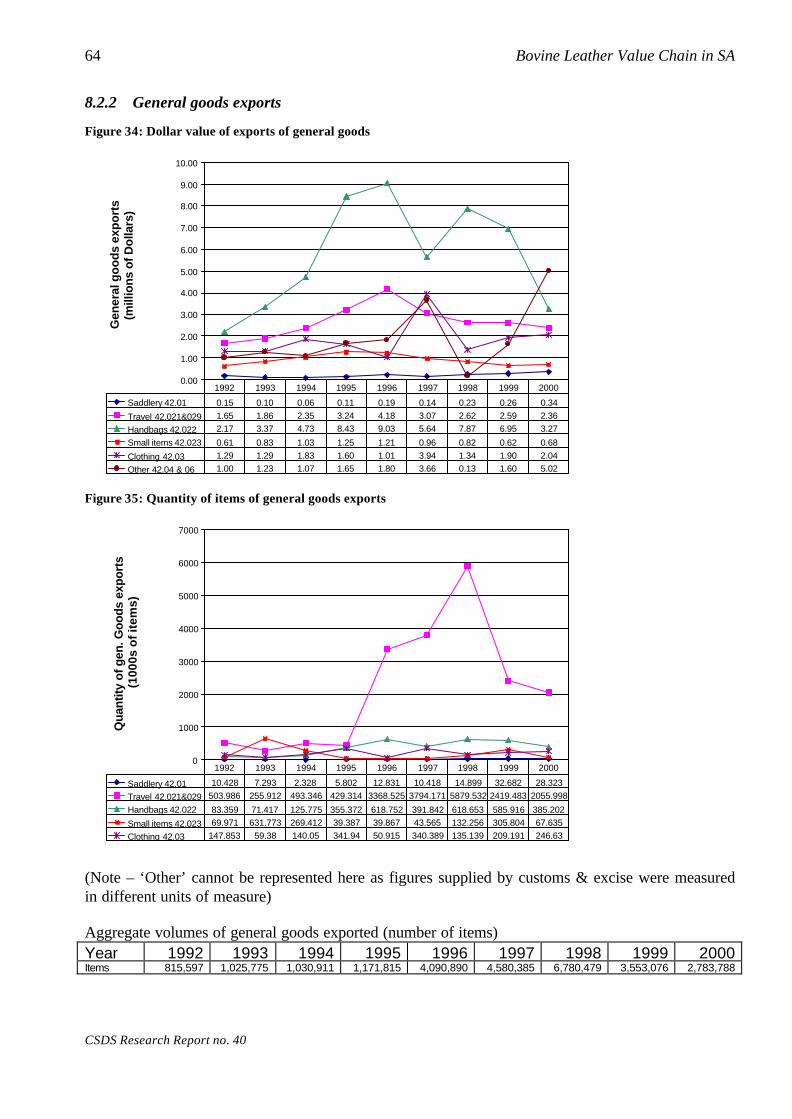
64 Bovine Leather Value Chain in SA
CSDS Research Report no. 40
8.2.2 General goods exports
Figure 34: Dollar value of exports of general goods
0.00
1.00
2.00
3.00
4.00
5.00
6.00
7.00
8.00
9.00
10.00
Gen
eral
go
od
s ex
po
rts
(m
illio
ns
of
Do
llars
)
Saddlery 42.01 0.15 0.10 0.06 0.11 0.19 0.14 0.23 0.26 0.34
Travel 42.021&029 1.65 1.86 2.35 3.24 4.18 3.07 2.62 2.59 2.36
Handbags 42.022 2.17 3.37 4.73 8.43 9.03 5.64 7.87 6.95 3.27
Small items 42.023 0.61 0.83 1.03 1.25 1.21 0.96 0.82 0.62 0.68
Clothing 42.03 1.29 1.29 1.83 1.60 1.01 3.94 1.34 1.90 2.04
Other 42.04 & 06 1.00 1.23 1.07 1.65 1.80 3.66 0.13 1.60 5.02
1992 1993 1994 1995 1996 1997 1998 1999 2000
Figure 35: Quantity of items of general goods exports
0
1000
2000
3000
4000
5000
6000
7000
Qu
anti
ty o
f g
en. G
oo
ds
exp
ort
s (1
000s
of
item
s)
Saddlery 42.01 10.428 7.293 2.328 5.802 12.831 10.418 14.899 32.682 28.323
Travel 42.021&029 503.986 255.912 493.346 429.314 3368.525 3794.171 5879.532 2419.483 2055.998
Handbags 42.022 83.359 71.417 125.775 355.372 618.752 391.842 618.653 585.916 385.202
Small items 42.023 69.971 631.773 269.412 39.387 39.867 43.565 132.256 305.804 67.635
Clothing 42.03 147.853 59.38 140.05 341.94 50.915 340.389 135.139 209.191 246.63
1992 1993 1994 1995 1996 1997 1998 1999 2000
(Note – ‘Other’ cannot be represented here as figures supplied by customs & excise were measuredin different units of measure)
Aggregate volumes of general goods exported (number of items)Year 1992 1993 1994 1995 1996 1997 1998 1999 2000Items 815,597 1,025,775 1,030,911 1,171,815 4,090,890 4,580,385 6,780,479 3,553,076 2,783,788

8. Appendices 65
R. Ballard
Figure 36: Dollar price per item of general goods exports
0.00
5.00
10.00
15.00
20.00
25.00
30.00
35.00
40.00
45.00
50.00
Pri
ce o
f ex
po
rted
gen
eral
go
od
s ($
per
item
)
Saddlery 42.01 14.18 13.44 25.81 19.02 14.94 13.02 15.48 7.82 12.11
Travel 42.021&029 3.27 7.27 4.76 7.54 1.24 0.81 0.44 1.07 1.15
Handbags 42.022 26.06 47.20 37.58 23.72 14.60 14.40 12.72 11.86 8.48
Small items 42.023 8.68 1.31 3.81 31.82 30.36 22.01 6.17 2.02 10.07
Clothing 42.03 8.73 21.72 13.06 4.69 19.83 11.56 9.94 9.09 8.28
1992 1993 1994 1995 1996 1997 1998 1999 2000
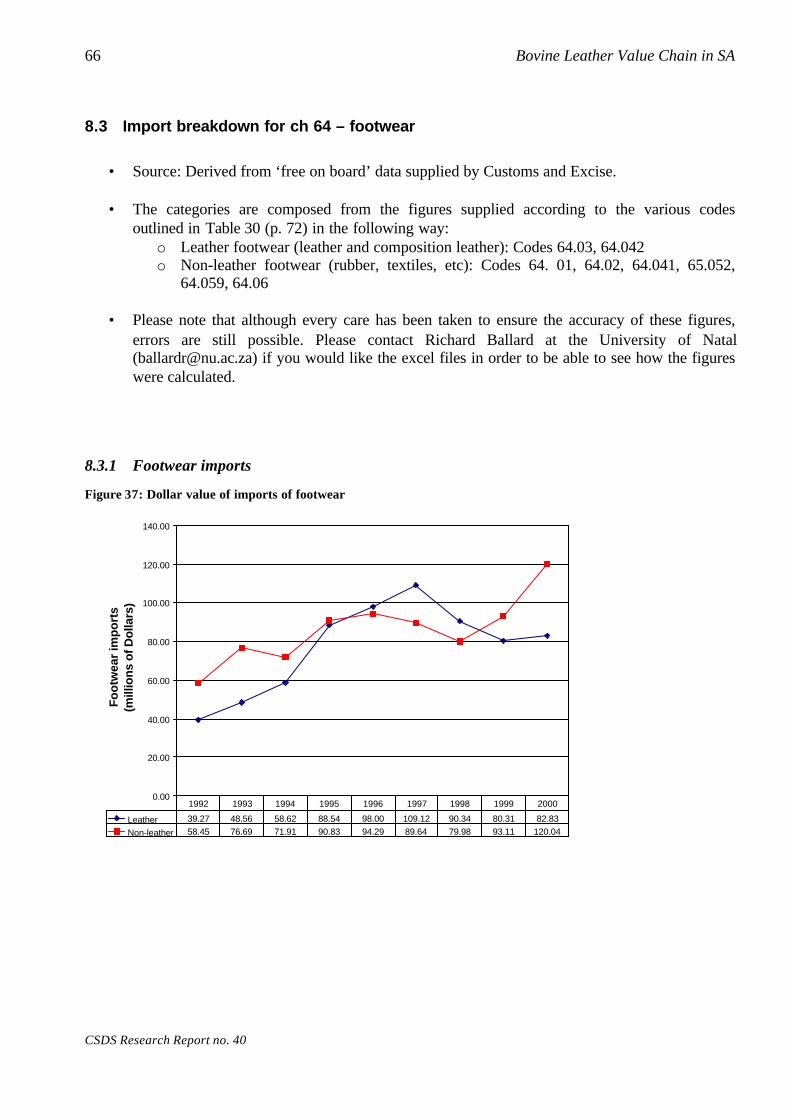
66 Bovine Leather Value Chain in SA
CSDS Research Report no. 40
8.3 Import breakdown for ch 64 – footwear
• Source: Derived from ‘free on board’ data supplied by Customs and Excise.
• The categories are composed from the figures supplied according to the various codesoutlined in Table 30 (p. 72) in the following way:
o Leather footwear (leather and composition leather): Codes 64.03, 64.042o Non-leather footwear (rubber, textiles, etc): Codes 64. 01, 64.02, 64.041, 65.052,
64.059, 64.06
• Please note that although every care has been taken to ensure the accuracy of these figures,errors are still possible. Please contact Richard Ballard at the University of Natal([email protected]) if you would like the excel files in order to be able to see how the figureswere calculated.
8.3.1 Footwear imports
Figure 37: Dollar value of imports of footwear
0.00
20.00
40.00
60.00
80.00
100.00
120.00
140.00
Fo
otw
ear
imp
ort
s(m
illio
ns
of
Do
llars
)
Leather 39.27 48.56 58.62 88.54 98.00 109.12 90.34 80.31 82.83
Non-leather 58.45 76.69 71.91 90.83 94.29 89.64 79.98 93.11 120.04
1992 1993 1994 1995 1996 1997 1998 1999 2000

8. Appendices 67
R. Ballard
Figure 38: Quantity in pairs of footwear imports
0.00
10.00
20.00
30.00
40.00
50.00
60.00Q
uan
tity
of
imp
ort
s (M
illio
ns
of
pai
rs)
Leather 4.49 7.31 8.35 10.75 10.15 11.63 9.74 10.26 11.37
Non-leather 15.66 25.38 24.03 55.42 40.54 25.81 21.06 26.79 43.02
1992 1993 1994 1995 1996 1997 1998 1999 2000
Aggregate volumes imported (number of pairs)Year 1992 1993 1994 1995 1996 1997 1998 1999 2000Pairs 20,153,502 32,688,138 32,377,808 66,170,537 50,682,813 37,442,881 30,804,820 37,052,239 54,384,836
Figure 39: Dollar price per pair of footwear imports
0.00
2.00
4.00
6.00
8.00
10.00
12.00
Un
it p
rice
of
imp
ort
ed f
oo
twea
r ($
per
pai
r)
Leather 8.75 6.65 7.02 8.24 9.66 9.38 9.27 7.83 7.29
Non-leather 3.73 3.02 2.99 1.64 2.33 3.47 3.80 3.47 2.79
1992 1993 1994 1995 1996 1997 1998 1999 2000
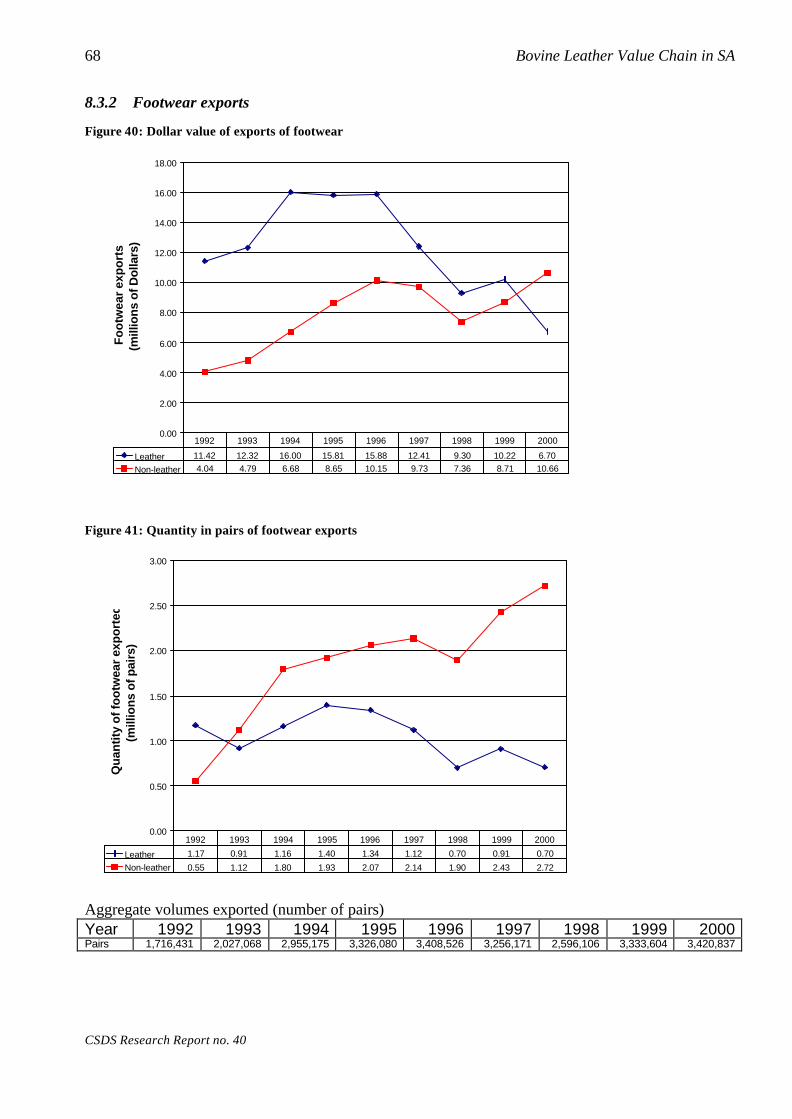
68 Bovine Leather Value Chain in SA
CSDS Research Report no. 40
8.3.2 Footwear exports
Figure 40: Dollar value of exports of footwear
0.00
2.00
4.00
6.00
8.00
10.00
12.00
14.00
16.00
18.00
Fo
otw
ear
exp
ort
s(m
illio
ns
of
Do
llars
)
Leather 11.42 12.32 16.00 15.81 15.88 12.41 9.30 10.22 6.70
Non-leather 4.04 4.79 6.68 8.65 10.15 9.73 7.36 8.71 10.66
1992 1993 1994 1995 1996 1997 1998 1999 2000
Figure 41: Quantity in pairs of footwear exports
0.00
0.50
1.00
1.50
2.00
2.50
3.00
Qu
anti
ty o
f fo
otw
ear
exp
ort
ed
(mill
ion
s o
f p
airs
)
Leather 1.17 0.91 1.16 1.40 1.34 1.12 0.70 0.91 0.70
Non-leather 0.55 1.12 1.80 1.93 2.07 2.14 1.90 2.43 2.72
1992 1993 1994 1995 1996 1997 1998 1999 2000
Aggregate volumes exported (number of pairs)Year 1992 1993 1994 1995 1996 1997 1998 1999 2000Pairs 1,716,431 2,027,068 2,955,175 3,326,080 3,408,526 3,256,171 2,596,106 3,333,604 3,420,837

8. Appendices 69
R. Ballard
Figure 42: Dollar price per pair of footwear exports
0.00
2.00
4.00
6.00
8.00
10.00
12.00
14.00
16.00
Un
it p
rice
of
exp
ort
ed f
oo
twea
r ($
per
pai
r)
Leather 9.79 13.51 13.84 11.29 11.82 11.09 13.33 11.29 9.56
Non-leather 7.35 4.29 3.71 4.49 4.91 4.55 3.88 3.58 3.92
1992 1993 1994 1995 1996 1997 1998 1999 2000
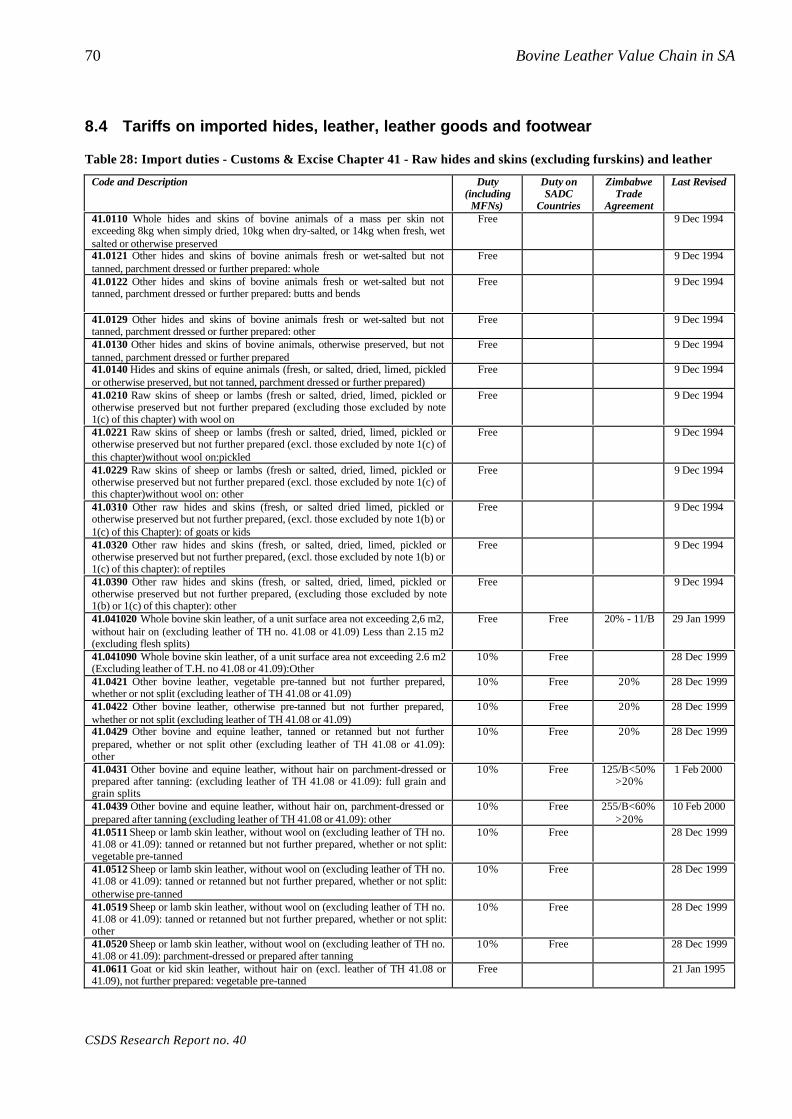
70 Bovine Leather Value Chain in SA
CSDS Research Report no. 40
8.4 Tariffs on imported hides, leather, leather goods and footwear
Table 28: Import duties - Customs & Excise Chapter 41 - Raw hides and skins (excluding furskins) and leather
Code and Description Duty(including
MFNs)
Duty onSADC
Countries
ZimbabweTrade
Agreement
Last Revised
41.0110 Whole hides and skins of bovine animals of a mass per skin notexceeding 8kg when simply dried, 10kg when dry-salted, or 14kg when fresh, wetsalted or otherwise preserved
Free 9 Dec 1994
41.0121 Other hides and skins of bovine animals fresh or wet-salted but nottanned, parchment dressed or further prepared: whole
Free 9 Dec 1994
41.0122 Other hides and skins of bovine animals fresh or wet-salted but nottanned, parchment dressed or further prepared: butts and bends
Free 9 Dec 1994
41.0129 Other hides and skins of bovine animals fresh or wet-salted but nottanned, parchment dressed or further prepared: other
Free 9 Dec 1994
41.0130 Other hides and skins of bovine animals, otherwise preserved, but nottanned, parchment dressed or further prepared
Free 9 Dec 1994
41.0140 Hides and skins of equine animals (fresh, or salted, dried, limed, pickledor otherwise preserved, but not tanned, parchment dressed or further prepared)
Free 9 Dec 1994
41.0210 Raw skins of sheep or lambs (fresh or salted, dried, limed, pickled orotherwise preserved but not further prepared (excluding those excluded by note1(c) of this chapter) with wool on
Free 9 Dec 1994
41.0221 Raw skins of sheep or lambs (fresh or salted, dried, limed, pickled orotherwise preserved but not further prepared (excl. those excluded by note 1(c) ofthis chapter)without wool on:pickled
Free 9 Dec 1994
41.0229 Raw skins of sheep or lambs (fresh or salted, dried, limed, pickled orotherwise preserved but not further prepared (excl. those excluded by note 1(c) ofthis chapter)without wool on: other
Free 9 Dec 1994
41.0310 Other raw hides and skins (fresh, or salted dried limed, pickled orotherwise preserved but not further prepared, (excl. those excluded by note 1(b) or1(c) of this Chapter): of goats or kids
Free 9 Dec 1994
41.0320 Other raw hides and skins (fresh, or salted, dried, limed, pickled orotherwise preserved but not further prepared, (excl. those excluded by note 1(b) or1(c) of this chapter): of reptiles
Free 9 Dec 1994
41.0390 Other raw hides and skins (fresh, or salted, dried, limed, pickled orotherwise preserved but not further prepared, (excluding those excluded by note1(b) or 1(c) of this chapter): other
Free 9 Dec 1994
41.041020 Whole bovine skin leather, of a unit surface area not exceeding 2,6 m2,without hair on (excluding leather of TH no. 41.08 or 41.09) Less than 2.15 m2(excluding flesh splits)
Free Free 20% - 11/B 29 Jan 1999
41.041090 Whole bovine skin leather, of a unit surface area not exceeding 2.6 m2(Excluding leather of T.H. no 41.08 or 41.09):Other
10% Free 28 Dec 1999
41.0421 Other bovine leather, vegetable pre-tanned but not further prepared,whether or not split (excluding leather of TH 41.08 or 41.09)
10% Free 20% 28 Dec 1999
41.0422 Other bovine leather, otherwise pre-tanned but not further prepared,whether or not split (excluding leather of TH 41.08 or 41.09)
10% Free 20% 28 Dec 1999
41.0429 Other bovine and equine leather, tanned or retanned but not furtherprepared, whether or not split other (excluding leather of TH 41.08 or 41.09):other
10% Free 20% 28 Dec 1999
41.0431 Other bovine and equine leather, without hair on parchment-dressed orprepared after tanning: (excluding leather of TH 41.08 or 41.09): full grain andgrain splits
10% Free 125/B<50%>20%
1 Feb 2000
41.0439 Other bovine and equine leather, without hair on, parchment-dressed orprepared after tanning (excluding leather of TH 41.08 or 41.09): other
10% Free 255/B<60%>20%
10 Feb 2000
41.0511 Sheep or lamb skin leather, without wool on (excluding leather of TH no.41.08 or 41.09): tanned or retanned but not further prepared, whether or not split:vegetable pre-tanned
10% Free 28 Dec 1999
41.0512 Sheep or lamb skin leather, without wool on (excluding leather of TH no.41.08 or 41.09): tanned or retanned but not further prepared, whether or not split:otherwise pre-tanned
10% Free 28 Dec 1999
41.0519 Sheep or lamb skin leather, without wool on (excluding leather of TH no.41.08 or 41.09): tanned or retanned but not further prepared, whether or not split:other
10% Free 28 Dec 1999
41.0520 Sheep or lamb skin leather, without wool on (excluding leather of TH no.41.08 or 41.09): parchment-dressed or prepared after tanning
10% Free 28 Dec 1999
41.0611 Goat or kid skin leather, without hair on (excl. leather of TH 41.08 or41.09), not further prepared: vegetable pre-tanned
Free 21 Jan 1995
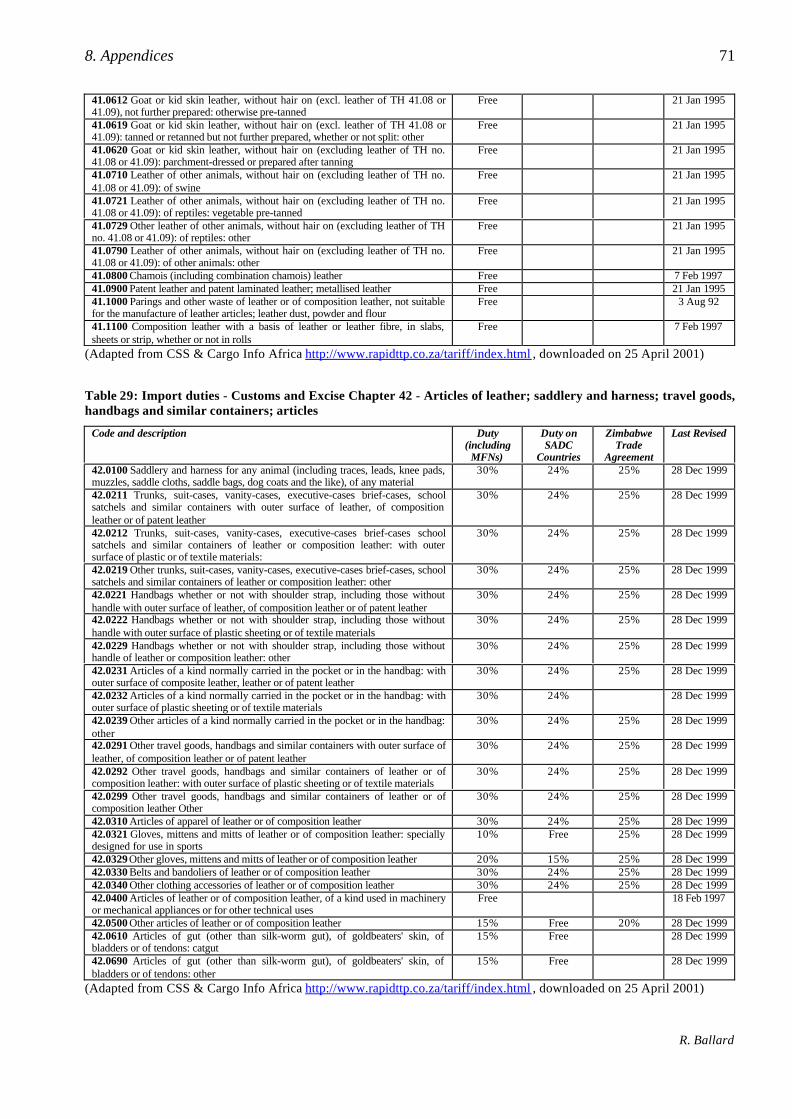
8. Appendices 71
R. Ballard
41.0612 Goat or kid skin leather, without hair on (excl. leather of TH 41.08 or41.09), not further prepared: otherwise pre-tanned
Free 21 Jan 1995
41.0619 Goat or kid skin leather, without hair on (excl. leather of TH 41.08 or41.09): tanned or retanned but not further prepared, whether or not split: other
Free 21 Jan 1995
41.0620 Goat or kid skin leather, without hair on (excluding leather of TH no.41.08 or 41.09): parchment-dressed or prepared after tanning
Free 21 Jan 1995
41.0710 Leather of other animals, without hair on (excluding leather of TH no.41.08 or 41.09): of swine
Free 21 Jan 1995
41.0721 Leather of other animals, without hair on (excluding leather of TH no.41.08 or 41.09): of reptiles: vegetable pre-tanned
Free 21 Jan 1995
41.0729 Other leather of other animals, without hair on (excluding leather of THno. 41.08 or 41.09): of reptiles: other
Free 21 Jan 1995
41.0790 Leather of other animals, without hair on (excluding leather of TH no.41.08 or 41.09): of other animals: other
Free 21 Jan 1995
41.0800 Chamois (including combination chamois) leather Free 7 Feb 199741.0900 Patent leather and patent laminated leather; metallised leather Free 21 Jan 199541.1000 Parings and other waste of leather or of composition leather, not suitablefor the manufacture of leather articles; leather dust, powder and flour
Free 3 Aug 92
41.1100 Composition leather with a basis of leather or leather fibre, in slabs,sheets or strip, whether or not in rolls
Free 7 Feb 1997
(Adapted from CSS & Cargo Info Africa http://www.rapidttp.co.za/tariff/index.html , downloaded on 25 April 2001)
Table 29: Import duties - Customs and Excise Chapter 42 - Articles of leather; saddlery and harness; travel goods,handbags and similar containers; articles
Code and description Duty(including
MFNs)
Duty onSADC
Countries
ZimbabweTrade
Agreement
Last Revised
42.0100 Saddlery and harness for any animal (including traces, leads, knee pads,muzzles, saddle cloths, saddle bags, dog coats and the like), of any material
30% 24% 25% 28 Dec 1999
42.0211 Trunks, suit-cases, vanity-cases, executive-cases brief-cases, schoolsatchels and similar containers with outer surface of leather, of compositionleather or of patent leather
30% 24% 25% 28 Dec 1999
42.0212 Trunks, suit-cases, vanity-cases, executive-cases brief-cases schoolsatchels and similar containers of leather or composition leather: with outersurface of plastic or of textile materials:
30% 24% 25% 28 Dec 1999
42.0219 Other trunks, suit-cases, vanity-cases, executive-cases brief-cases, schoolsatchels and similar containers of leather or composition leather: other
30% 24% 25% 28 Dec 1999
42.0221 Handbags whether or not with shoulder strap, including those withouthandle with outer surface of leather, of composition leather or of patent leather
30% 24% 25% 28 Dec 1999
42.0222 Handbags whether or not with shoulder strap, including those withouthandle with outer surface of plastic sheeting or of textile materials
30% 24% 25% 28 Dec 1999
42.0229 Handbags whether or not with shoulder strap, including those withouthandle of leather or composition leather: other
30% 24% 25% 28 Dec 1999
42.0231 Articles of a kind normally carried in the pocket or in the handbag: withouter surface of composite leather, leather or of patent leather
30% 24% 25% 28 Dec 1999
42.0232 Articles of a kind normally carried in the pocket or in the handbag: withouter surface of plastic sheeting or of textile materials
30% 24% 28 Dec 1999
42.0239 Other articles of a kind normally carried in the pocket or in the handbag:other
30% 24% 25% 28 Dec 1999
42.0291 Other travel goods, handbags and similar containers with outer surface ofleather, of composition leather or of patent leather
30% 24% 25% 28 Dec 1999
42.0292 Other travel goods, handbags and similar containers of leather or ofcomposition leather: with outer surface of plastic sheeting or of textile materials
30% 24% 25% 28 Dec 1999
42.0299 Other travel goods, handbags and similar containers of leather or ofcomposition leather Other
30% 24% 25% 28 Dec 1999
42.0310 Articles of apparel of leather or of composition leather 30% 24% 25% 28 Dec 199942.0321 Gloves, mittens and mitts of leather or of composition leather: speciallydesigned for use in sports
10% Free 25% 28 Dec 1999
42.0329 Other gloves, mittens and mitts of leather or of composition leather 20% 15% 25% 28 Dec 199942.0330 Belts and bandoliers of leather or of composition leather 30% 24% 25% 28 Dec 199942.0340 Other clothing accessories of leather or of composition leather 30% 24% 25% 28 Dec 199942.0400 Articles of leather or of composition leather, of a kind used in machineryor mechanical appliances or for other technical uses
Free 18 Feb 1997
42.0500 Other articles of leather or of composition leather 15% Free 20% 28 Dec 199942.0610 Articles of gut (other than silk-worm gut), of goldbeaters' skin, ofbladders or of tendons: catgut
15% Free 28 Dec 1999
42.0690 Articles of gut (other than silk-worm gut), of goldbeaters' skin, ofbladders or of tendons: other
15% Free 28 Dec 1999
(Adapted from CSS & Cargo Info Africa http://www.rapidttp.co.za/tariff/index.html , downloaded on 25 April 2001)
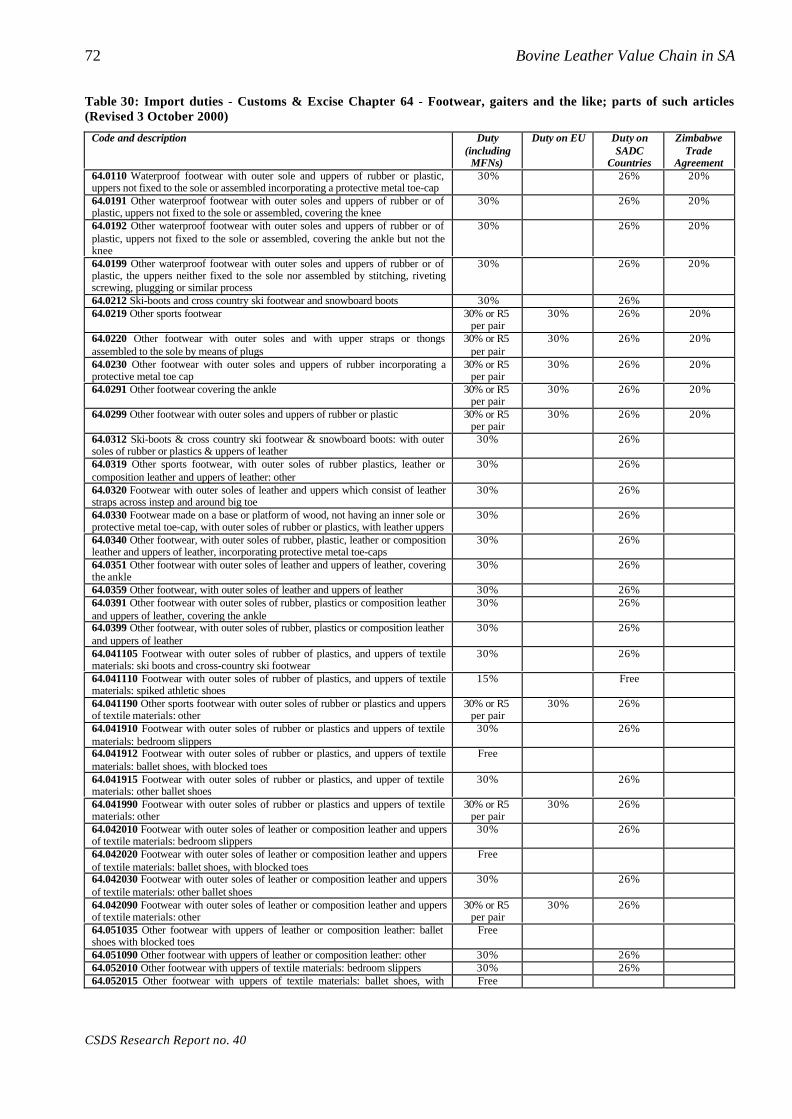
72 Bovine Leather Value Chain in SA
CSDS Research Report no. 40
Table 30: Import duties - Customs & Excise Chapter 64 - Footwear, gaiters and the like; parts of such articles(Revised 3 October 2000)
Code and description Duty(including
MFNs)
Duty on EU Duty onSADC
Countries
ZimbabweTrade
Agreement64.0110 Waterproof footwear with outer sole and uppers of rubber or plastic,uppers not fixed to the sole or assembled incorporating a protective metal toe-cap
30% 26% 20%
64.0191 Other waterproof footwear with outer soles and uppers of rubber or ofplastic, uppers not fixed to the sole or assembled, covering the knee
30% 26% 20%
64.0192 Other waterproof footwear with outer soles and uppers of rubber or ofplastic, uppers not fixed to the sole or assembled, covering the ankle but not theknee
30% 26% 20%
64.0199 Other waterproof footwear with outer soles and uppers of rubber or ofplastic, the uppers neither fixed to the sole nor assembled by stitching, rivetingscrewing, plugging or similar process
30% 26% 20%
64.0212 Ski-boots and cross country ski footwear and snowboard boots 30% 26%64.0219 Other sports footwear 30% or R5
per pair30% 26% 20%
64.0220 Other footwear with outer soles and with upper straps or thongsassembled to the sole by means of plugs
30% or R5per pair
30% 26% 20%
64.0230 Other footwear with outer soles and uppers of rubber incorporating aprotective metal toe cap
30% or R5per pair
30% 26% 20%
64.0291 Other footwear covering the ankle 30% or R5per pair
30% 26% 20%
64.0299 Other footwear with outer soles and uppers of rubber or plastic 30% or R5per pair
30% 26% 20%
64.0312 Ski-boots & cross country ski footwear & snowboard boots: with outersoles of rubber or plastics & uppers of leather
30% 26%
64.0319 Other sports footwear, with outer soles of rubber plastics, leather orcomposition leather and uppers of leather: other
30% 26%
64.0320 Footwear with outer soles of leather and uppers which consist of leatherstraps across instep and around big toe
30% 26%
64.0330 Footwear made on a base or platform of wood, not having an inner sole orprotective metal toe-cap, with outer soles of rubber or plastics, with leather uppers
30% 26%
64.0340 Other footwear, with outer soles of rubber, plastic, leather or compositionleather and uppers of leather, incorporating protective metal toe-caps
30% 26%
64.0351 Other footwear with outer soles of leather and uppers of leather, coveringthe ankle
30% 26%
64.0359 Other footwear, with outer soles of leather and uppers of leather 30% 26%64.0391 Other footwear with outer soles of rubber, plastics or composition leatherand uppers of leather, covering the ankle
30% 26%
64.0399 Other footwear, with outer soles of rubber, plastics or composition leatherand uppers of leather
30% 26%
64.041105 Footwear with outer soles of rubber of plastics, and uppers of textilematerials: ski boots and cross-country ski footwear
30% 26%
64.041110 Footwear with outer soles of rubber of plastics, and uppers of textilematerials: spiked athletic shoes
15% Free
64.041190 Other sports footwear with outer soles of rubber or plastics and uppersof textile materials: other
30% or R5per pair
30% 26%
64.041910 Footwear with outer soles of rubber or plastics and uppers of textilematerials: bedroom slippers
30% 26%
64.041912 Footwear with outer soles of rubber or plastics, and uppers of textilematerials: ballet shoes, with blocked toes
Free
64.041915 Footwear with outer soles of rubber or plastics, and upper of textilematerials: other ballet shoes
30% 26%
64.041990 Footwear with outer soles of rubber or plastics and uppers of textilematerials: other
30% or R5per pair
30% 26%
64.042010 Footwear with outer soles of leather or composition leather and uppersof textile materials: bedroom slippers
30% 26%
64.042020 Footwear with outer soles of leather or composition leather and uppersof textile materials: ballet shoes, with blocked toes
Free
64.042030 Footwear with outer soles of leather or composition leather and uppersof textile materials: other ballet shoes
30% 26%
64.042090 Footwear with outer soles of leather or composition leather and uppersof textile materials: other
30% or R5per pair
30% 26%
64.051035 Other footwear with uppers of leather or composition leather: balletshoes with blocked toes
Free
64.051090 Other footwear with uppers of leather or composition leather: other 30% 26%64.052010 Other footwear with uppers of textile materials: bedroom slippers 30% 26%64.052015 Other footwear with uppers of textile materials: ballet shoes, with Free
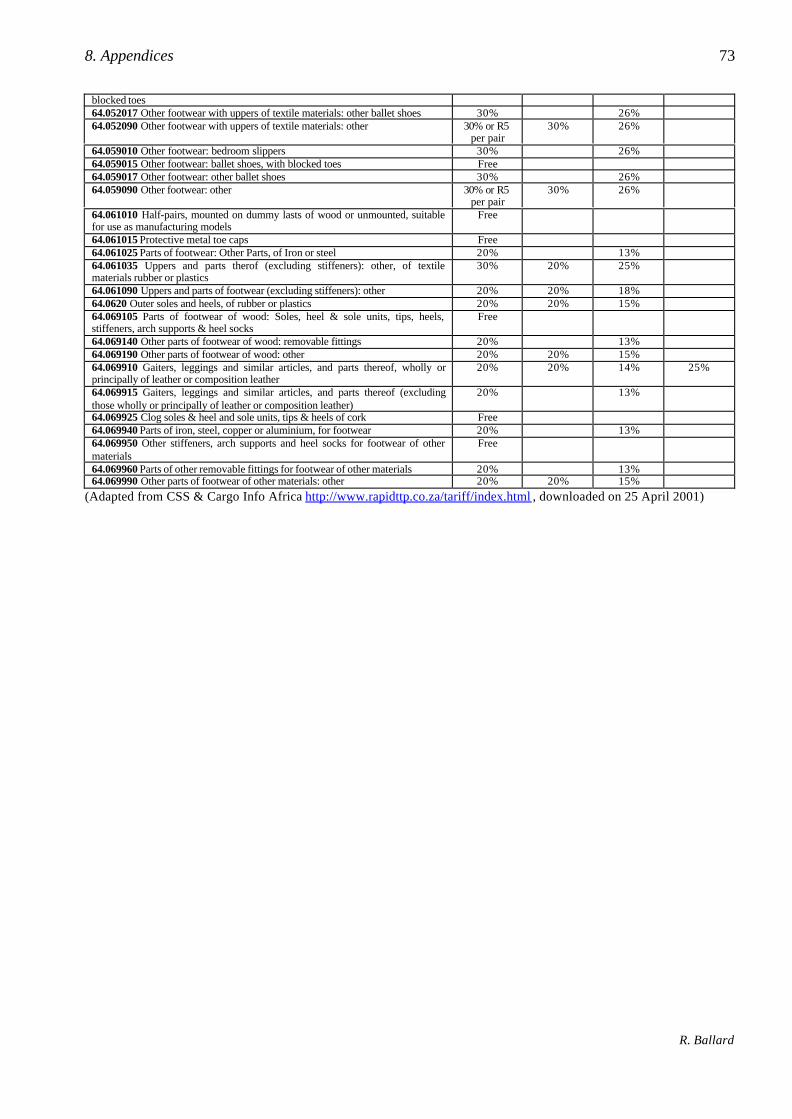
8. Appendices 73
R. Ballard
blocked toes64.052017 Other footwear with uppers of textile materials: other ballet shoes 30% 26%64.052090 Other footwear with uppers of textile materials: other 30% or R5
per pair30% 26%
64.059010 Other footwear: bedroom slippers 30% 26%64.059015 Other footwear: ballet shoes, with blocked toes Free64.059017 Other footwear: other ballet shoes 30% 26%64.059090 Other footwear: other 30% or R5
per pair30% 26%
64.061010 Half-pairs, mounted on dummy lasts of wood or unmounted, suitablefor use as manufacturing models
Free
64.061015 Protective metal toe caps Free64.061025 Parts of footwear: Other Parts, of Iron or steel 20% 13%64.061035 Uppers and parts therof (excluding stiffeners): other, of textilematerials rubber or plastics
30% 20% 25%
64.061090 Uppers and parts of footwear (excluding stiffeners): other 20% 20% 18%64.0620 Outer soles and heels, of rubber or plastics 20% 20% 15%64.069105 Parts of footwear of wood: Soles, heel & sole units, tips, heels,stiffeners, arch supports & heel socks
Free
64.069140 Other parts of footwear of wood: removable fittings 20% 13%64.069190 Other parts of footwear of wood: other 20% 20% 15%64.069910 Gaiters, leggings and similar articles, and parts thereof, wholly orprincipally of leather or composition leather
20% 20% 14% 25%
64.069915 Gaiters, leggings and similar articles, and parts thereof (excludingthose wholly or principally of leather or composition leather)
20% 13%
64.069925 Clog soles & heel and sole units, tips & heels of cork Free64.069940 Parts of iron, steel, copper or aluminium, for footwear 20% 13%64.069950 Other stiffeners, arch supports and heel socks for footwear of othermaterials
Free
64.069960 Parts of other removable fittings for footwear of other materials 20% 13%64.069990 Other parts of footwear of other materials: other 20% 20% 15%
(Adapted from CSS & Cargo Info Africa http://www.rapidttp.co.za/tariff/index.html , downloaded on 25 April 2001)
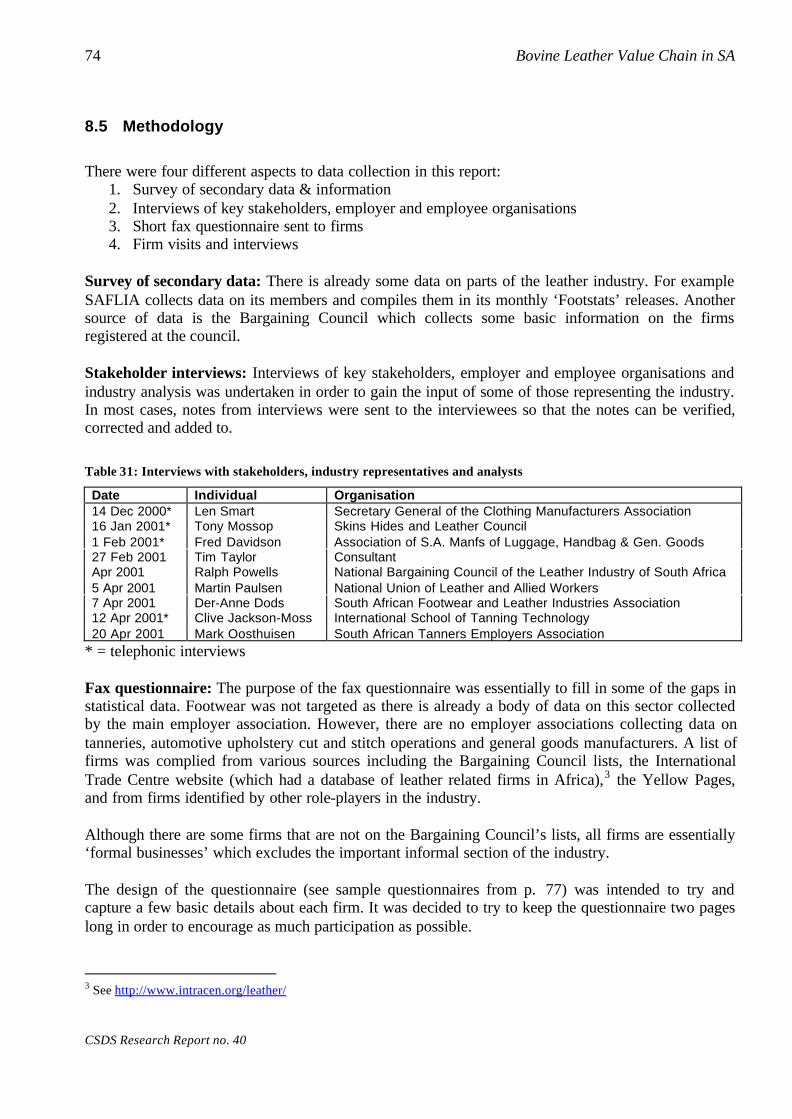
74 Bovine Leather Value Chain in SA
CSDS Research Report no. 40
8.5 Methodology
There were four different aspects to data collection in this report:1. Survey of secondary data & information2. Interviews of key stakeholders, employer and employee organisations3. Short fax questionnaire sent to firms4. Firm visits and interviews
Survey of secondary data: There is already some data on parts of the leather industry. For exampleSAFLIA collects data on its members and compiles them in its monthly ‘Footstats’ releases. Anothersource of data is the Bargaining Council which collects some basic information on the firmsregistered at the council.
Stakeholder interviews: Interviews of key stakeholders, employer and employee organisations andindustry analysis was undertaken in order to gain the input of some of those representing the industry.In most cases, notes from interviews were sent to the interviewees so that the notes can be verified,corrected and added to.
Table 31: Interviews with stakeholders, industry representatives and analysts
Date Individual Organisation14 Dec 2000* Len Smart Secretary General of the Clothing Manufacturers Association16 Jan 2001* Tony Mossop Skins Hides and Leather Council1 Feb 2001* Fred Davidson Association of S.A. Manfs of Luggage, Handbag & Gen. Goods27 Feb 2001 Tim Taylor ConsultantApr 2001 Ralph Powells National Bargaining Council of the Leather Industry of South Africa5 Apr 2001 Martin Paulsen National Union of Leather and Allied Workers7 Apr 2001 Der-Anne Dods South African Footwear and Leather Industries Association12 Apr 2001* Clive Jackson-Moss International School of Tanning Technology20 Apr 2001 Mark Oosthuisen South African Tanners Employers Association
* = telephonic interviews
Fax questionnaire: The purpose of the fax questionnaire was essentially to fill in some of the gaps instatistical data. Footwear was not targeted as there is already a body of data on this sector collectedby the main employer association. However, there are no employer associations collecting data ontanneries, automotive upholstery cut and stitch operations and general goods manufacturers. A list offirms was complied from various sources including the Bargaining Council lists, the InternationalTrade Centre website (which had a database of leather related firms in Africa),3 the Yellow Pages,and from firms identified by other role-players in the industry.
Although there are some firms that are not on the Bargaining Council’s lists, all firms are essentially‘formal businesses’ which excludes the important informal section of the industry.
The design of the questionnaire (see sample questionnaires from p. 77) was intended to try andcapture a few basic details about each firm. It was decided to try to keep the questionnaire two pageslong in order to encourage as much participation as possible.
3 See http://www.intracen.org/leather/
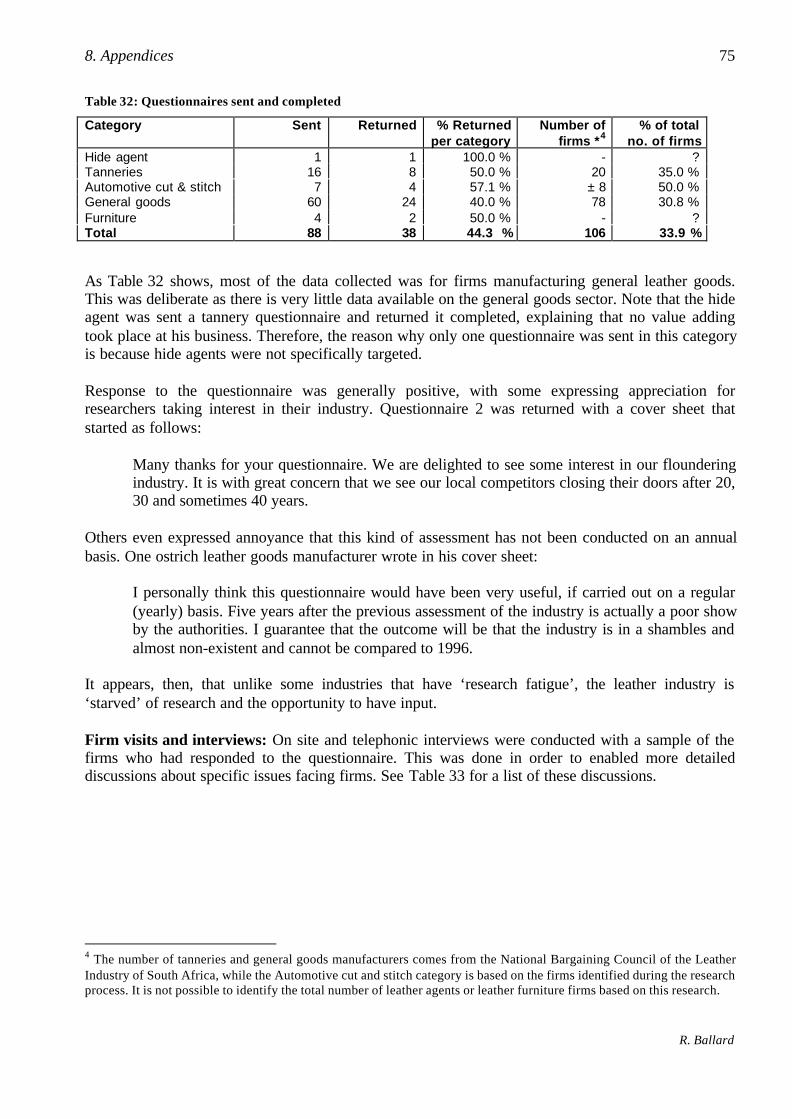
8. Appendices 75
R. Ballard
Table 32: Questionnaires sent and completed
Category Sent Returned % Returnedper category
Number offirms *4
% of totalno. of firms
Hide agent 1 1 100.0 % - ?Tanneries 16 8 50.0 % 20 35.0 %Automotive cut & stitch 7 4 57.1 % ± 8 50.0 %General goods 60 24 40.0 % 78 30.8 %Furniture 4 2 50.0 % - ?Total 88 38 44.3 % 106 33.9 %
As Table 32 shows, most of the data collected was for firms manufacturing general leather goods.This was deliberate as there is very little data available on the general goods sector. Note that the hideagent was sent a tannery questionnaire and returned it completed, explaining that no value addingtook place at his business. Therefore, the reason why only one questionnaire was sent in this categoryis because hide agents were not specifically targeted.
Response to the questionnaire was generally positive, with some expressing appreciation forresearchers taking interest in their industry. Questionnaire 2 was returned with a cover sheet thatstarted as follows:
Many thanks for your questionnaire. We are delighted to see some interest in our flounderingindustry. It is with great concern that we see our local competitors closing their doors after 20,30 and sometimes 40 years.
Others even expressed annoyance that this kind of assessment has not been conducted on an annualbasis. One ostrich leather goods manufacturer wrote in his cover sheet:
I personally think this questionnaire would have been very useful, if carried out on a regular(yearly) basis. Five years after the previous assessment of the industry is actually a poor showby the authorities. I guarantee that the outcome will be that the industry is in a shambles andalmost non-existent and cannot be compared to 1996.
It appears, then, that unlike some industries that have ‘research fatigue’, the leather industry is‘starved’ of research and the opportunity to have input.
Firm visits and interviews: On site and telephonic interviews were conducted with a sample of thefirms who had responded to the questionnaire. This was done in order to enabled more detaileddiscussions about specific issues facing firms. See Table 33 for a list of these discussions.
4 The number of tanneries and general goods manufacturers comes from the National Bargaining Council of the LeatherIndustry of South Africa, while the Automotive cut and stitch category is based on the firms identified during the researchprocess. It is not possible to identify the total number of leather agents or leather furniture firms based on this research.
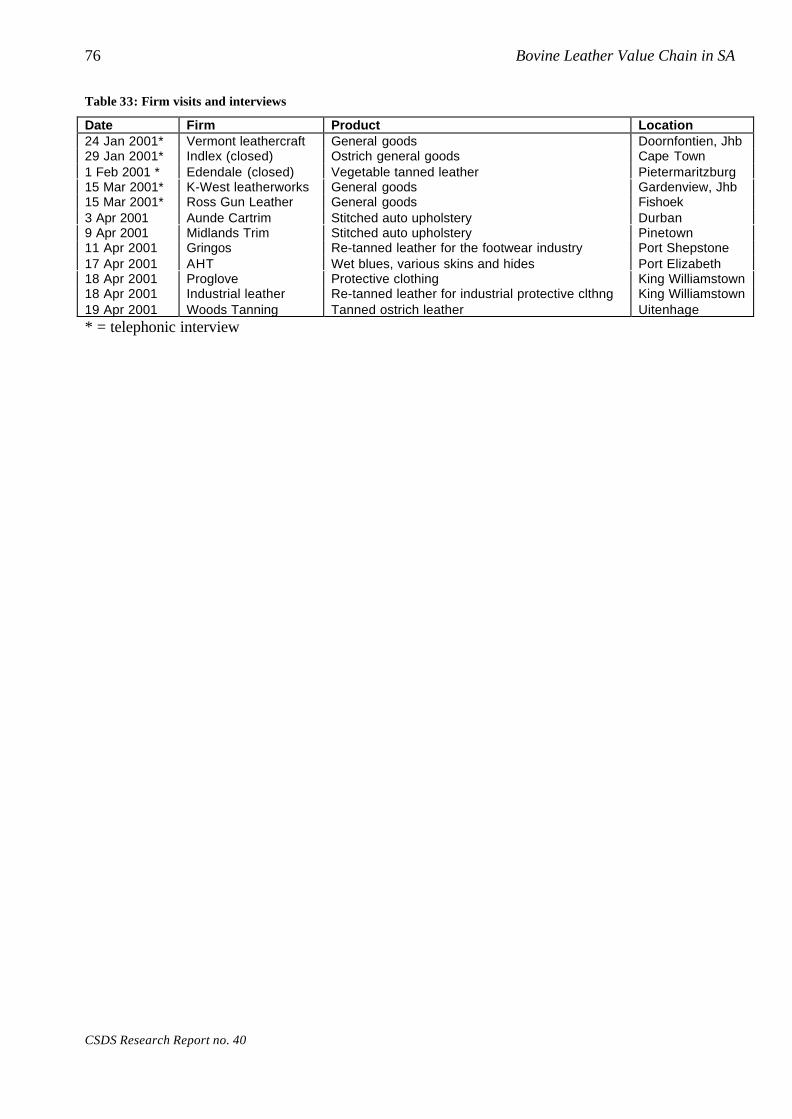
76 Bovine Leather Value Chain in SA
CSDS Research Report no. 40
Table 33: Firm visits and interviews
Date Firm Product Location24 Jan 2001* Vermont leathercraft General goods Doornfontien, Jhb29 Jan 2001* Indlex (closed) Ostrich general goods Cape Town1 Feb 2001 * Edendale (closed) Vegetable tanned leather Pietermaritzburg15 Mar 2001* K-West leatherworks General goods Gardenview, Jhb15 Mar 2001* Ross Gun Leather General goods Fishoek3 Apr 2001 Aunde Cartrim Stitched auto upholstery Durban9 Apr 2001 Midlands Trim Stitched auto upholstery Pinetown11 Apr 2001 Gringos Re-tanned leather for the footwear industry Port Shepstone17 Apr 2001 AHT Wet blues, various skins and hides Port Elizabeth18 Apr 2001 Proglove Protective clothing King Williamstown18 Apr 2001 Industrial leather Re-tanned leather for industrial protective clthng King Williamstown19 Apr 2001 Woods Tanning Tanned ostrich leather Uitenhage* = telephonic interview
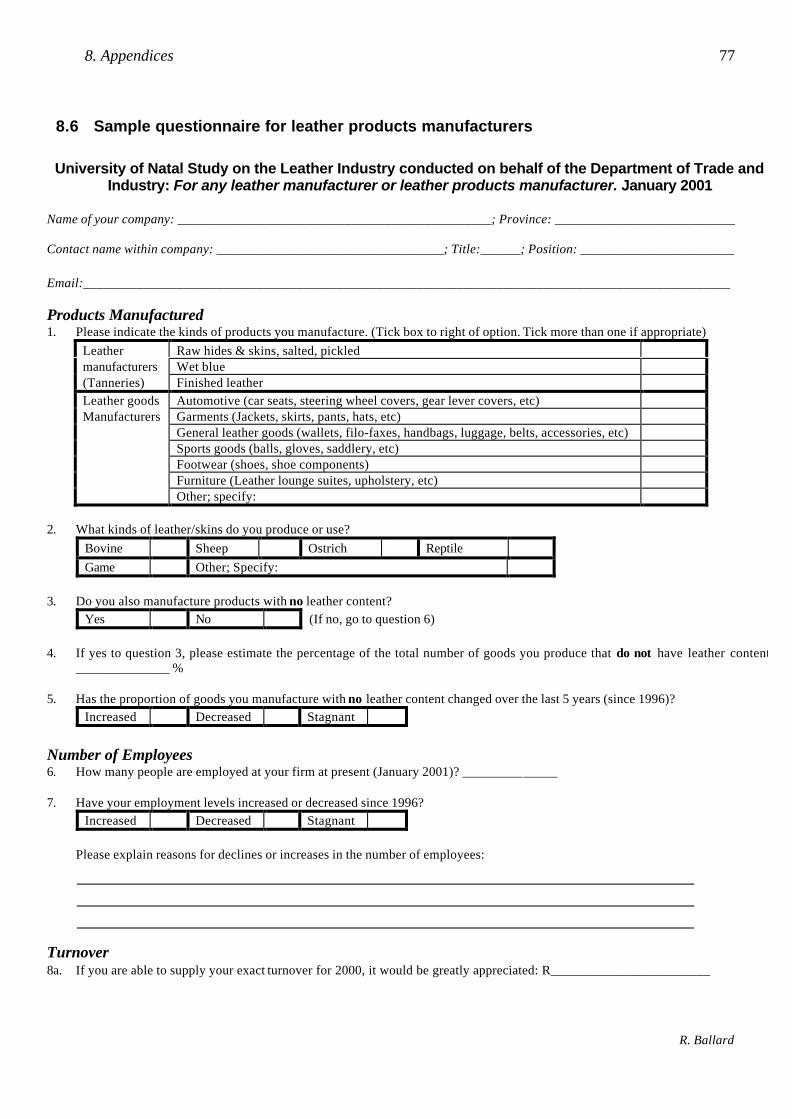
8. Appendices 77
R. Ballard
8.6 Sample questionnaire for leather products manufacturers
University of Natal Study on the Leather Industry conducted on behalf of the Department of Trade andIndustry: For any leather manufacturer or leather products manufacturer. January 2001
Name of your company: _______________________________________________; Province: ___________________________
Contact name within company: __________________________________; Title:______; Position: _______________________
Email:_________________________________________________________________________________________________
Products Manufactured1. Please indicate the kinds of products you manufacture. (Tick box to right of option. Tick more than one if appropriate)
Leather Raw hides & skins, salted, pickledmanufacturers Wet blue(Tanneries) Finished leatherLeather goods Automotive (car seats, steering wheel covers, gear lever covers, etc)Manufacturers Garments (Jackets, skirts, pants, hats, etc)
General leather goods (wallets, filo-faxes, handbags, luggage, belts, accessories, etc)Sports goods (balls, gloves, saddlery, etc)Footwear (shoes, shoe components)Furniture (Leather lounge suites, upholstery, etc)Other; specify:
2. What kinds of leather/skins do you produce or use?Bovine Sheep Ostrich ReptileGame Other; Specify:
3. Do you also manufacture products with no leather content?Yes No (If no, go to question 6)
4. If yes to question 3, please estimate the percentage of the total number of goods you produce that do not have leather content:______________ %
5. Has the proportion of goods you manufacture with no leather content changed over the last 5 years (since 1996)?Increased Decreased Stagnant
Number of Employees6. How many people are employed at your firm at present (January 2001)? ______________
7. Have your employment levels increased or decreased since 1996?Increased Decreased Stagnant
Please explain reasons for declines or increases in the number of employees:
Turnover8a. If you are able to supply your exact turnover for 2000, it would be greatly appreciated: R________________________
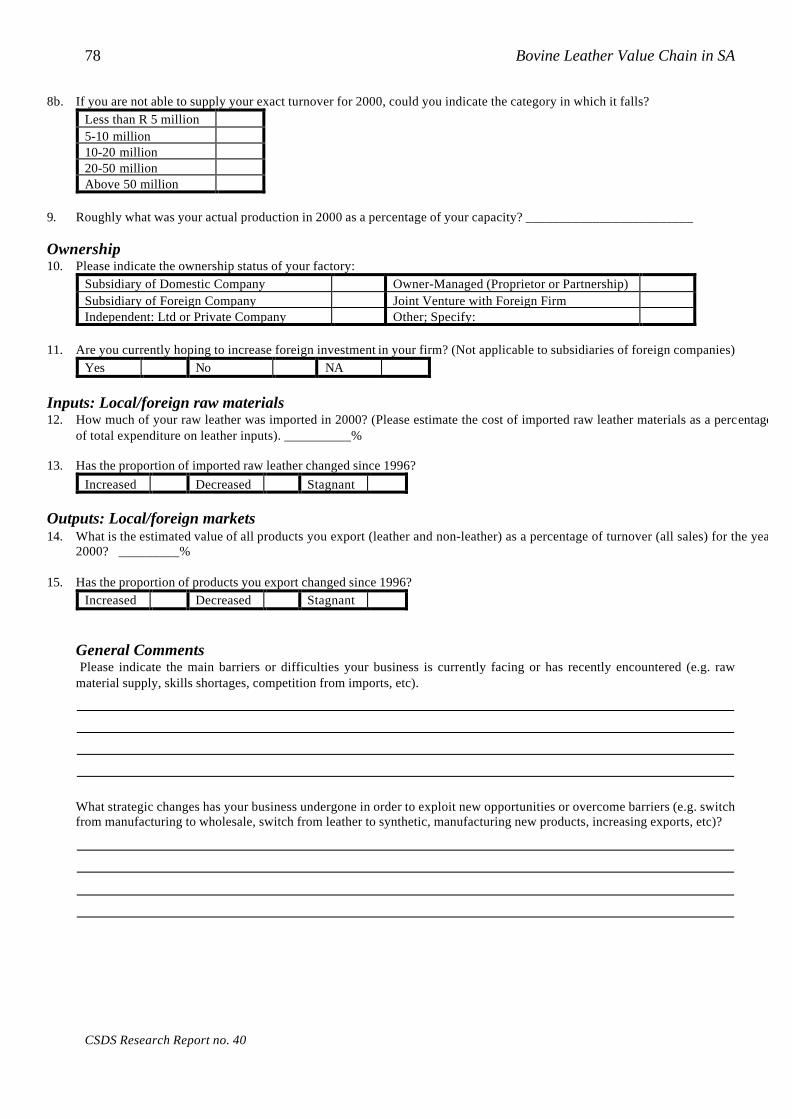
78 Bovine Leather Value Chain in SA
CSDS Research Report no. 40
8b. If you are not able to supply your exact turnover for 2000, could you indicate the category in which it falls?Less than R 5 million5-10 million10-20 million20-50 millionAbove 50 million
9. Roughly what was your actual production in 2000 as a percentage of your capacity? _________________________
Ownership10. Please indicate the ownership status of your factory:
Subsidiary of Domestic Company Owner-Managed (Proprietor or Partnership)Subsidiary of Foreign Company Joint Venture with Foreign FirmIndependent: Ltd or Private Company Other; Specify:
11. Are you currently hoping to increase foreign investment in your firm? (Not applicable to subsidiaries of foreign companies)Yes No NA
Inputs: Local/foreign raw materials12. How much of your raw leather was imported in 2000? (Please estimate the cost of imported raw leather materials as a percentage
of total expenditure on leather inputs). __________%
13. Has the proportion of imported raw leather changed since 1996?Increased Decreased Stagnant
Outputs: Local/foreign markets14. What is the estimated value of all products you export (leather and non-leather) as a percentage of turnover (all sales) for the year
2000? _________%
15. Has the proportion of products you export changed since 1996?Increased Decreased Stagnant
General Comments Please indicate the main barriers or difficulties your business is currently facing or has recently encountered (e.g. rawmaterial supply, skills shortages, competition from imports, etc).
What strategic changes has your business undergone in order to exploit new opportunities or overcome barriers (e.g. switchfrom manufacturing to wholesale, switch from leather to synthetic, manufacturing new products, increasing exports, etc)?

8. Appendices 79
R. Ballard
8.7 Sample questionnaire for tanneries
University of Natal Study on the Leather Industry conducted on behalf of theDepartment of Trade and Industry: Questionnaire for Tanneries. January 2001
Name of your company: _______________________________________________; Province: ___________________________
Contact name within company: __________________________________; Title:______; Position: _______________________
Email:_________________________________________________________________________________________________
Products Manufactured1. What kinds of leather/skins do you produce?
Bovine Sheep Ostrich ReptileGame Other; Specify:
2. Please indicate the kinds of products you manufacture for sale. (Tick more than one if appropriate)Raw hides & skins, salted, pickledWet blueFinished leatherOther, Specify:
3. Does your factory also manufacture leather goods and products?Yes No If no, skip to 5
4. If yes to question 3, please indicate which kinds of products are made in your factory.Automotive (car seats, steering wheel covers, gear lever covers, etc)Garments (Jackets, skirts, pants, hats, etc)General leather goods (wallets, filo-faxes, handbags, luggage, belts, accessories, etc)Sports goods (balls, gloves, saddlery, etc)Footwear (shoes, shoe components)Furniture (Leather lounge suites, upholstery, etc)Other; specify:
Number of Employees5. How many people are employed at your firm at present (January 2001)? ______________
6. Have your employment levels increased or decreased since 1996?Increased Decreased Stagnant
Please explain reasons for declines or increases in the number of employees:
Turnover7a. If you are able to supply your exact turnover for 2000, it would be greatly appreciated: R________________________

80 Bovine Leather Value Chain in SA
CSDS Research Report no. 40
7b. If you are not able to supply your exact turnover for 2000, could you indicate the category in which it falls?Less than R 5 million5-10 million10-20 million20-50 millionAbove 50 million
8. Roughly what was your actual production in 2000 as a percentage of your capacity? _________________________
Ownership9. Please indicate the ownership status of your factory:
Subsidiary of Domestic Company Owner-Managed (Proprietor or Partnership)Subsidiary of Foreign Company Joint Venture with Foreign FirmIndependent: Ltd or Private Company Other; Specify:
10. Are you currently hoping to increase foreign investment in your firm? (Not applicable to subsidiaries of foreign companies)Yes No NA
Inputs: Local/foreign raw materials11. How much of your raw hide was imported in 2000? (Please estimate the cost of imported raw leather materials as a percentage of total
expenditure on hide inputs). __________%
12. Has the proportion of imported raw hides changed since 1996?Increased Decreased Stagnant
Outputs & markets13. What kinds of manufacturers buy your leather?
Automotive (car seats, steering wheel covers, gear lever covers, etc)Garments (Jackets, skirts, pants, hats, etc)General leather goods (wallets, filo-faxes, handbags, luggage, belts, accessories, etc)Sports goods (balls, gloves, saddlery, etc)Footwear (shoes, shoe components)Furniture (Leather lounge suites, upholstery, etc)Other; specify:
14. What is the estimated value of all leather you export as a percentage of turnover (all sales) for the year 2000? _________%
15. Has the proportion of products you export changed since 1996?Increased Decreased Stagnant
General CommentsPlease indicate the main barriers or difficulties your business is currently facing or has recently encountered (e.g. rawmaterial supply, skills shortages, competition from imports, etc).
What strategic changes has your business undergone in order to exploit new opportunities or overcome barriers (e.g. switchto more lucrative products, increasing exports, etc)?